Pigmentation level of human iPSC-derived RPE does not indicate a specific gene expression profile
- Laboratory for Retinal Regeneration, RIKEN Biosystems Dynamics Research (BDR), Japan
- VC Cell Therapy Inc, Japan
- Ritsumeikan University, Japan
- Laboratory for Prediction of Cell Systems Dynamics, RIKEN Center for Biosystems Dynamics Research (BDR), Japan
- Kobe City Eye Hospital, Department of Ophthalmology, Japan
- Knowledge Palette, Inc, Japan
- Vision Care, Inc, Japan
Figures
Figure 1 with 1 supplement

Automated Live imaging and cell Picking System (ALPS) enabled photographing each cell before RNA extraction.
(A) Human-induced pluripotent stem cell-derived RPE cell (iPSC-RPE) in vitro shows a diverse degree of pigmentation among the cells. Scale bar = 20 μm. ( B) Each cell was photographed under a light microscope and picked by ALPS. The intensities of red, green, and blue were measured. As there was no difference among the three intensities, the intensity of blue wavelength was used to represent the color intensity of each cell (see also Figure 1—video 1).
-
Figure 1—source data 1
The cells picked by Automated Live imaging and cell Picking System (ALPS) and subjected to single -cell transcriptome analysis.
- https://cdn.elifesciences.org/articles/92510/elife-92510-fig1-data1-v1.xlsx
Figure 1—video 1
Since the red-, green-, and blue-intensities were linearly correlated among the human-induced pluripotent stem cell-derived RPE cells (iPSC-RPE), the intensity of blue wavelength was used to represent the color intensity of each cell in the following analyses.
Figure 2 with 3 supplements

Single-cell transcriptome analysis of the cells picked with Automated Live imaging and cell Picking System (ALPS).
Two-dimension plotting of the gene expression profile of each cell colored by the cell types (A), clusters defined by gene expression profiles (B) or color intensities (C), and a violin plot quantitatively showing color intensities of the cells in each cluster (D). Human-induced pluripotent stem cell-derived RPE cells (iPSC-RPE) formed a different cluster from Lonza-retinal pigment epithelium (RPE). (B) iPSC-RPE cells were a heterogeneous population consisting of four sub-clusters. (C, D) Either very black or very white cells did not localize to a specific sub-cluster of iPSC-RPE.
Figure 2—figure supplement 1
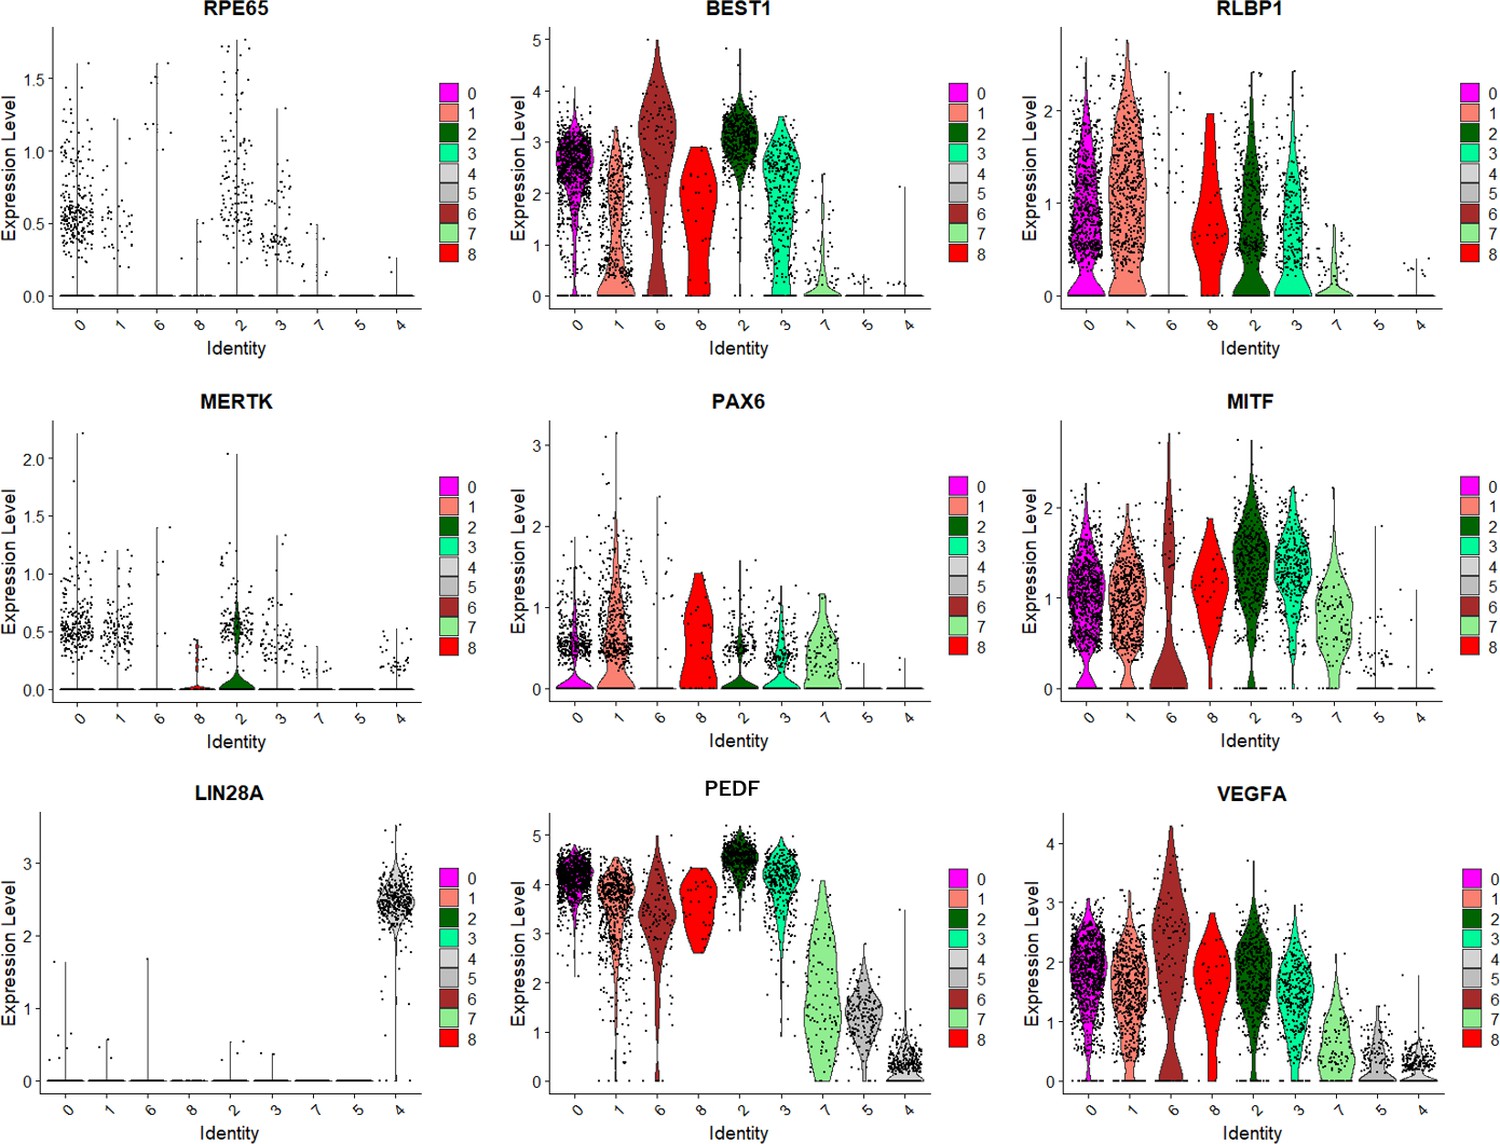
The expression levels of retinal pigment epithelium (RPE-) and iPSC-markers in human-induced pluripotent stem cell-derived RPE cells (iPSC-RPE) are shown by violin plots of each cluster defined in Figure 2B.
Figure 2—figure supplement 2
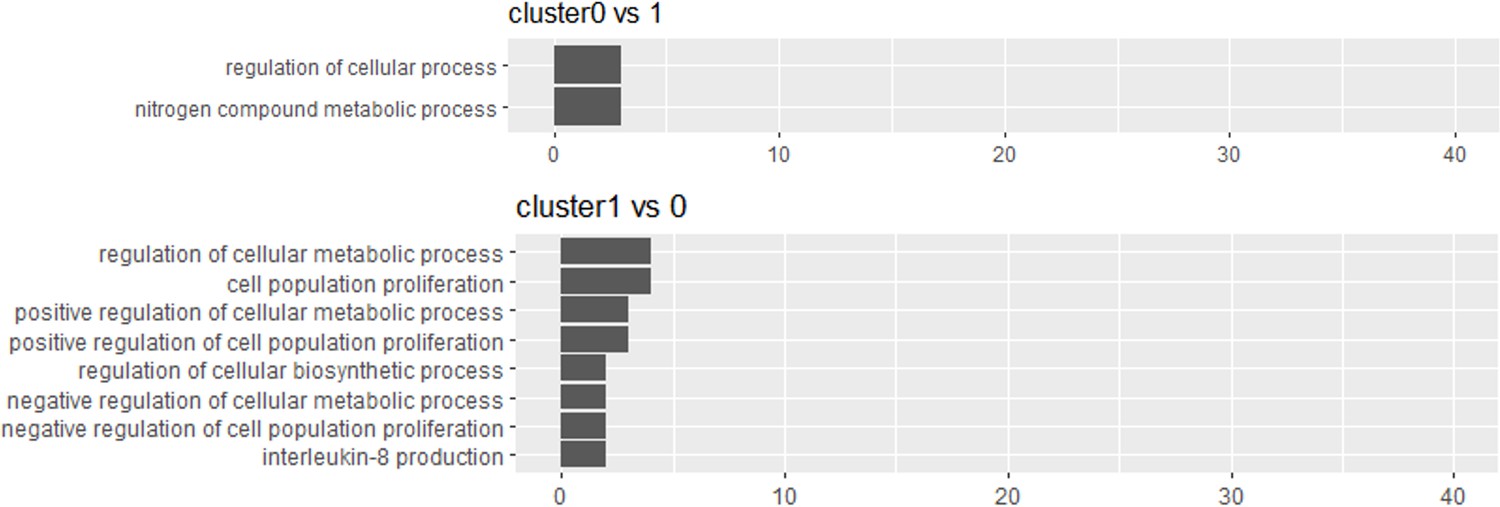
Gene enrichment analysis of the two major clusters of human-induced pluripotent stem cell-derived RPE cell (iPSC-RPE) (cluster 0 and 1) defined in Figure 2B did not elucidate the qualitatively significant difference between the two.
Figure 2—figure supplement 3
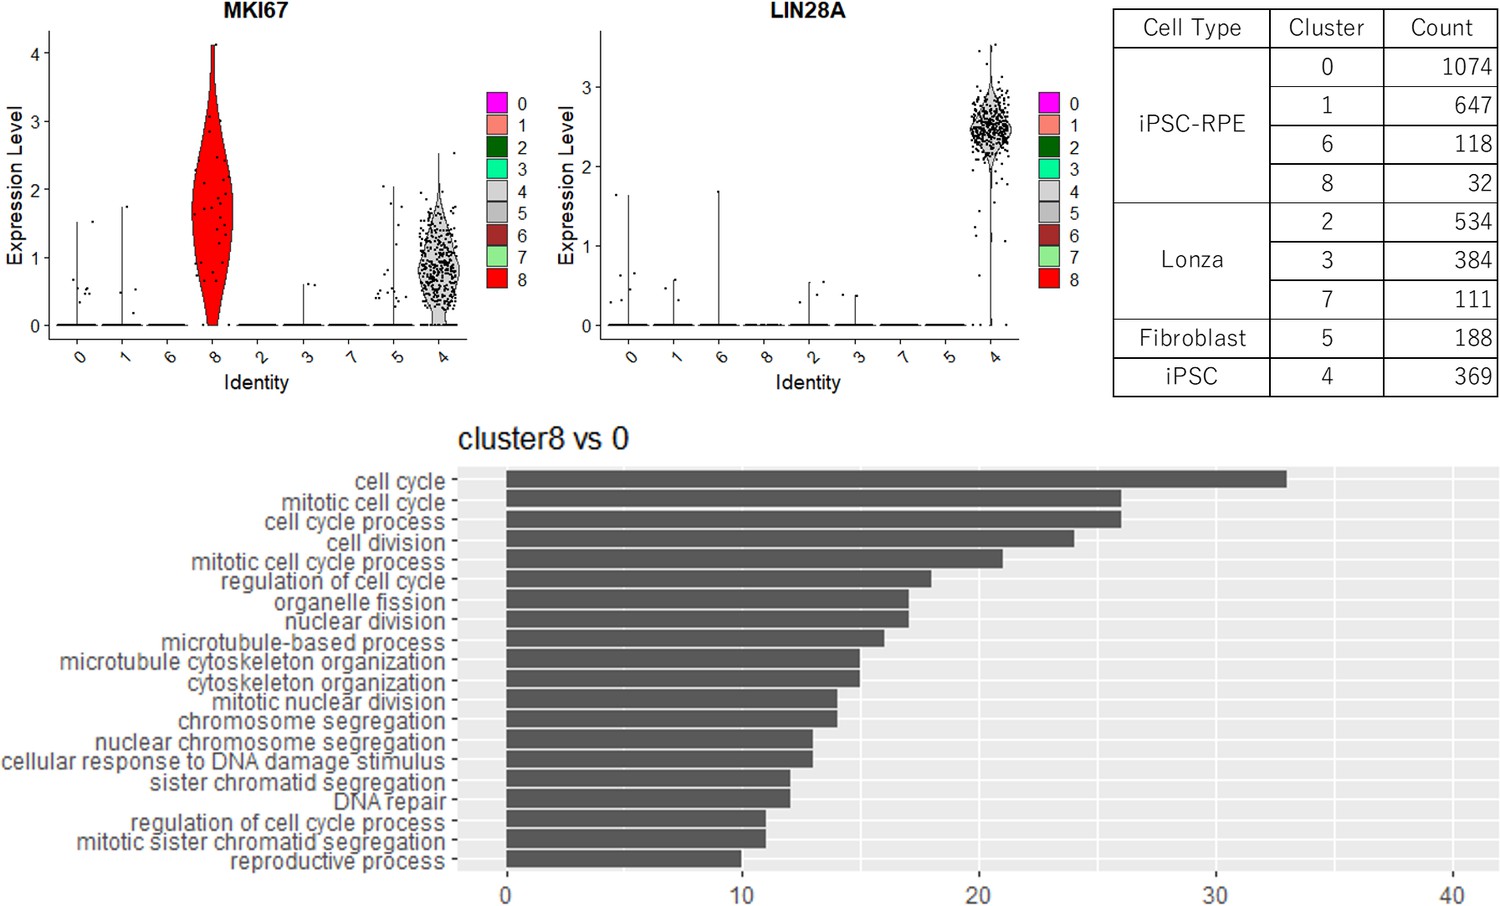
A minor cluster of human-induced pluripotent stem cell-derived RPE cell (iPSC-RPE) defined in Figure 2B, which consisted of 32 cells (upper right), showed a stem cell-like feature with higher expression of proliferation marker MIK67 (upper left) and active cell cycle by gene enrichment analysis (lower panel), but was seemingly not a residual of undifferentiated iPSCs as shown by little expression of pluripotency marker LIN28A (upper middle).
Figure 3 with 1 supplement
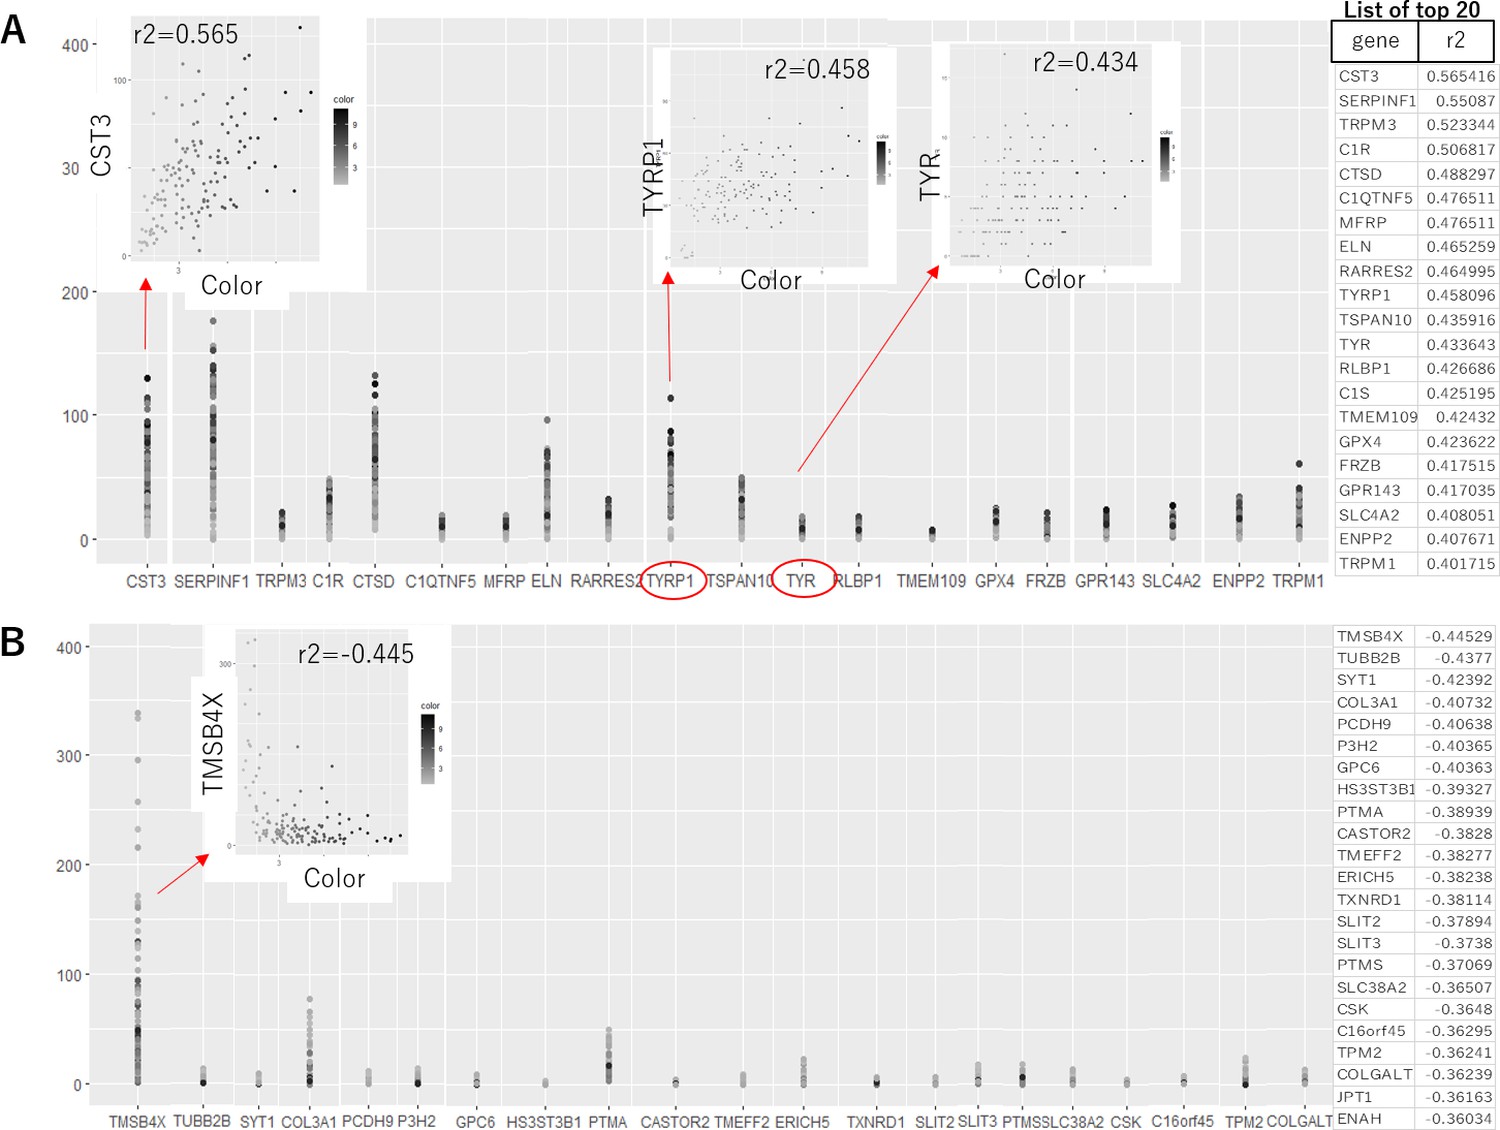
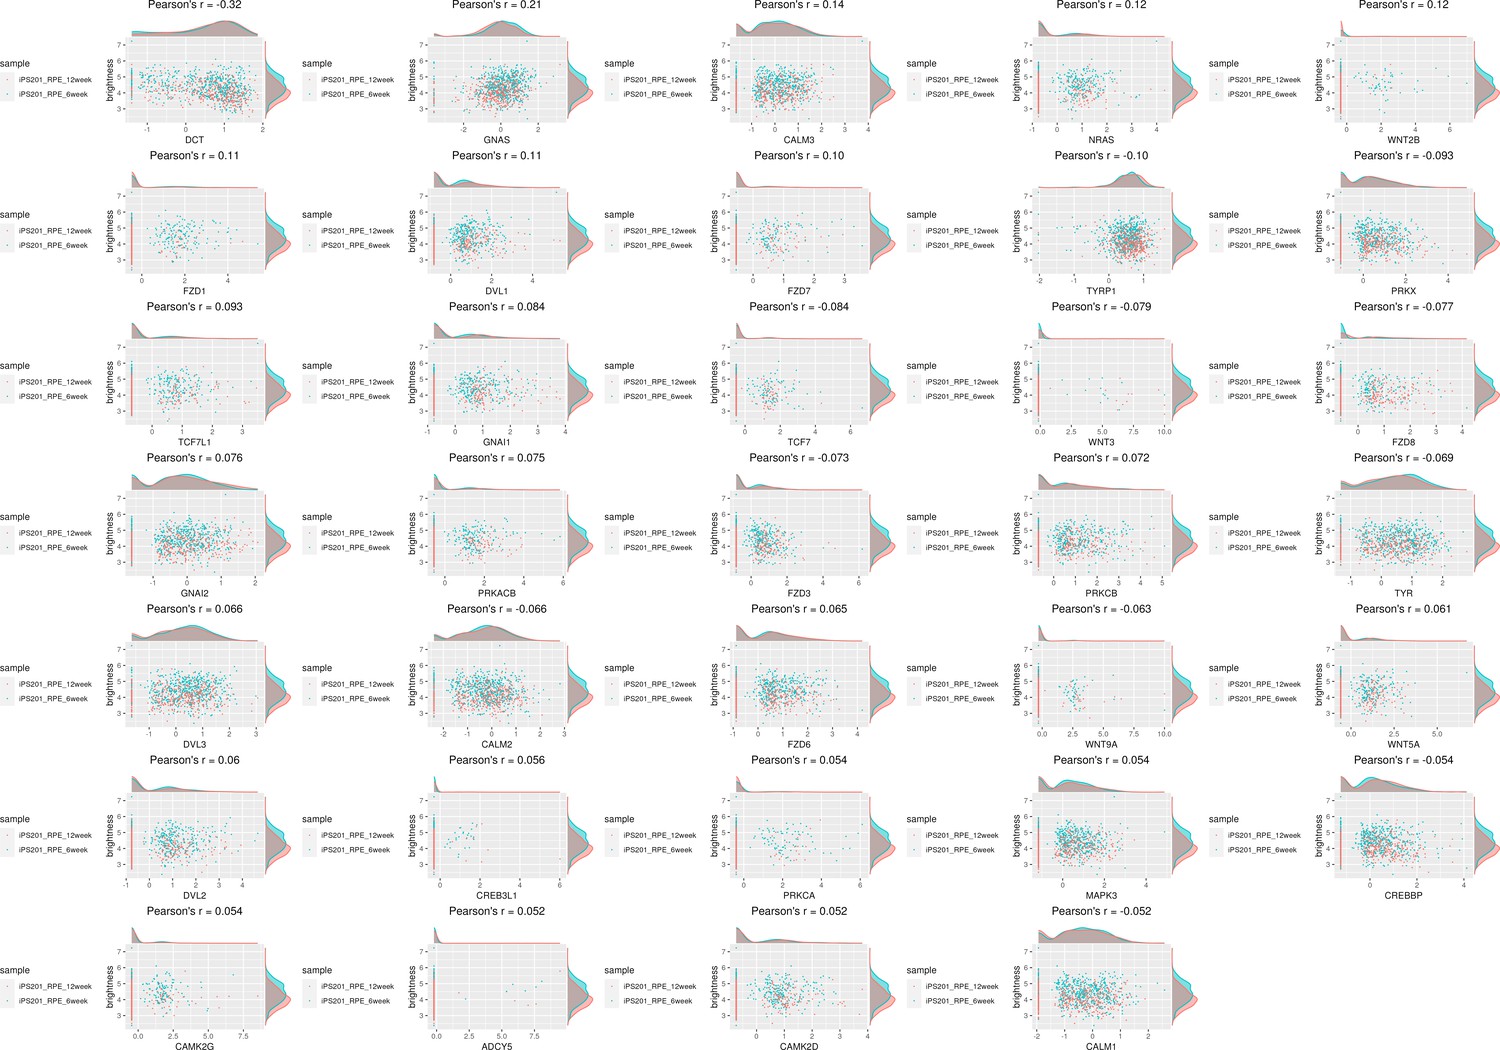
Correlation analysis between the expression level of each gene and the color of the human-induced pluripotent stem cell-derived RPE (iPSC-RPE).
List of the genes with positive (A) and negative (B) correlations to color intensities of iPSC-RPE cells are shown. Even for the gene with the highest correlation to the color, the correlation value was 0.565. Notably, the melanin-synthesis enzymes TYRP1 and tyrosinase (TYR) both showed only weak correlations (correlation value = 0.458 and 0.434, respectively). Program source code to create these plots is available in Figure 3—source code 1.
-
Figure 3—source code 1
Program source code in R to create the plot shown in Figure 3.
- https://cdn.elifesciences.org/articles/92510/elife-92510-fig3-code1-v1.zip
Figure 3—figure supplement 1
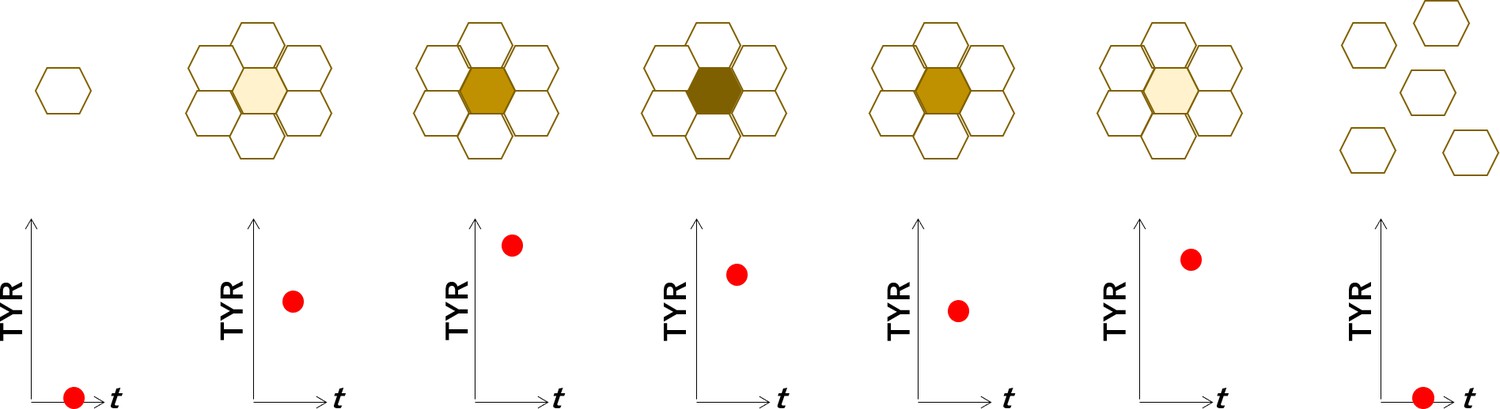
Hypothetical model for the interpretation of weak correlation between the expression of TYR and the degree of pigmentation in human-induced pluripotent stem cell-derived RPE cells (iPSC-RPE).
When cultured in vitro, retinal pigment epitheliums (RPEs) become more pigmented at higher cell density, and return less pigmented when re-plated to lower cell density. The material of the color in RPE is melanin, which is synthesized by the enzymes such as TYRP1 and TYR, although the expressions of TYRP1 and TYR were not strongly correlated with the color of RPE (Figure 3A). The interpretation for this could be. (i) When RPEs contact each other, the nature as protective epithelial cell makes them to synthesize melanin, with upregulation of TYRP1 and TYR. (ii) With a sufficient amount of melanin, TYRP1 and TYP become downregulated. (iii) Melanin will be divided among the daughter cells or secreted, which makes the cells less pigmented. (iv) When the amount of melanin becomes lower, TYRP1 and TYR become upregulated again. This model interprets the colors of iPSC-RPE cells are representing not a stable characteristic but a temporal condition of each cell, which makes it reasonable for the iPSC-RPE cells not having a specific gene expression profile associated with the degree of pigmentation (as shown in Figure 2).
Figure 4 with 4 supplements

Gene set enrichment analysis (GSEA) of human-induced pluripotent stem cell-derived RPE (iPSC-RPE) cells elucidated gene sets correlated with color intensities.
GSEA revealed 15 pathways that had a high correlation with the intensities of the color of iPSC-RPE. Among them, there were lysosome-related and complement-related pathways.
Figure 4—figure supplement 1
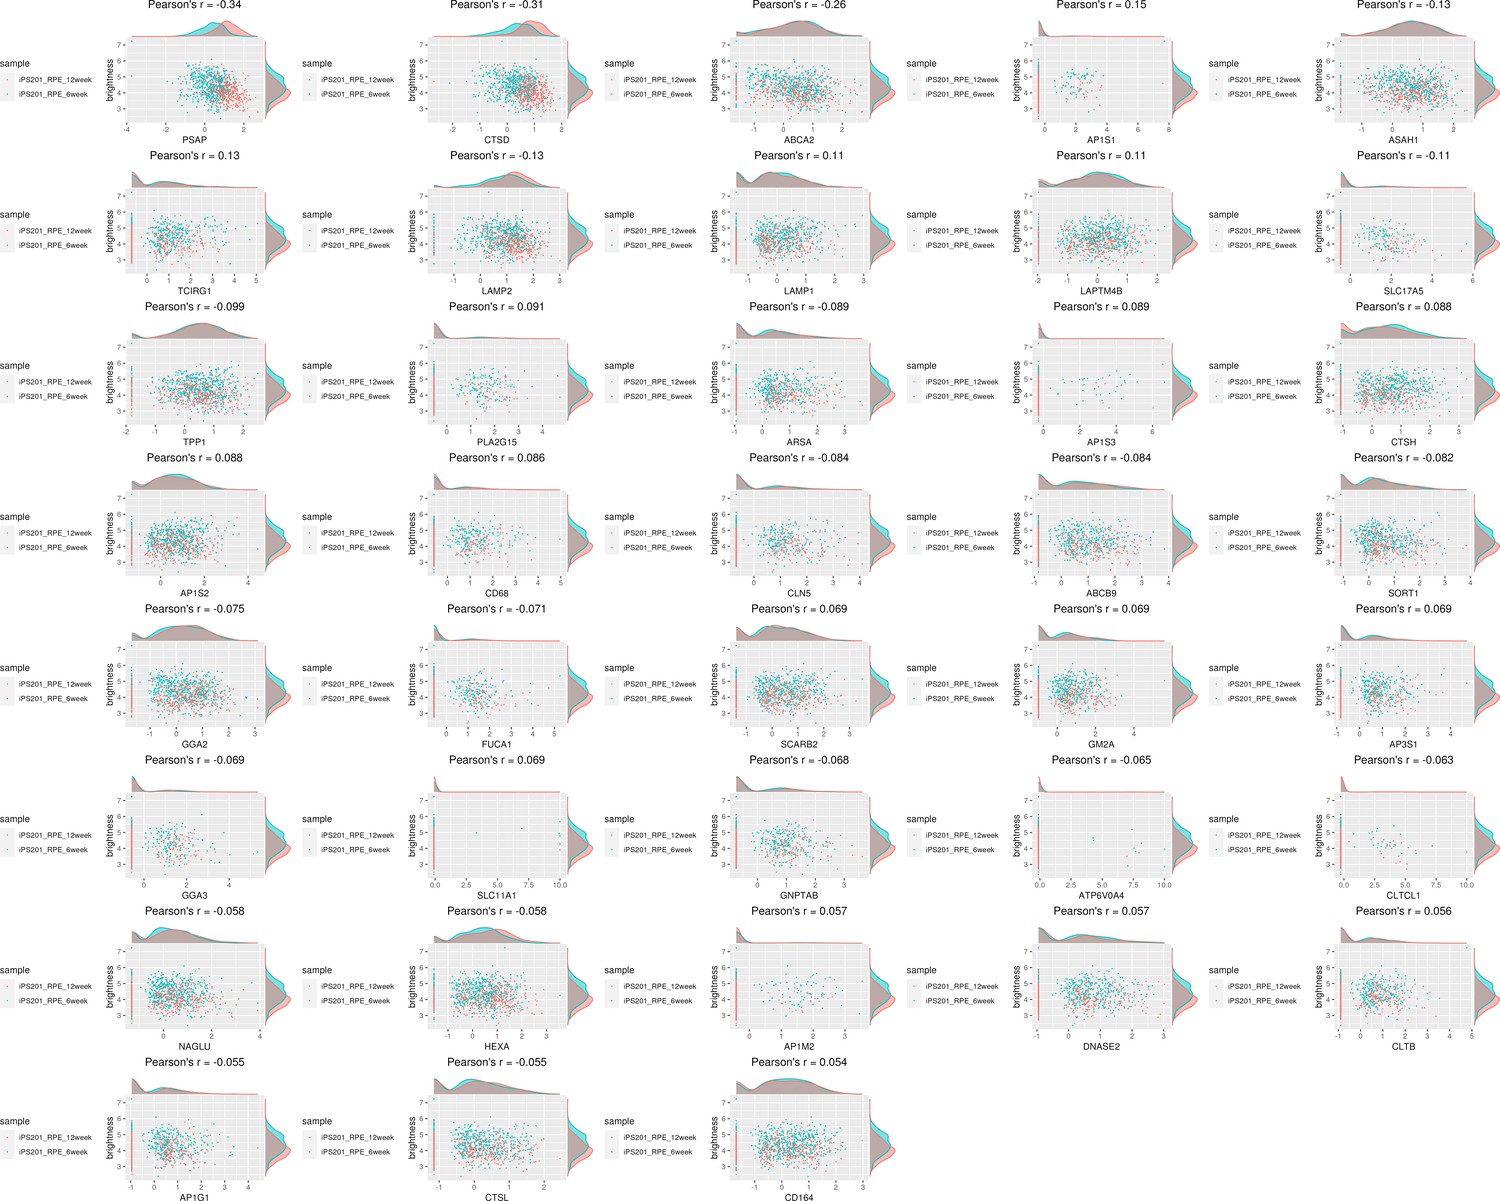
Genes of lysosome-related pathway showed correlation with the color of iPSC-RPE cells.
Figure 4—figure supplement 2
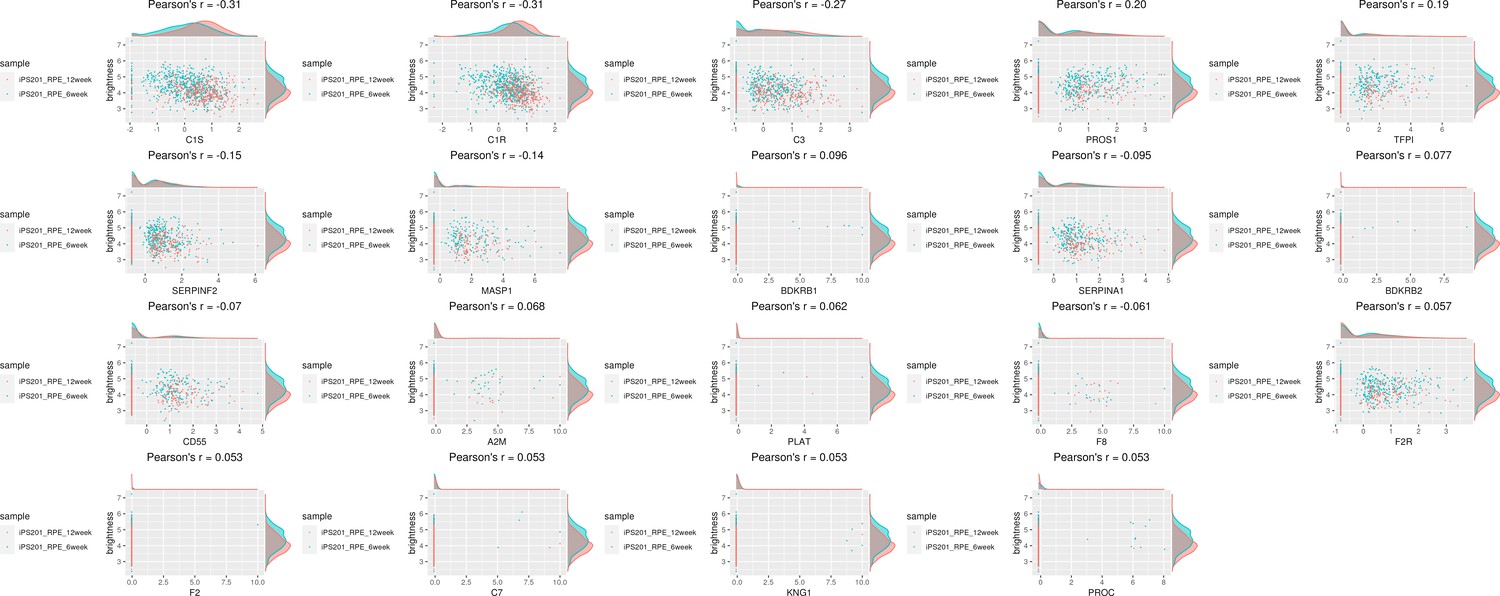
Genes of complement-related pathway showed moderate correlation with the color of human-induced pluripotent stem cell-derived RPE (iPSC-RPE) cells.
Figure 4—figure supplement 3
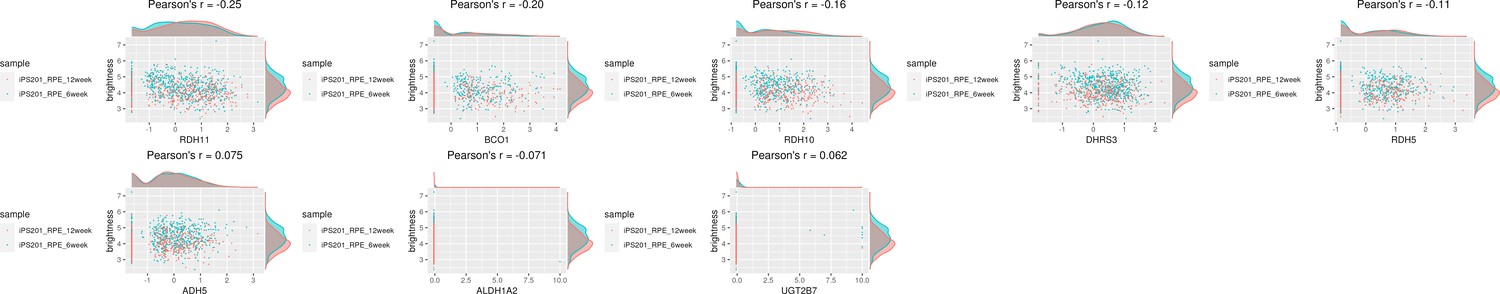
Genes related to retinol metabolism had a weak correlation with the color of human-induced pluripotent stem cell-derived RPE (iPSC-RPE) cells.
Figure 4—figure supplement 4
Genes related to melanogenesis had less correlation with the color of human-induced pluripotent stem cell-derived RPE (iPSC-RPE) cells.
Tables
Key resources table
| Reagent type (species) or resource | Designation | Source or reference | Identifiers | Additional information |
|---|---|---|---|---|
| Cell line (human) | Human iPSC 201B7 (HPS4290) | RIKEN BRC / National BioResource Project of the MEXT/AMED, Japan | doi:10.1038/nbt1374 | |
| Cell line (Homo sapiens) | Human iPSC 253G1 (HPS0002) | RIKEN BRC / National BioResource Project of the MEXT/AMED, Japan | doi:10.1038/nbt1374 | |
| Cell line (Homo sapiens) | Human embryonic RPE (line #476621) | Lonza | Lonza: #476621 | |
| Cell line (Homo sapiens) | Human dermal fibroblasts | doi: 10.1167/iovs.14-15619 | TLHD1 | obtained from a healthy male donor |
| Commercial assay or kit | Bravo NGS workstation | Agilent Technologies | ||
| Software, algorithm | Seurat v4 | doi:10.1038/nbt.3192; doi:10.1038/nbt.4096; doi:10.1016/j.cell.2019.05.031; doi:10.1016/j.cell.2021.04.048 | ||
| Software, algorithm | R v4.2.1 | R Development Core Team, 2022 | ||
| Software, algorithm | weighted sum of the background-corrected intensities | International Telecommunication Union, 2022 | ||
| Software, algorithm | Gene Set Enrichment Analysis; GSEA-preranked | GenePattern.org |
Additional files
Download links
A two-part list of links to download the article, or parts of the article, in various formats.
Downloads (link to download the article as PDF)
Open citations (links to open the citations from this article in various online reference manager services)
Cite this article (links to download the citations from this article in formats compatible with various reference manager tools)
Pigmentation level of human iPSC-derived RPE does not indicate a specific gene expression profile
eLife 12:RP92510.
https://doi.org/10.7554/eLife.92510.3


