The function of juvenile–adult transition axis in female sexual receptivity of Drosophila melanogaster
- Institute of Molecular Physiology, Shenzhen Bay Laboratory, China
- State Key Laboratory of Integrated Management of Pest Insects and Rodents, Institute of Zoology, Chinese Academy of Sciences, China
- National Laboratory of Biomacromolecules, New Cornerstone Science Laboratory, CAS Center for Excellence in Biomacromolecules, Institute of Biophysics, Chinese Academy of Sciences, China
- CAS Key Laboratory of Genome Sciences and Information, Beijing Institute of Genomics, Chinese Academy of Sciences, China
- Department of Plant Protection, Shanxi Agricultural University, China
- Chinese Institute for Brain Research, Peking-Tsinghua Center for Life Sciences, Zhongguancun Life Sciences Park, China
- University of Chinese Academy of Sciences, China
Figures
Figure 1 with 2 supplements
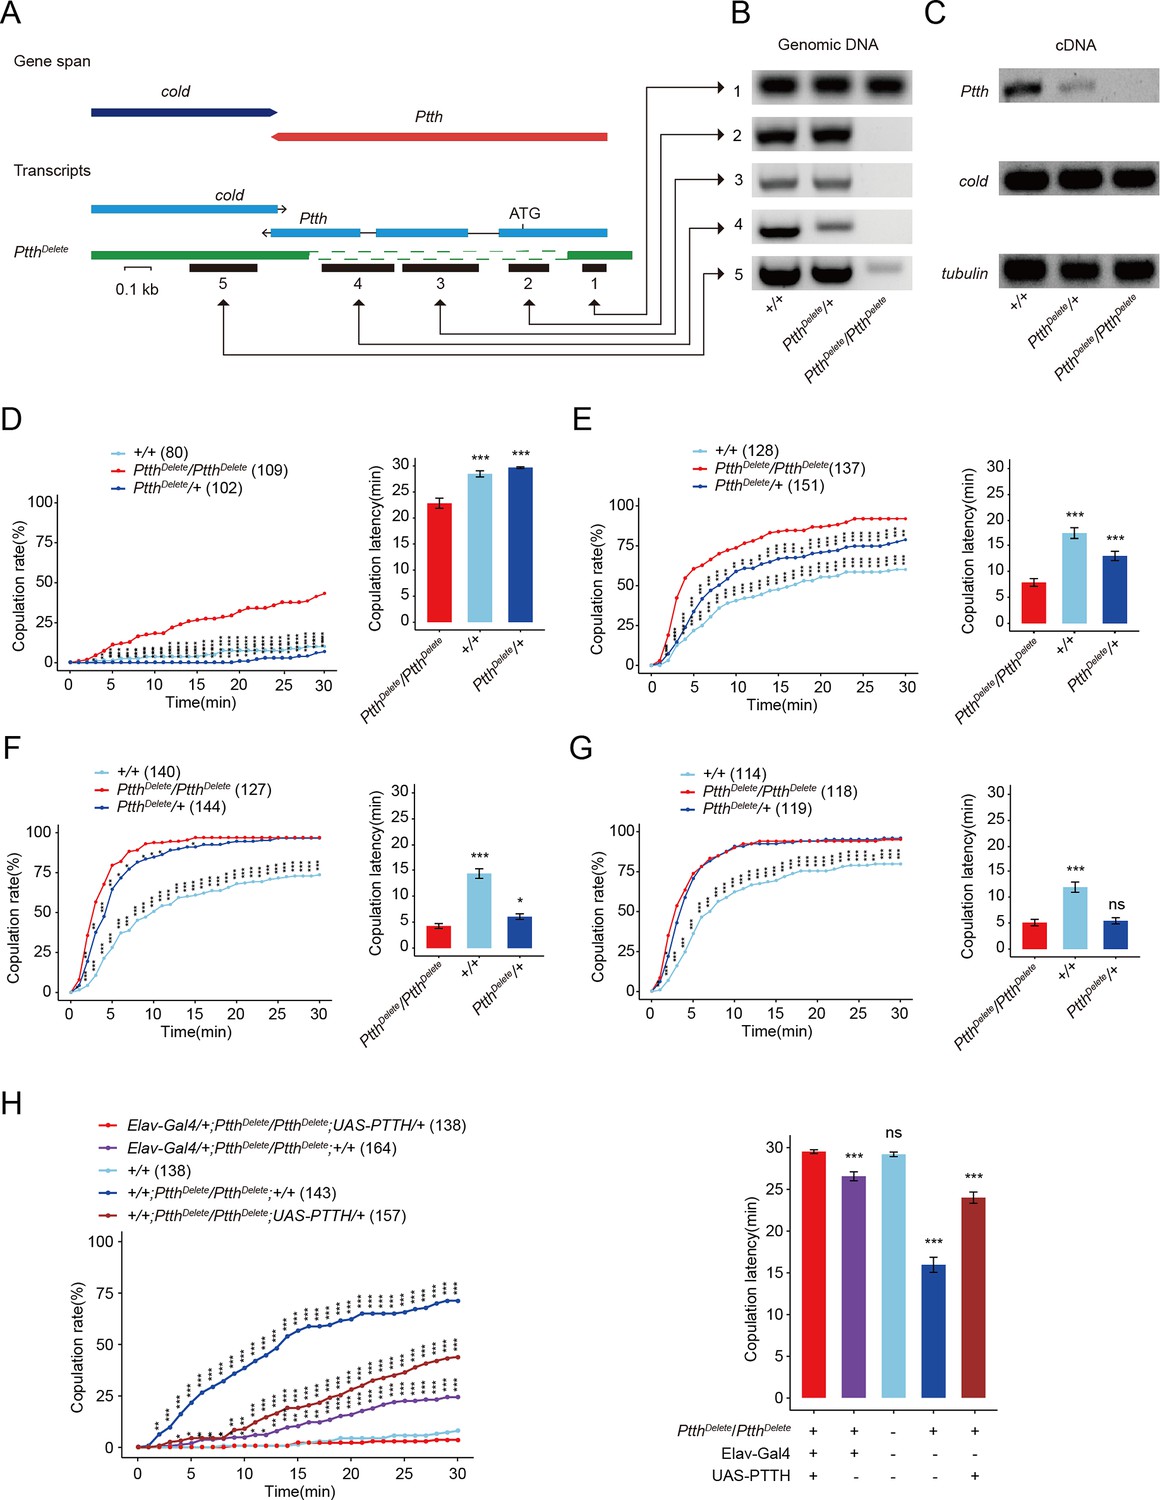
Ptth null mutants have increased virgin female receptivity.
(A–C) Generation and validation of a 974-bp deletion mutant of the Ptth gene. The 5′ UTR and almost all coding sequence were deleted. The deletion was confirmed through PCR analysis at the prothoracicotropic hormone (PTTH) locus in genomic DNA samples (B), and through RT-PCR to identify the loss of PTTH transcripts in cDNA samples of wandering larvae (C). Virgin female receptivity of Ptth null mutants on the first (D), second (E), third (F), and sixth day (G), respectively. The comparison referred to PtthDelete/PtthDelete. (H) Enhanced virgin female receptivity of ΔPtth null mutants was rescued by elav-Gal4 driving UAS-PTTH. The increased copulation rate and decreased latency to copulation on the first day after eclosion were rescued to the comparable level of control. The comparison referred to elav-Gal4/+; PtthDelete/PtthDelete;UAS-PTTH/+. The copulation latency and copulation rate of elav-Gal4/+; PtthDelete/PtthDelete are higher and lower than PtthDelete/PtthDelete;UAS-PTTH/+, respectively. The number of female flies paired with wild-type males is displayed in parentheses. For the copulation rate, chi-square test is applied. For the latency to copulation, Kruskal–Wallis ANOVA (Analysis of Variance) and post hoc Mann–Whitney U tests are applied. Error bars indicate SEM (Mean standard error). *p < 0.05, ***p < 0.001, ns indicates no significant difference.
-
Figure 1—source data 1
Photo of nucleic acid electrophoresis and copulation time.
- https://cdn.elifesciences.org/articles/92545/elife-92545-fig1-data1-v1.xlsx
Figure 1—figure supplement 1
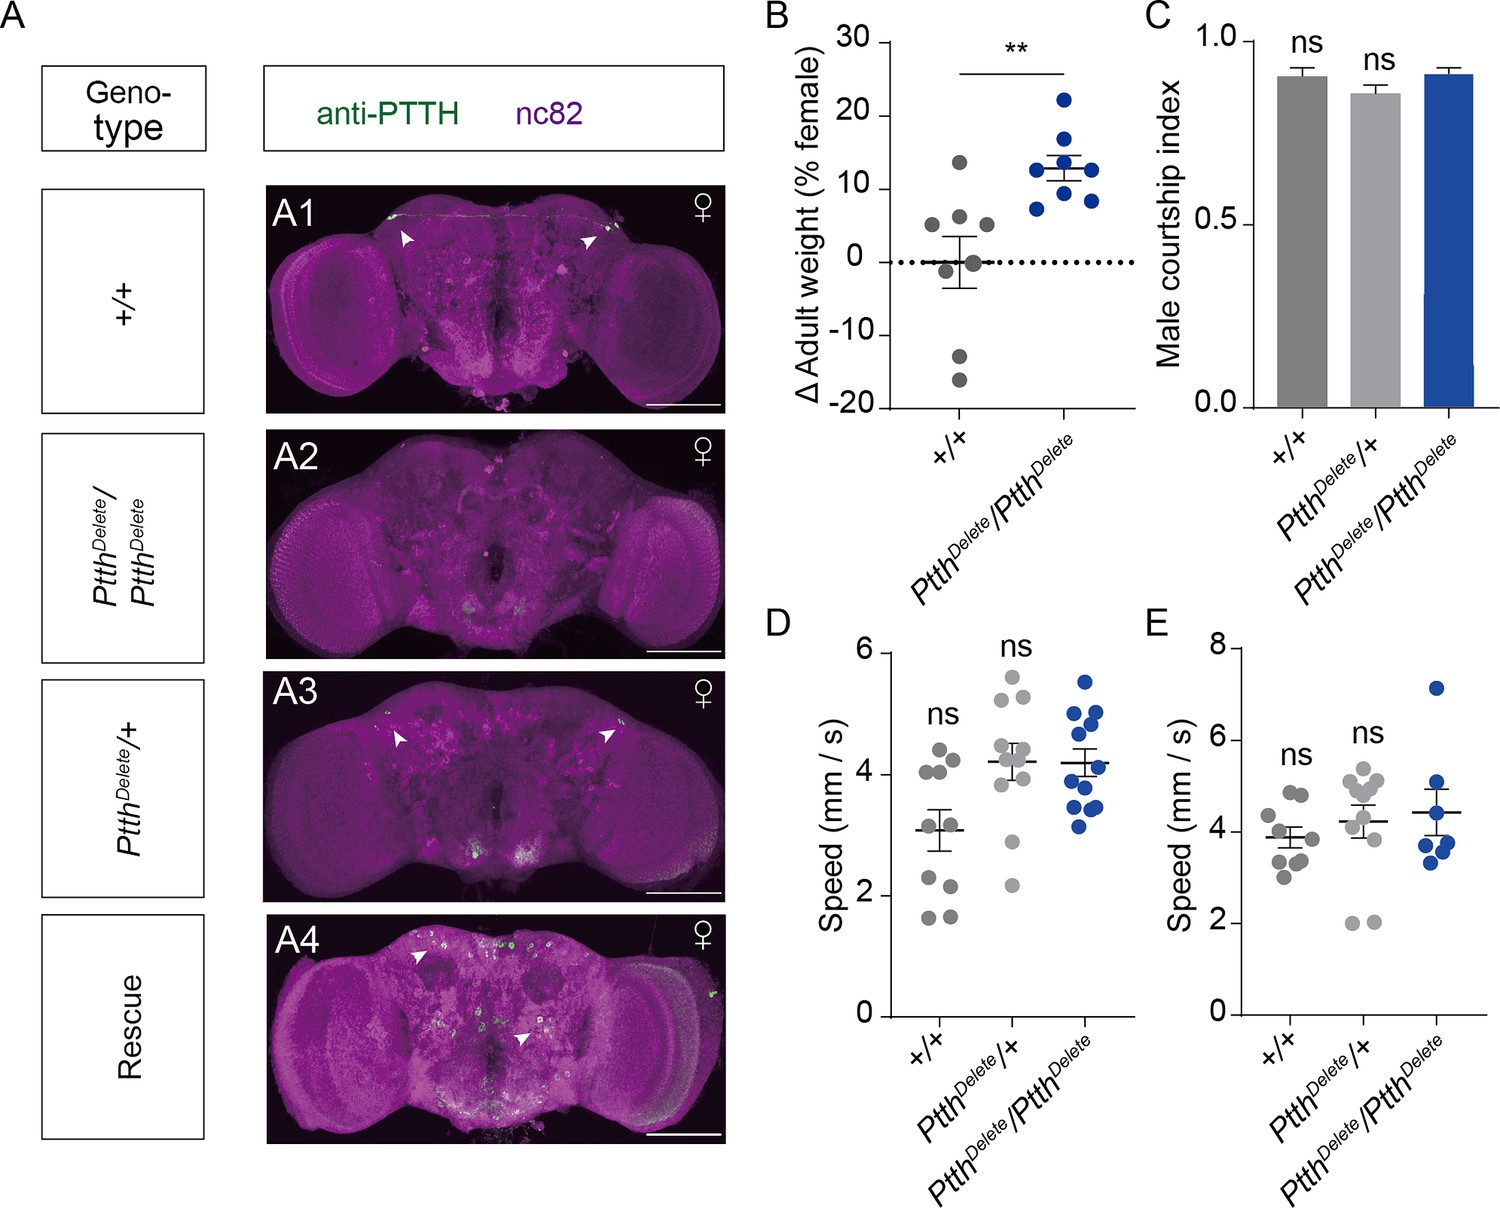
Prothoracicotropic hormone (PTTH) expression, weight, attractiveness, and locomotion behavior of Ptth null mutant virgin females.
(A) Brain of indicated genotype, immunostained with anti-PTTH antibody (green) and counterstained with nc82 (magenta). Arrows show signals (green) stained with anti-PTTH antibody. Female flies were within 10 hr after eclosion. Scale bars, 50 μm. (B) The weights of 24-hr-old adult PtthDelete/PtthDelete null mutant females were significantly higher than that of wild-type females (Mann–Whitney U test, n = 8 groups, 10 flies in each group). (C) Courtship index of wild-type males during the first 5 min of courtship toward a female with the indicated genotype (Kruskal–Wallis ANOVA and post hoc Mann–Whitney U tests, n = 7–9). Mean velocity had no significant change in PtthDelete/PtthDelete null mutant females on the first day (D) and the sixth day (E) compared with control females (Kruskal–Wallis ANOVA and post hoc Mann–Whitney U tests, n = 7–12). The comparison referred to PtthDelete/PtthDelete. Female flies for behavioral assay were 4- to 6-day-old adults. Error bars indicate SEM. **p < 0.01, ns = not significant.
-
Figure 1—figure supplement 1—source data 1
Body weight, courtship index, and walking speed.
- https://cdn.elifesciences.org/articles/92545/elife-92545-fig1-figsupp1-data1-v1.xlsx
Figure 1—figure supplement 2
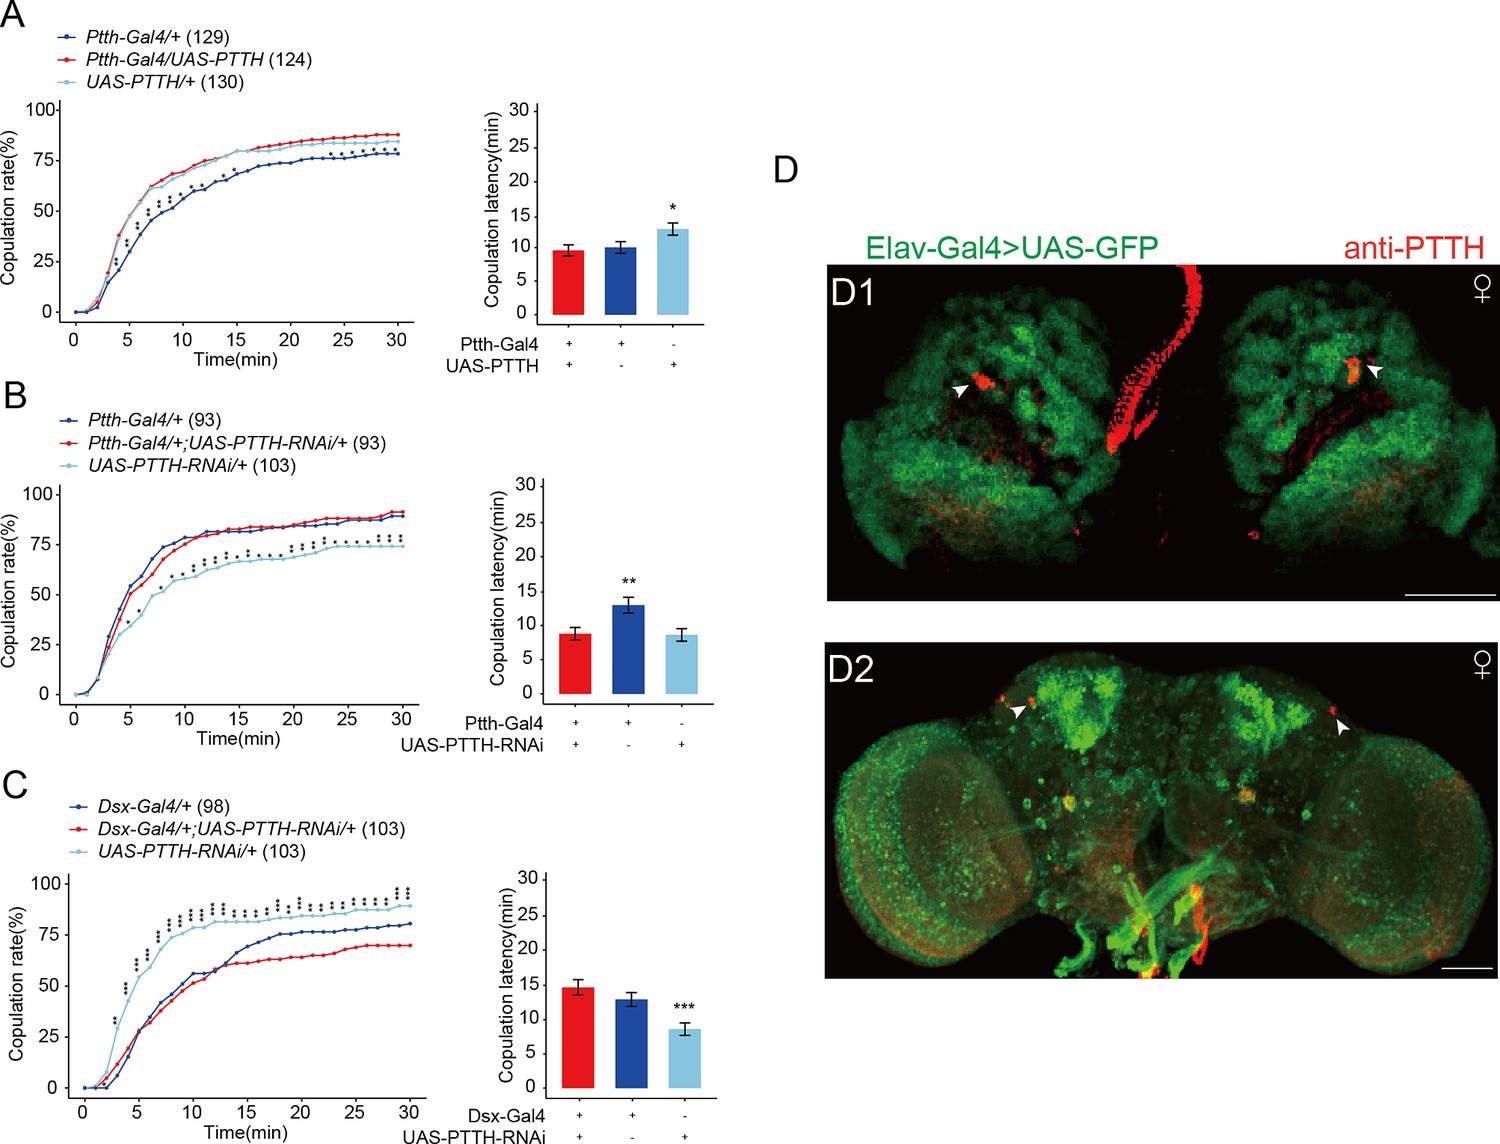
Effect of the expression of prothoracicotropic hormone (PTTH) on female receptivity.
(A) Overexpressing PTTH in PTTH neurons. The comparison referred to flies Ptth-Gal4/+;UAS-PTTH/+. Female flies for behavioral assay were 4- to 6-day-old. (B, C) Decreasing PTTH in PTTH neurons. The comparison referred to flies Ptth-Gal4/+;UAS-PTTH-RNAi/+ and Dsx-Gal4/+;UAS-PTTH-RNAi/+. Female flies for behavioral assay were 2-day-old adults. (D) The fly brain of elav-Gal4>UAS-GFP were stained with PTTH antibody. The larvae flies were the wandering ones. The adult flies were within 10 hr after eclosion. Representative of five female brains. Scale bars, 50 μm. *p < 0.05, **p < 0.01, ***p < 0.001.
-
Figure 1—figure supplement 2—source data 1
Copulation time.
- https://cdn.elifesciences.org/articles/92545/elife-92545-fig1-figsupp2-data1-v1.xlsx
Figure 2 with 3 supplements
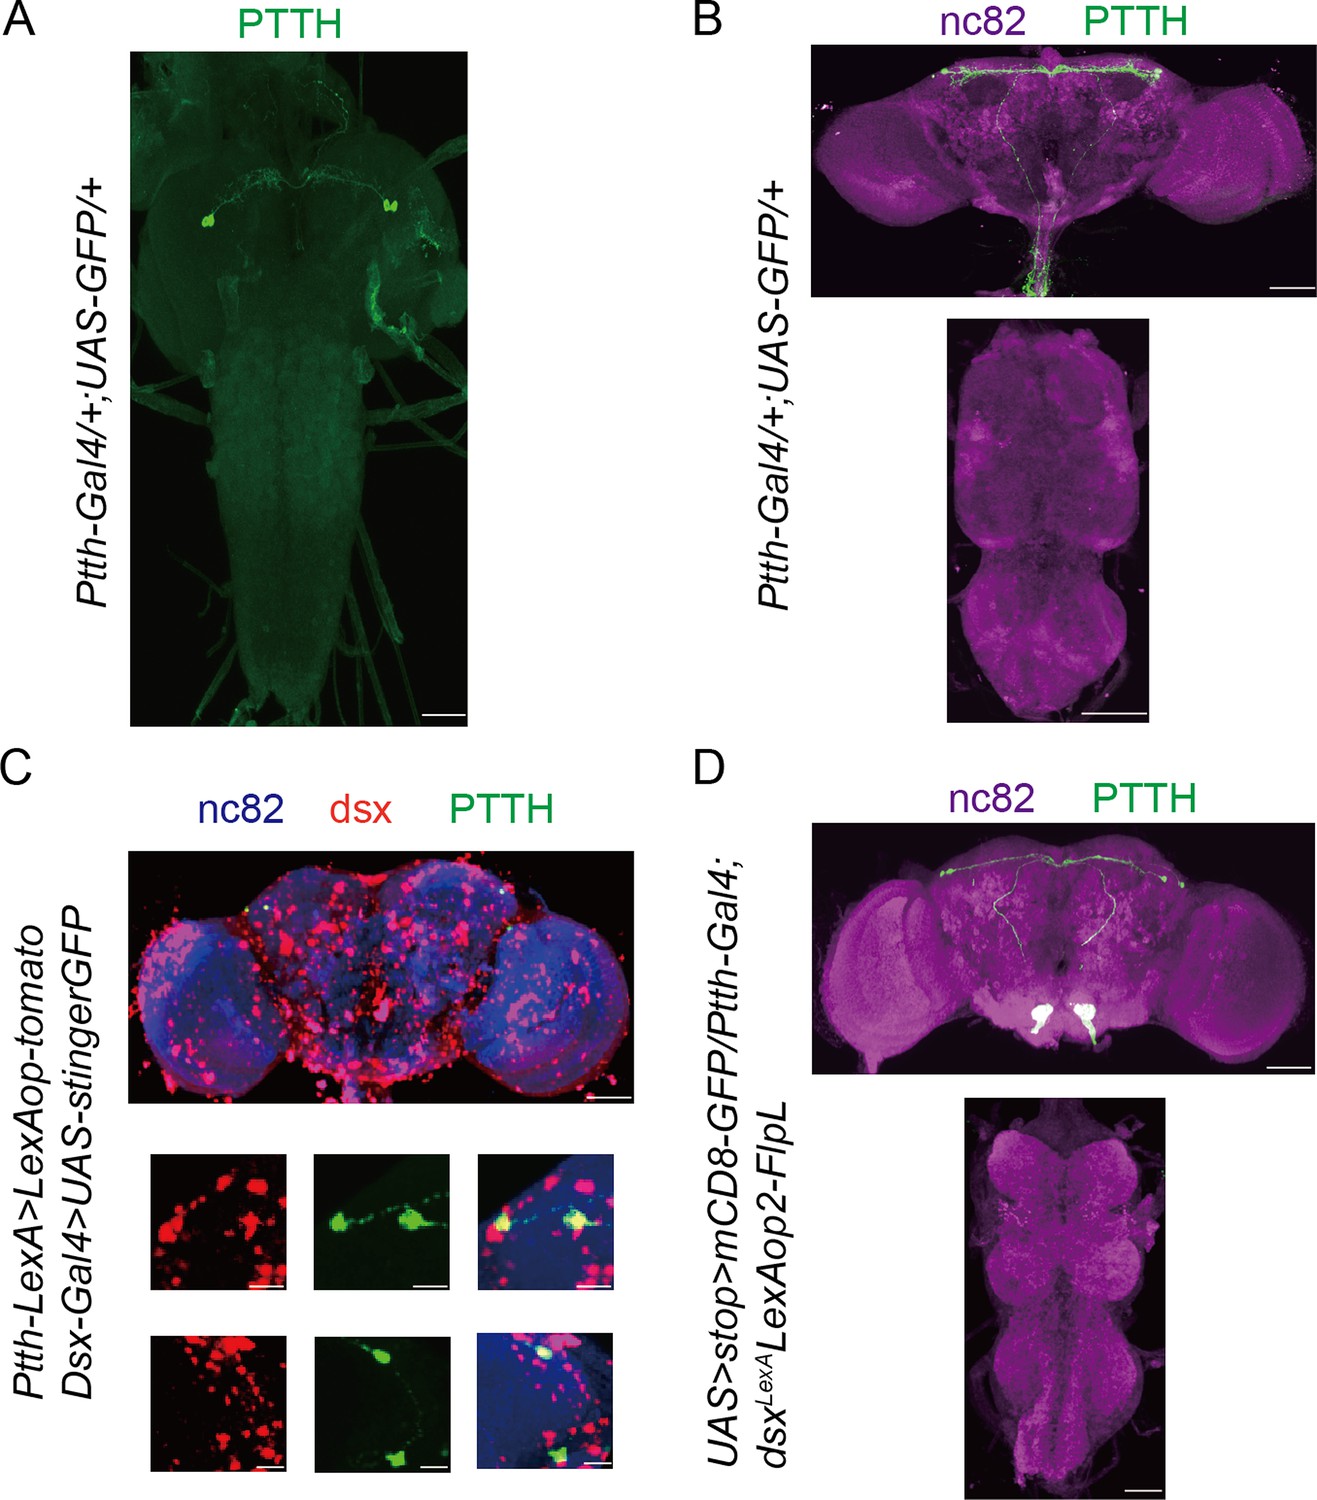
Prothoracicotropic hormone (PTTH) neurons are doublesex-positive neurons.
Expression pattern of Ptth-Gal4 revealed by anti-GFP in larvae central nervous system (CNS) (A) and adult brain (B). Representative of five female flies. Scale bars, 50 μm. (C) All PTTH neurons were colabeled by dsx-Gal4 driving UAS-GFP-Stinger (red) and Ptth-LexA driving LexAop-tomato (green). Representative of five female brains. Scale bars, 50 and 5 μm (zoom-in). (D) All PTTH neurons were Ptth and Dsx co-expressing, labeled by intersectional strategy. The larvae flies were the wandering ones. The adult flies were within 10-hr-old adults. Representative of five female brains. Scale bars, 50 μm.
Figure 2—figure supplement 1
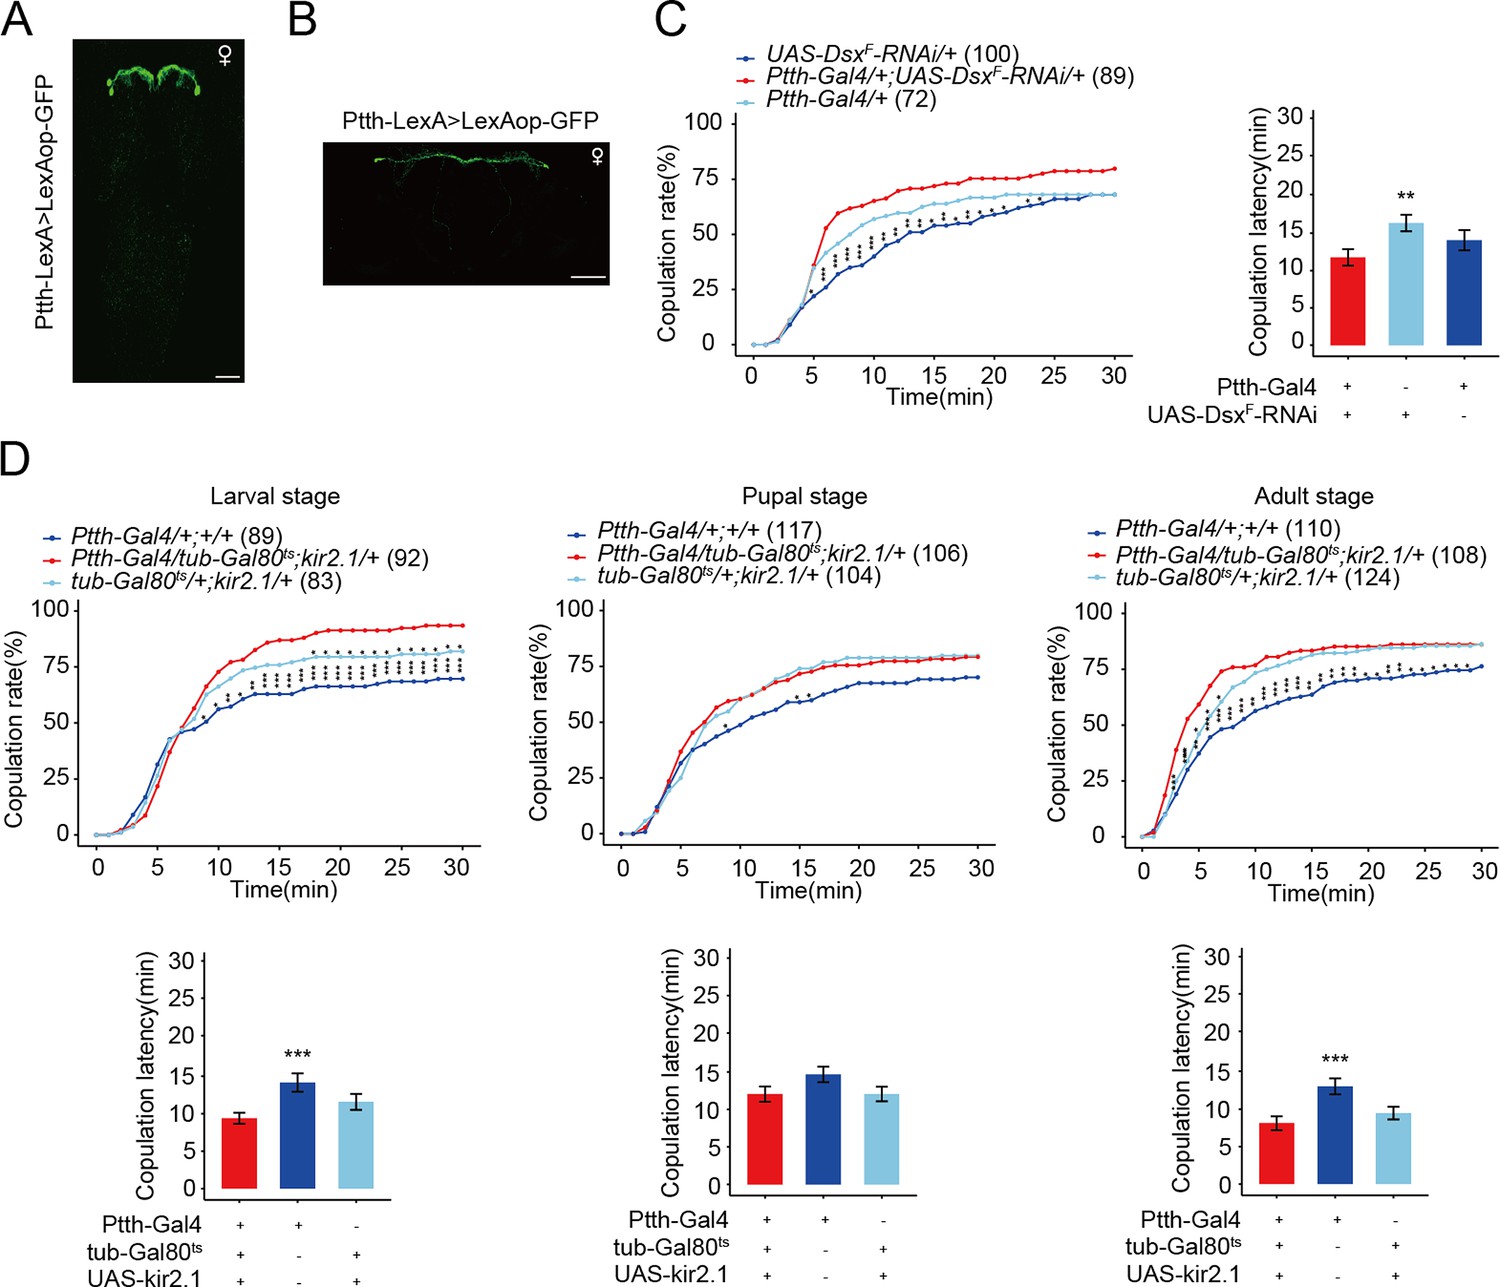
The function of prothoracicotropic hormone (PTTH) neurons in female receptivity.
Expression pattern of Ptth-LexA in the brain revealed by anti-GFP (green) in wandering larvae central nervous system (CNS) (A) and within 10-hr adult brain (B). Representative of five female flies. Scale bars, 50 μm. (C) The female receptivity when deceasing the expression of DsxF in PTTH neurons. The comparison referred to Ptth-Gal4/+;UAS-DsxF-RNAi/+. Female flies were 2-day-old adults. (D) PTTH neurons were inactivated during the whole larval, pupal, and adult stages, respectively, by kir2.1, restricted by shifts from 18°C to 30°C. When the experiment was done at the larval stage is the only situation when the controls were both different from the experimental. The comparison referred to Ptth-Gal4/tub-Gal80ts;kir2.1/+. Female flies were 2-day-old adults. The number of female flies paired with wild-type males is displayed in parentheses. For the copulation rate, chi-square test is applied. Error bars indicate SEM. *p < 0.05, **p < 0.01, ***p < 0.001, ns indicates no significant difference.
-
Figure 2—figure supplement 1—source data 1
Copulation time.
- https://cdn.elifesciences.org/articles/92545/elife-92545-fig2-figsupp1-data1-v1.xlsx
Figure 2—figure supplement 2
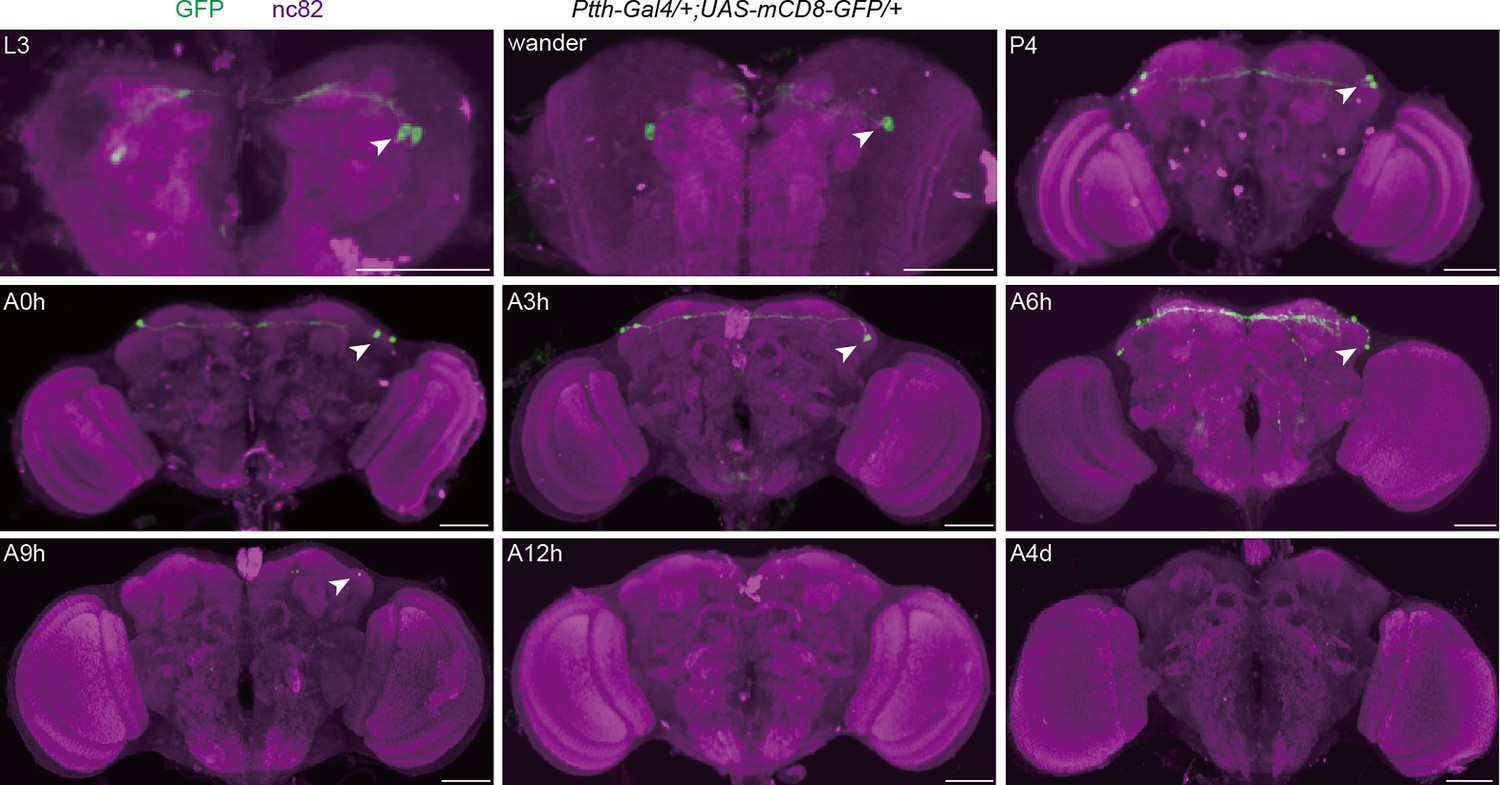
The anatomical pattern of prothoracicotropic hormone (PTTH) neurons expressing PTTH at different developmental stages.
Expression pattern of Ptth-Gal4 in the brain revealed by anti-GFP from the third larval stage to the fourth day after eclosion. Arrows show PTTH signals (green) stained with anti-GFP antibody. L3, the third-instar larvae; wander, the wandering larvae; P4, the fourth day of the pupal stage; A0h, the first hour of the adult stage; A3h, the third hour of the adult stage; A6h, the sixth hour of the adult stage; A9h, the ninth hour of the adult stage; A12h, the 12th hour of the adult stage; A4d, the fourth day of the adult stage. Representative of five female flies. Scale bars, 50 μm.
Figure 2—figure supplement 3
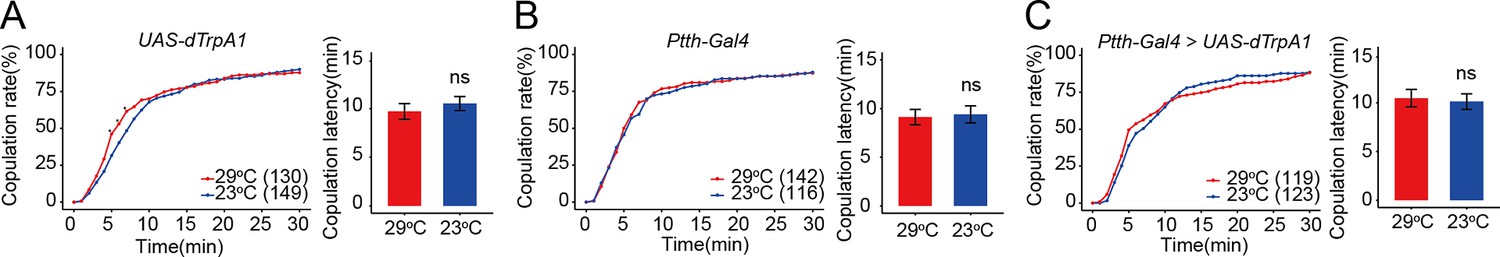
Prothoracicotropic hormone (PTTH) neurons expressing PTTH do not regulate virgin female copulation rate during adult stage.
(A-C) PTTH neurons were activated during adult stage by dTrpA1 at 29°C. The female copulation rate and the latency to copulation did not change significantly. The number of female flies paired with wild-type males is displayed in parentheses. Female flies were 4-day-old adults. For the copulation rate, chi-square test is applied. For the latency to copulation, Mann–Whitney U test is applied. Error bars indicate SEM. *p < 0.05, ns indicates no significant difference.
-
Figure 2—figure supplement 3—source data 1
Copulation time.
- https://cdn.elifesciences.org/articles/92545/elife-92545-fig2-figsupp3-data1-v1.xlsx
Figure 3
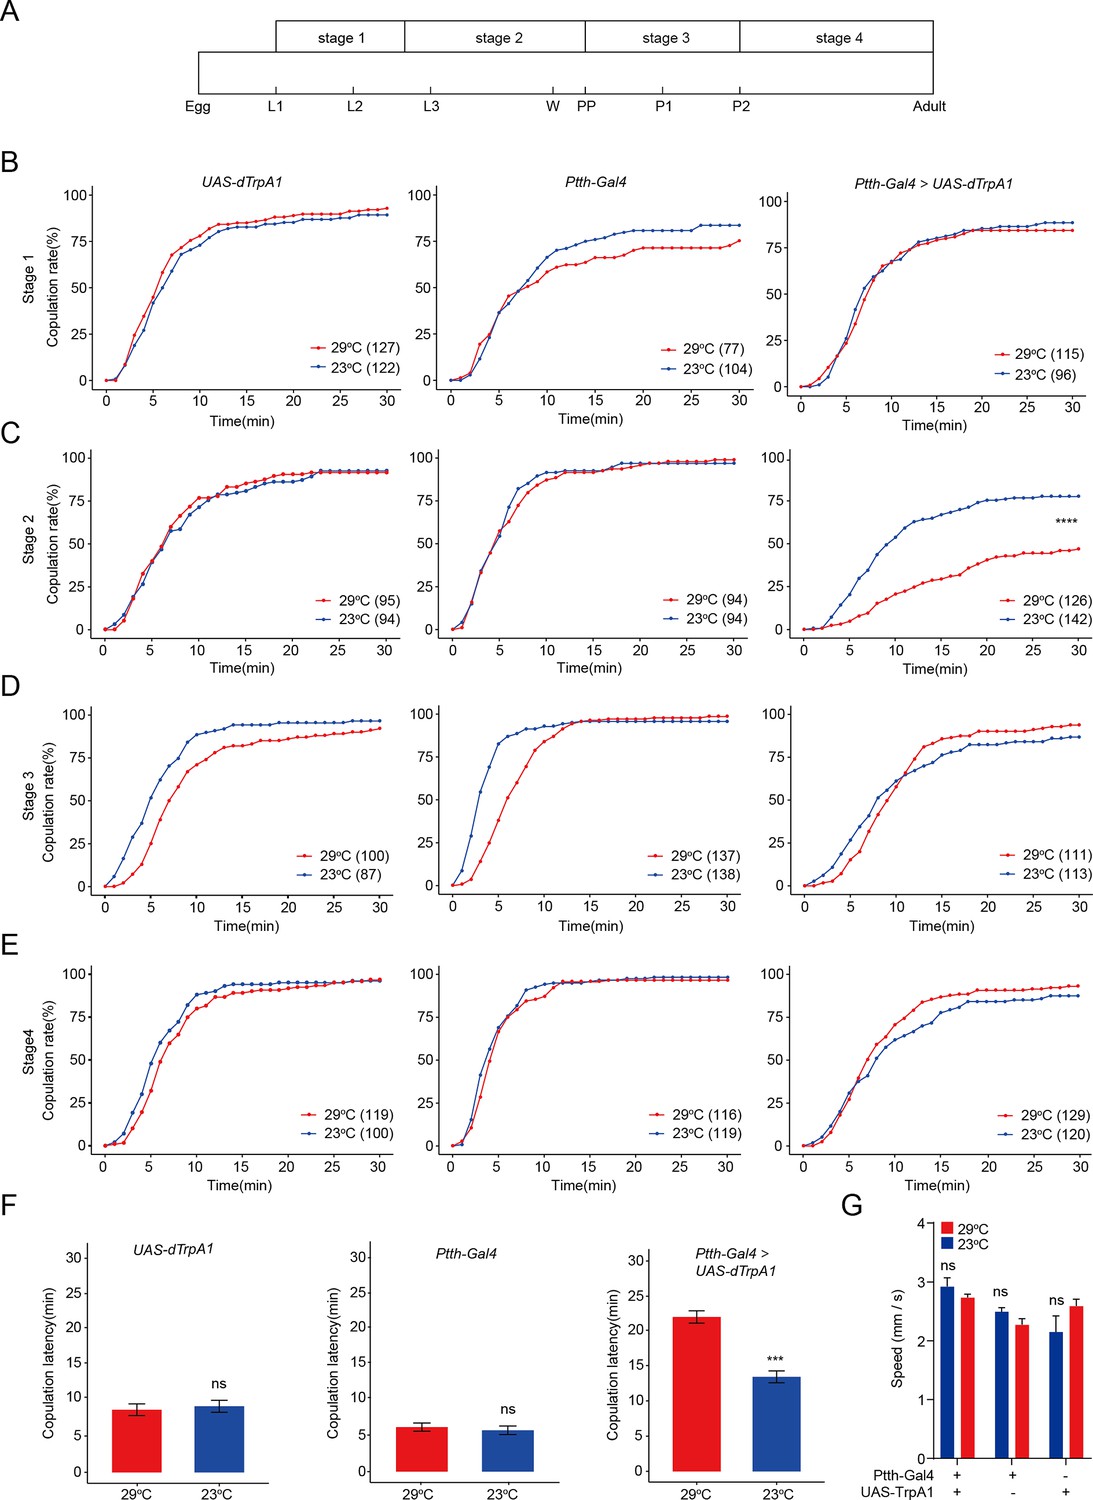
Activation of prothoracicotropic hormone (PTTH) neurons expressing PTTH during the third-instar larvae inhibits virgin female receptivity.
(A) Four developmental stages of Drosophila before eclosion when PTTH neurons were thermogenetic activated by dTrpA1. L1, L2, and L3: start of three larval stages, W: start of wandering stage, Pp: puparium formation, P1 and P2: start of the first and second day of pupal stage. (B–E) Ptth-Gal4 driving UAS-dTrpA1 activated PTTH neurons at 29°C. Activation of PTTH neurons at the stage 2 significantly decreased copulation rate (C), but not at the stage 1 (B), stage 3 (D), and stage 4 (E). (F) Activation of PTTH neurons at the stage 2 significantly increased the latency to copulation. (G) Mean velocity had no significant change when PTTH neurons were activated during the stage 2 compared with control females (ns = not significant, Kruskal–Wallis ANOVA and post hoc Mann–Whitney U tests, mean ± SEM, n = 8–12). The comparison referred to Ptth-Gal4/UAS-dTrpA1. Female flies were 4-day-old adults. The number of female flies paired with wild-type males is displayed in parentheses. For the copulation rate, chi-square test is applied. For the latency to copulation, Mann–Whitney U test is applied. Error bars indicate SEM . ***p < 0.001, ****p < 0.0001, ns indicates no significant difference.
-
Figure 3—source data 1
Copulation time and walking speed.
- https://cdn.elifesciences.org/articles/92545/elife-92545-fig3-data1-v1.xlsx
Figure 4
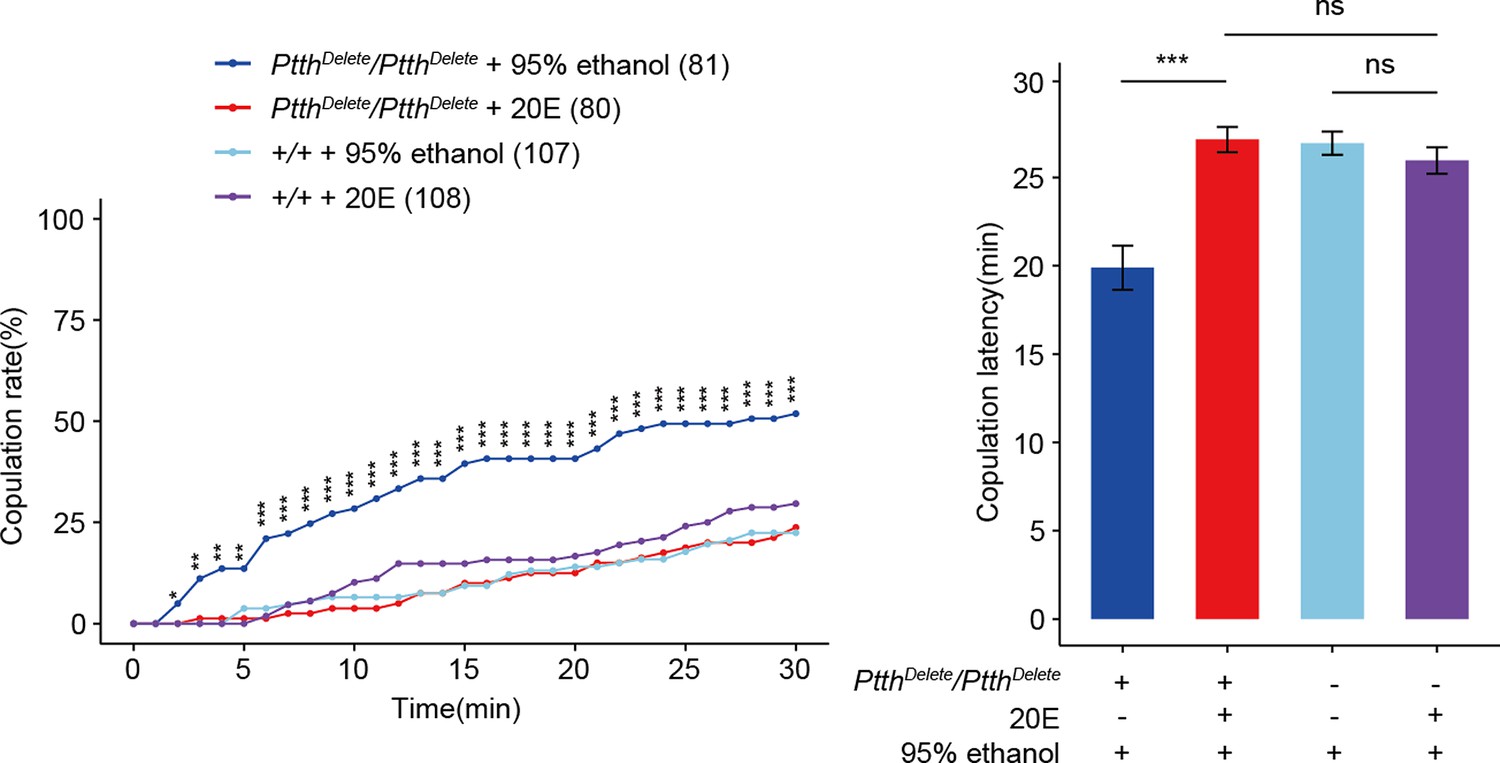
Feeding 20E restores virgin female receptivity of Ptth null mutant flies.
The increased copulation rate and decreased latency to copulation of the 24-hr-old ΔPtth flies were rescued to the comparable level of wild-type females by feeding 20E to the third-instar larval ΔPtth flies. The wild-type larval females fed by 20E had no significantly different copulation rate and latency to copulation compared with the wild-type females fed by the same volume of 95% ethanol which is the solvent of 20E. The comparison referred to PtthDelete/PtthDelete + 20E. Female flies were 1-day-old. The number of female flies paired with wild-type males is displayed in parentheses. For the copulation rate, chi-square test is applied. For the latency to copulation, Kruskal–Wallis ANOVA and post hoc Mann–Whitney U tests are applied. Error bars indicate SEM. *p < 0.05, **p < 0.01, ***p < 0.001, ns indicates no significant difference.
-
Figure 4—source data 1
Copulation time.
- https://cdn.elifesciences.org/articles/92545/elife-92545-fig4-data1-v1.xlsx
Figure 5 with 4 supplements
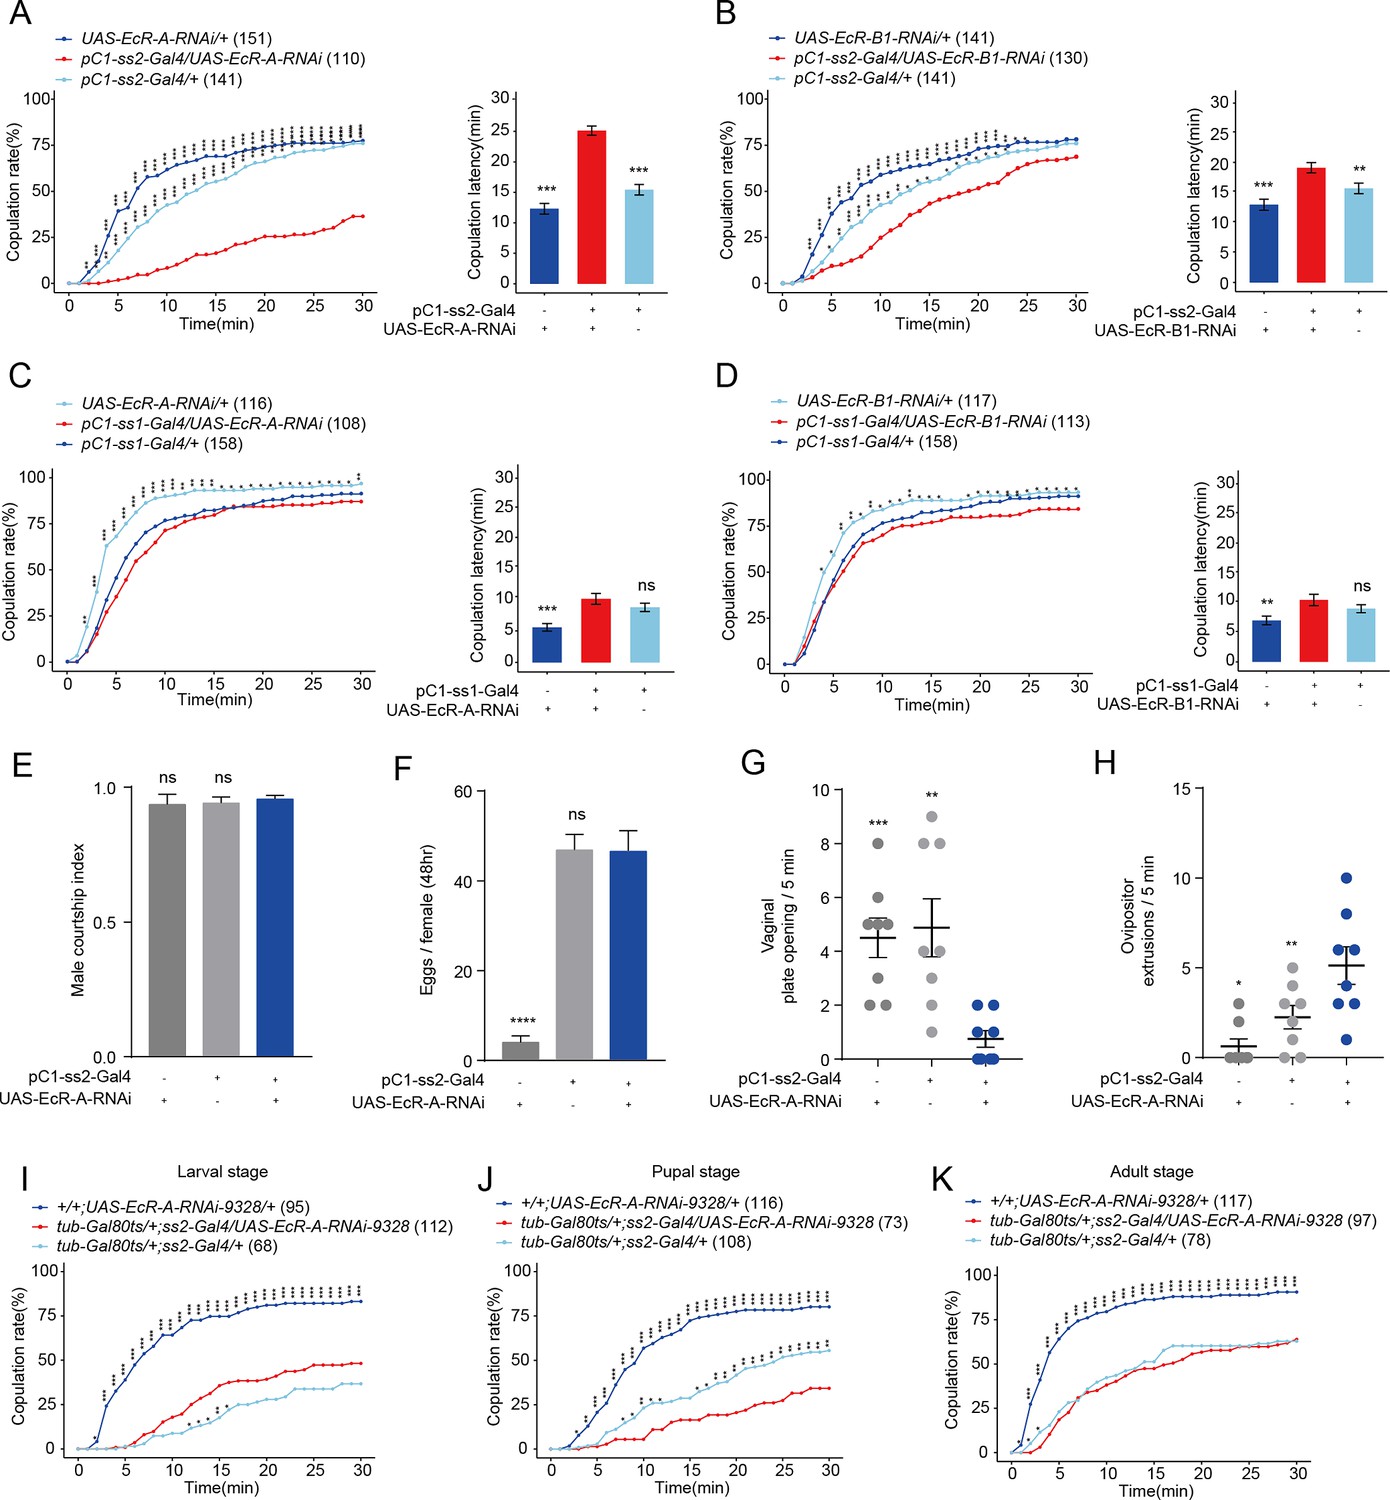
Virgin females with reduced EcR-A in pC1 neurons have reduced sexual receptivity.
(A) Knock-down of EcR-A in pC1 neurons driven by pC1-ss2-Gal4 significantly decreased the copulation rate and increased the latency to copulation. (B) Knock-down of EcR-B1 in pC1 neurons driven by pC1-ss2-Gal4 significantly prolonged the latency to copulation. Knock-down of EcR-A (C) or EcR-B1 (D) in pC1 neurons driven by pC1-ss1-Gal4 did not affect the copulation rate or the latency to copulation. (E) Courtship index of wild-type males toward a female with the indicated genotype (n = 8). (F) The number of eggs laid by virgin females during the third to fourth day after eclosion when EcR-A was knocked down in pC1 neurons (n = 17–36). The UAS-EcR-A-RNAi control causes a massive decrease in female fertility. (G) Knock-down of EcR-A in pC1 neurons decreased the opening of vaginal plate of virgin females compared with controls (n = 8). (H) Knock-down of EcR-A in pC1 neurons increased the ovipositor extrusion of virgin females compared with controls (n = 8). (I–K) Virgin female copulation rate when EcR-A was knocked down in pC1 neurons temporally restricted by shifts from 18°C to 30°C. EcR-A was knocked down during the whole larval (I), pupal (J), and adult (K) stages, respectively. When the experiment was done at the pupal stage is the only situation when the controls were both different from the experimental (J). The comparison referred to flies with decreased EcR isoform in pC1 neurons. Female flies for behavioral assay were 4- to 6-day-old adults. The number of female flies paired with wild-type males is displayed in parentheses. For the copulation rate, chi-square test is applied. For other comparisons, Kruskal–Wallis ANOVA and post hoc Mann–Whitney U tests are applied. Error bars indicate SEM. *p < 0.05, **p < 0.01, ***p < 0.001, ****p < 0.0001, ns indicates no significant difference.
-
Figure 5—source data 1
Copulation time, courtship index, number of eggs, number of vaginal plate opening (VPO), and number of ovipositor extrusion (OE).
- https://cdn.elifesciences.org/articles/92545/elife-92545-fig5-data1-v1.xlsx
Figure 5—figure supplement 1
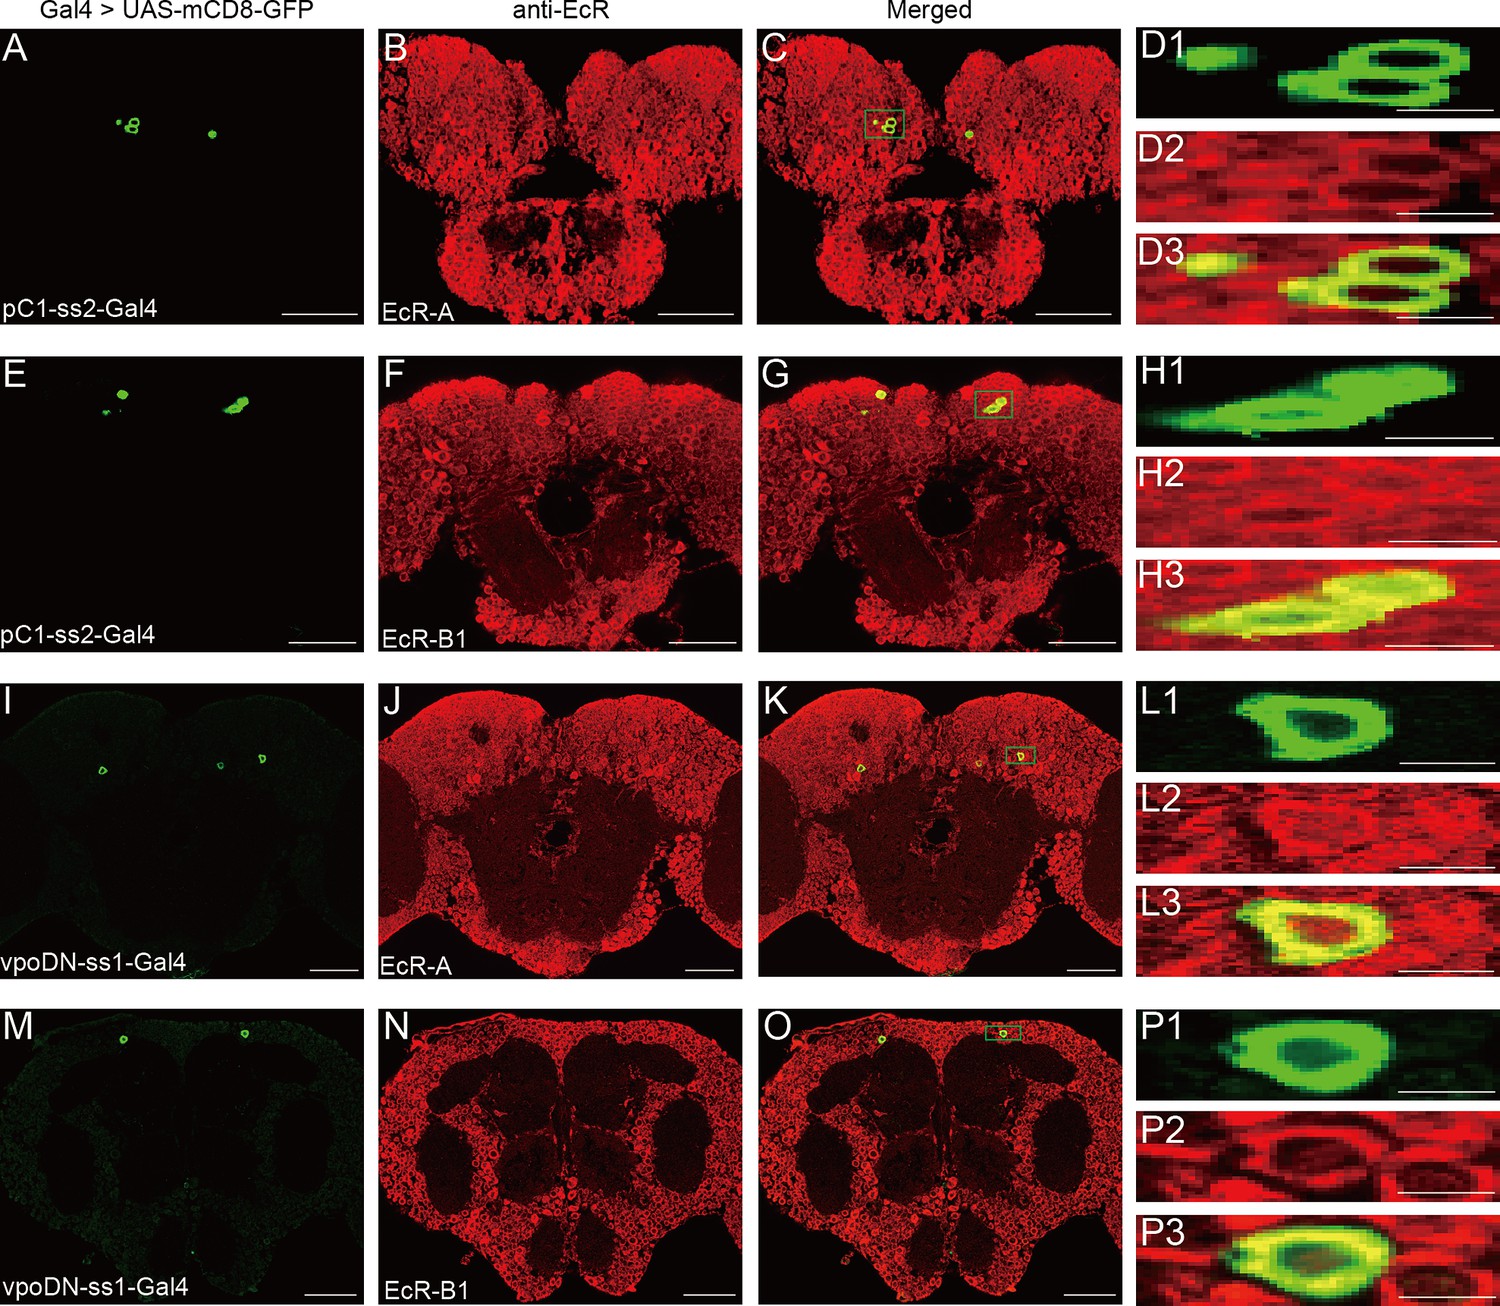
Expression of EcR-A and EcR-B1 in pC1 and vpoDN neurons.
(A–C) pC1 neurons were colabeled by pC1-ss2 driving UAS-mCD8-GFP (green, A) and EcR-A antibodies (red, B). Magnification of green boxed region in (C) is shown in (D1–D3). (E–G) pC1 neurons were colabeled by pC1-ss2 driving UAS-mCD8-GFP (green, E) and EcR-B1 antibodies (red, F). Magnification of green boxed region in (G) is shown in (H1–H3). (I–K) vpoDN neurons were colabeled by vpo-ss1 driving UAS-mCD8-GFP (green, I) and EcR-A antibodies (red, J). Magnification of green boxed region in (K) is shown in (L1–L3). (M–O) vpoDN neurons were colabeled by vpo-ss1 driving UAS-mCD8-GFP (green, M) and EcR-B1 antibodies (red, N). Magnification of green boxed region in (O) is shown in (P1–P3). Female flies were during prepupae stage. Scale bars for magnified regions are 5 μm, for others are 50 μm.
Figure 5—figure supplement 2
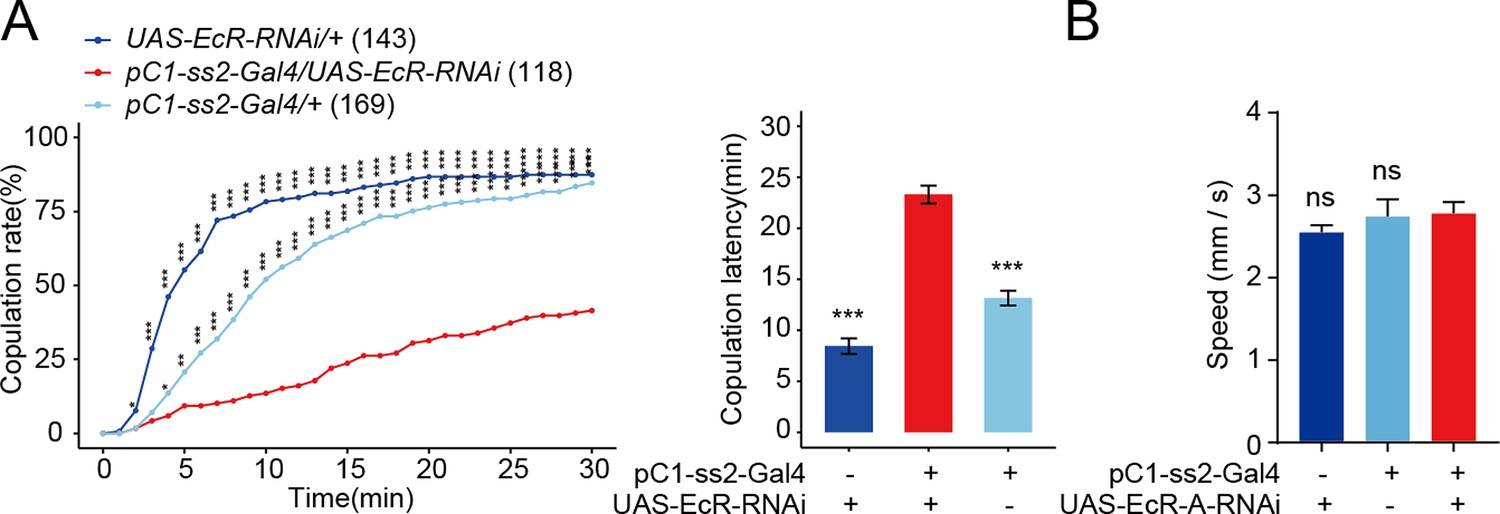
Reduced EcR in pC1 neurons reduces virgin female receptivity.
(A) Knock-down of EcR in pC1 neurons driven by pC1-ss2-Gal4 significantly decreased the copulation rate and increased the latency to copulation. (B) Mean velocity had no significant change when EcR-A was knocked down in pC1 neurons compared with controls (Kruskal–Wallis ANOVA and post hoc Mann–Whitney U tests, n = 8–11). The comparison referred to pC1-ss2-Gal4/UAS-EcR-RNAi (A) and pC1-ss2-Gal4/UAS-EcR-A-RNAi (B). Female flies were 4- to 6-day-old adults. The number of female flies paired with wild-type males is displayed in parentheses. For the copulation rate, chi-square test is applied. For the latency to copulation, Kruskal–Wallis ANOVA and post hoc Mann–Whitney U tests are applied. Error bars indicate SEM. *p < 0.05, **p < 0.01, ***p < 0.001, ****p < 0.0001, ns indicates no significant difference.
-
Figure 5—figure supplement 2—source data 1
Copulation time and walking speed.
- https://cdn.elifesciences.org/articles/92545/elife-92545-fig5-figsupp2-data1-v1.xlsx
Figure 5—figure supplement 3
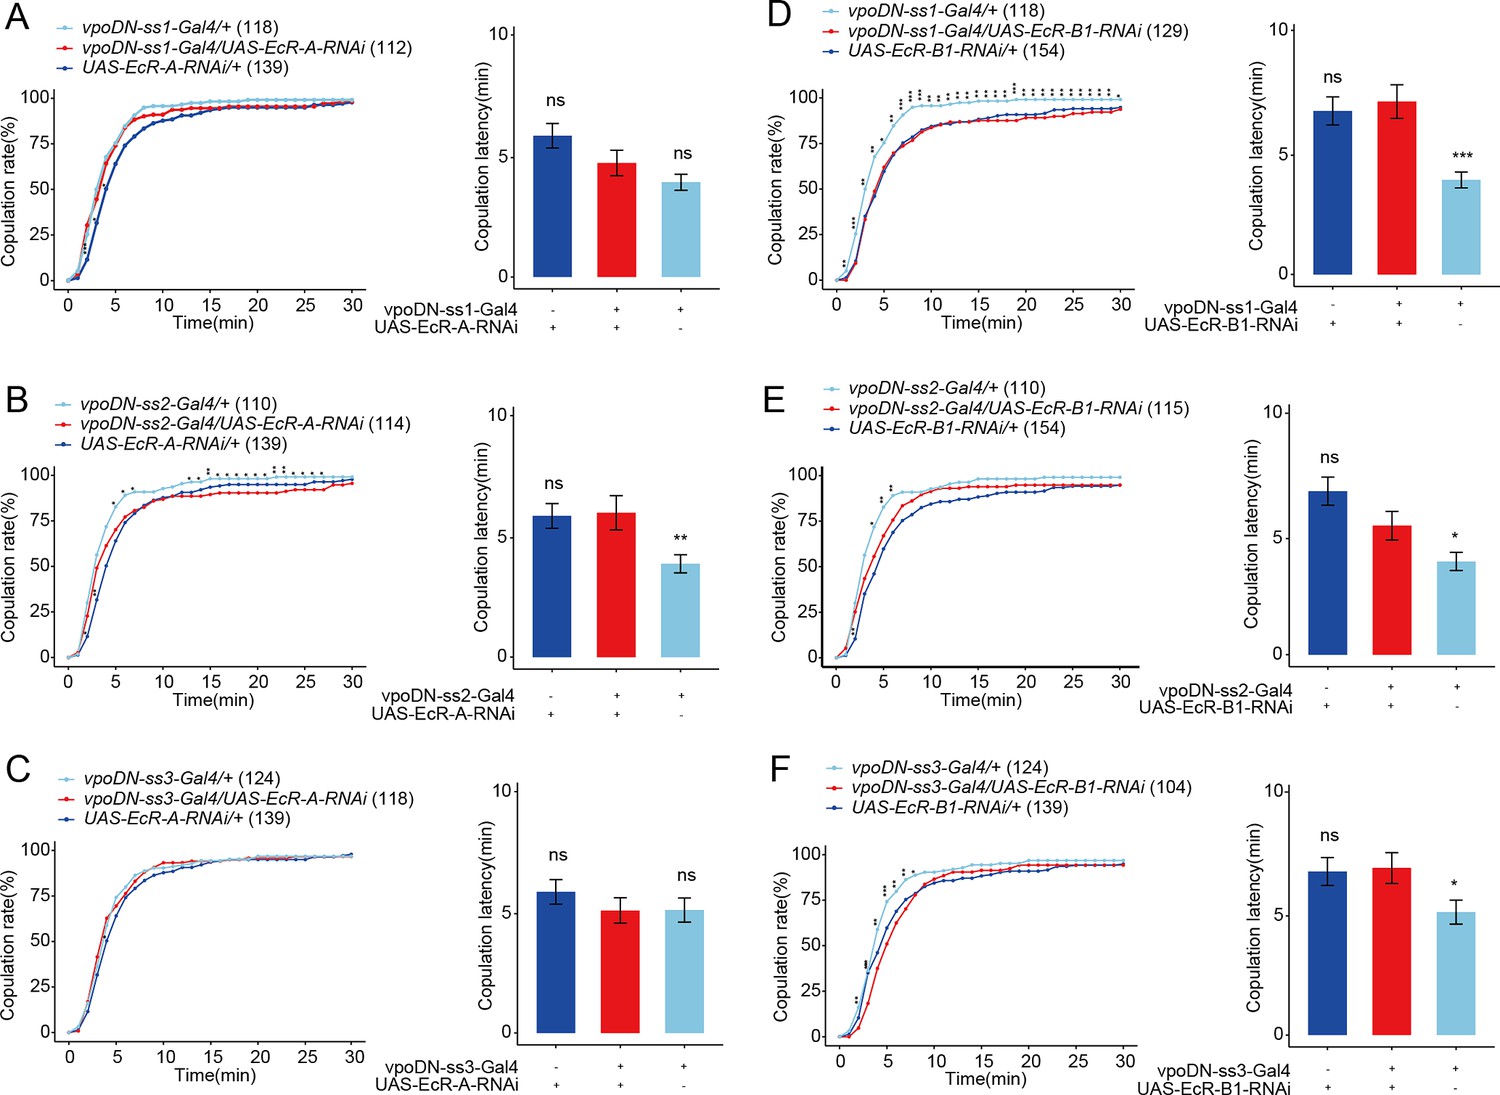
Reduced EcR in vpoDN neurons has no effect on virgin female receptivity.
(A–C) Knock-down of EcR-A in vpoDN neurons driven by vpoDN-ss1-Gal4, vpoDN-ss2-Gal4, and vpoDN-ss3-Gal4 had no effect on virgin female receptivity. (D–F) Knock-down of EcR-B1 in vpoDN neurons driven by vpoDN-ss1-Gal4, vpoDN-ss2-Gal4, and vpoDN-ss3-Gal4 had no effect on virgin female receptivity. The comparison referred to flies with decreased EcR isoform in vpoDN neurons. Female flies were 4- to 6-day-old adults. The number of female flies paired with wild-type males is displayed in parentheses. For the copulation rate, chi-square test is applied. For the latency to copulation, Kruskal–Wallis ANOVA and post hoc Mann–Whitney U tests are applied. Error bars indicate SEM. *p < 0.05, **p < 0.01, ***p < 0.001, ns indicates no significant difference.
-
Figure 5—figure supplement 3—source data 1
Copulation time.
- https://cdn.elifesciences.org/articles/92545/elife-92545-fig5-figsupp3-data1-v1.xlsx
Figure 5—figure supplement 4
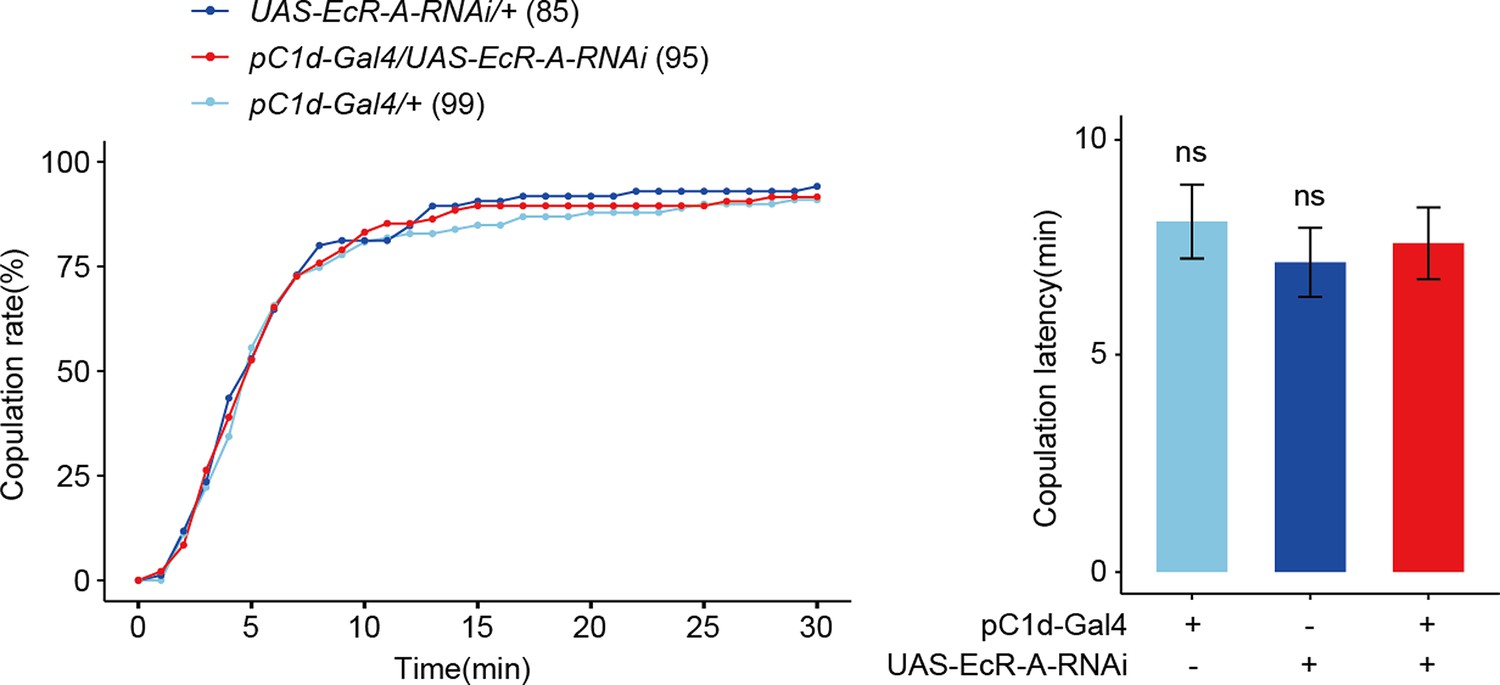
Reduced EcR-A in pC1d neurons has no effect on virgin female receptivity.
(A) Knock-down of EcR-A in pC1d neurons had no effect on virgin female copulation rate and latency to copulation. The comparison referred to pC1d-Gal4/UAS-EcR-A-RNAi. Female flies were 4- to 6-day-old adults. The number of female flies paired with wild-type males is displayed in parentheses. For the copulation rate, chi-square test is applied. For the latency to copulation, Kruskal–Wallis ANOVA and post hoc Mann–Whitney U tests are applied. Error bars indicate SEM, ns indicates no significant difference.
-
Figure 5—figure supplement 4—source data 1
Copulation time.
- https://cdn.elifesciences.org/articles/92545/elife-92545-fig5-figsupp4-data1-v1.xlsx
Figure 6
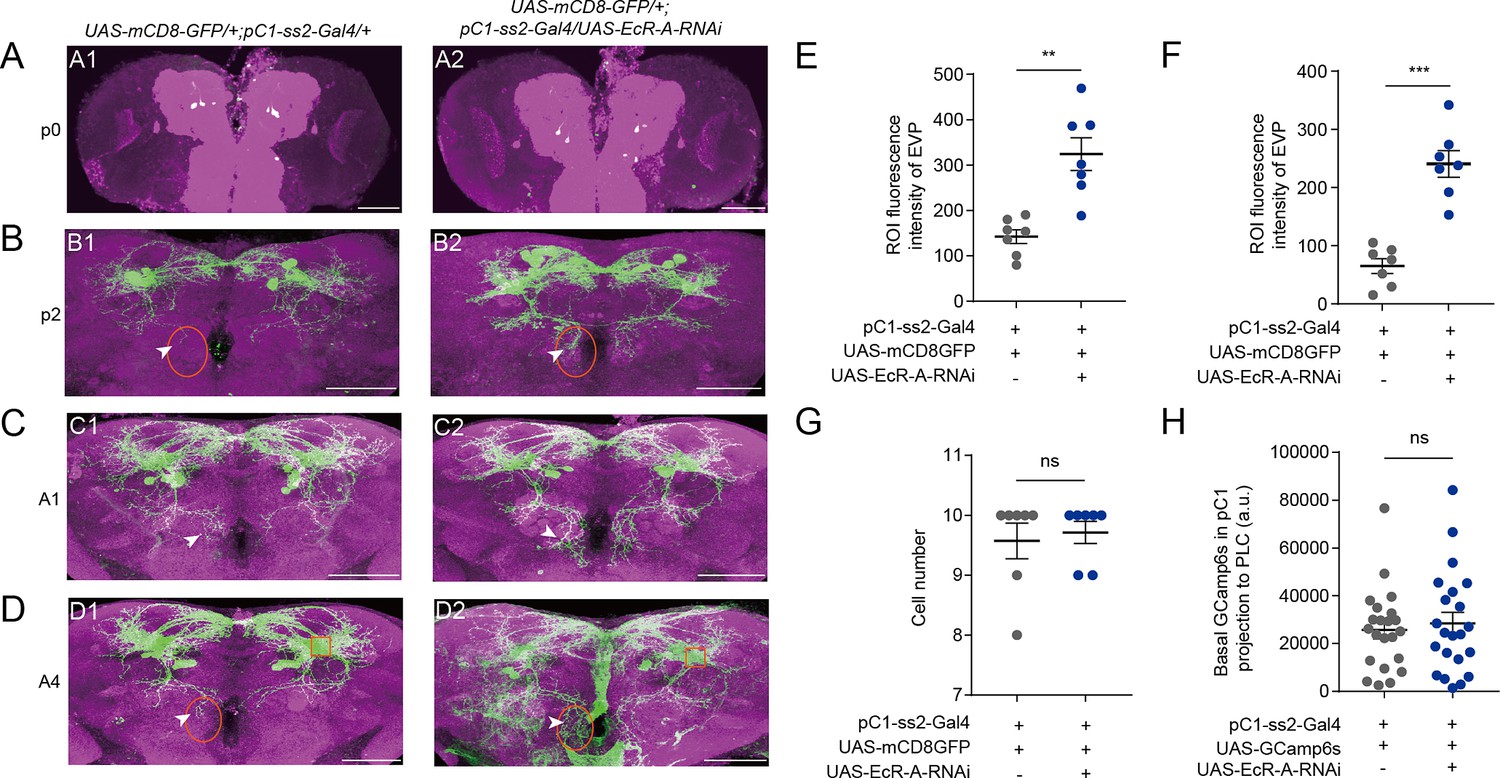
Reduced EcR-A in pC1 neurons induces the morphological changes.
(A1, A2) pC1-ss2-Gal4 expressing neurons appeared at the start of the pupal stage. (B–D) Reduced EcR-A in pC1 neurons induced more elaborated morphologies of pC1d axons, especially the extra vertical projection (EVP). The EVP regions of pC1d neurons was indicated by arrows. The morphological changes appeared on the second day of the pupal stage (B1, B2) and retained to the adult stage including the first day (C1, C2) and the fourth day (D1, D2) of the adult stage. p0, the first day of the pupal stage; p2, the second day of the pupal stage; A1, the first day of the adult stage; A4, the fourth day of the adult stage. Fluorescence intensity of EVP in pC1d neurons on the second day of the pupal stage (E) and the fourth day of the adult stage (F) was quantified when EcR-A was reduced in pC1 neurons (n = 7). The quantified EVP regions were marked in (B) and (D) with orange ellipses. (G) pC1 neurons of the fourth day adults had comparable cell body number when EcR-A was reduced in pC1 neurons or not (n = 7). (H) Basal GCaMP6s signals in the lateral protocerebral complex (LPC) region of pC1 neurons when EcR-A was reduced in pC1 neurons (n = 22). LPC regions, the neurites extending from pC1 cell bodies, were marked with orange square in (D1) and (D2). The comparison referred to flies with decreased EcR isoform in pC1 neurons. Female flies in (G, H) were 4-day-old adults. Scale bars are 50 μm. For all comparisons, Mann–Whitney U test is applied. Error bars indicate SEM. **p < 0.01, ***p < 0.001, ns indicates no significant difference.
-
Figure 6—source data 1
Fluorescence intensity, cell number, and calcium activity.
- https://cdn.elifesciences.org/articles/92545/elife-92545-fig6-data1-v1.xlsx
Figure 7
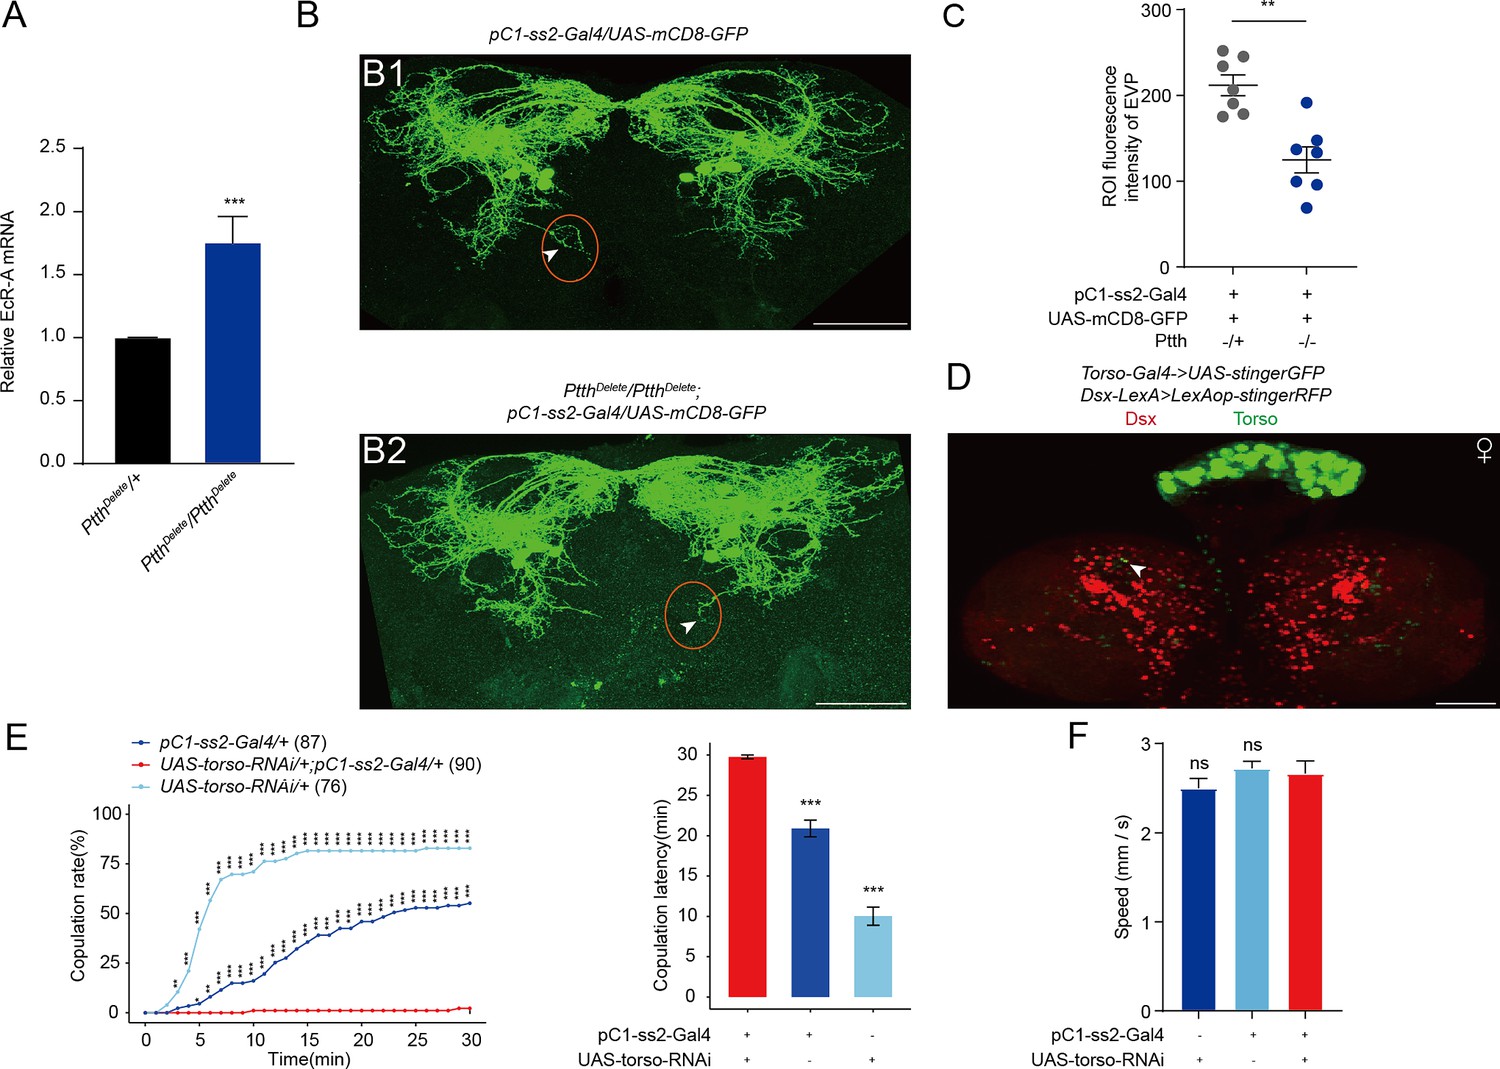
The function of prothoracicotropic hormone (PTTH) on EcR-A and pC1 neurons.
(A) qRT-PCR for EcR-A when PTTH was deleted. Bars represent mean ± SEM. p values are from Mann–Whitney U test (n = 8 for PtthDelete/+ and n = 6 for PtthDelete/PtthDelete, each sample contains about 10 bodies of newly formed prepupae). *p < 0.05, **p < 0.01, ***p < 0.001, ****p < 0.0001, ns indicates no significant difference. (B) Deletion of PTTH induced less elaborated morphologies of pC1d axons, especially the extra vertical projection (EVP). The EVP regions of pC1d neurons was indicated by arrows. Female flies were 4-day-old adults. (C) Fluorescence intensity of EVP in pC1d neurons on the fourth day was quantified when PTTH was deleted (n = 7). The quantified EVP regions were marked in (B1) and (B2) with red ellipses. (D) Torso-Gal4 and Dsx-LexA were labeled by stinger GFP and stingerRFP, respectively. Arrows indicated the overlap of GFP and RFP signals. Representative of five female brains. Scale bars, 50 μm. (E, F) Knock-down of Torso in pC1 neurons inhibited virgin female copulation rate and enhanced latency to copulation. Females had similar locomotion speeds between groups (F). The pC1-ss2-Gal4 control causes a massive decrease in female receptivity. The comparison referred to pC1-ss2-Gal4/UAS-torso-RNAi. Female flies were 4- to 6-day-old adults. The number of female flies paired with wild-type males is displayed in parentheses. For the copulation rate, chi-square test is applied. For the latency to copulation, Kruskal–Wallis ANOVA and post hoc Mann–Whitney U tests are applied. Error bars indicate SEM, *p < 0.05, **p < 0.01, ***p < 0.001, ns indicates no significant difference.
-
Figure 7—source data 1
Relative mRNA level, fluorescence intensity, copulation time, and walking speed.
- https://cdn.elifesciences.org/articles/92545/elife-92545-fig7-data1-v1.xlsx
Tables
Key resources table
| Reagent type (species) or resource | Designation | Source or reference | Identifiers | Additional information |
|---|---|---|---|---|
| Antibody | Anti-Bruchpilot (nc82), mouse monoclonal | Developmental Studies Hybridoma Bank | Cat# nc82, RRID: AB_2314866 | IHC (1:40) |
| Antibody | Anti-Drosophila ecdysone receptor (EcR-A), mouse monoclonal | Developmental Studies Hybridoma Bank | Cat# 15G1a (EcR-A), RRID: AB_528214 | IHC (1:10) |
| Antibody | Anti-Drosophila ecdysone receptor (EcR-B1), mouse monoclonal | Developmental Studies Hybridoma Bank | Cat# AD4.4(EcR-B1), RRID: AB_2154902 | IHC (1:10) |
| Antibody | Anti-GFP, rabbit polyclonal | Thermo Fisher Scientific | Cat# A-11122, RRID: AB_221569 | IHC (1:1000) |
| Antibody | Anti-GFP, chicken polyclonal | Thermo Fisher Scientific | Cat# A10262, RRID: AB_2534023 | IHC (1:1000) |
| Antibody | Alexa Fluor 488, goat anti-rabbit polyclonal | Thermo Fisher Scientific | Cat# A-11034, RRID: AB_2576217 | IHC (1:500) |
| Antibody | Alexa Fluor 488, goat anti-chickent polyclonal | Thermo Fisher Scientific | Cat# A-11039; RRID: AB_2534096 | IHC (1:500) |
| Antibody | Alexa Fluor 488, goat anti-mouse polyclonal | Thermo Fisher Scientific | Cat# A-11029, RRID: AB_2534088 | IHC (1:500) |
| Antibody | Alexa Fluor 546, goat anti-rabbit polyclonal | Thermo Fisher Scientific | Cat# A-11010, RRID: AB_2534077 | IHC (1:500) |
| Antibody | Anti-RFP, rabbit polyclonal | Thermo Fisher Scientific | Cat# R10367, RRID: AB_10563941 | IHC (1:500) |
| Antibody | Alexa Fluor 647, goat anti-mouse polyclonal | Thermo Fisher Scientific | Cat# A-21235, RRID: AB_2535804 | IHC (1:500) |
| Antibody | Anti-PTTH, rabbit polyclonal | Zhou Lab, Chinese Academy of Sciences, this paper | N/A | IHC (1:1300) |
| Chemical compound, drug | Paraformaldehyde (PFA) | Electron Microscopy Sciences | Cat#15713 | 8% PFA diluted in 1× PBS at 1:4 or 1:2 |
| Chemical compound, drug | DPX Mountant | Sigma- Aldrich | Cat# 44581 | |
| Chemical compound, drug | Normal goat serum | Sigma- Aldrich | Cat# G9023 | |
| Chemical compound, drug | 20-Hydroxyecdysone | Cayman | Cat# 16145 | Dissolved in 95% ethanol, 0.2 mg/ml |
| Chemical compound, drug | TRIzol | Ambion | Cat# 15596018 | |
| Genetic reagent (D. melanogaster) | LexAop2-mCD8::GFP | Bloomington Stock Center | BL# 32203, RRID:BDSC_32203 | |
| Genetic reagent (D. melanogaster) | ;;UAS-mCD8::GFP | Bloomington Stock Center | BL# 32194, RRID:BDSC_32194 | |
| Genetic reagent (D. melanogaster) | ;UAS-mCD8::GFP; | Bloomington Stock Center | BL# 5137, RRID:BDSC_5137 | |
| Genetic reagent (D. melanogaster) | UAS-dTrpA1/cyo | Garrity Lab, Brandeis University | N/A | |
| Genetic reagent (D. melanogaster) | UAS-Kir2.1 | Bloomington Stock Center | BL# 6595, RRID:BDSC_6595 | |
| Genetic reagent (D. melanogaster) | Ptth-Gal4 | Rao Lab, Peking University | N/A | |
| Genetic reagent (D. melanogaster) | PtthLexA | Rao Lab, Peking University | N/A | |
| Genetic reagent (D. melanogaster) | ΔPTTH | Rao Lab, Peking University | N/A | |
| Genetic reagent (D. melanogaster) | UAS-PTTH | Zhou Lab, Chinese Academy of Sciences, this paper | N/A | |
| Genetic reagent (D. melanogaster) | isoCS | Rao Lab, Peking University | N/A | |
| Genetic reagent (D. melanogaster) | elav-Gal4 | Rao Lab, Peking University | N/A | |
| Genetic reagent (D. melanogaster) | UAS-GFPStinger | Janelia Research Campus | N/A | |
| Genetic reagent (D. melanogaster) | LexAop-tomato | Janelia Research Campus | N/A | |
| Genetic reagent (D. melanogaster) | LexAop2-FlpL | Janelia Research Campus | N/A | |
| Genetic reagent (D. melanogaster) | UAS >stop > mCD8-GFP | Janelia Research Campus | N/A | |
| Genetic reagent (D. melanogaster) | Dsx-Gal4 | Janelia Research Campus | N/A | |
| Genetic reagent (D. melanogaster) | Dsx-LexA | Janelia Research Campus | N/A | |
| Genetic reagent (D. melanogaster) | tub-Gal80ts | Pan Lab, Southeast University | BL# 7018, RRID:BDSC_7018 | |
| Genetic reagent (D. melanogaster) | pC1-ss1-Gal4 | Wang Lab, Lingang Laboratory | N/A | |
| Genetic reagent (D. melanogaster) | pC1-ss2- Gal4 | Wang Lab, Lingang Laboratory | N/A | |
| Genetic reagent (D. melanogaster) | vpoDN-ss1-Gal4 | Wang Lab, Lingang Laboratory | N/A | |
| Genetic reagent (D. melanogaster) | vpoDN-ss2-Gal4 | Wang Lab, Lingang Laboratory | N/A | |
| Genetic reagent (D. melanogaster) | vpoDN-ss3-Gal4 | Wang Lab, Lingang Laboratory | N/A | |
| Genetic reagent (D. melanogaster) | UAS-EcR-RNAi | Bloomington Stock Center | BL# 9327, RRID:BDSC_9327 | |
| Genetic reagent (D. melanogaster) | UAS-EcR-A-RNAi | Bloomington Stock Center | BL# 9328, RRID:BDSC_9328 | |
| Genetic reagent (D. melanogaster) | UAS-EcR-B1-RNAi | Bloomington Stock Center | BL# 9329, RRID:BDSC_9329 | |
| Genetic reagent (D. melanogaster) | pC1d-Gal4 | Bloomington Stock Center | BL# 86847, RRID:BDSC_86847 | |
| Genetic reagent (D. melanogaster) | UAS-PTTH-RNAi | VDRC | V102043 | |
| Genetic reagent (D. melanogaster) | UAS-DsxF-RNAi | Pan Lab | N/A | |
| Genetic reagent (D. melanogaster) | UAS-Torso-RNAi | Liu Lab | BL# 33627, RRID:BDSC_33627 | |
| Recombinant DNA reagent | pBSK-attP-3P3-RFP-loxP | Deng et al., 2019 | N/A | |
| Recombinant DNA reagent | pBSK-attB-loxP-myc-T2A-Gal4Gal4-GMR-miniwhite | Deng et al., 2019 | N/A | |
| Recombinant DNA reagent | pBSK-attB-loxP-V5-T2A-LexA::p65-GMR-miniwhite | Deng et al., 2019 | N/A | |
| Software, algorithm | MATLAB | MathWorks, Natick, MA | https://www.mathworks.com/products/matlab.html | |
| Software, algorithm | ImageJ | National Institutes of Health | https://imagej.nih.gov/ij/ | |
| Software, algorithm | Prism 7 | GraphPad | https://www.graphpad.com/ | |
| Software, algorithm | R 4.1.3 | RStudio | https://www.r-project.org |
Additional files
-
Supplementary file 1
The primers used for the verification of PtthDelete null mutant flies and for the real-time quantitative PCR of EcR-A when prothoracicotropic hormone (PTTH) is deleted.
- https://cdn.elifesciences.org/articles/92545/elife-92545-supp1-v1.xlsx
-
MDAR checklist
- https://cdn.elifesciences.org/articles/92545/elife-92545-mdarchecklist1-v1.pdf
Download links
A two-part list of links to download the article, or parts of the article, in various formats.
Downloads (link to download the article as PDF)
Open citations (links to open the citations from this article in various online reference manager services)
Cite this article (links to download the citations from this article in formats compatible with various reference manager tools)
The function of juvenile–adult transition axis in female sexual receptivity of Drosophila melanogaster
eLife 12:RP92545.
https://doi.org/10.7554/eLife.92545.3


