STAT3 is a genetic modifier of TGF-beta induced EMT in KRAS mutant pancreatic cancer
- Department of Microbiology and Immunology, Stony Brook University, United States
Figures
Figure 1 with 2 supplements
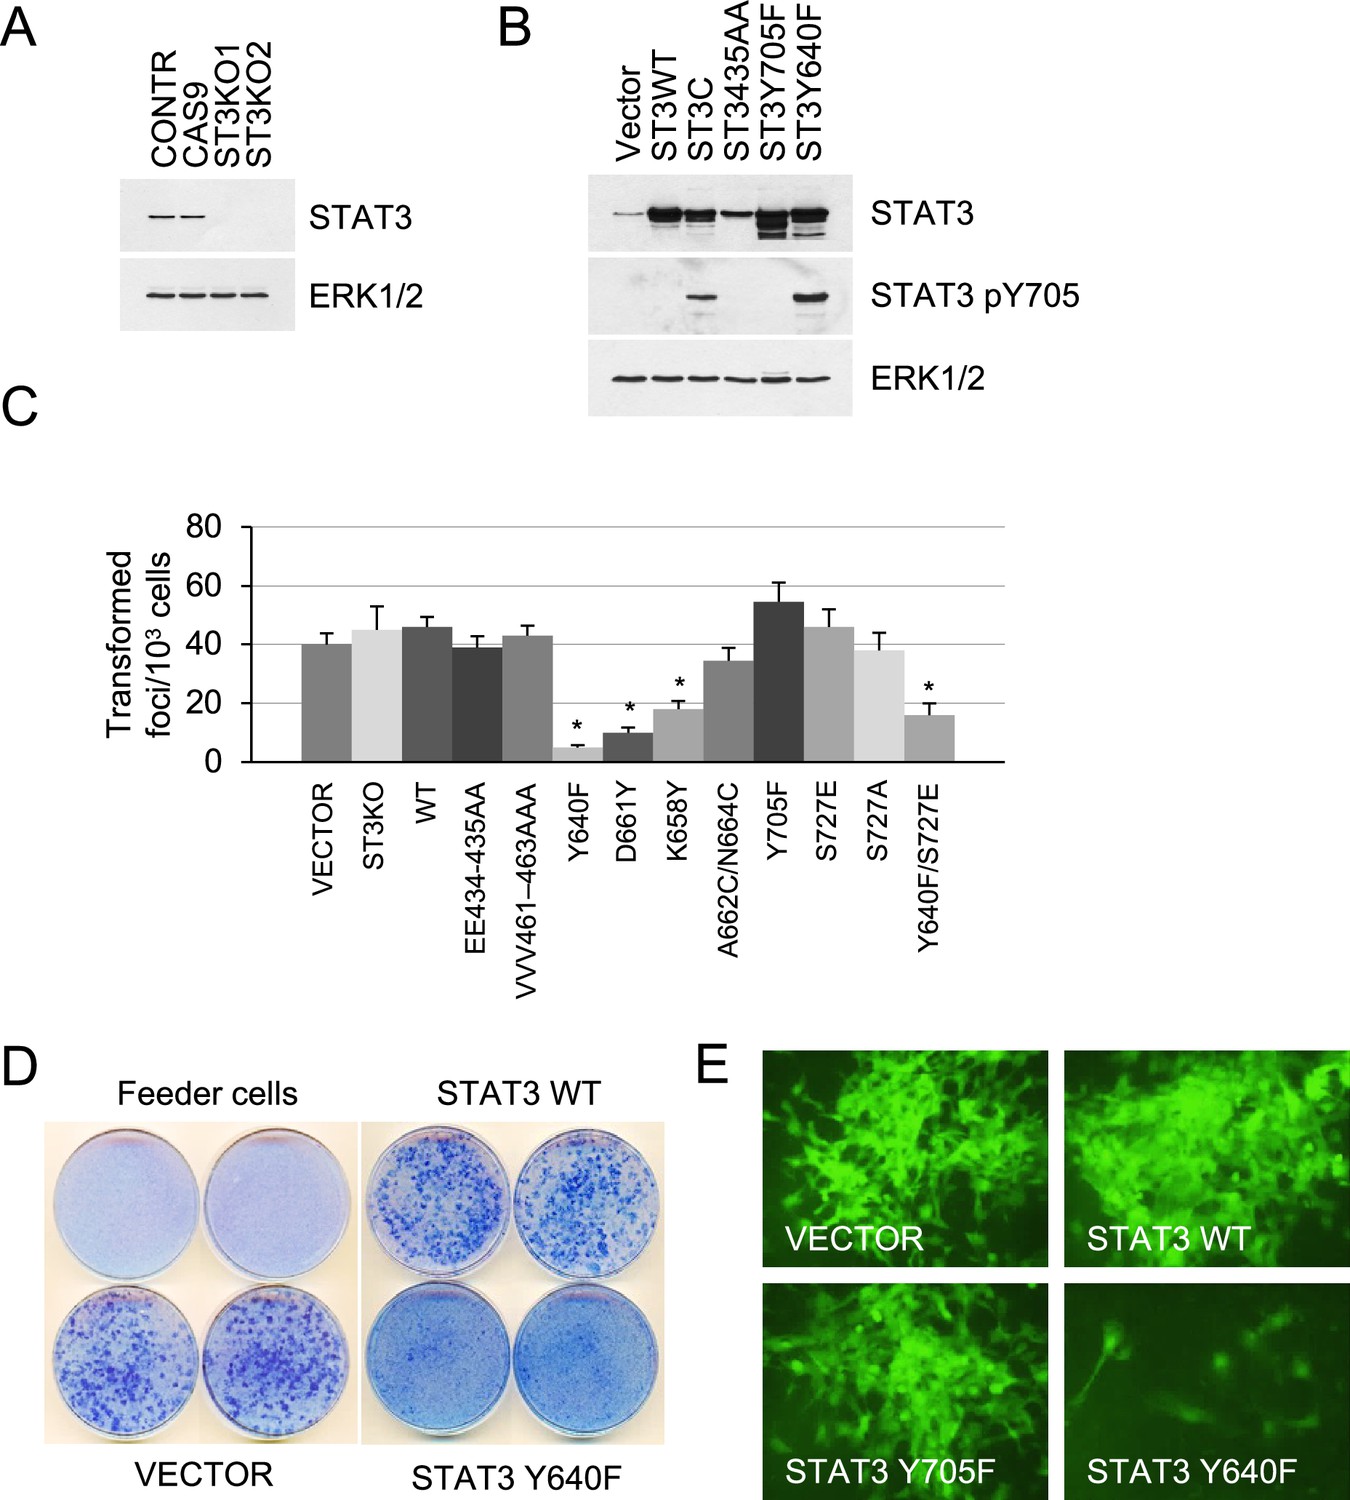
Effect of STAT3 activity on KRAS-mediated transformation.
(A) Western blot analysis of STAT3 expression in KP MEFs (Contr) transduced with CRISPR/CAS9 lentivirus expressing CAS9 or gRNAs targeting STAT3 (ST3KO). Two independent knockout clones are shown. ERK1/2 is a loading control. (B) Western blot analysis of total and Y705-phosphorylated STAT3 in KP MEFs transduced with lentivirus expressing control (Vector), wild-type (ST3WT) or mutant STAT3 alleles as noted. ERK1/2 is a loading control. (C) Transduced control (Vector) and KP MEFs were evaluated for foci formation. Cells expressing the indicated STAT3 genotypes were co-cultured with 103 p53KO feeder MEFs and macroscopic colonies were counted after 2 weeks (n=3 with six replicate plates for each cell type, *p<0.05). Values correspond to mean ± s.d. (D) Representative images of tissue culture plates stained with Giemsa to detect foci formed by KP MEFs expressing vector, STAT3 WT or hyperactive STAT3 Y640F. (E) Representative images of transformed foci visualized by fluorescence microscopy. Foci formed by KP MEFs co-expressing GFP with vector alone, STAT3 WT, STAT3 Y705F, or STAT3 Y640F are shown.
-
Figure 1—source data 1
Original western blot images.
- https://cdn.elifesciences.org/articles/92559/elife-92559-fig1-data1-v1.zip
Figure 1—figure supplement 1

STAT3 mutant alleles and their effect on growth in culture.
(A) Schematic representation of STAT3 domain structure and the mutants used in this study. (B) Western blot analysis of KP MEFs harboring STAT3 mutations reveals unperturbed PI3K/AKT and MAPK/ERK signaling. (C) Loss of STAT3 does not affect growth and viability of KRASG12D p53KO MEFs. The cells were cultured for two weeks in 2D adherent cultures. Cumulative cell numbers are shown. Values correspond to mean ±s.d.
-
Figure 1—figure supplement 1—source data 1
Original western blot images.
- https://cdn.elifesciences.org/articles/92559/elife-92559-fig1-figsupp1-data1-v1.zip
Figure 1—figure supplement 2
Analysis of STAT3 loss-of-function and gain-of-function.
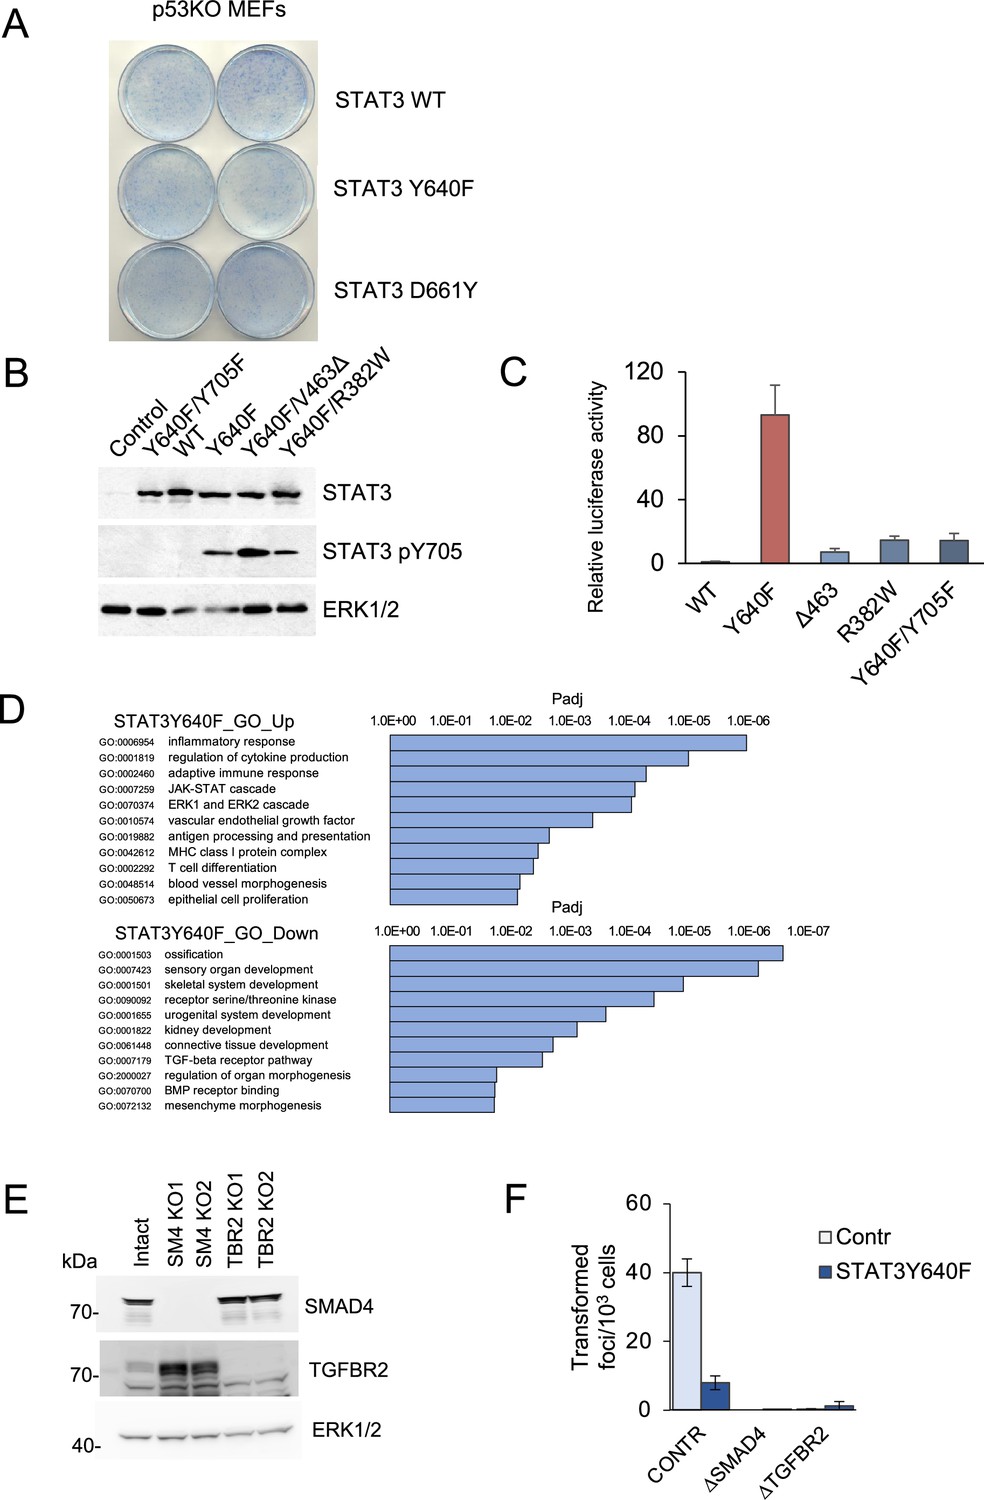
(A) Focus formation assays of p53null MEFs overexpressing STAT3 WT, STAT3 Y640F or STAT3 D661Y. (B) Western blot analyses of total STAT3 and Y705-phosphorylated STAT3 in KP MEFs expressing vector alone, and single and double mutations of STAT3 as noted. ERK1/2 is a loading control. (C) Transactivation by STAT3 mutants of a STAT3-responsive promoter driving a luciferase reporter. Hep3B cells were co-transfected with the p3XGAS-Hsp70-Luc reporter plasmid and mutant STAT3 alleles as noted and stimulated with 20 ng/ml human IL-6 for 24 hr (n=3 for each cell type). Relative luciferase values are presented as mean ±s.d. (D) GO enrichment of differentially expressed genes in KP MEF cells expressing STAT3 Y640F compared to control KP cells. (E) Western blot analysis of SMAD4 KO and TGFBR2 KO KP MEFs. (F) Results of focus formation assays of control KP MEFs, and MEFs ablated for SMAD4 and TGFBR2 expression with or without expression of STAT3 Y640F as indicated (n>6 for each). Values correspond to average and s.d.
Figure 2 with 1 supplement
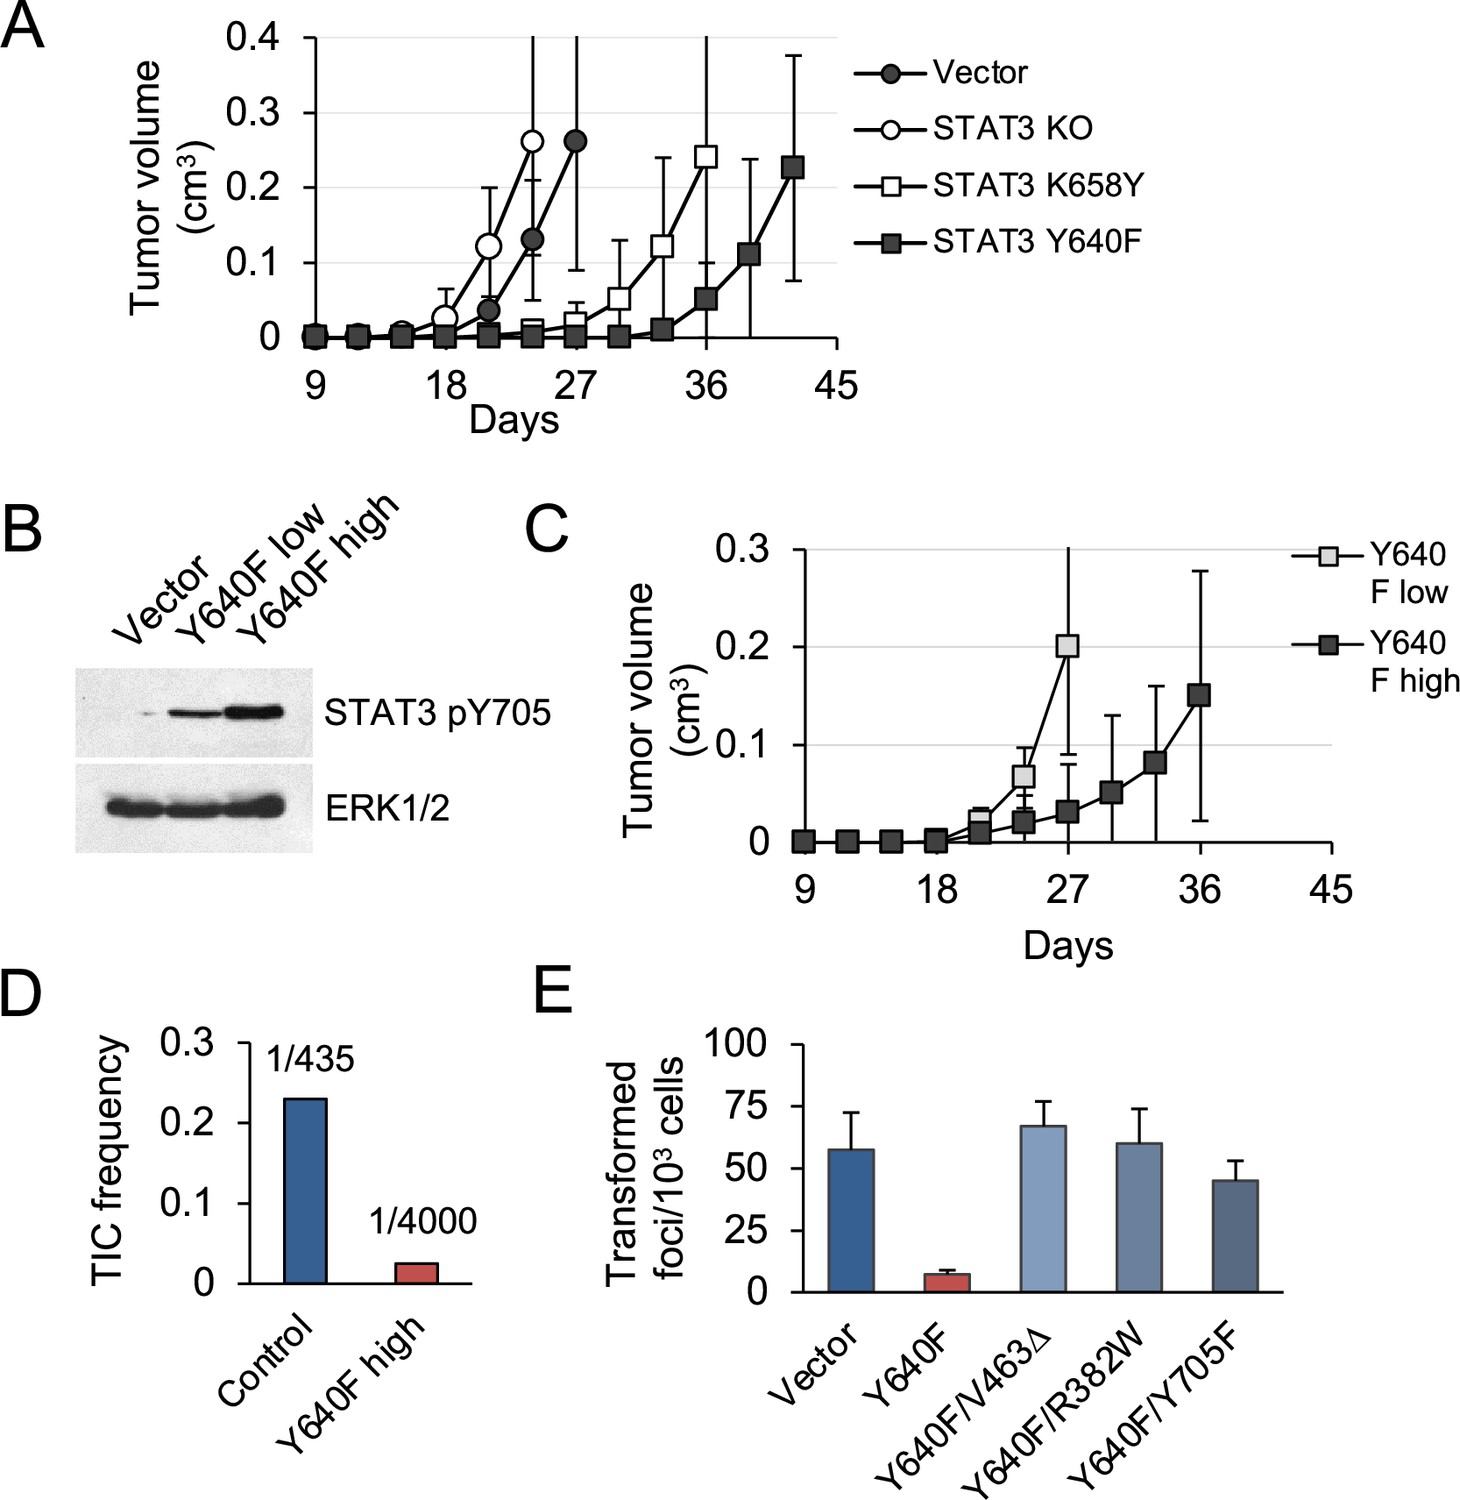
STAT3 GOF mutations reduce tumor development in mice.
(A) Subcutaneous tumor formation in nude mice by KP MEFs expressing vector alone, STAT3 KO, STAT3 K658Y or STAT3 Y640F (104 cells per injection site, n=4 for each cell type). Error bars represent s.d. (B) Western blot analysis of Y705-phosphorylated STAT3 in KP MEFs expressing vector alone, and low or high levels of STAT3 Y640F protein. Cells were fractionated by FACS for GFP. ERK1/2 is a loading control. (C) Subcutaneous tumor formation in nude mice by cells from (B) (104 cells per implant site, n=4 for each cell type). Error bars represent s.d. (D) Quantification of tumor-initiating cell (TIC) frequency in control (Vector) and STAT3 Y640F-expressing KP MEFs by extreme limiting dilution assays (ELDA) in nude mice. (E) Focus formation by KP MEFs expressing vector alone, STAT3 Y640F or double mutants of STAT3 Y640F with DNA binding domain (DBD) mutations, V463Δ and R382W, or phospho-inactivating Y705F. Results represent replicates from two independent experiments (n=4 for each cell type). Values correspond to mean ± s.d.
-
Figure 2—source data 1
Original western blot images.
- https://cdn.elifesciences.org/articles/92559/elife-92559-fig2-data1-v1.zip
Figure 2—figure supplement 1
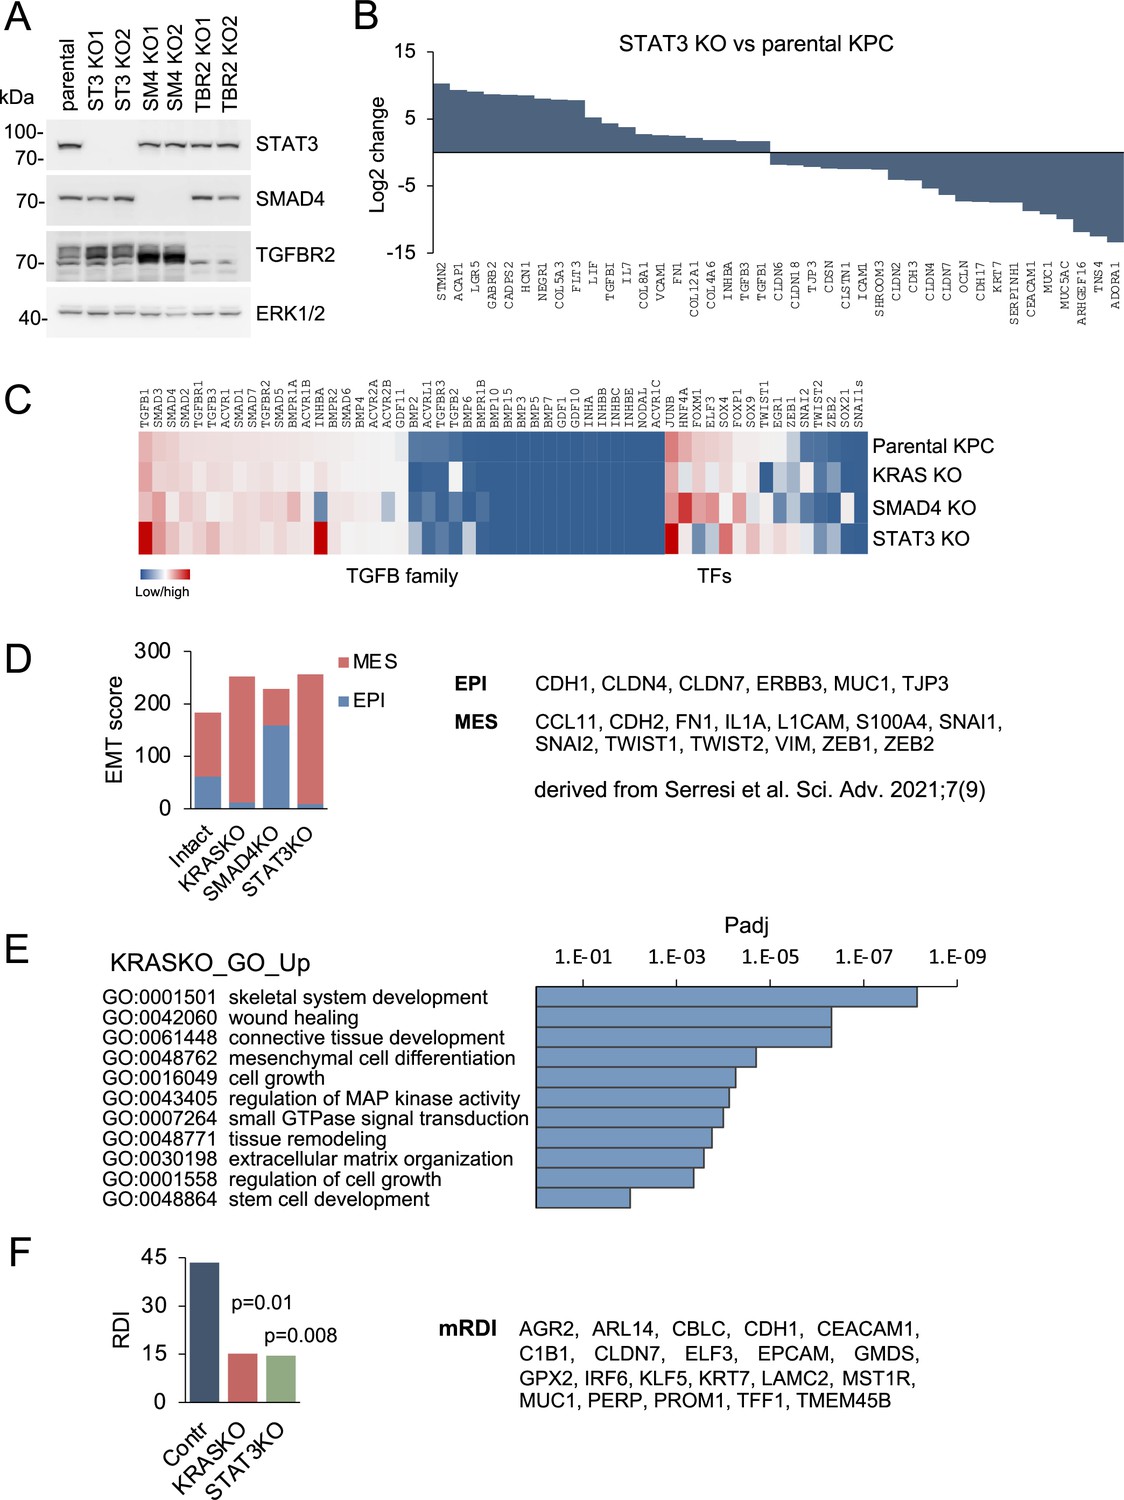
Gene regulation in response to loss of STAT3, SMAD4, and mutant KRAS in PDAC.
(A) Western blots of parental KPC pancreatic ductal adenocarcinoma cells, and two isogenic knockout clones for STAT3, SMAD4 or TGFBR2 generated by CRISPR/Cas9 gene editing. ERK1/2 is a loading control. (B) Top up- and down-regulated subset of genes in STAT3 KO KPC cells compared to parental control cells. (C) Heatmaps of differentially expressed genes in KPC parental cells and the indicated KRAS, STAT3, and SMAD4 knockout genotypes. TGF-β super family genes and transcription factors (TFs) are shown. (D) EMT scores of KPC cells of the indicated KRAS, STAT3, and SMAD4 genotypes based on epidermal (EPI) and mesenchymal (MES) genes derived from Serresi et al., 2021;7 (9) shown to right. (E) GO enrichment analysis of top up-regulated genes in KRAS KO cells compared to parental KPC cells. (F) RAS dependency indices of KPC pancreatic whole tumors based on bulk RNA-seq of tumors formed from parental KPC (Contr), KRAS KO or STAT3 KO cells. Murine RAS dependency index (mRDI) was derived from Ischenko et al. Nature Communications, 2021;12 (Sondka et al., 2018):1482.
-
Figure 2—figure supplement 1—source data 1
Original western blot images.
- https://cdn.elifesciences.org/articles/92559/elife-92559-fig2-figsupp1-data1-v1.zip
Figure 3
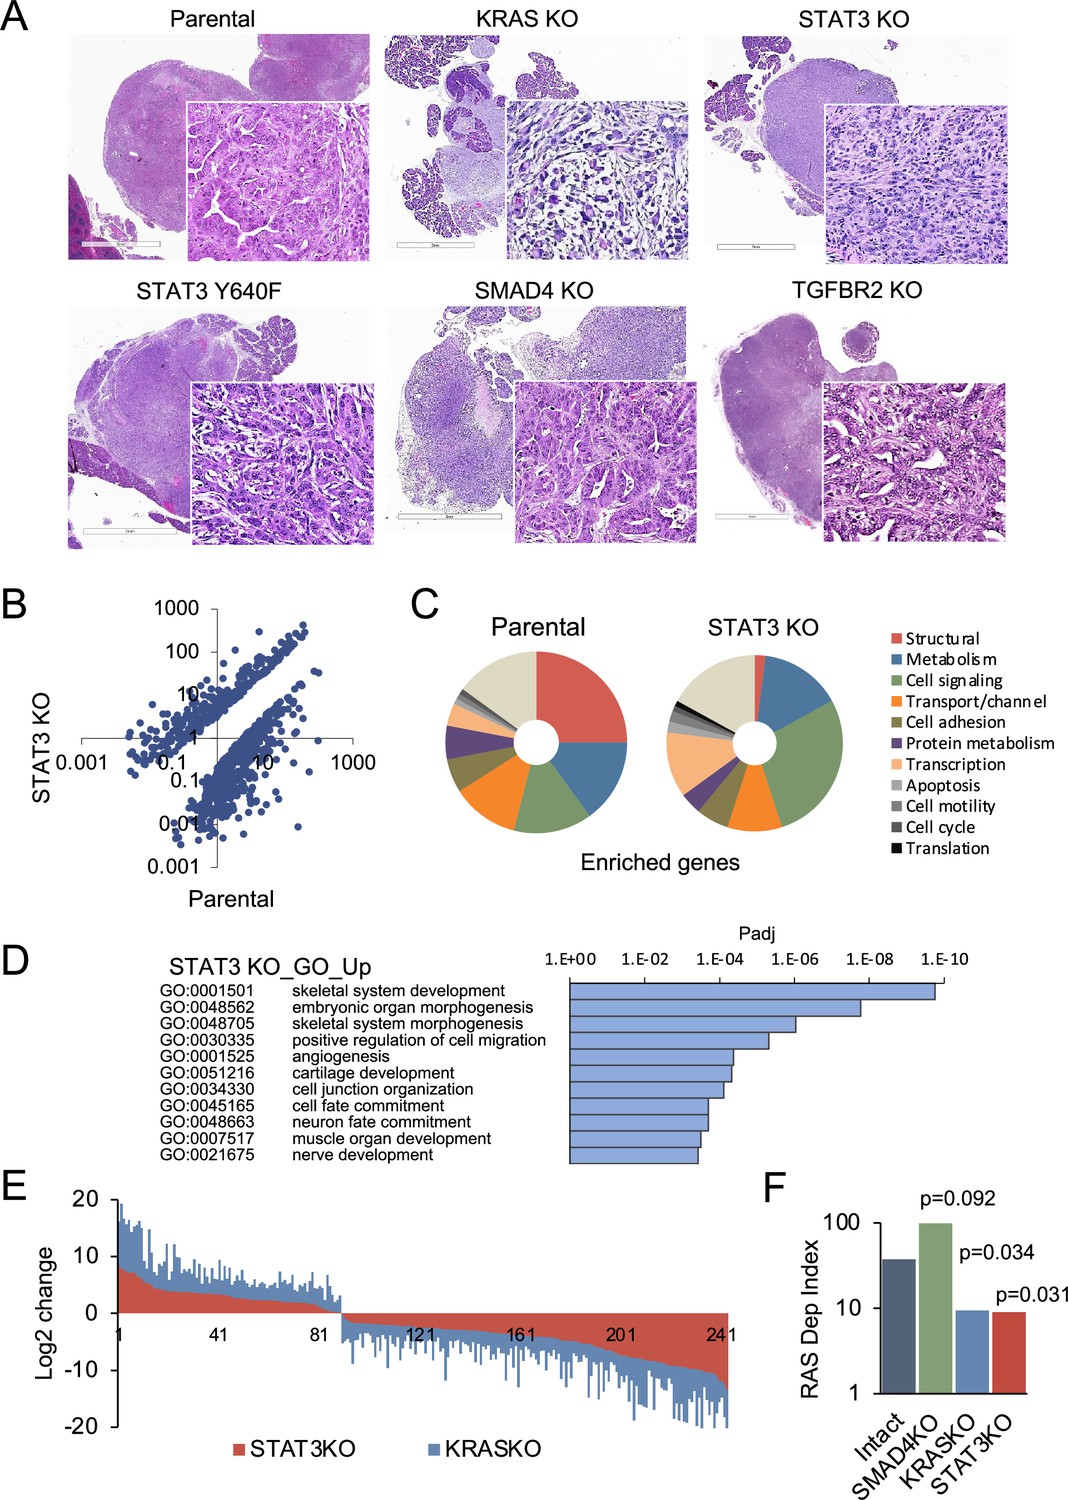
STAT3 is a genetic modifier of EMT.
(A) Representative H&E staining of pancreatic tumor sections derived from KPC cells of the indicated KRAS (n=15`), STAT3 (n=11), TGFBR2 (n=3), and SMAD4 (n=12) genotypes, where n denotes the number of mice injected. At least two independent clones were used. 2mm scale bar. (B) Scatter plot representing differentially expressed genes in parental (STAT3 intact) and STAT3 KO KPC cells. (C) Pie charts representing gene expression profiles of the top 100 upregulated genes in parental control (STAT3 intact) and STAT3 KO KPC cells with percentages linked to specific cellular functions. (D) GO enrichment analysis of the top 100 upregulated genes in STAT3 KO cells compared to STAT3 intact (control) cells. (E) Analysis of overlapping differentially expressed genes (n=243) in STAT3 KO and KRAS KO KPC cell lines relative to parental control cells. (F) Mouse RAS dependency index (RDI) of KPC cells of the indicated KRAS, STAT3, and SMAD4 genotypes.
Figure 4 with 1 supplement
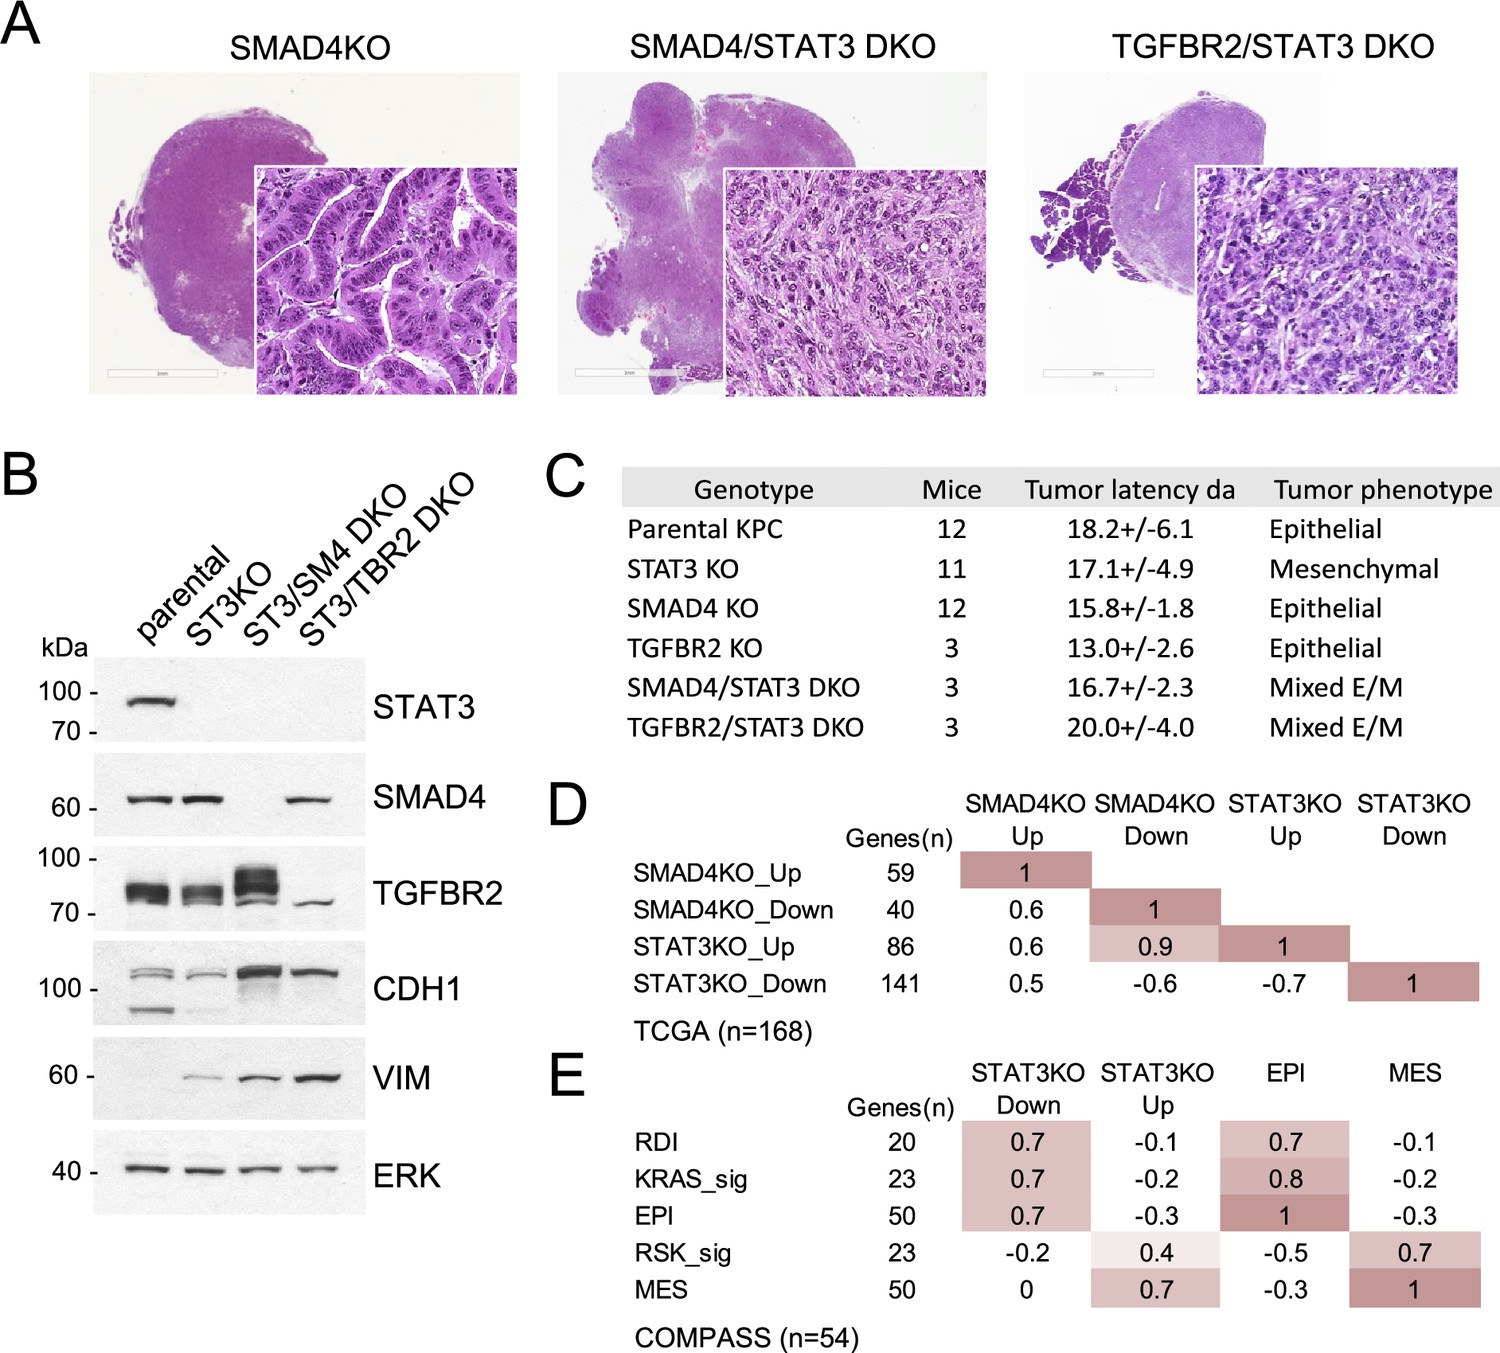
STAT3 and SMAD4 play opposing roles in pancreatic tumorigenesis.
(A) Representative H&E staining of pancreatic tumor sections derived from KPC cells of the indicated genotypes, SMAD4 KO (n=12), SMAD4/STAT3 DKO (n=3) and TGFBR2/STAT3 DKO (n=3), where n denotes the number of mice injected. At least two independent clones were used. 2mm scale bar. (B) Western blot analysis of control (Intact), STAT3 KO (ST3KO), STAT3/SMAD4 double KO (ST3/SM4DKO), or STAT3/TGFBR2 double KO (ST3/TRB2DKO) KPC cells. Expression of STAT3, SMAD4, TGFBR2, CDH1 (E-cadherin), and VIM (Vimentin) is shown. ERK1/2 is a loading control. (C) Summary of pancreatic tumor development in nude mice by KPC cells of the indicated STAT3, SMAD4, and TGFBR2 genotypes presented. (D) Pearson correlation heatmap comparing gene expression signatures of SMAD4 KO (SMAD4KO_up, down) and STAT3 KO (STAT3KO_up, down) KPC cells with human PDACs from TCGA (n=168). Signature scores were calculated using the top up- and down-regulated genes in STAT3 and SMAD4 KO KPC cells. The number of genes for each comparison is shown. (E) Pearson correlation heatmap comparing gene expression signature scores of genes regulated in STAT3 KO KPC cells with pancreatic tumors from the COMPASS database (n=92) classified by RAS dependency index (RDI), KRAS-dependent signature (KRAS-sig), KRAS-independent signature (RSK-sig), epithelial (EPI), or mesenchymal (MES) gene signature score.
-
Figure 4—source data 1
Top up- or down-regulated genes in murine KPC STAT3 KO or SMAD4 KO cells derived from RNA-Seq.
- https://cdn.elifesciences.org/articles/92559/elife-92559-fig4-data1-v1.xlsx
-
Figure 4—source data 2
Signature genes used to designate human PDAC tumors from TCGA and COMPASS databases as either epithelial (EPI) or mesenchymal (MES).
Gene signatures were derived from Tan et al., 2014;6 (10):1279–93.
- https://cdn.elifesciences.org/articles/92559/elife-92559-fig4-data2-v1.docx
-
Figure 4—source data 3
Genes used to define a RAS Dependency Index (RDI) derived from A.
Singh et al., 2009;15 (Philips et al., 2022):489–500, and genes used to define a KRAS-dependent signature (KRAS_sig) or an RSK-dependent signature (RSK_sig) derived from Yuan et al., 2018;22 (Jerez et al., 2012):1889–902.
- https://cdn.elifesciences.org/articles/92559/elife-92559-fig4-data3-v1.docx
Figure 4—figure supplement 1
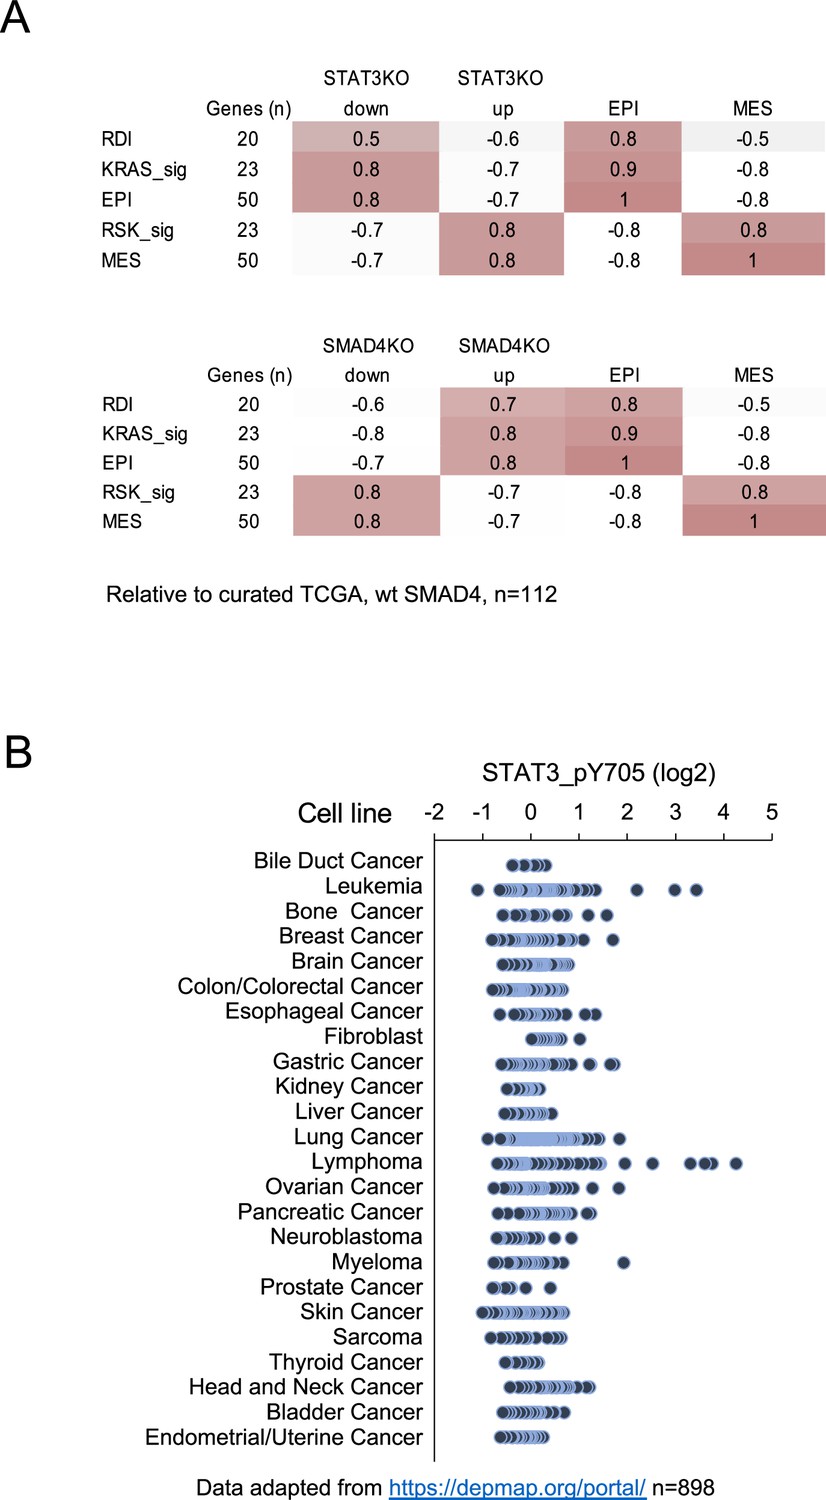
Human pancreatic cancer expression of STAT3 and SMAD4.
(A) Pearson correlation coefficients of STAT3 KO (top) or SMAD4 KO (bottom) gene signature scores with curated human pancreatic tumor samples expressing wild-type SMAD4 from TCGA (n=112). Tumors were classified by Ras dependency index (RDI), KRAS-dependent (KRAS-sig), KRAS-independent (RSK-sig), epithelial (EPI), or mesenchymal (MES) signatures. The number of genes for each comparison is shown. (B) STAT3 Y705 phosphorylation levels in cell lines from the Cancer Cell Line Encyclopedia (n=898).
Additional files
Download links
A two-part list of links to download the article, or parts of the article, in various formats.
Downloads (link to download the article as PDF)
Open citations (links to open the citations from this article in various online reference manager services)
Cite this article (links to download the citations from this article in formats compatible with various reference manager tools)
STAT3 is a genetic modifier of TGF-beta induced EMT in KRAS mutant pancreatic cancer
eLife 13:RP92559.
https://doi.org/10.7554/eLife.92559.2


