Circuit-based intervention corrects excessive dentate gyrus output in the fragile X mouse model
- Department of Cell Biology and Physiology, Washington University School of Medicine, United States
- Department of Neuroscience, Washington University School of Medicine, United States
Figures
Figure 1
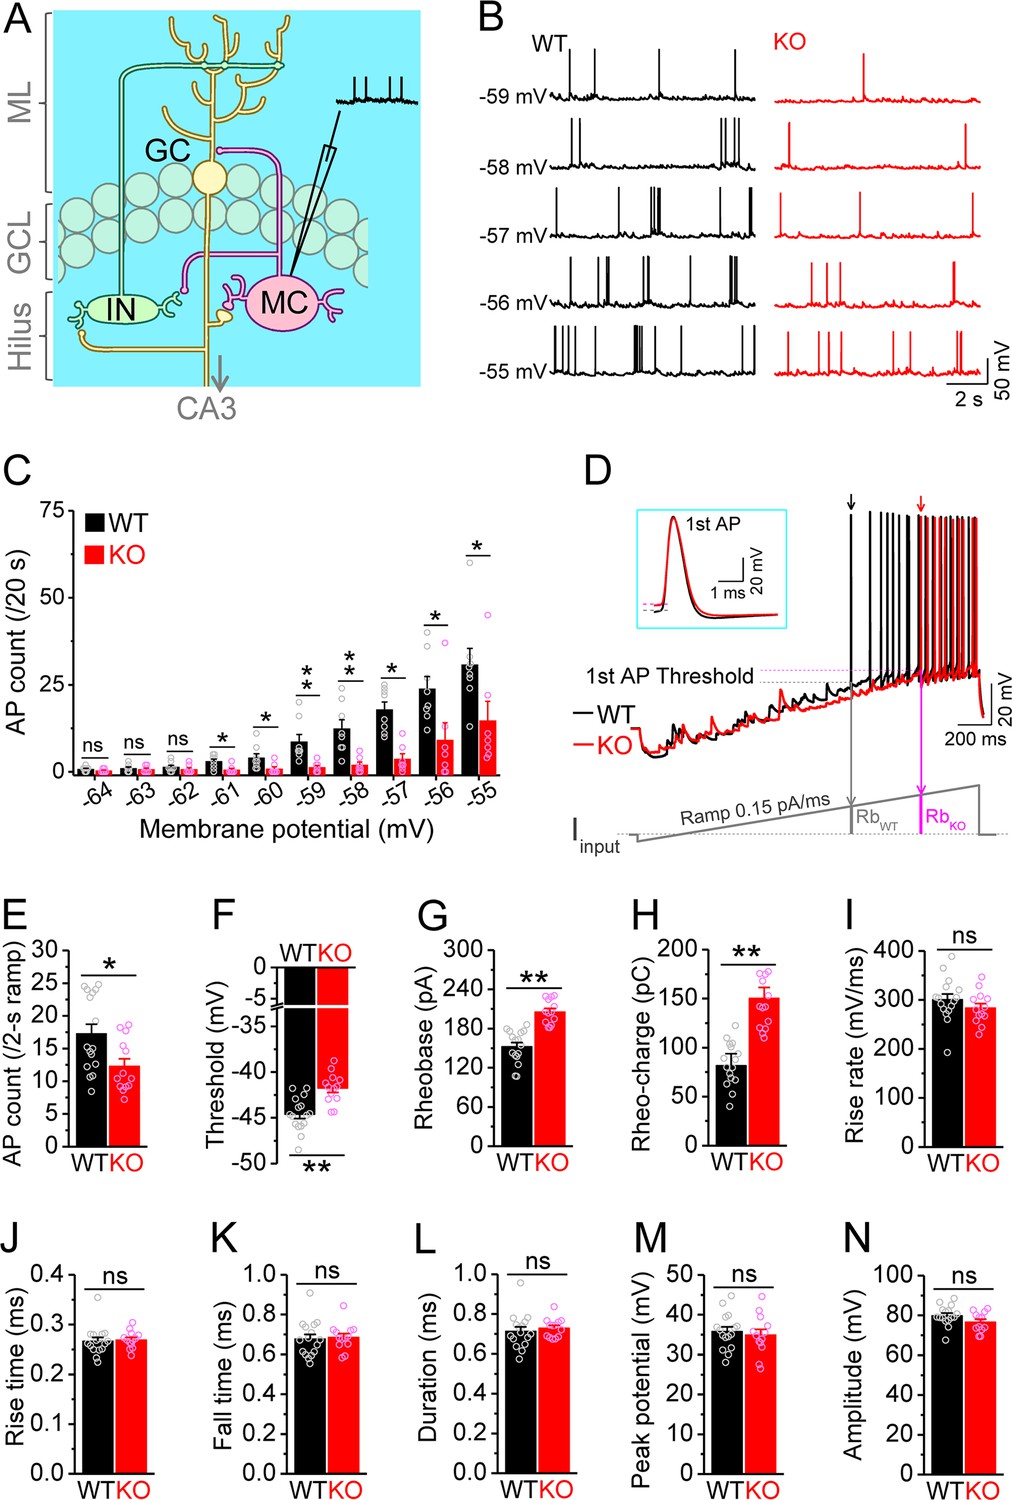
Decreased excitability of dentate mossy cells (MCs) in Fmr1 knockout (KO) mice.
(A) Schematic illustration of dentate circuit organization and recordings of action potentials (APs) from MCs. Note, for simplicity and clarity, we only show one type of interneurons (IN) with axons terminating onto distal dendrites of a granule cell (GC). The arrow indicates axons of GCs projecting to CA3. ML, molecular layer; GCL, granule cell layer. (B) Sample traces of spontaneous APs recorded at different membrane potentials from MCs in wildtype (WT) (black) and Fmr1 KO (red) mice. (C) Summary data for experiments exemplified in (B) showing decreased number of APs at membrane potentials of –61 through –55 mV in KO MCs. Scatter circles indicate individual data points for this and all subsequent bar graphs in this study. (D) Determination of AP threshold and rheobase by a ramp current injection (lower trace, ramp rate 0.15 pA/ms). Only the first APs (arrows, which were expanded and aligned by the time of threshold in inset) were used to estimate AP parameters. The horizontal lines (inset) indicate threshold of the first APs. In the lower panel, RbWT and RbKO denote rheobase current intensity at threshold time point, and the area (integrating time and input current) enclosed by dotted line, current ramp and RbWT (or RbKO) are rheobase charge transfer. (E–H) Summary data showing decreased number of APs during 2 s ramp (E), increased voltage threshold (F), rheobase (G), and rheobase charge transfer (H) in KO MCs. (I–N) AP upstroke maximum rise rate (I), rise time (J), fall time (K), duration (L), peak potential (M), and amplitude (N). *p<0.05; **p<0.01; ns, not significant. The statistical data are listed in Supplementary file 1. Data are mean ± SEM.
Figure 2
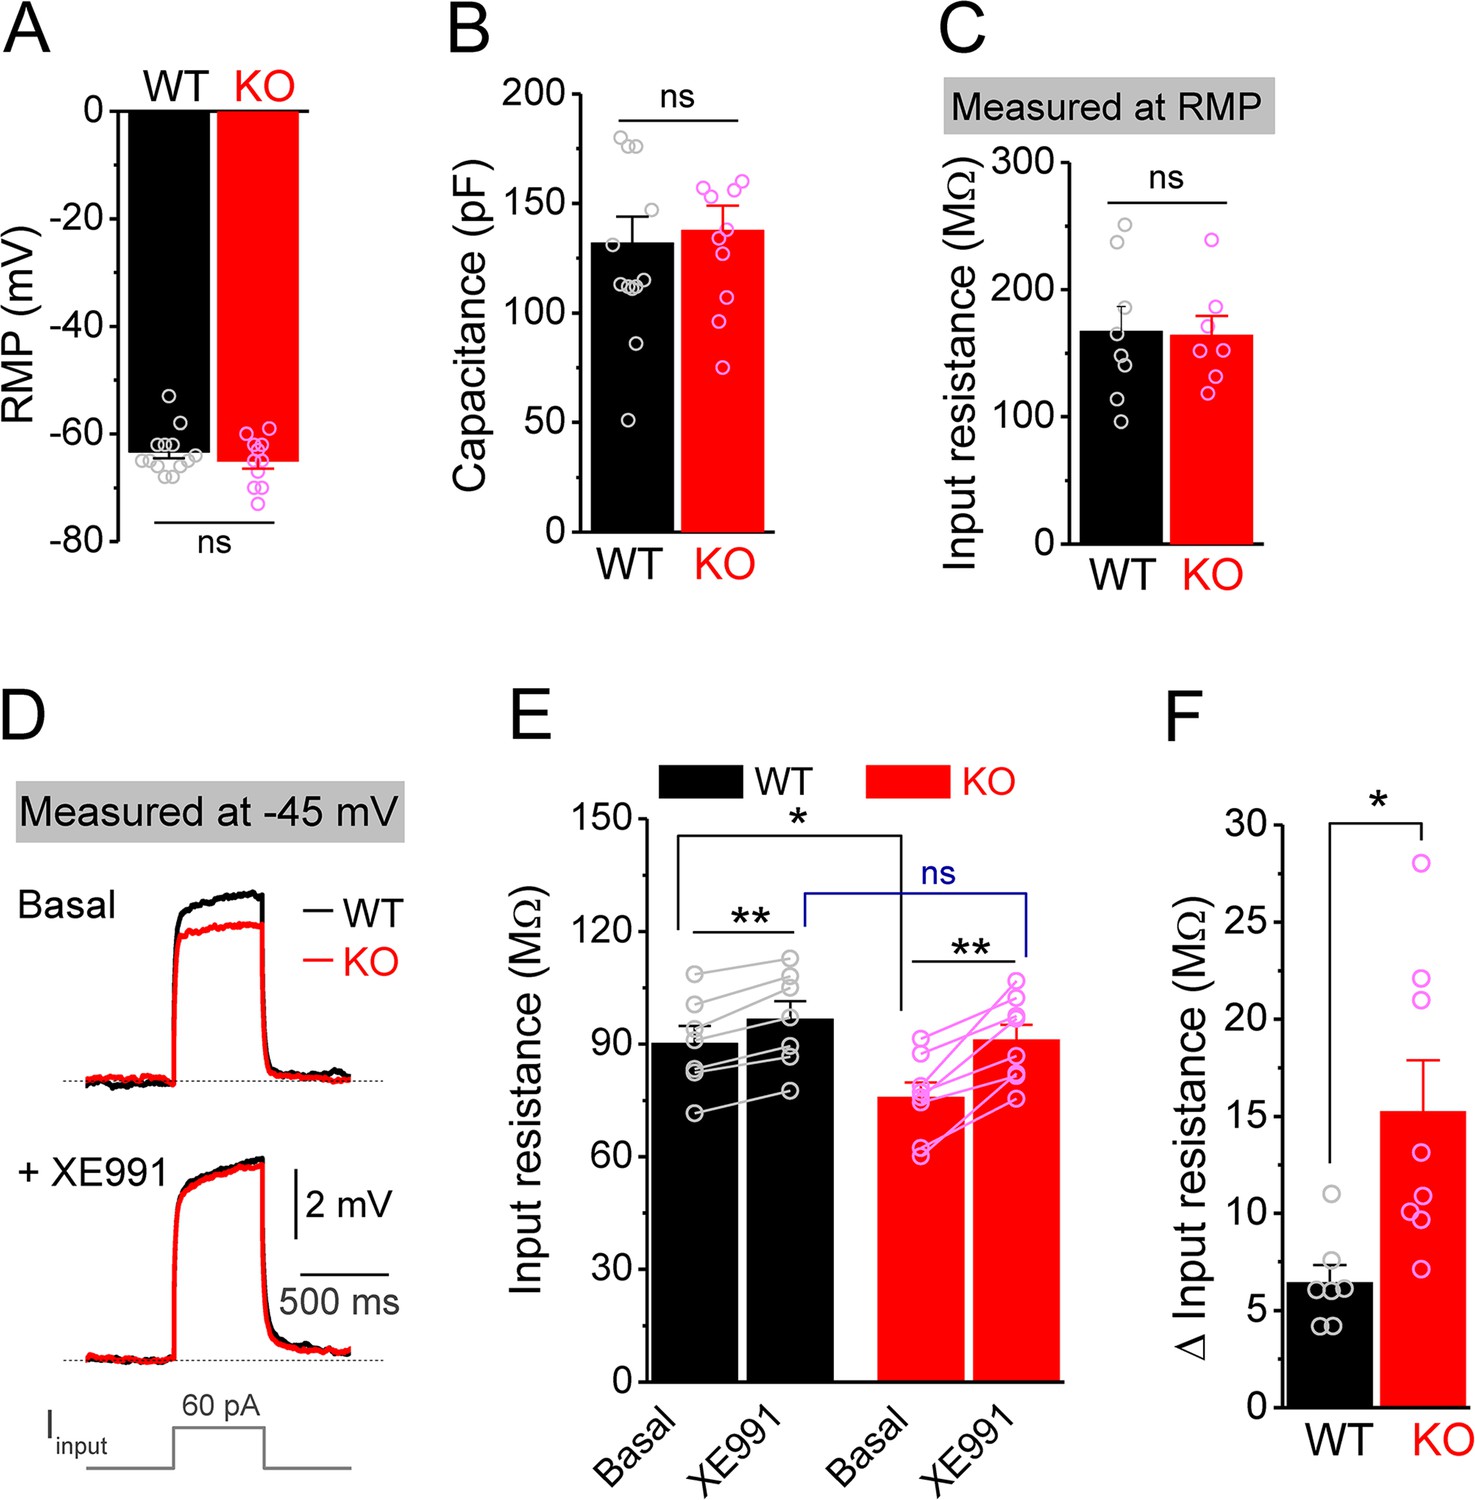
Decreased input resistance around threshold potential in Fmr1 knockout (KO) mossy cells.
(A, B) Resting membrane potential (RMP, A) and membrane capacitance (B) of mossy cells. (C) Input resistance measured at RMP level. (D) Input resistance measured at –45 mV. Sample traces of the depolarization current step (lowermost panel) induced voltage responses before (basal, upper panel) and during XE991 (+XE991, middle panel). (E) Summary data of input resistance before (basal) and during XE991. (F) Effects of XE991 on increasing of input resistance. Note XE991 have stronger effect on KO mossy cells. *p<0.05; **p<0.01; ns, not significant. The statistical data are listed in Supplementary file 1. Data are mean ± SEM.
Figure 3 with 1 supplement
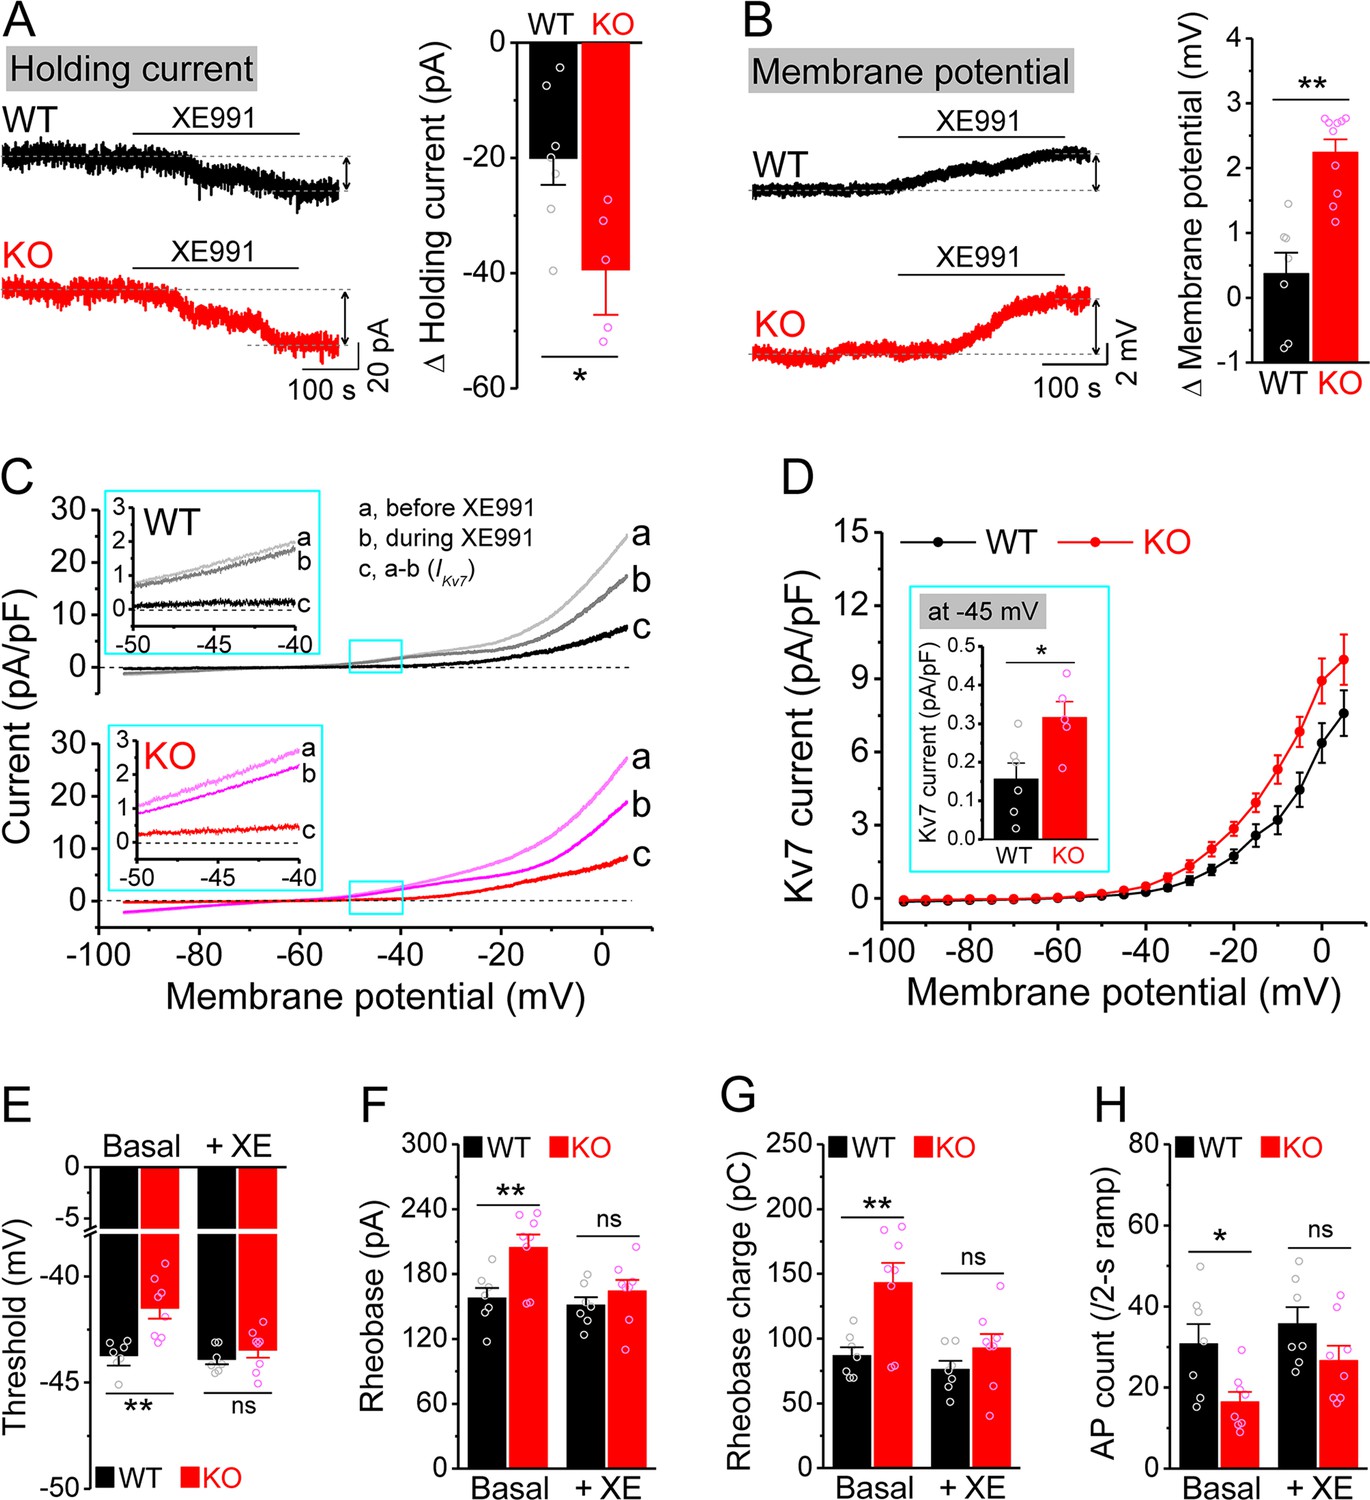
Enhanced Kv7 function causes hypo-excitability of Fmr1 knockout (KO) mossy cells (MCs).
(A) Changes in holding current at –45 mV in response to XE991. Left, sample traces; right, summary data. (B) Changes in membrane potential in response to XE991 when the initial potential being set at –45 mV. Left, sample traces; right, summary data. (C) Kv7 current was induced by a ramp protocol (from –95 to +5 mV with a rate of 0.02 mV/ms) and determined by XE991 sensitivity. Insets, the enlargements of boxed areas in main traces. (D) The I–V curves were constructed from ramp-evoked Kv7 currents every 5 mV (quasi-steady-state current, averages over 0.01 mV intervals) and normalized to respective cell capacitances. Inset, Kv7 current at –45 mV. (E–H) Increased threshold (E), rheobase (F), and rheobase charge transfer (H), as well as decreased number of action potentials (APs) (H) in pharmacologically isolated KO MCs. XE991 abolished these differences between genotypes. *p<0.05; **p<0.01; ns, not significant. The statistical data are listed in Supplementary file 1. Data are mean ± SEM.
Figure 3—figure supplement 1
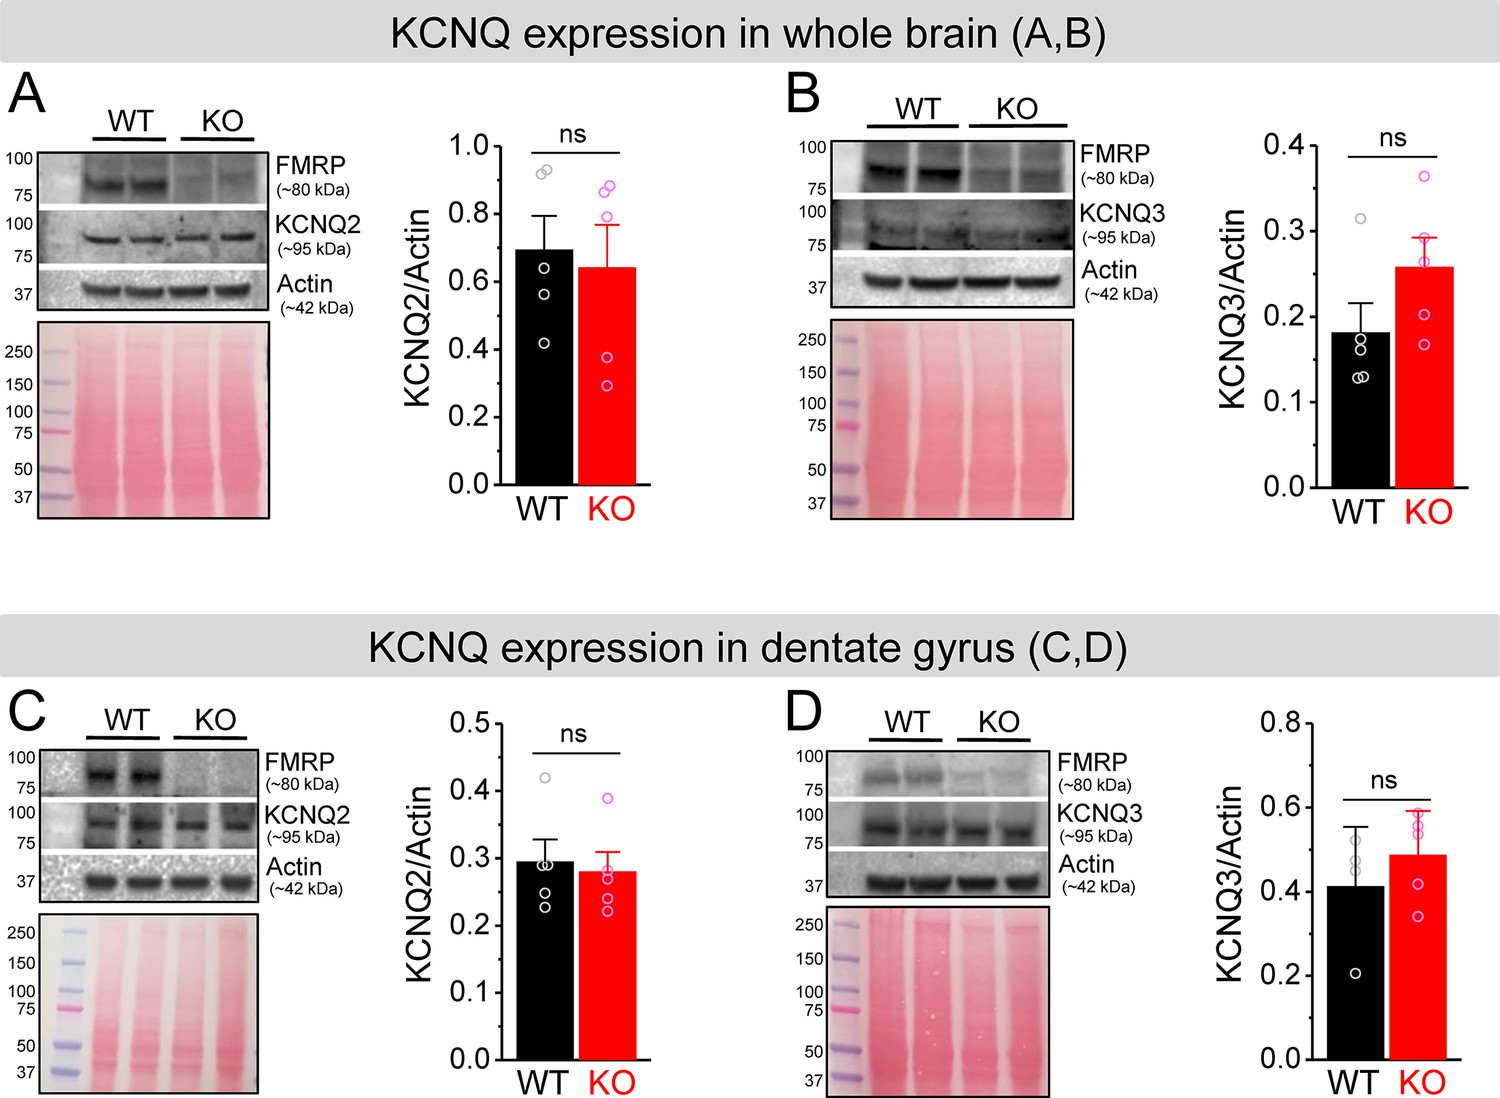
No changes in KCNQ2 and KCNQ3 expression in Fmr1 knockout (KO) mice.
(A, B) Western blot analysis of KCNQ2 (A) and KCNQ3 (B) in the whole brain lysate. Ponceau staining was used as a loading control for the lysate (lower panel). (C, D) The same as (A, B), but for dentate gyrus lysate. ns, not significant. The statistical data are listed in Supplementary file 1. Data are mean ± SEM.
-
Figure 3—figure supplement 1—source data 1
Original data for the western blot analysis in Figure 3—figure supplement 1.
- https://cdn.elifesciences.org/articles/92563/elife-92563-fig3-figsupp1-data1-v1.zip
-
Figure 3—figure supplement 1—source data 2
Original data for the western blot analysis in Figure 3—figure supplement 1 with relevant bands labeled.
- https://cdn.elifesciences.org/articles/92563/elife-92563-fig3-figsupp1-data2-v1.pdf
Figure 4 with 1 supplement
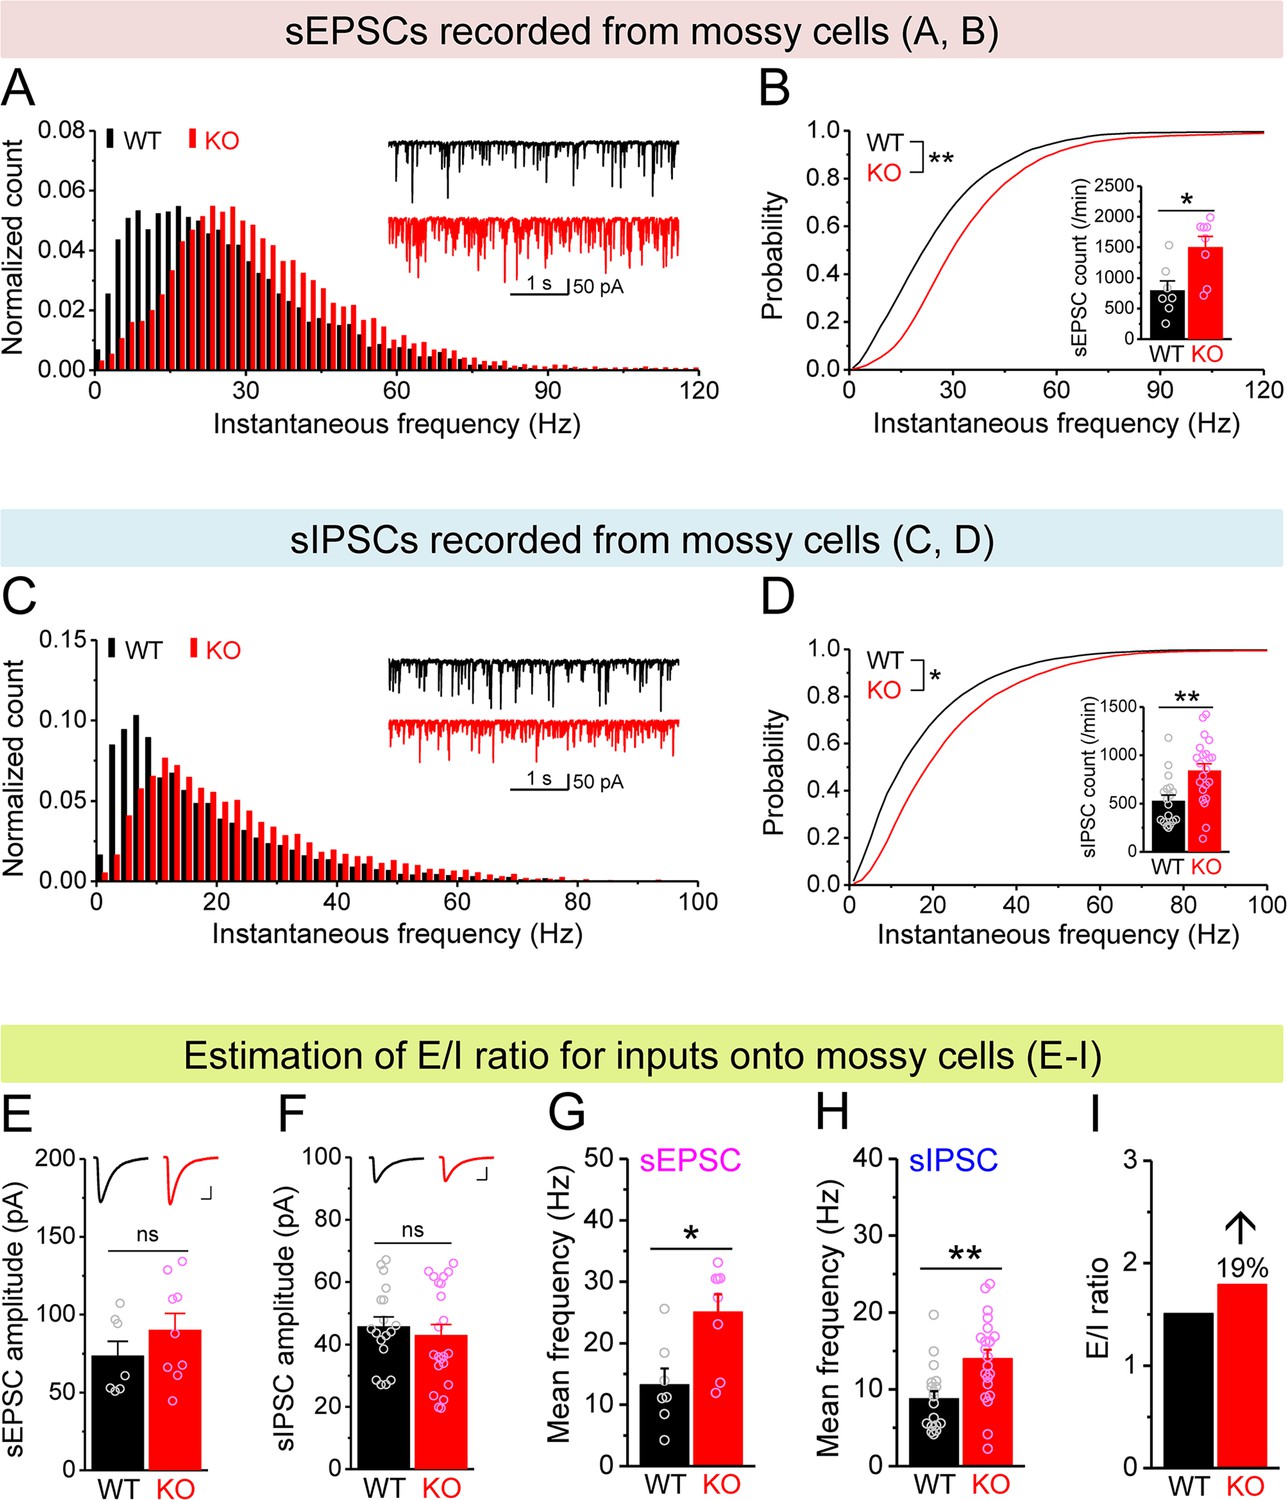
Increased excitation/inhibition (E/I) ratio of inputs onto Fmr1 knockout (KO) mossy cells (MCs).
(A) Distribution of spontaneous excitatory postsynaptic current (sEPSC) instantaneous frequency in MCs. A bin size of 2 Hz was used to calculate sEPSC frequency distribution from a 30-s-long trace per cell. The number of sEPSCs within each bin was normalized to the total number of the respective cells for pooling the data from all cells. Note that sEPSC events in KO mice had a shift toward high frequency. Inset, sample traces of sEPSCs for wildtype (WT) (black) and KO (red) mice. (B) Cumulative probability of sEPSC instantaneous frequency in MCs. Bar graph, number of sEPSCs per minutes. Note that both cumulative probability and number of sEPSCs reveal increased excitatory drive onto MCs. (C, D) Spontaneous inhibitory postsynaptic currents (sIPSCs) recorded from KO and WT MCs, aligned in the same way as in (A, B), respectively. The IPSC signals were downward here and also in Figure 5, Figure 4—figure supplement 1, and Figure 5—figure supplement 1, due to a high chloride electrode solution being used in these experiments. Note the increased sIPSC frequency and number in KO MCs. (E, F) Summary data for sEPSC amplitude (E) and sIPSC amplitude (F) recorded from MCs. Insets, sample sEPSC (E) and sIPSC (F) events for WT (black) and KO (red) MCs. Scale: 5 ms (horizontal) and 25 pA (vertical). (G, H) Mean frequency of sEPSCs (G) and sIPSCs (H) recorded from MCs. Note that loss of fragile X messenger ribonucleoprotein (FMRP) increased mean frequency of both sEPSC and sIPSC. (I) E/I ratio evaluated by sEPSC and sIPSC frequencies (mean values from G and H, respectively). Note the increased E/I ratio in Fmr1 KO mice. *p<0.05; **p<0.01; ns, not significant. The statistical data are listed in Supplementary file 1. Data are mean ± SEM.
Figure 4—figure supplement 1
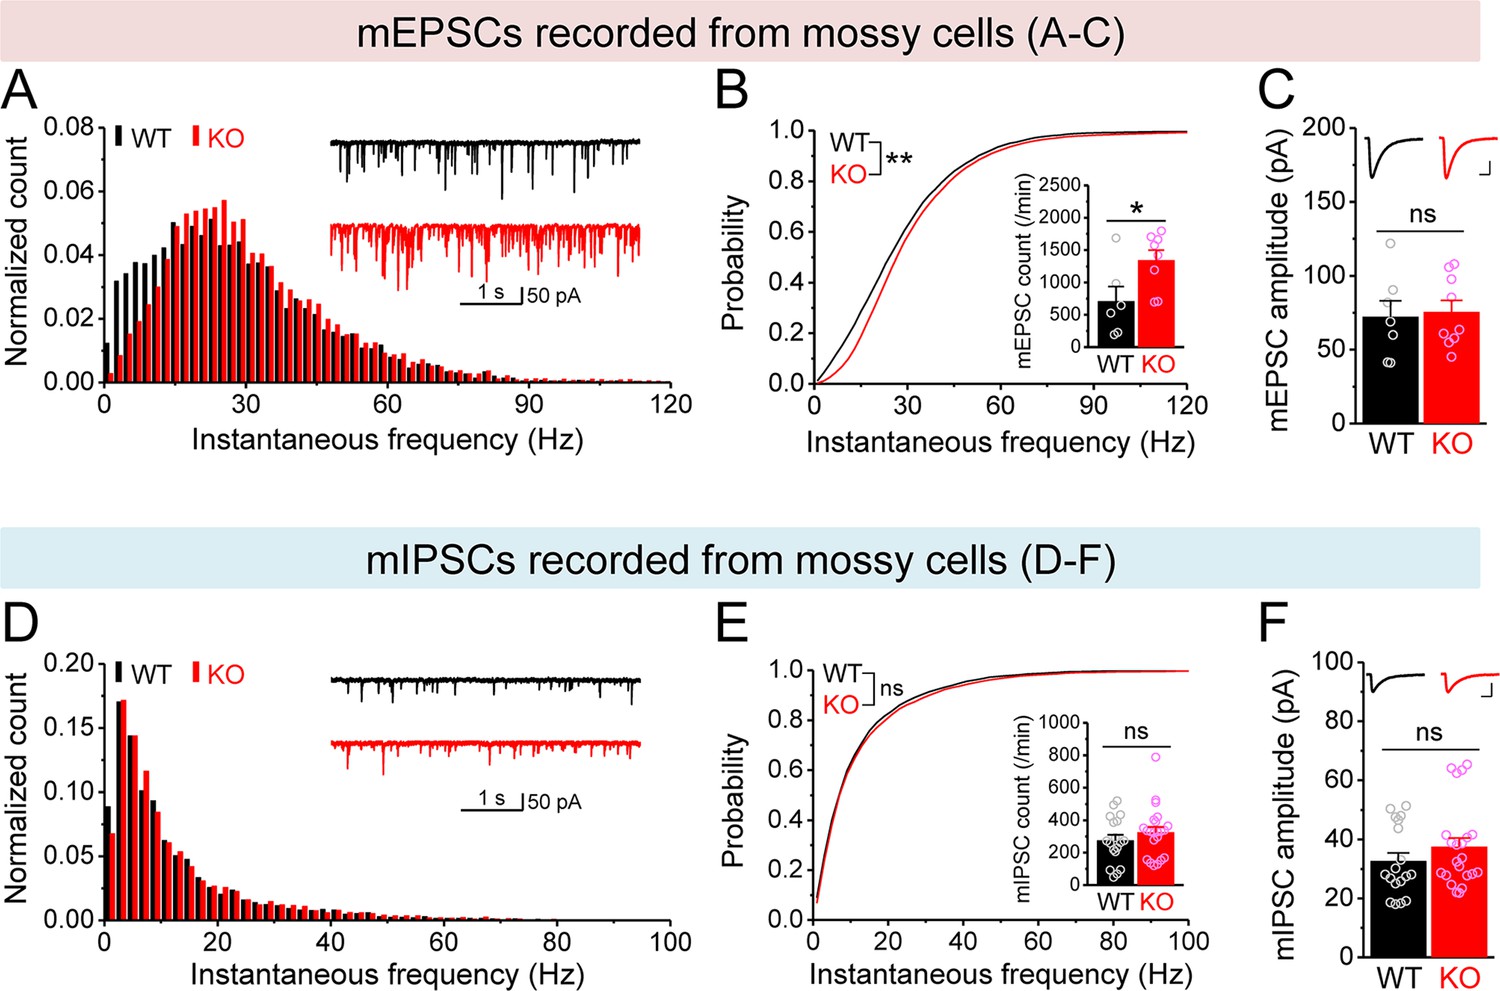
Changes in miniature synaptic inputs onto mossy cells (MCs) in Fmr1 knockout (KO) mice.
(A) Distribution of miniature excitatory postsynaptic current (mEPSC) instantaneous frequency in MCs. A bin size of 2 Hz was used to calculate mEPSC frequency distribution from a 30-s-long trace per cell. The number of mEPSCs within each bin was normalized to the total number of the respective cells for pooling the data from all cells. Note that mEPSC events in KO mice had a shift toward high frequency. Inset, sample traces of mEPSCs for wildtype (WT) (black) and KO (red) mice. (B) Cumulative probability of mEPSC instantaneous frequency in MCs. Bar graph, number of mEPSCs per minutes. Note that both cumulative probability and number of mEPSCs reveal increased excitatory drive onto MCs. (C) Summary data for mEPSC amplitude. Inset, sample mEPSC events for WT (black) and KO (red) MCs. Scale: 5 ms (horizontal) and 25 pA (vertical). (D–F) Miniature inhibitory postsynaptic currents (mIPSCs) recorded from KO and WT MCs, aligned in the same way as in (A–C), respectively. *p<0.05; **p<0.01. The statistical data are listed in Supplementary file 1. Data are mean ± SEM.
Figure 5 with 1 supplement
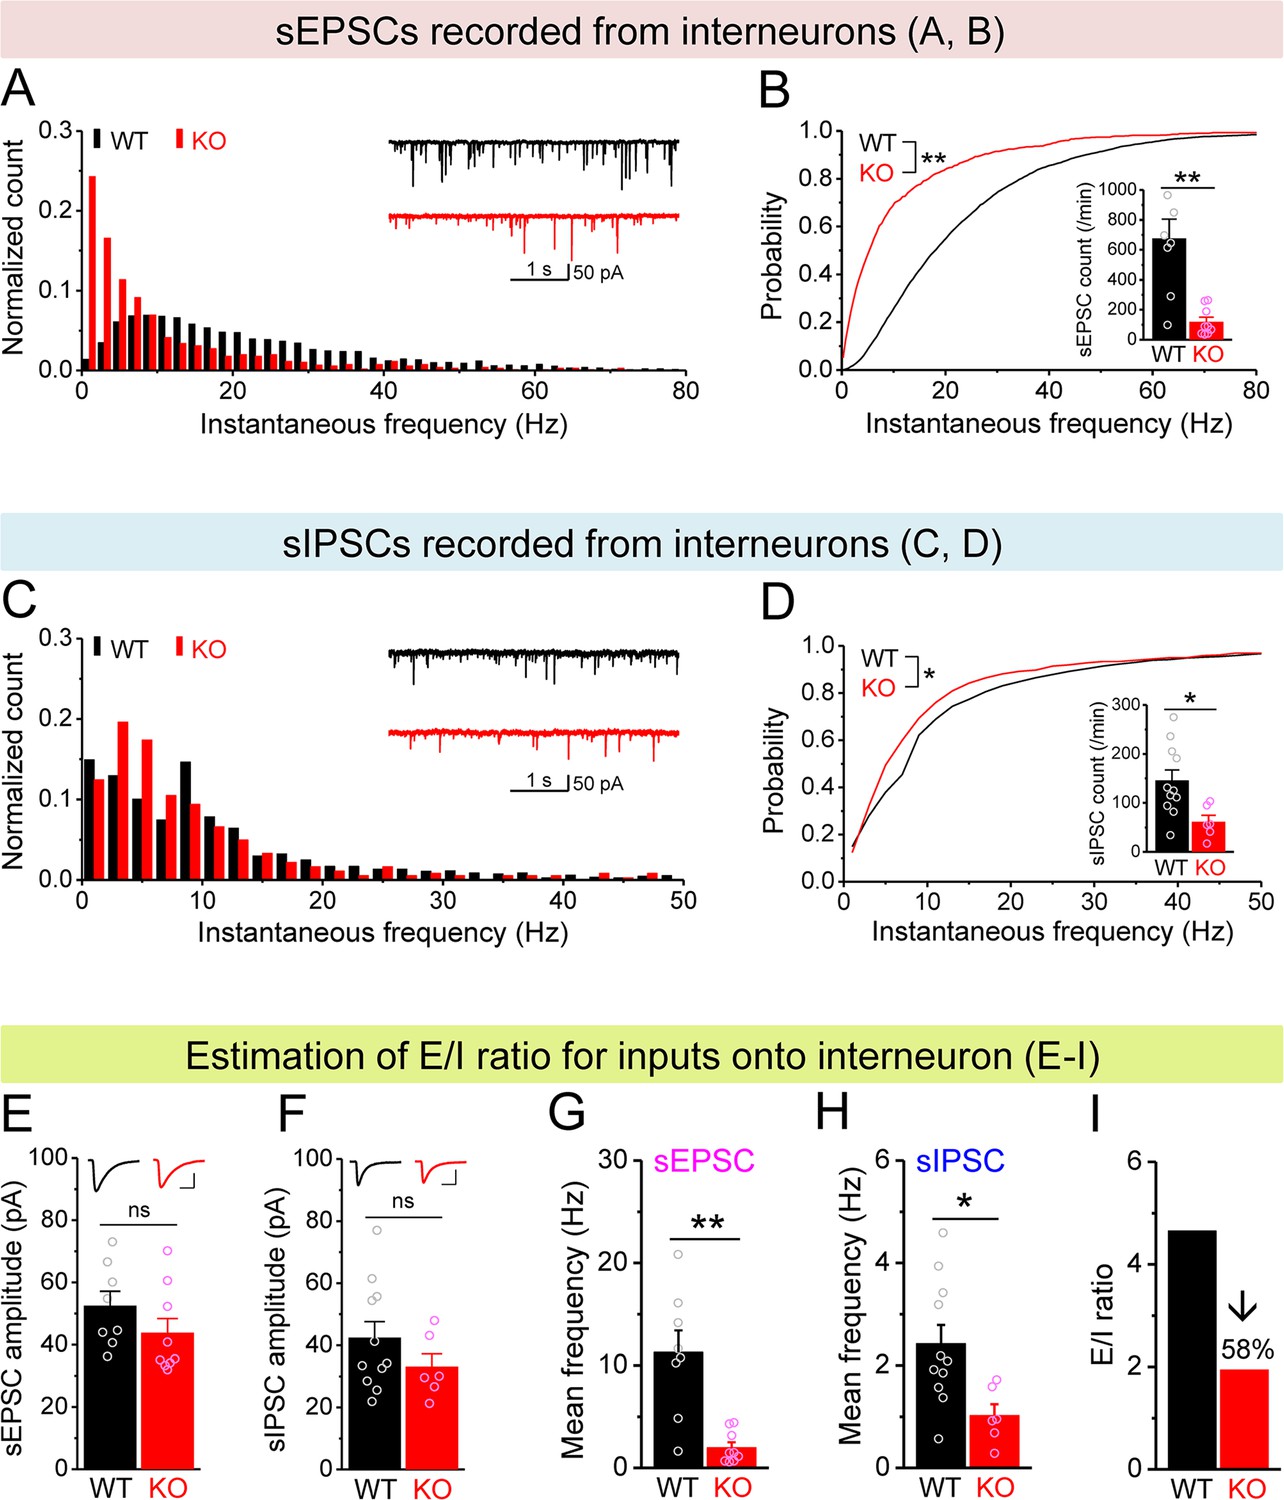
Decreased excitation/inhibition (E/I) ratio of inputs onto Fmr1 knockout (KO) hilar interneurons.
(A) Distribution of spontaneous excitatory postsynaptic current (sEPSC) instantaneous frequency in hilar interneurons. Note that KO sEPSC events had a shift toward low frequency. Inset, sample traces of sEPSCs for wildtype (WT) (black) and KO (red) interneurons. (B) Cumulative probability of sEPSC instantaneous frequency in interneurons. Bar graph shows number of sEPSCs per minutes. Note that both cumulative probability and number of sEPSCs reveal decreased excitatory drive onto interneurons. (C, D) Spontaneous inhibitory postsynaptic currents (sIPSCs) recorded from interneurons, aligned in the same way as in (A, B), respectively. Note the decreased sIPSC frequency and number in KO interneurons. (E, F) Summary data for sEPSC amplitude (E) and sIPSC amplitude (F) recorded from interneurons. Insets, sample sEPSC (E) and sIPSC (F) events for WT (black) and KO (red) mossy cells (MCs). Scale: 5 ms (horizontal) and 25 pA (vertical). (G, H) Mean frequency of sEPSCs (G) and sIPSCs (H) recorded from interneurons. Note loss of FMRP decreased mean frequency of both sEPSC and sIPSC. (I) E/I ratio evaluated by sEPSC and sIPSC frequencies in interneurons (mean values from G and H, respectively). Note the decreased E/I ratio in Fmr1 KO mice. *p<0.05; **p<0.01; ns, not significant. The statistical data are listed in Supplementary file 1. Data are mean ± SEM.
Figure 5—figure supplement 1
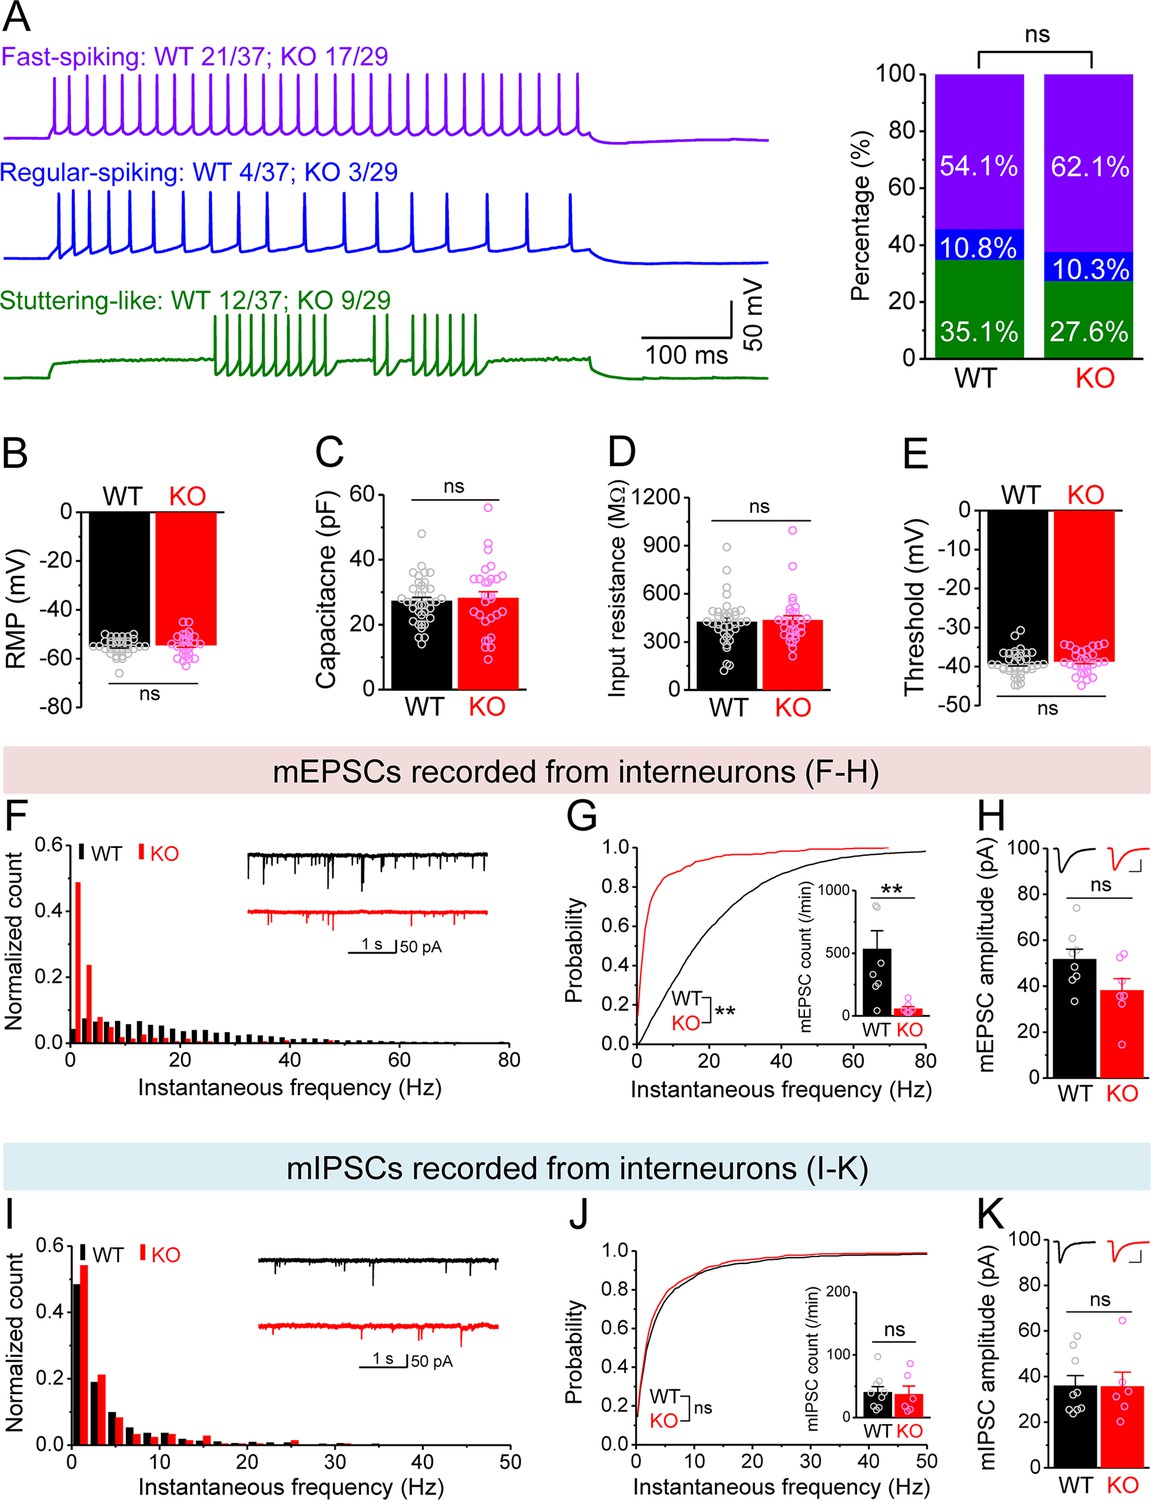
Changes in miniature synaptic inputs onto hilar interneurons in Fmr1 knockout (KO) mice.
(A) Sample traces (left) of three types of interneurons classified by firing pattern. Upper trace, fast-spiking interneurons with high-frequency non-adapting firing (wildtype [WT] 20/37 and KO 18/29, where numerator denotes the number of cells for a given type and denominator is the total number of tested cells for a given genotype); middle trace, regular-spiking interneurons with slower and adapting firing (WT 4/37, KO 3/29); lower trace, stuttering-like interneurons with high-frequency irregular bursting firing (WT 13/37, KO 8/29). Stack bar graph (right) shows the percentage of three interneuron types (color-coded as the traces in the left panel). No significant differences in the ratios of three interneuron types between WT and KO mice. (B–E) We pooled resting membrane potential (RMP) (B), capacitance (C), input resistance (D), and threshold (E) from three types of interneurons due to no significant differences observed among types. (F) Distribution of miniature excitatory postsynaptic current (mEPSC) instantaneous frequency in interneurons. A bin size of 2 Hz was used to calculate mEPSC frequency distribution from a 30-s-long trace per cell. The number of mPSCs within each bin was normalized to the total number of the respective cells for pooling the data from all cells. Note that mEPSC events in KO mice had a shift toward low frequency. Inset, sample traces of mEPSCs for WT (black) and KO (red) mice. (G) Cumulative probability of mEPSC instantaneous frequency in interneurons. Bar graph shows number of mEPSCs per minutes. Note that both cumulative probability and number of mEPSCs reveal decreased excitatory drive onto interneurons. (H) Summary data for mEPSC amplitude. Inset, sample mEPSC events for WT (black) and KO (red) mossy cells (MCs). Scale: 5 ms (horizontal) and 25 pA (vertical). (I–K) Miniature inhibitory postsynaptic currents (mIPSCs) recorded from KO and WT interneurons, aligned in the same way as in (F–H), respectively. **p<0.01; ns, not significant. The statistical data are listed in Supplementary file 1. Data are mean ± SEM.
Figure 6
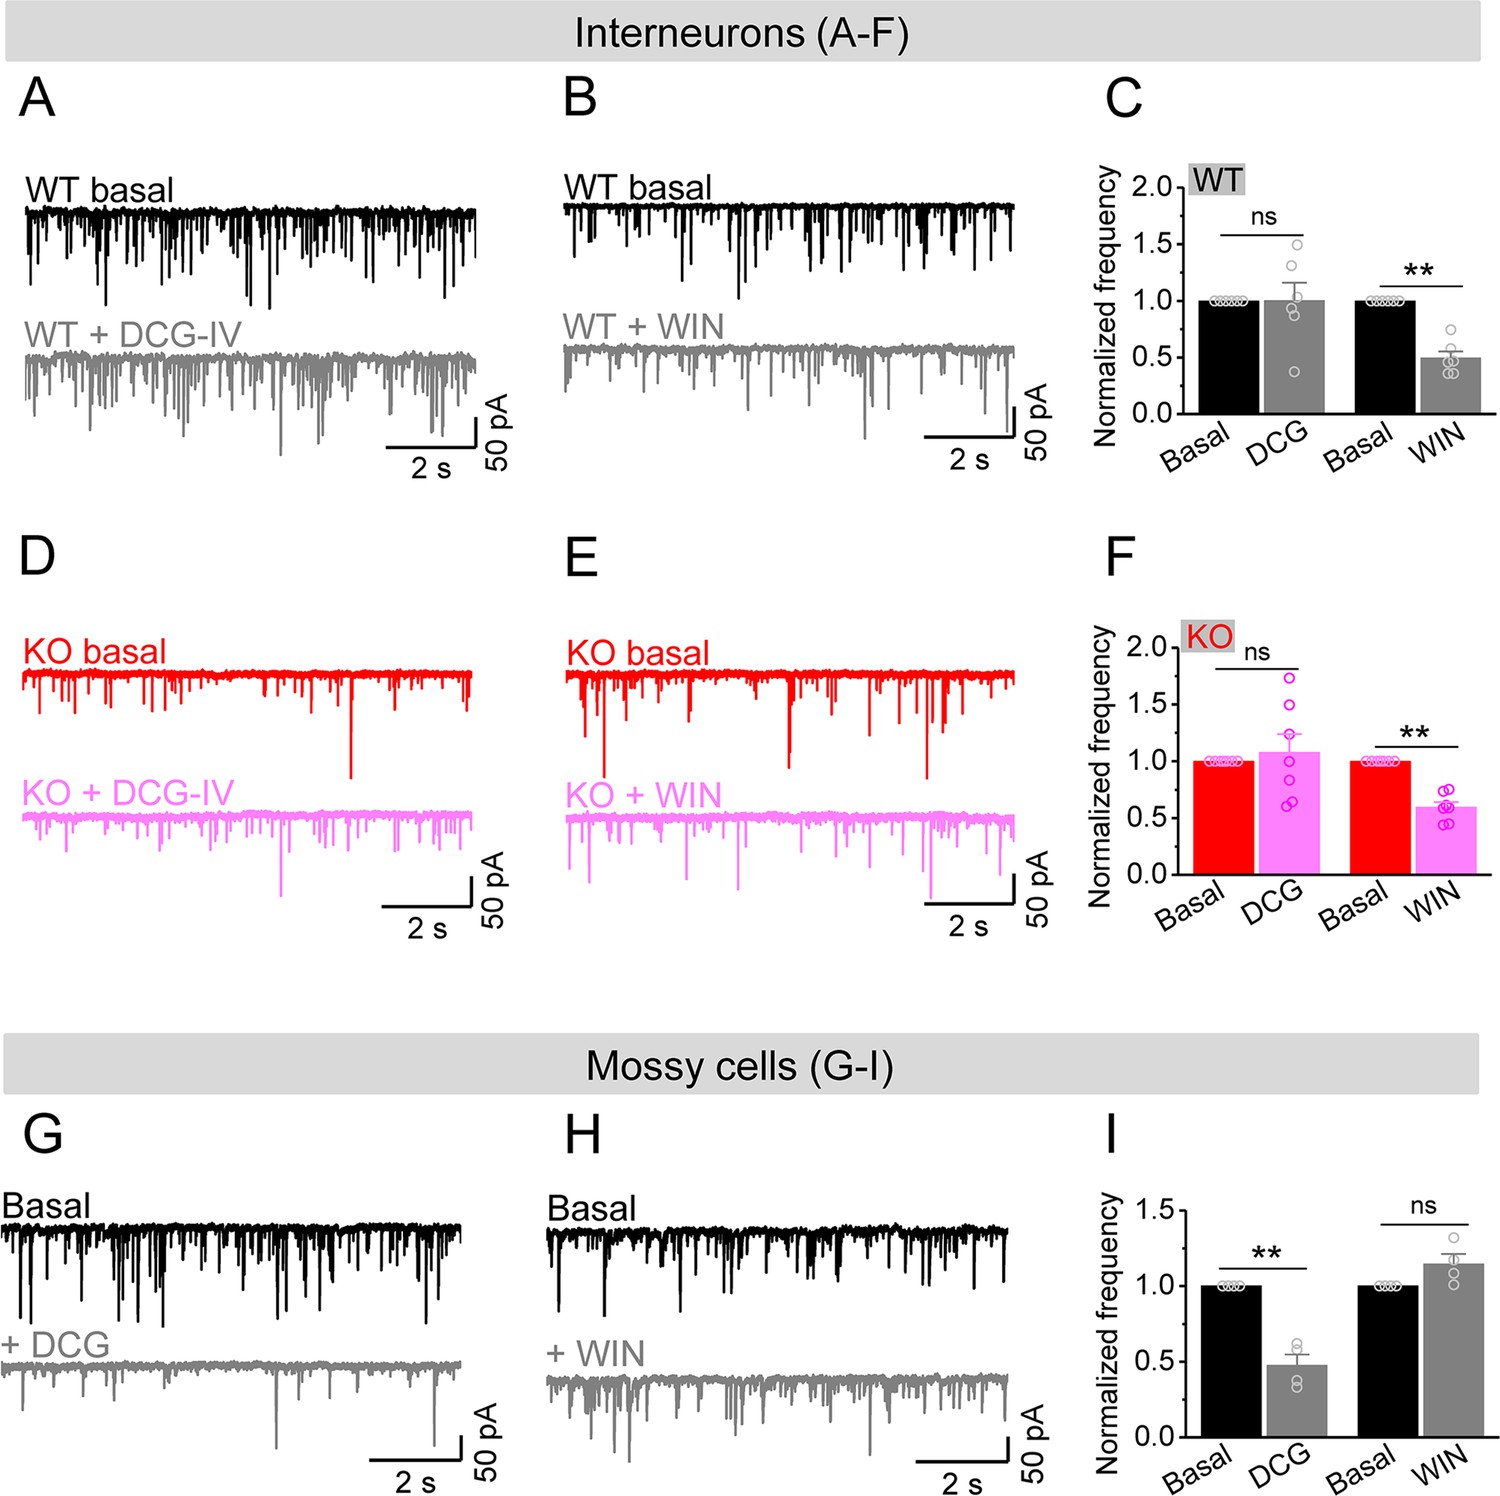
Mossy cells (MCs) provide the main excitatory drive onto hilar interneurons.
(A) Sample traces of spontaneous excitatory postsynaptic currents (sEPSCs) recorded from an interneuron of wildtype (WT) mouse before and during DCG-IV. (B) The same as in (A), but for WIN55212-2 in an interneuron of WT mouse. (C) Effect of DCG-IV or WIN55212-2 on the sEPSC normalized frequency recorded from interneurons of WT mice. (D–F) The same as in (A–C) but for interneurons of knockout (KO) mice. Note that WIN55212-2 had comparable effects on normalized frequency of sEPSCs in KO and WT interneurons, but DCG-IV did not have measurable effects on both genotypes. (G) Control experiment showing effectiveness of DCG-IV. Sample traces of sEPSCs recorded from MCs before and during DCG-IV. (H) Sample traces of sEPSCs recorded from MCs before and during WIN 55212-2. (I) Summary data of changes in the normalized frequency of MC sEPSCs in response to DCG-IV (47.6 ± 7.2% of basal) and WIN55212-2 (114.5 ± 6.7% of basal). Note that, compared to interneurons (A–F), MCs exhibited opposite response to these two agonists, indicating the effectiveness of both agonists. **p<0.01; ns, not significant. The statistical data are listed in Supplementary file 1. Data are mean ± SEM.
Figure 7 with 2 supplements
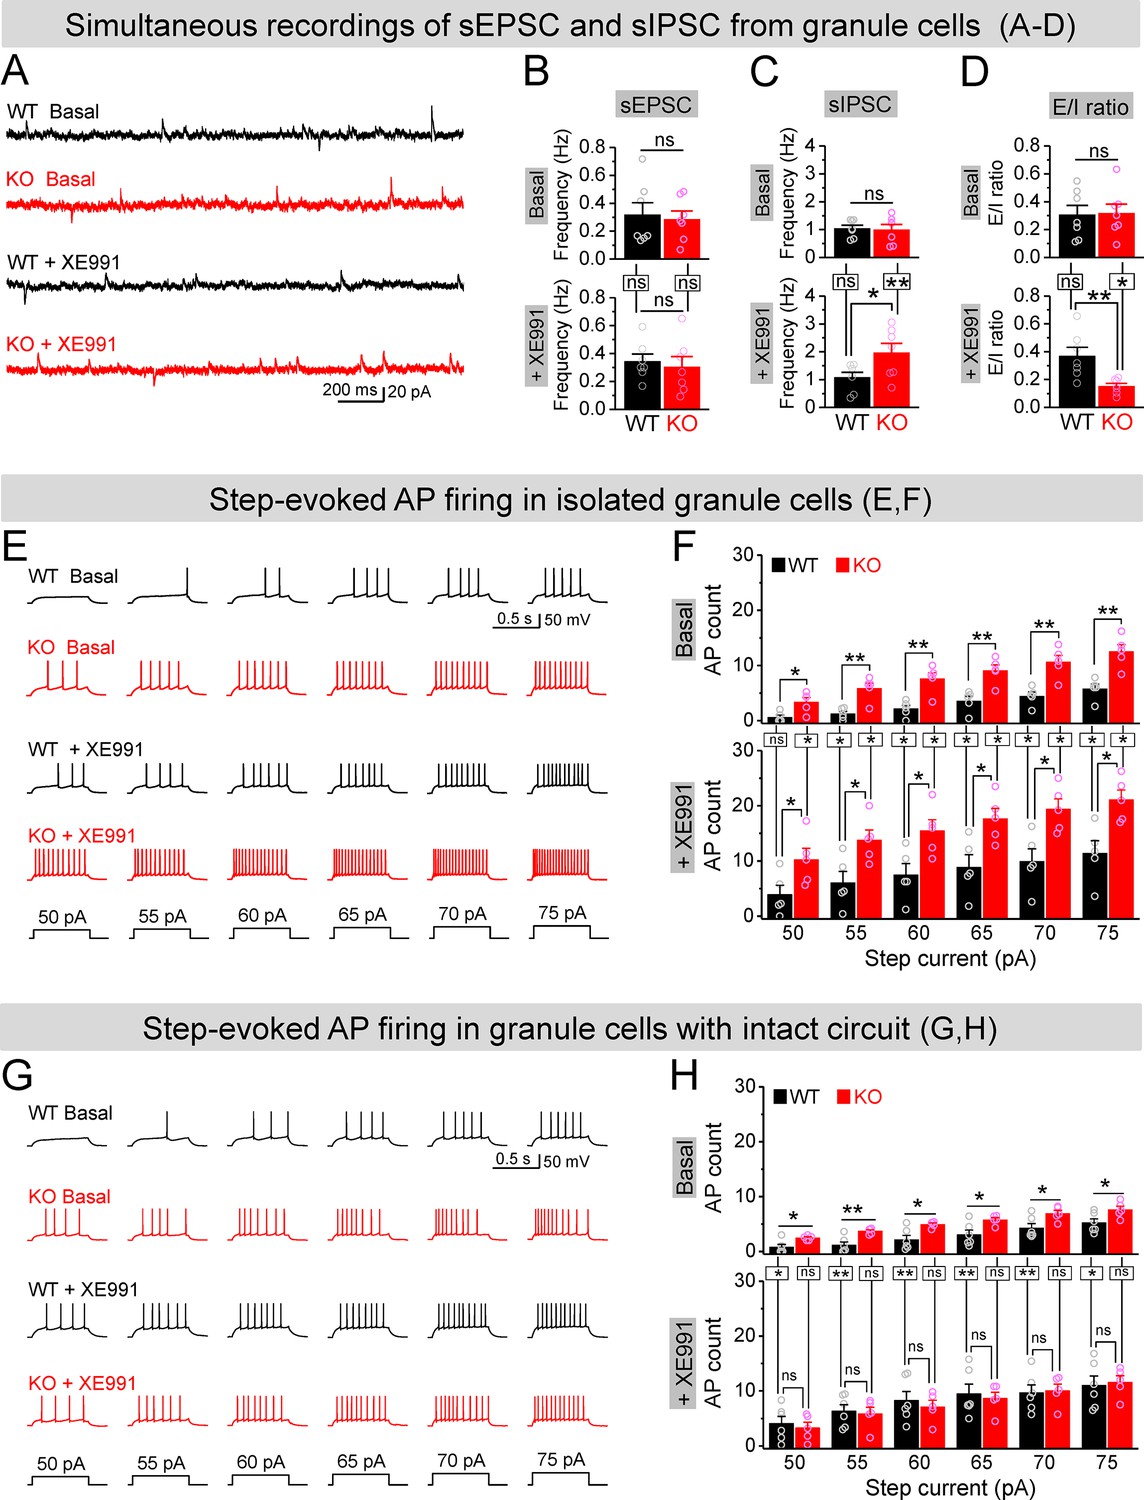
Circuit-wide inhibition of Kv7 channels boosted inhibitory drive onto granule cells in Fmr1 knockout (KO) mice.
(A) Sample traces of simultaneous recording of spontaneous excitatory postsynaptic current (sEPSC) (downward events) and spontaneous inhibitory postsynaptic current (sIPSC) (upward events) from granule cells (also see Figure 7—figure supplement 2A). (B) Summary data for sEPSC mean frequency in basal (upper) and during XE991 (lower). Horizontal lines (with or without dropdown) denote comparison between genotypes; vertical lines indicate comparison between before and during XE991 within genotypes. (C) The same as in (B), but for sIPSC simultaneously recorded from the same granule cells. Note that XE991 increase sIPSC frequency only in KO mice, but not in wildtype (WT) mice. (D) Excitation/inhibition (E/I) ratio evaluated by frequency. XE991 (lower) significantly decreased the E/I ratio in KO mice only. (E) Evaluation of granule cell excitability by recording action potentials (APs). Sample traces for multistep-current (lowermost panel) evoked APs in WT and KO granule cells in the pharmacologically isolated granule cells in the absence (upper) or presence of XE991 (lower). (F) Summary data for number of APs exemplified in (E) showing increased excitability of the pharmacologically isolated granule cells in the absence (upper) or presence of XE991 (lower). Also, note that XE991 increased number of AP in both WT and KO granule cells. Horizontal lines (with dropdown) denote comparison between genotypes; vertical lines indicate comparison between in the absence and presence of XE991 within genotypes. (G) The same as in (E), but for granule cells with intact dentate circuit. (H) The same as in (F), but for granule cells with intact circuit. Note that XE991 abolished the difference of AP count between genotypes. *p<0.05; **p<0.01; ns, not significant. The statistical data are listed in Supplementary file 1. Data are mean ± SEM.
Figure 7—figure supplement 1
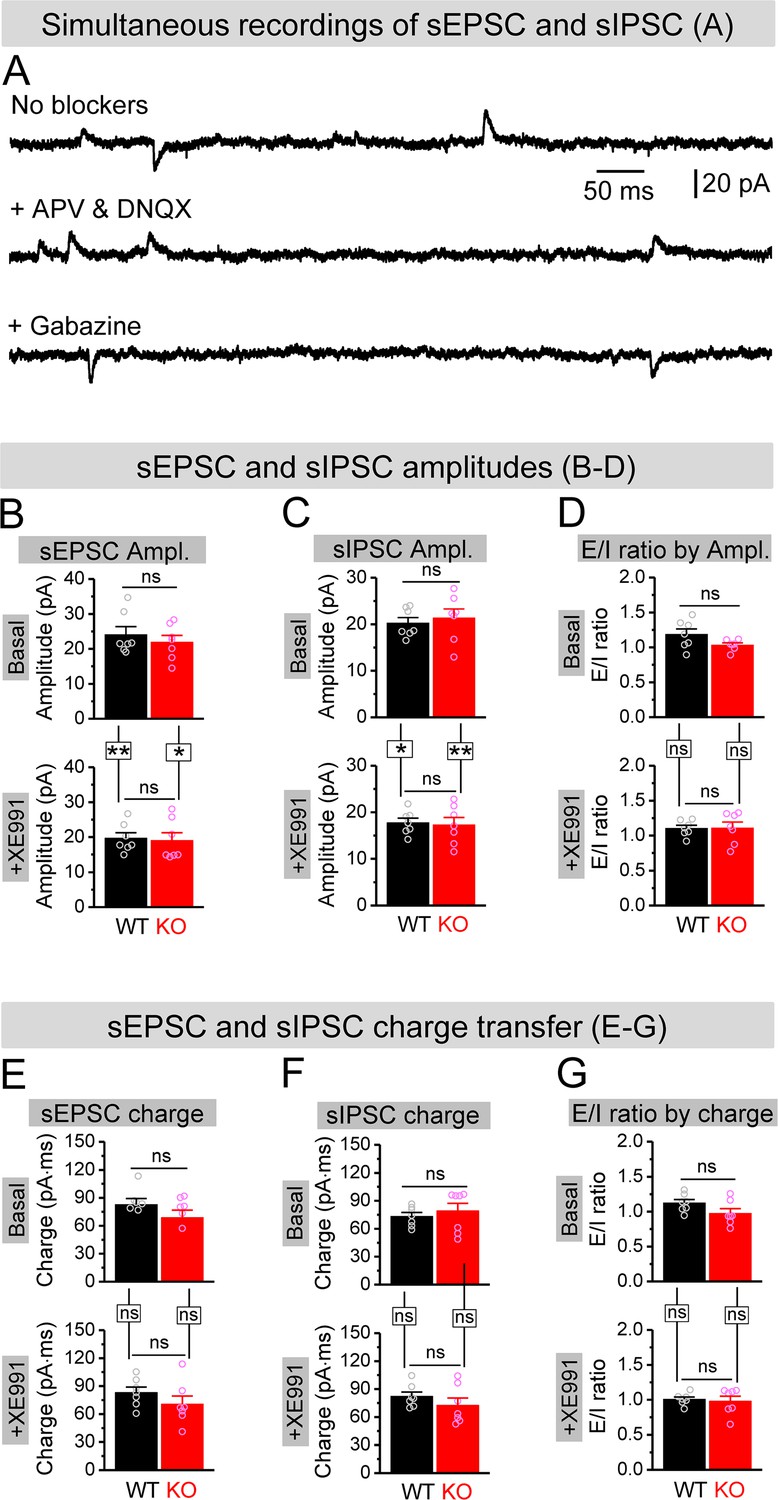
Effect of XE991 on spontaneous synaptic inputs onto granule cells.
(A) Example traces for simultaneous recording of spontaneous excitatory postsynaptic current (sEPSC) and spontaneous inhibitory postsynaptic current (sIPSC) from granule cells (holding at –40 mV). In the absence of blockers against glutamate and GABA ionotropic receptors, both sEPSC (downward) and sIPSC (upward) were exhibited (upper trace). In the presence of APV and DNQX (blockade of NMDA and AMPA receptors), only upward sIPSC was kept (middle trace). In contrast, in the presence of gabazine (blockade of GABAA receptors), only downward sEPSC was observed (lower trace). (B, C) Amplitudes of simultaneously recorded sEPSC (B) and sIPSC (C) before (basal, upper bars) and during XE991 (+XE991, lower bars). (D) Excitation/inhibition (E/I) ratio evaluated by amplitude before (basal, upper bars) and during XE991 (+XE991, lower bars). (E, F) The same as (B, C), but for charge transfers of simultaneously recorded sEPSC (E) and sIPSC (F). (G) The same as (D), but evaluated by charge transfer. *p<0.05; **p<0.01; ns, not significant. Horizontal lines denote comparison between genotypes; vertical lines indicate comparison between before and during XE991 within genotypes. The statistical data are listed in Supplementary file 1. Data are mean ± SEM.
Figure 7—figure supplement 2
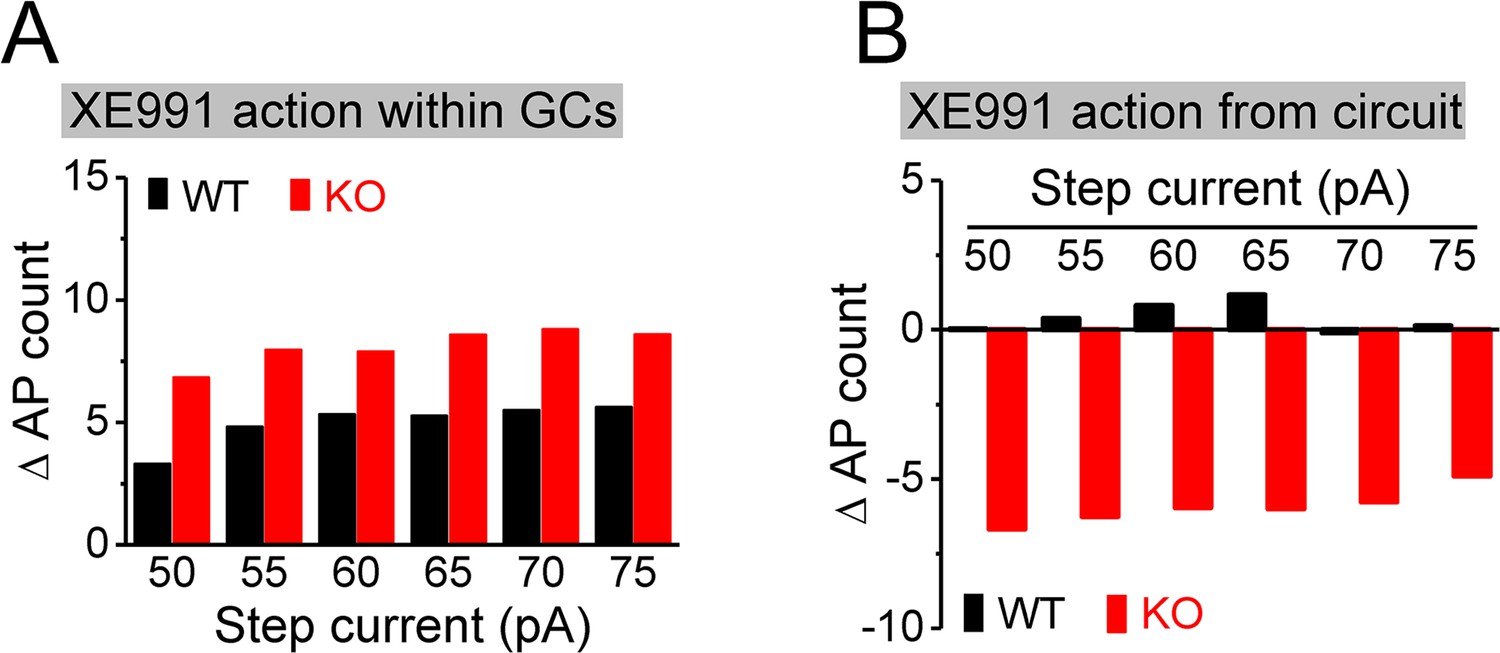
Estimation of direct and circuit effects of XE991 on granule cell (GC) excitability.
(A) XE991 can directly increase excitability of GCs, leading to increase action potential (AP) firing. The direct effect of XE991 on AP firing was defined as the differences between before and during XE991 in the isolated GCs (Figure 7F), that is, values of (7Flower – 7Fupper), where 7Flower and 7Fupper are the mean values from Figure 7F lower and upper panels, respectively. Note that XE991 directly increases number of AP largely independent of step current intensity in both genotypes, but with relative larger effect in knockout (KO) mice. (B) XE991 can also modulate GC excitability to change AP firing via its circuit effect. Values were estimated from the differences before and during XE991, between isolated GCs (Figure 7F) and GCs with intact circuit (Figure 7H), that is, values of [(7Hlower – 7Hupper) - (7Flower – 7Fupper)], where 7F and 7H are the mean values from Figure 7F and H (lower or upper panel, accordingly). Note that the circuit effect of XE991 on AP firing was also independent of step current intensity (little effect in WT mice as shown by values fluctuating around 0; but dampening ~6 APs in KO mice).
Figure 8 with 3 supplements
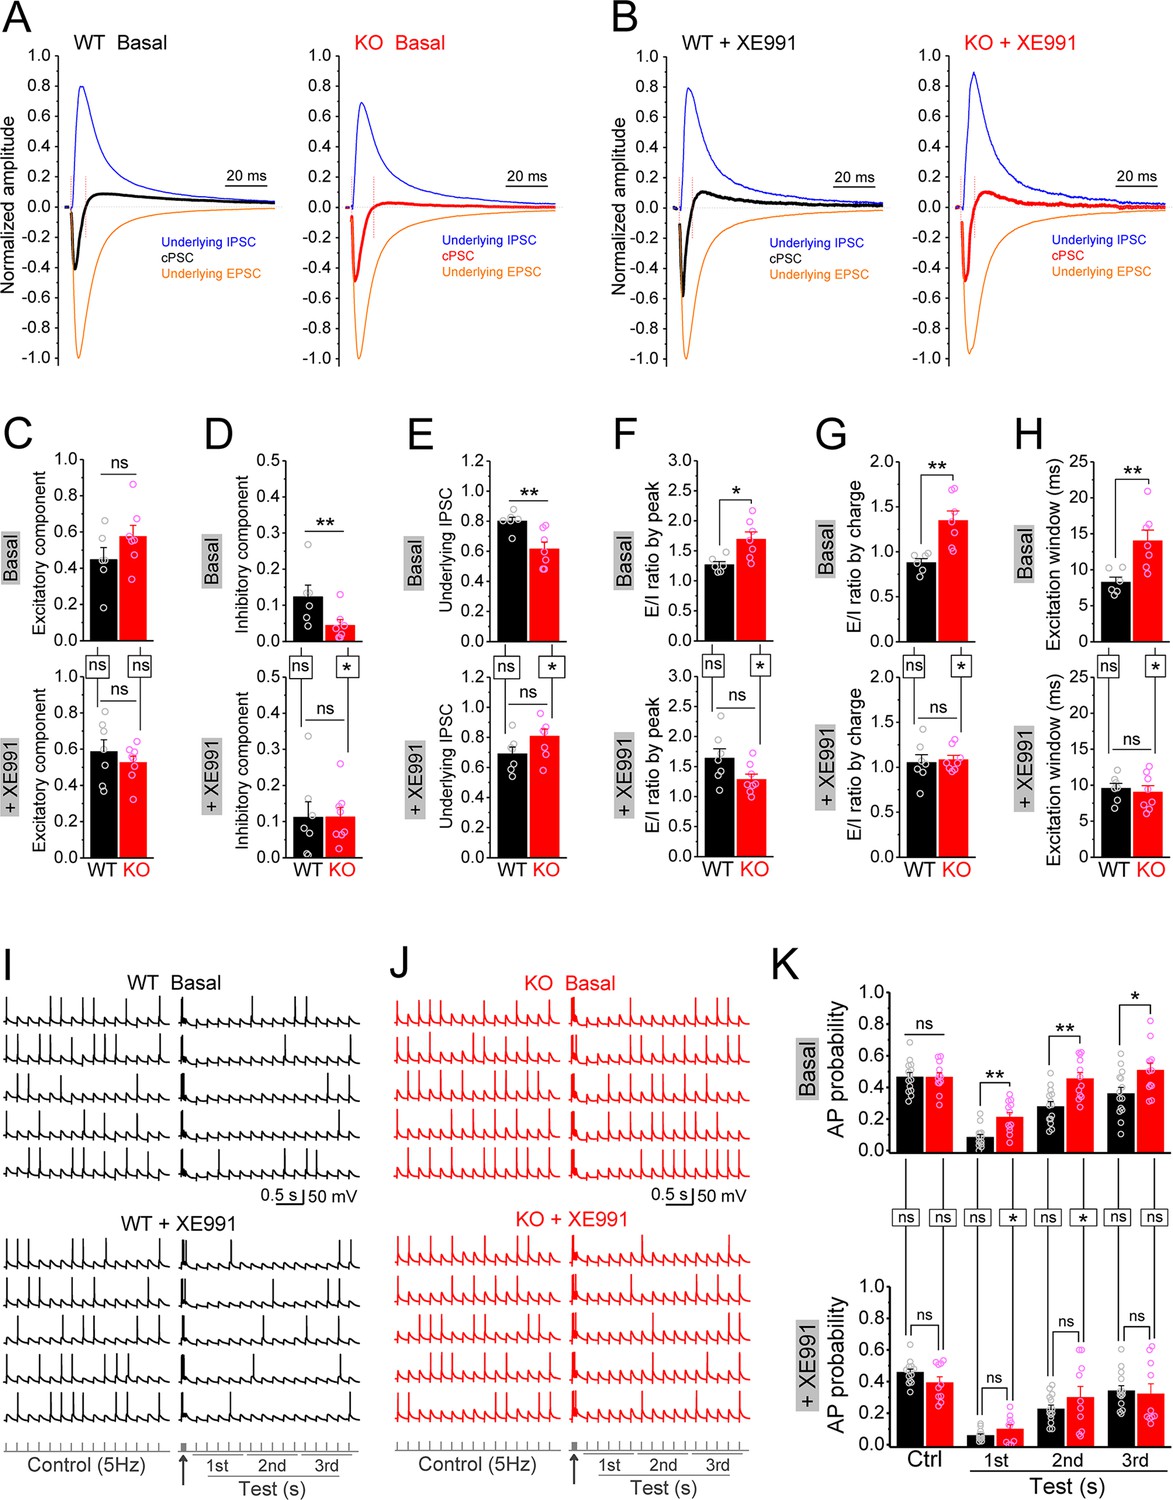
Circuit-wide inhibition of Kv7 channels restored dentate output during theta–gamma coupling stimulation in Fmr1 knockout (KO) mice.
(A) Sample traces of perforant path (PP)-stimulation-evoked compound postsynaptic currents (cPSC) and their respective underlying excitatory postsynaptic current (EPSC) and inhibitory postsynaptic current (IPSC), in the basal state. For better comparison, the traces were normalized to their own underlying EPSC, which reflects stimulation intensity. Red vertical lines denote the excitation window that is summarized in (H). Stimulation artifacts were removed and baseline before stimulation was shifted to be 0 for presentation purpose. (B) The same as in (A), but in the presence of XE991. (C–E) Summary data of normalized excitatory component (C), inhibitory component (D), and underlying IPSC (E), in the absence (basal, upper panels) and presence of XE991 (+XE991, lower panels). (F) Summary data of excitation/inhibition (E/I) ratio evaluated by the peaks of underlying EPSC and IPSC in the absence (basal, upper panel) and presence of XE991 (+XE991, lower panel). (G) The same as in (F), but evaluated by the charge transfers of underlying EPSC and IPSC. (H) Summary data of excitation window in the absence (basal, upper panel) and presence of XE991 (+XE991, lower panel). (I) Sample traces of theta–gamma coupling stimulation-evoked action potentials (APs) in granule cells from wildtype (WT) mice, in the absence of (basal, upper panel) or presence of XE991 (+XE991, middle panel). Lower panel shows stimulation protocols: control, 15 stimuli at 5 Hz; test, a burst of gamma stimulation (five stimuli at 50 Hz, arrow) 200 ms before 15 stimuli at 5 Hz. AP probability in test train was calculated in 1-s-bin (i.e., binned in first, second, or third second) and plotted in (K). (J) The same as in (I), but for KO mice. (K) Summary data of gamma suppression of dentate output in response to PP stimulation at theta frequency in the absence of (basal, upper) or presence of XE991 (+XE991, lower). Note loss of fragile X messenger ribonucleoprotein (FMRP) compromised gamma suppression of AP output in granule cells, and Kv7 blocker XE991 restored the gamma burst-induced suppressive effect on dentate output in Fmr1 KO mice. *p<0.05; **p<0.01; ns, not significant. Horizontal lines (with or without dropdown) denote comparison between genotypes; vertical lines indicate comparison between in the absence and presence of XE991 within genotypes. The statistical data are listed in Supplementary file 1. Data are mean ± SEM.
Figure 8—figure supplement 1
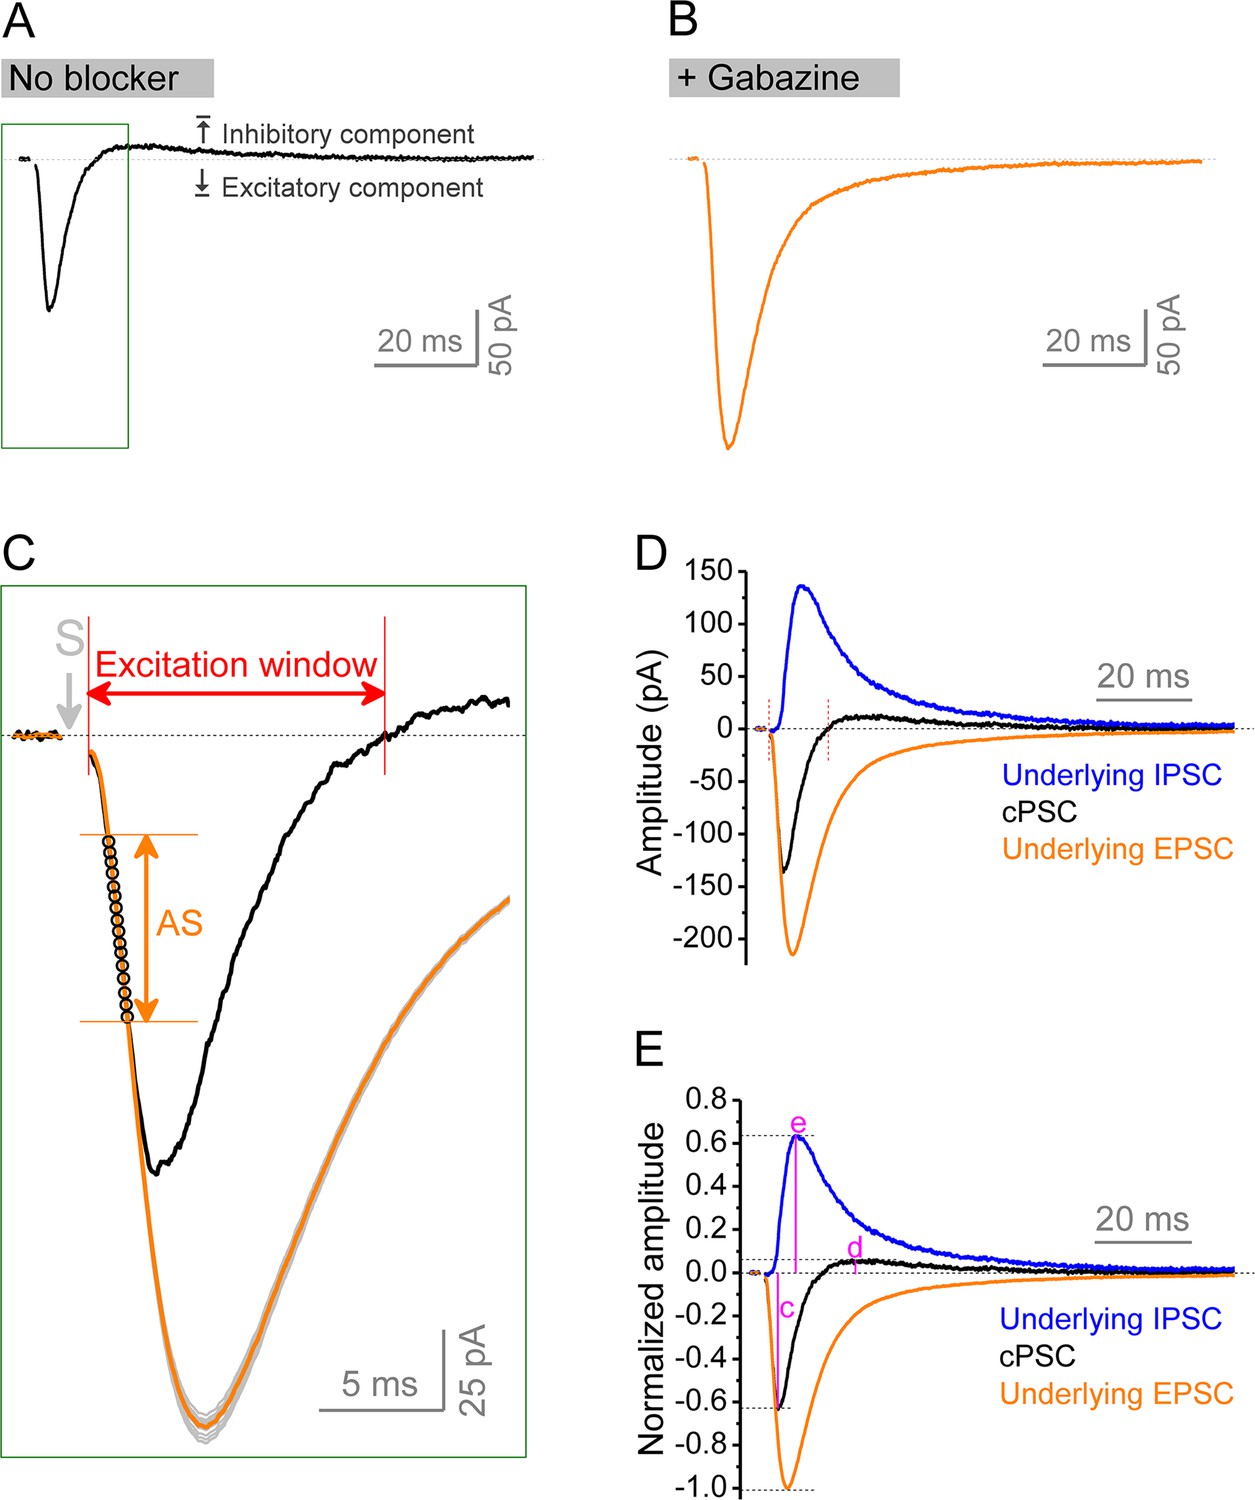
Isolation of underlying excitatory postsynaptic current (EPSC) and inhibitory postsynaptic current (IPSC) from compound postsynaptic current (cPSC).
(A, B) cPSC was recorded from granule cells by holding membrane potential at –45 mV. The cPSC (A) shows an initial excitatory component (downward) followed by an inhibitory component (upward). Dotted line denotes the baseline before stimulation. At the end of each recording, the pure EPSC (B) was recorded by keeping the same stimulation intensity and in the presence of gabazine, which was used to create EPSC template (an average of at least 20 uncontaminated EPSCs) for the same cell. Note that the amplitude and decay trajectory of pure EPSC were largely different from excitatory component of cPSC. Stimulation artifacts were removed. Boxed area in (A) was enlarged to show the procedure of approximation of underlying EPSC. (C) Zoom-in of boxed area in (A) showing approximation of underlying EPSC. The EPSC template was repeatedly scaled to each data point (black circles) of cPSC ‘approximating segment’ (AS) to obtain a set of scaled EPSCs (gray traces). All scaled EPSCs were then averaged to approximate an underlying EPSC (orange trace) for a given cPSC (black trace). The cPSC ‘approximating segment’ was defined as 25–65% height of cPSC excitatory component (but not beyond 2.5 ms after stimulation). Excitation window was defined as the full duration of cPSC excitatory component. Stimulation artifact was removed. ‘S’ denotes the stimulation time point. (D) The underlying IPSC (blue trace) was isolated by subtracting the underlying EPSC (orange trace as that in C) from corresponding cPSC (black trace). For the purpose of view, the baseline before stimulation was shifted to be 0 in the figure. The two vertical red lines delimit the excitation window. (E) Normalized traces of cPSC, underlying EPSC and IPSC. For better comparison, we normalized the cPSC and underlying IPSC to their respective underlying EPSC, which reflects the PP stimulation intensity. The underlying EPSC and IPSC were then used to estimate excitation/inhibition (E/I) ratio by their peak amplitudes or charge transfers (amplitude-time integration within 100 ms). The letters (c), (d), and (e) indicate the normalized peak amplitudes of cPSC excitatory, inhibitory components, and underlying IPSC, which are summarized in Figure 8C, D and E, respectively.
Figure 8—figure supplement 2
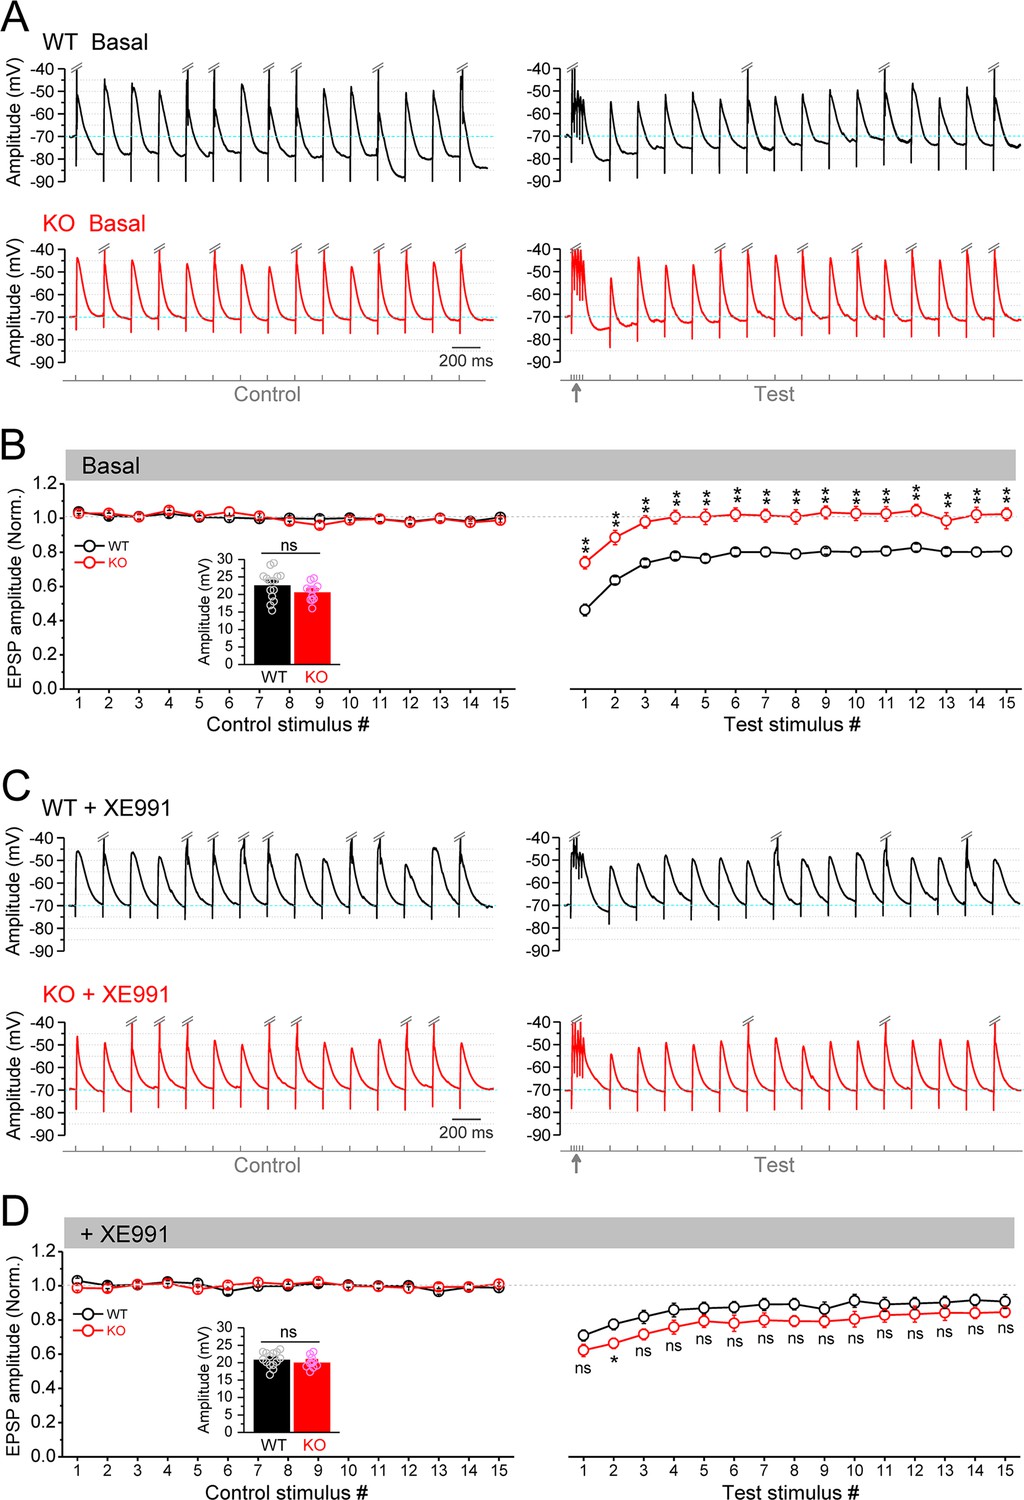
Circuit-wide inhibition of Kv7 channels enhanced the gamma burst-induced suppression of EPSP (excitatory postsynaptic potential) integration in Fmr1 knockout (KO) mice.
(A) Sample traces of EPSP in response to theta–gamma coupling stimulation of perforant path (PP). Traces were zoomed in vertically (i.e., amplitude dimension) and action potentials (APs) were truncated (indicated by double-slash) to emphasize EPSP size. Excitatory postsynaptic current (EPSC) amplitude was defined by the voltage difference between EPSC peak and –70 mV level (cyan line). Lowermost panel shows the stimulation paradigm. Up-pointing arrow indicates gamma stimulation. (B) Summary data for experiments exemplified in (A) showing stable EPSP amplitude in control stimulation (left panel) and gamma suppression of EPSP amplitude (right panel). Inset, real EPSP amplitude in control stimulation. (C) The same as in (A), but in the presence of XE991. (D) The same as in (B), but in the presence of XE991. Note that XE991 significantly dampened EPSP amplitude in KO mice (right panel) and the EPSP were largely comparable between genotypes. *p<0.05; **p<0.01; ns, not significant. The statistical data are listed in Supplementary file 1. Data are mean ± SEM.
Figure 8—figure supplement 3
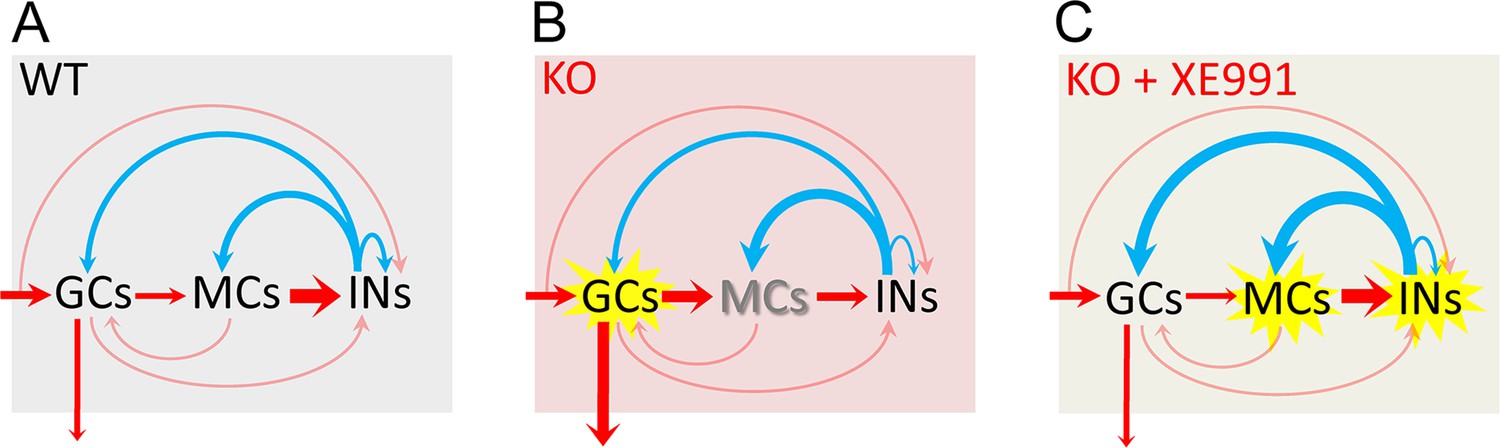
Circuit-wide inhibition of Kv7 channels corrected dentate gyrus output in Fmr1 knockout (KO) mice.
(A) The diagram shows dentate gyrus output in response to theta–gamma coupling stimulation of perforant path (PP) in the wildtype (WT) mice. Here, we focus on the three-synapse indirect feedback inhibition pathway: granule cells (GCs)→MCs→interneurons (INs)→GCs (thickness of arrows indicating synaptic drive weight). Because MCs (rather than GCs) provide the main source of excitatory drive onto INs, the three-synapse indirect feedback inhibition likely surpasses the canonical two-synapse feedback inhibition (i.e., GCs→INs→GCs). This model indicates that, in the normal condition, MCs integrate the incoming excitatory input and then relay and expand it to INs, which secure a sufficient and well-timed inhibition feedback onto GCs to maintain a dynamically balanced excitation/inhibition (E/I) inputs onto GCs and a narrow excitation window, and thus ensures sparse action potential (AP) firing in GCs. Red arrows designate excitation and blue arrows inhibition. The arrow entering shading areas from left side represents PP input (theta–gamma coupling stimulation). The downward arrow exiting the shading area indicates dentate output to CA3. The thinly semi-transparent arrows are synaptic connections whose contribution to cellular excitability has not been evaluated in this study. The thickness of arrows denotes the synaptic drive weight of excitation (or inhibition). It is noteworthy that the actual synaptic drive weight of each synapse varies dynamically to maintain the precisely well-timed circuit E/I balance and then proper information processing. Thus, one may imagine that the thickness of each arrow (i.e., synaptic drive weight) changes dynamically and sequentially (due to neurotransmission direction and synaptic delays) to understand dynamic E/I balance. (B) The same as in (A), but for KO mice. Loss of fragile X messenger ribonucleoprotein (FMRP) caused these changes (for details, see Figures 1, 4—6 and 8): (1) the GCs are hyper-excitable (highlighted by yellow explosion marker), and dentate output are increased (thicker arrow compared with that of WT mice in A); (2) MCs are hypo-excitable (shadow font) and MCs’ output are decreased (thinner arrow); (3) both excitatory and inhibitory inputs onto MCs are increased (thicker arrows); and (4) both excitatory and inhibitory inputs onto INs are reduced (thinner arrows). (C) The same as in (B), but in the presence of XE991 (circuit-wide inhibition of Kv7 channels). XE991 caused these changes in the KO mice (for details, see Figure 8 and Figure 8—figure supplement 2): (1) owing to the abnormal enhanced Kv7 function in KO MCs, XE991 boosted up MC excitability (explosion marker) to enhance excitatory output (thicker red arrow) onto INs, which increases INs’ excitability (explosion marker); and (2) XE991 increased inhibitory drive onto GCs (thicker blue arrow onto GCs compared with that of in B), which dampens EPSP integration (due to summation of enhanced inhibitory input) in GCs and suppresses dentate gyrus output.
Tables
Key resources table
| Reagent type (species) or resource | Designation | Source or reference | Identifiers | Additional information |
|---|---|---|---|---|
| Strain, strain background (mouse, FVB, male) | Fmr1 KO mouse (FVB.129P2-Pde6b+ Tyrcc-ch Fmr1tm1Cgr/J) | The Jackson Laboratory | 004624 | |
| Strain, strain background (mouse, FVB, male) | Control for Fmr1 KO mouse (FVB.129P2-Pde6b+ Tyrcc-ch /AntJ) | The Jackson Laboratory | 004828 | |
| Antibody | Anti-α tubulin (rabbit polyclonal) | Abcam | Cat# ab18251, RRID:AB_2210057 | WB (1:20,000) |
| Antibody | Anti-FMRP (rabbit polyclonal) | Cell Science Technology | Cat# 4317, RRID:AB_1903978 | WB (1:1000) |
| Antibody | Anti-Kv7.2 (rabbit polyclonal) | Alomone Labs | Cat# APC-050, RRID:AB_2040101 | WB (1:500) |
| Antibody | Anti-Kv7.3 (rabbit polyclonal) | Alomone Labs | Cat# APC-051, RRID:AB_2040103 | WB (1:500) |
| Chemical compound, drug | (2S)–3-[[(1S)–1-(3,4-Dichlorophenyl)ethyl]amino-2-hydroxypropyl](phenylmethyl)phosphinic acid hydrochloride (CGP55845) | Tocris Bioscience | 1248 | |
| Chemical compound, drug | 4-(2-Hydroxyethyl)piperazine-1-ethanesulfonic acid, N-(2-Hydroxyethyl)piperazine-N′-(2-ethanesulfonic acid) (HEPES) | MilliporeSigma | H3375 | |
| Chemical compound, drug | 4,5,6,7-Tetrahydroisoxazolo[5,4c]pyridin-3-ol hydrochloride (THIP) | Tocris Bioscience | 0807 | |
| Chemical compound, drug | 6,7-Dinitroquinoxaline-2,3-dione(DNQX) | Tocris Bioscience | 2312 | |
| Chemical compound, drug | Adenosine 5'-triphosphate disodium (Na2-ATP) | MilliporeSigma | A1852 | |
| Chemical compound, drug | Adenosine 5'-triphosphate magnesium (Mg-ATP) | MilliporeSigma | A9187 | |
| Chemical compound, drug | Guanosine 5′-triphosphate sodium (Na-GTP) | MilliporeSigma | G8877 | |
| Chemical compound, drug | Horseradish peroxidase (rabbit IgG conjugated) | Thermo Fisher | 656120 | |
| Chemical compound, drug | Picrotoxin (PTX) | Tocris Bioscience | 1128 | |
| Chemical compound, drug | QX-314 | MilliporeSigma | 552233 | |
| Chemical compound, drug | SR 95531 hydrobromide (Gabazine, GBZ) | Tocris Bioscience | 1262 | |
| Chemical compound, drug | Tetrodotoxin (TTX) | Tocris Bioscience | 1069 | |
| Software, algorithm | LabView | National Instrument | LabView 8.6 | |
| Software, algorithm | MATLAB | MathWorks | MATLAB 2012b | |
| Software, algorithm | Origin | Origin Labs | Origin 8.5 | |
| Software, algorithm | Mini Analysis | Synaptosoft Inc | Version 6.0.3 |
Additional files
-
Supplementary file 1
Table containing statistical information for all figures.
- https://cdn.elifesciences.org/articles/92563/elife-92563-supp1-v1.xlsx
-
MDAR checklist
- https://cdn.elifesciences.org/articles/92563/elife-92563-mdarchecklist1-v1.docx
Download links
A two-part list of links to download the article, or parts of the article, in various formats.
Downloads (link to download the article as PDF)
Open citations (links to open the citations from this article in various online reference manager services)
Cite this article (links to download the citations from this article in formats compatible with various reference manager tools)
Circuit-based intervention corrects excessive dentate gyrus output in the fragile X mouse model
eLife 12:RP92563.
https://doi.org/10.7554/eLife.92563.3


