Spatial transcriptomics in the adult Drosophila brain and body
- VIB-KU Leuven Center for Brain and Disease Research, KU Leuven, Belgium
- Laboratory of Computational Biology, Department of Human Genetics, KU Leuven, Belgium
- Aix Marseille University, CNRS, IBDM, Turing Centre for Living Systems, France
- VIB Center for AI & Computational Biology, KU Leuven, Belgium
Figures
Figure 1 with 3 supplements
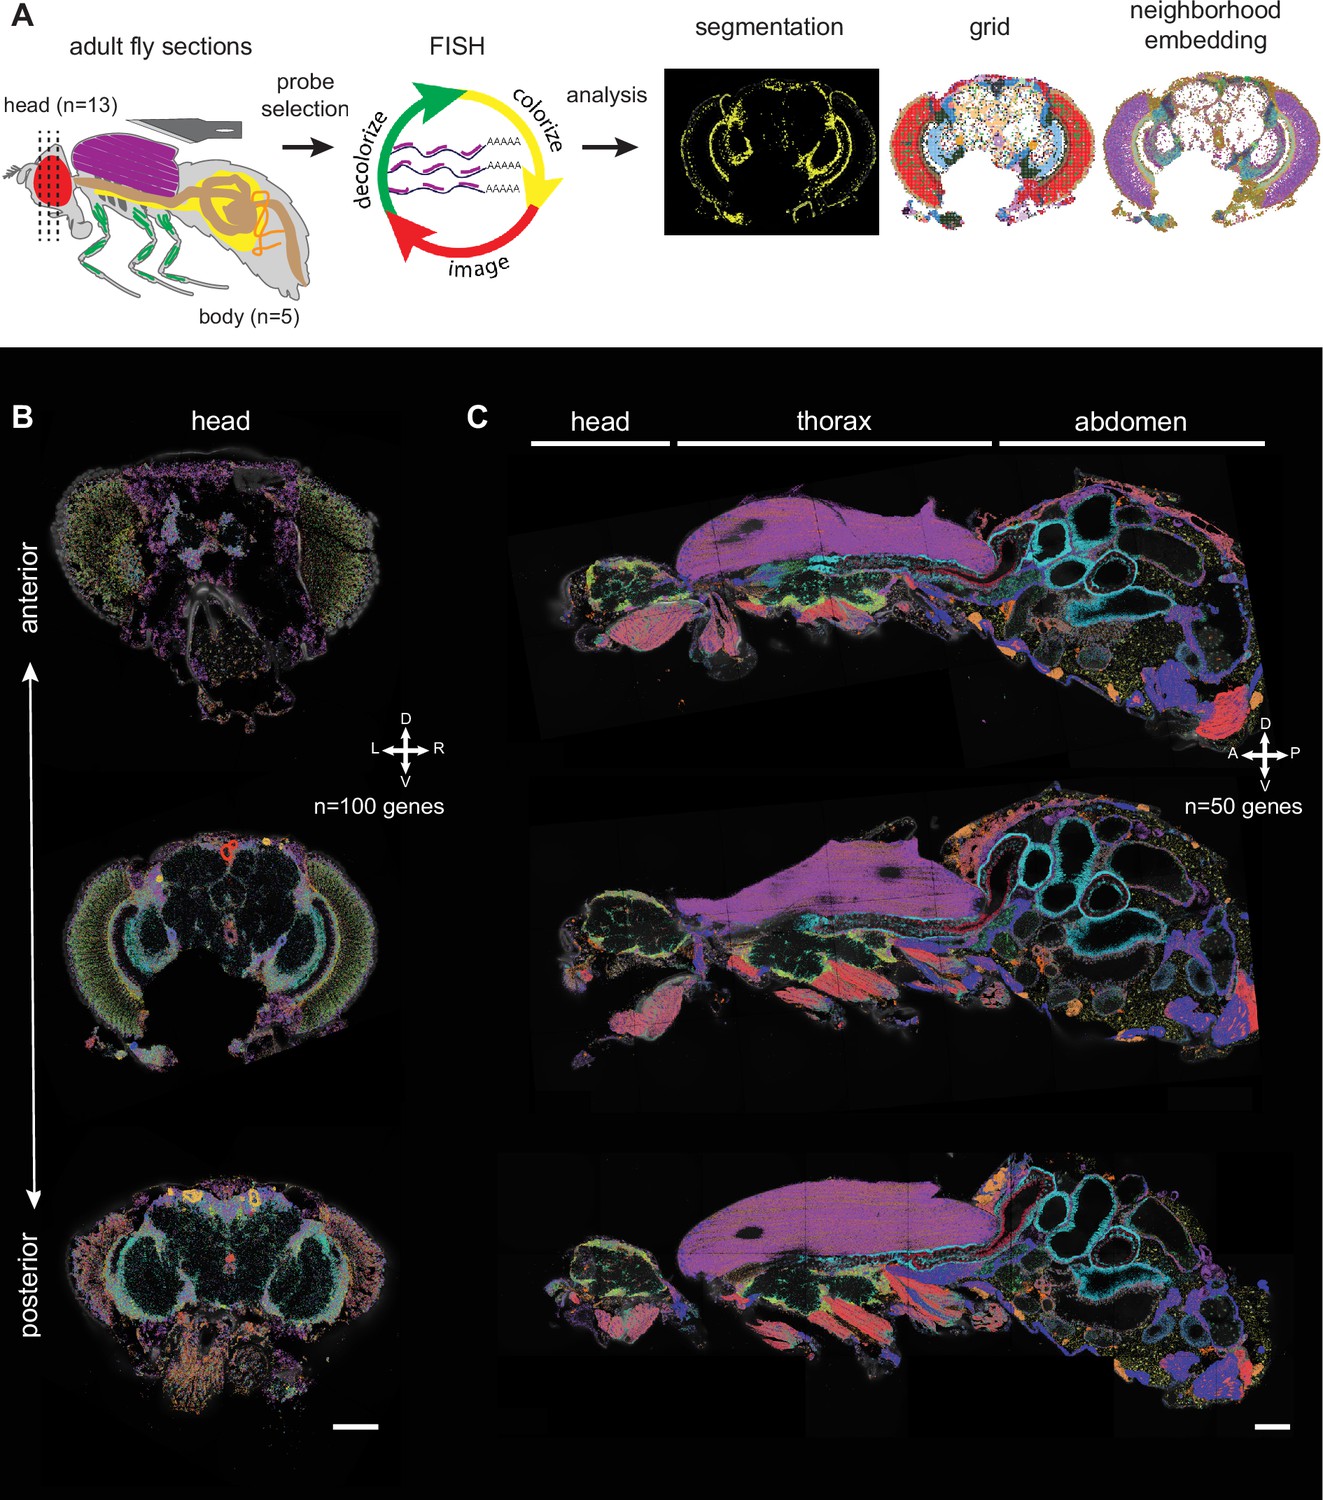
Principal workflow of spatial fly transcriptomics.
(A) Overview of the spatial transcriptomics workflow: adult flies were sectioned, sections were analyzed with Molecular Cartography and data were annotated using cell segmentation, rasterization (i.e. grid), and neighborhood embedding (see Methods). (B, C) Three examples of adult head sections showing various positions in the brain along the anterior-posterior axis (B). Three examples of male whole-body sections were taken from the same male (C). mRNAs from each gene are represented in a different color. The combination of colors reveals the different cell types. Scale bars represent 100 µm. Background stain labels DAPI.
Figure 1—figure supplement 1
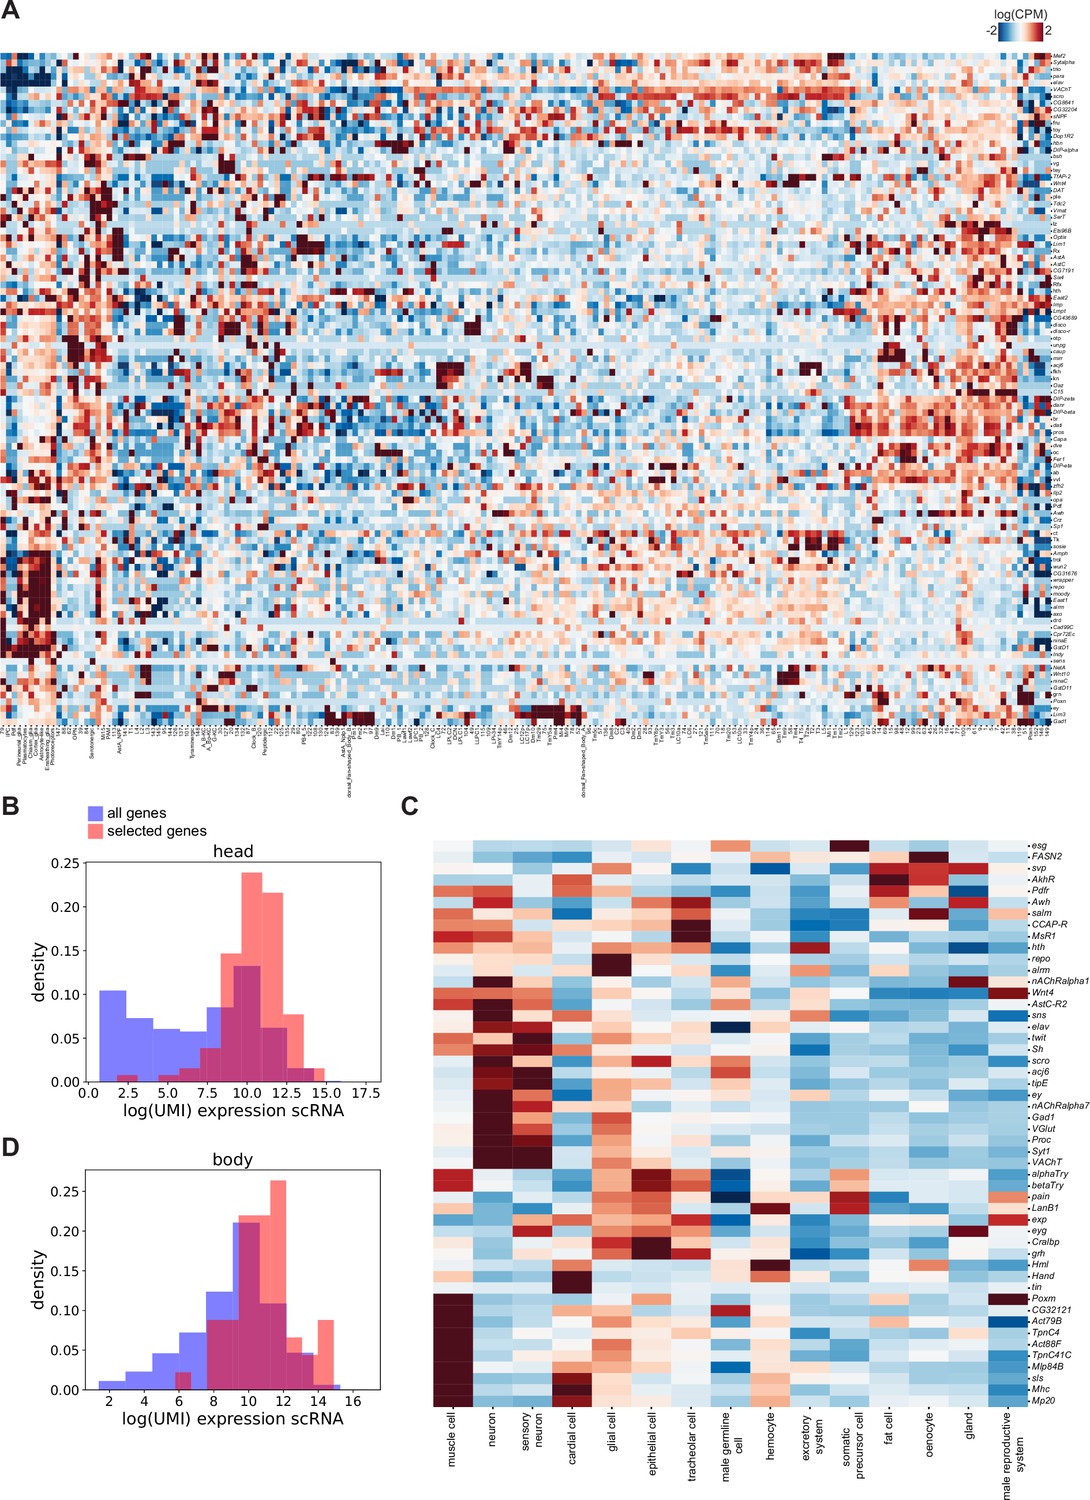
Expression of the here selected marker genes in single-cell datasets.
(A) Heatmap showing expression in standardized log(CPM) of the 100 marker genes used in the head dataset in the single-cell clusters. (B) Density plot showing levels of gene expression detected in scRNA-seq (Pech et al., 2024). Blue: all genes, red: genes used in the spatial study. (C) Heatmap showing expression in standardized log(CPM) of the 50 marker genes used for body dataset in the Fly Cell Atlas (FCA) single-cell clusters. (D) Density plot showing levels of gene expression detected in scRNA-seq (FCA, Li et al., 2022). Blue: all genes, red: genes used in the spatial study.
Figure 1—figure supplement 2
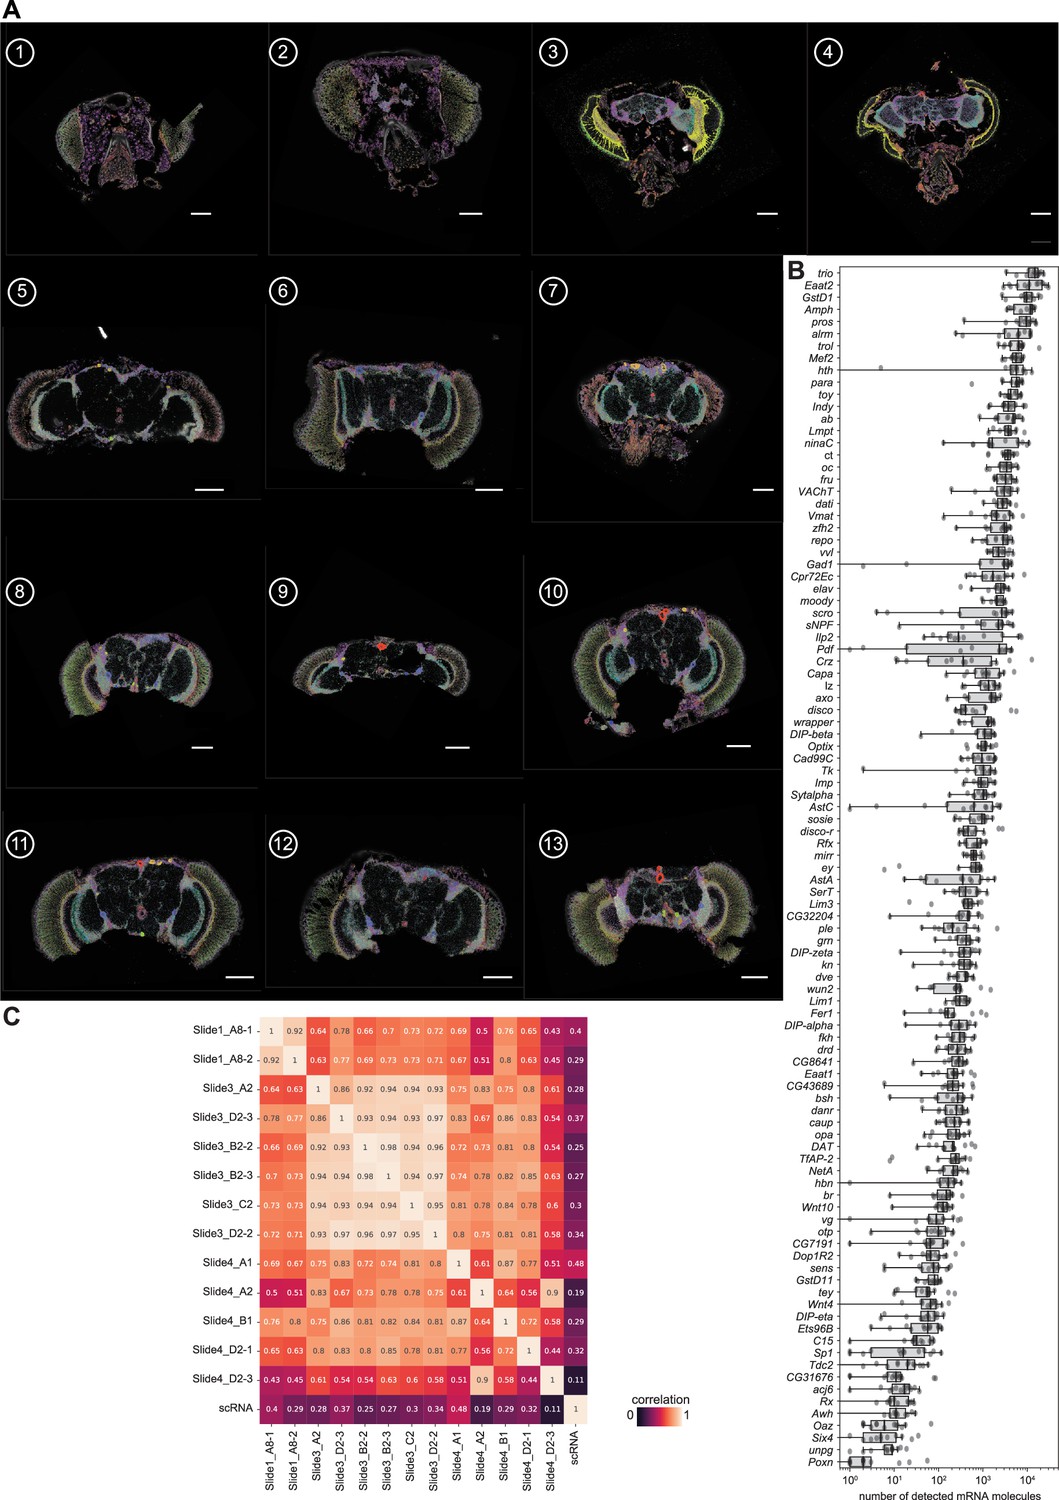
Head samples.
(A) All detected mRNA molecules color-coded in all 13 head samples used in the analysis. Scale bars represent 100 µm. Background stain labels DAPI. (B) Boxplot showing gene expression (number of detected mRNA molecules) in each of the head samples. Boxplot shows the median (center line), upper and lower quartiles (box limits), and 1.5x interquartile range (whiskers). All data points are shown. (C) Heatmap showing Pearson correlation between the individual head section samples and to the scRNA data from the fly cell atlas (FCA).
Figure 1—figure supplement 3
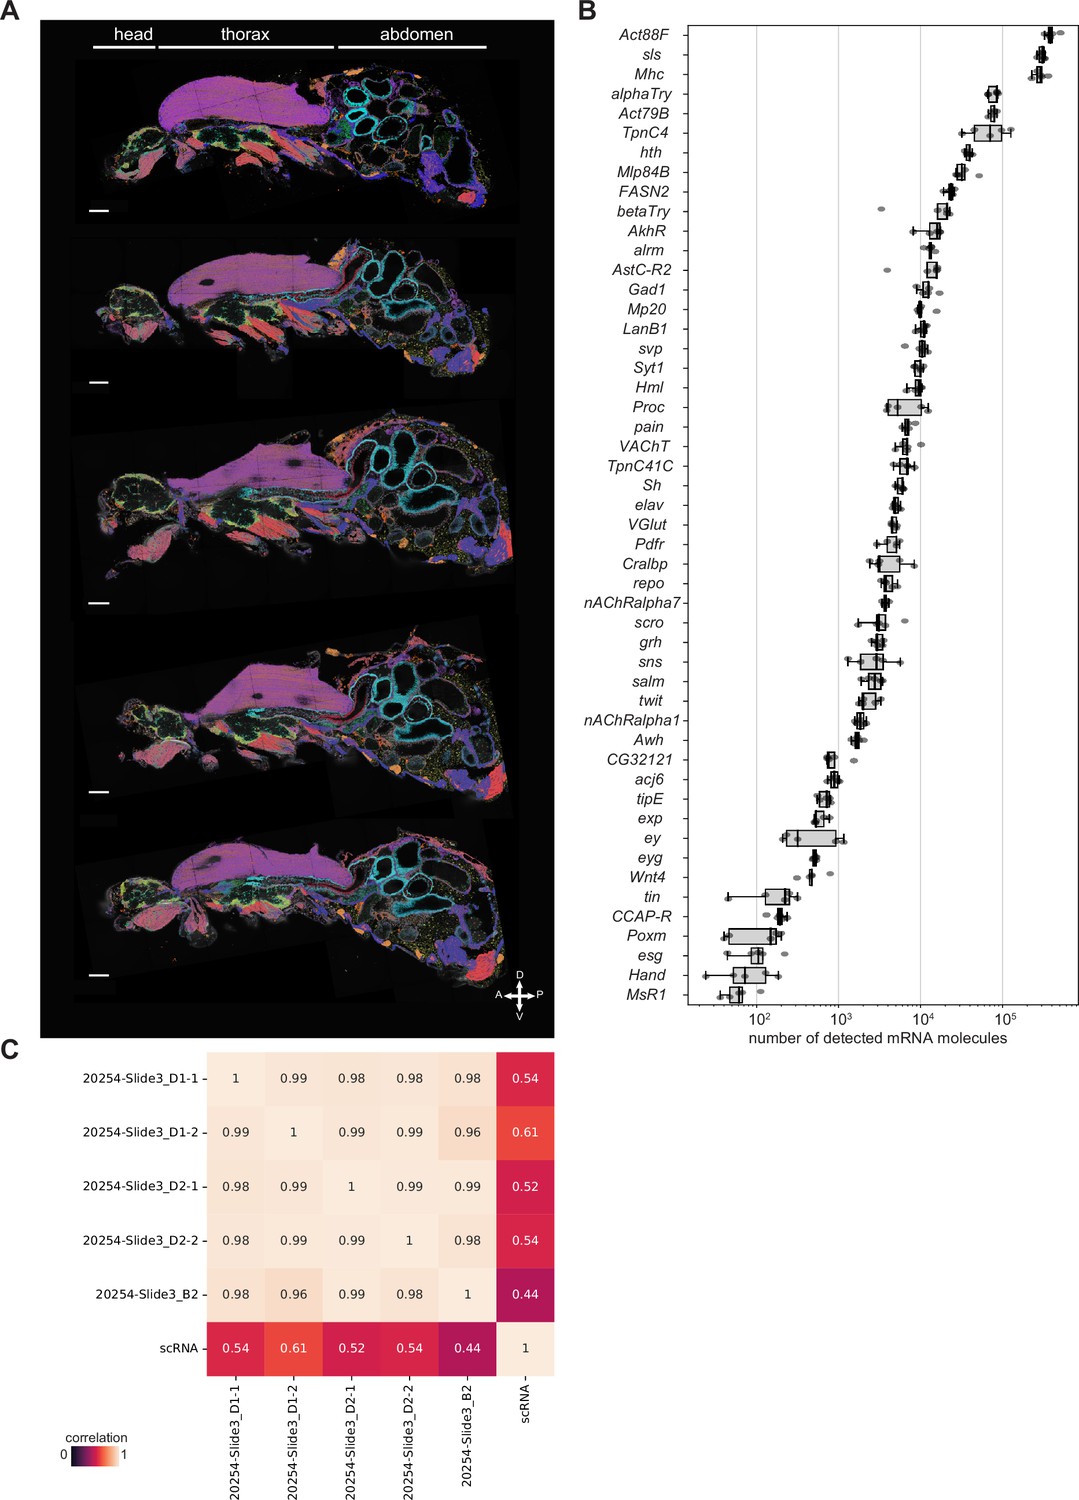
Body samples.
(A) All detected mRNA molecules color-coded for all body samples used in the analysis. Sections are from the same male. Anterior is to the left, dorsal is up on each section and the section are ordered (top to bottom). Scale bars represent 100 µm. Background stain labels DAPI. (B) Boxplot showing gene expression (number of detected mRNA molecules) in each of the body samples. Boxplot shows the median (center line), upper and lower quartiles (box limits), and 1.5x interquartile range (whiskers). All data points are shown. (C) Heatmap showing Pearson correlation between the individual samples and the scRNA data from the fly cell atlas (FCA).
Figure 2 with 3 supplements

Adult body cell types.
(A) Major cell types of adult males identified by marker genes. Scale bars represent 100 µm. Inset for gut shows zoom-ins of different regions (a: apical, b: basal). Inset for flight muscle, shows the percentage of marker gene molecules detected within the outlined area in the section shown. (B) Gene set scores for the main classes of cell types, quantified using 5 µm × 5 µm grid. Scale bar represents 100 µm. The class assignment shown on the right is based on the maximum score across classes. Genes used: neurons (elav, Syt1, Sh, acj6, ey, VAChT, Gad1, VGlut, nAChRα7); male reproductive system (Awh, eyg, svp); epithelia (grh, αTry, βTry, hth); heart (tin, Hand); muscle (Mhc); hemocyte (Hml); glia (repo); fat cells (AkhR); oenocytes (FASN2). (C) UMAP showing clustering of 5 µm × 5 µm grid spots. (D) Spatial location of grid clusters. (E) tSNE from male accessory glands from fly cell atlas (FCA) showing expression of marker genes for main gland cells. (F, F’) Molecular Cartography (MC) of the main gland cells marker genes highlights several defined populations of cells. Scale bar represents 100 µm. Detailed view shown in F’. Background stain labels DAPI.
Figure 2—figure supplement 1
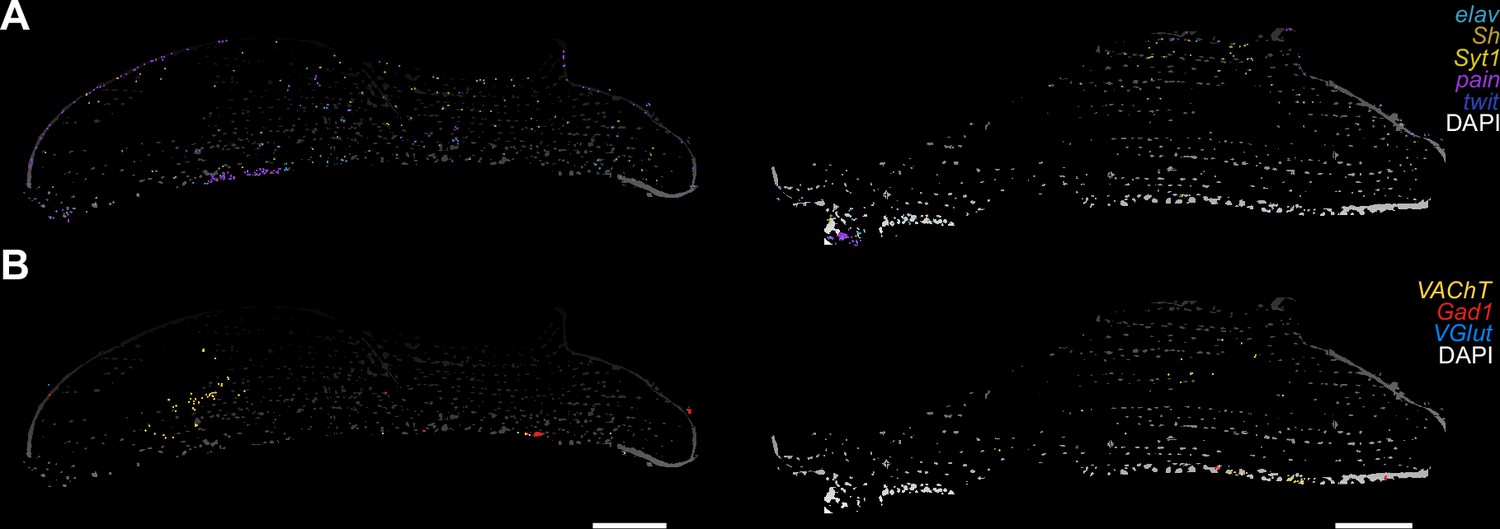
Motor neuron markers in flight muscles.
(A, B) Two different thorax sections are shown on the left and on the right. Molecular Cartography of neuronal markers in flight muscles (A). Molecular Cartography of neurotransmitter genes in flight muscles (B). (VAChT: cholinergic, VGlut: glutamatergic, Gad1: GABAergic). Scale bars represent 100 µm.
Figure 2—figure supplement 2
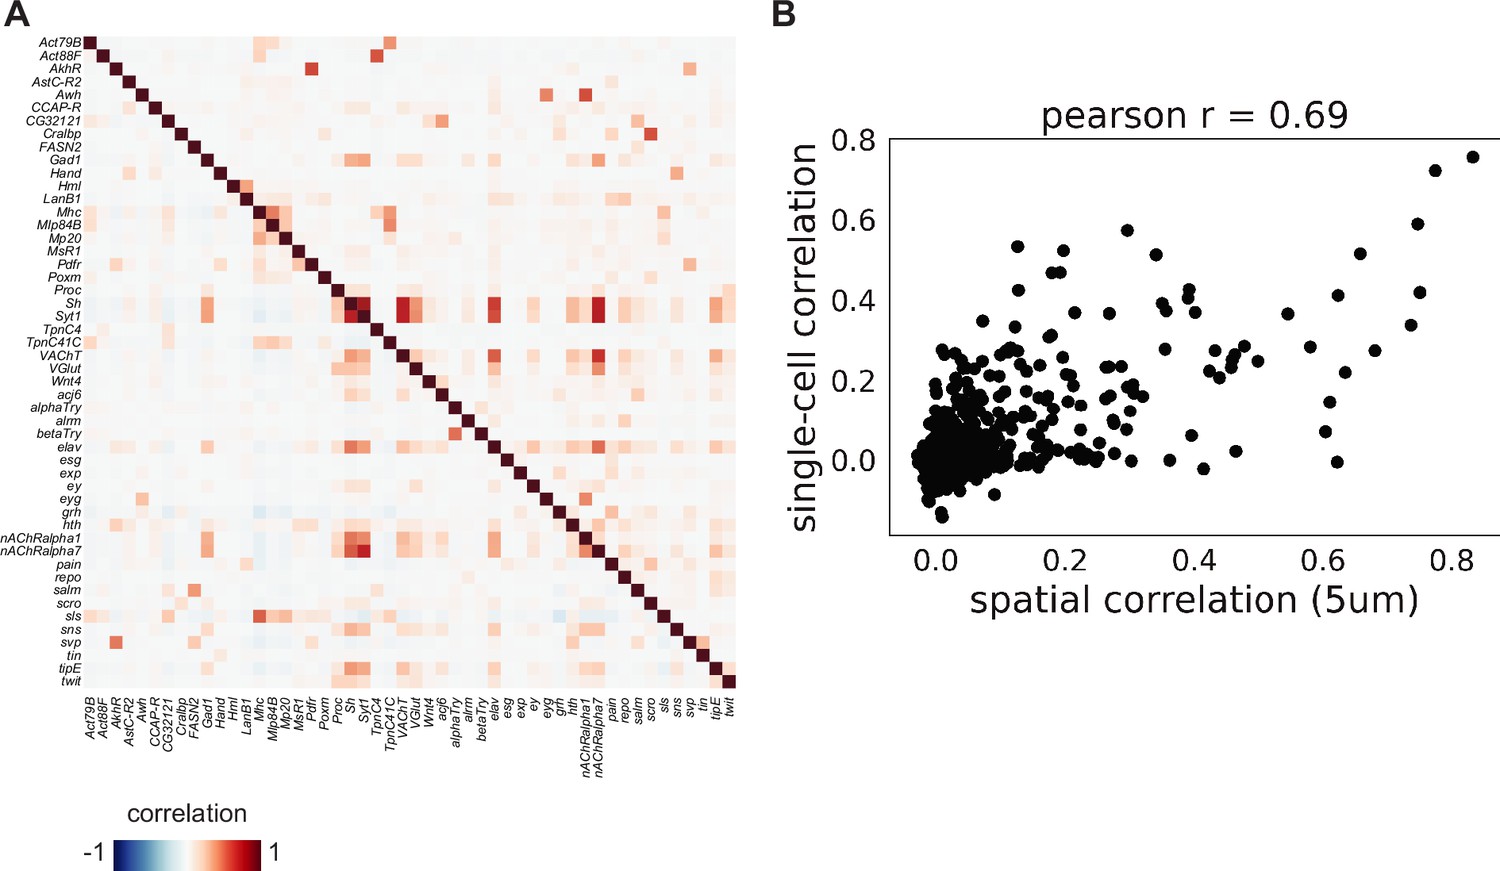
Comparison of body spatial datasets with body single-cell datasets.
(A) Composite heatmap showing gene-gene co-expression based on Pearson correlation. Bottom triangle calculated on spatial datasets (using grid-based 5 µm squares). Top triangle calculated using single-cell data. (B) Gene-gene correlation measured across grid-based 5 µm squares and cells.
Figure 2—figure supplement 3
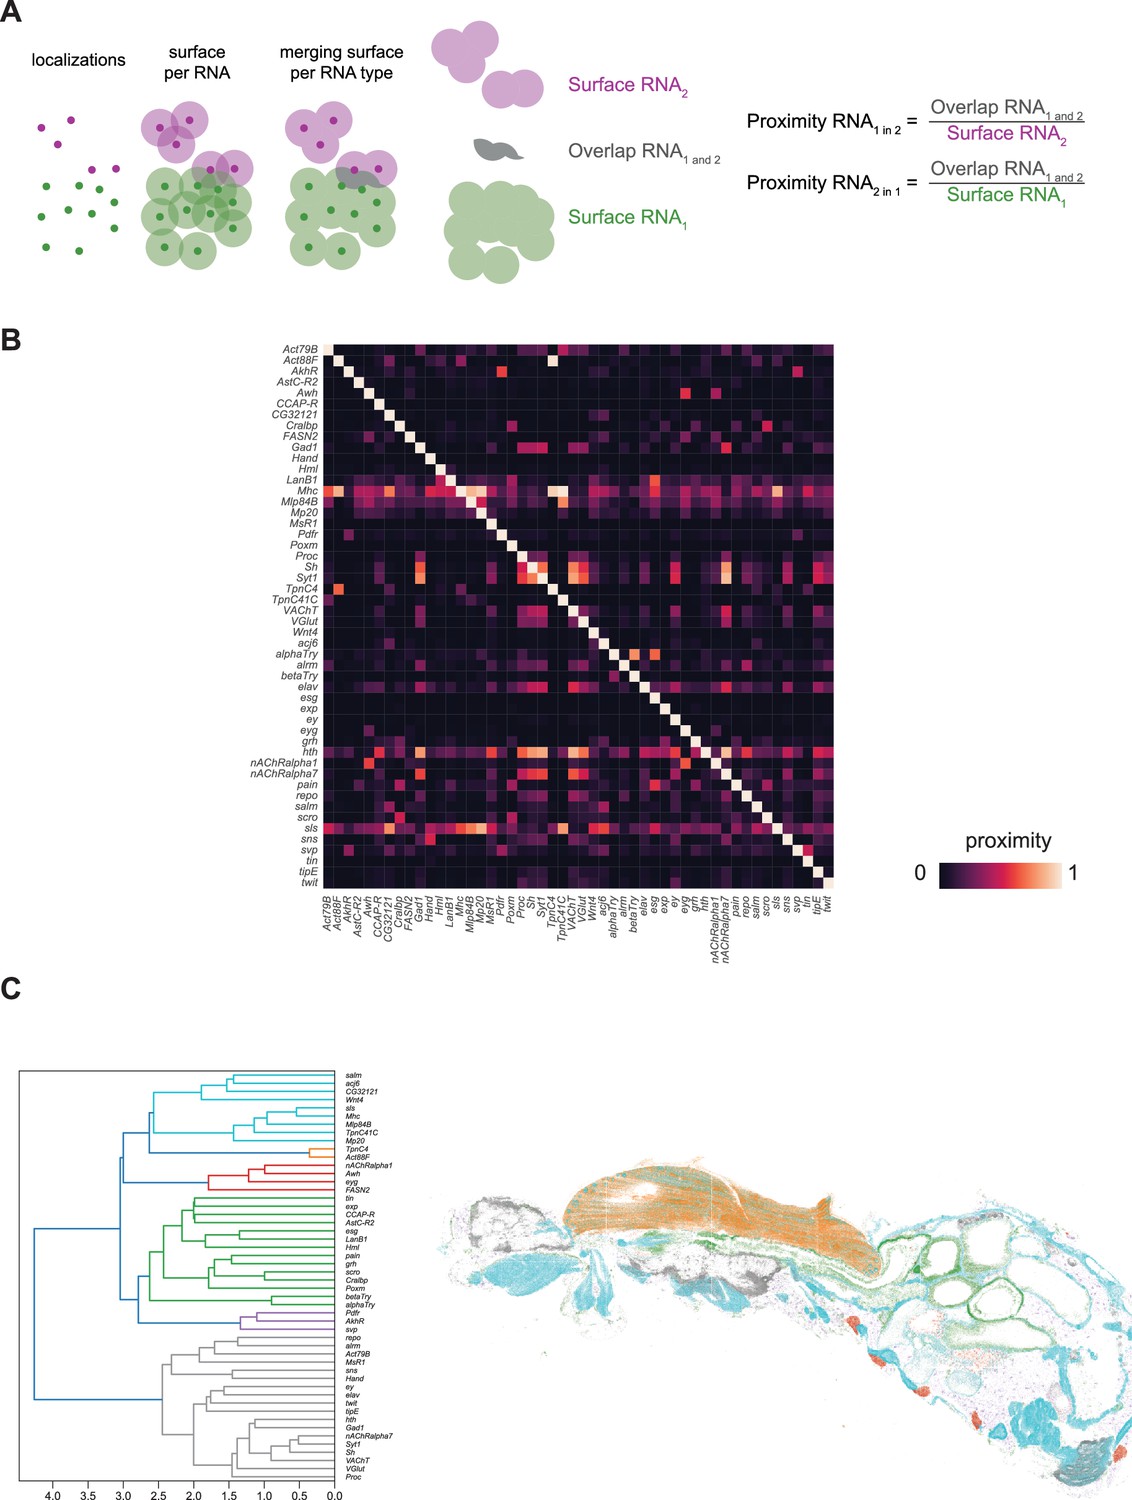
Colocalization of gene expression in the body datasets.
(A) Overview of colocalization algorithm. For each mRNA spot a disk of 4 µm diameter was used as search space. Overlaps in the disk area were then used to calculate proximity between genes as defined by the formula in the figure. (B) Heatmap displaying proximity estimation of genes with each other. The genes displayed vertically correspond to RNA1 and the genes displayed horizontally correspond to RNA2 as used in the formula introduced in A. (C) Ward’s clustering of gene-gene proximities. (left) Dendrogram clustering of genes. (right) Spatial location of gene clusters. Colors in the dendrogram are used to show the expression of the respective genes on the fly section.
Figure 3 with 1 supplement
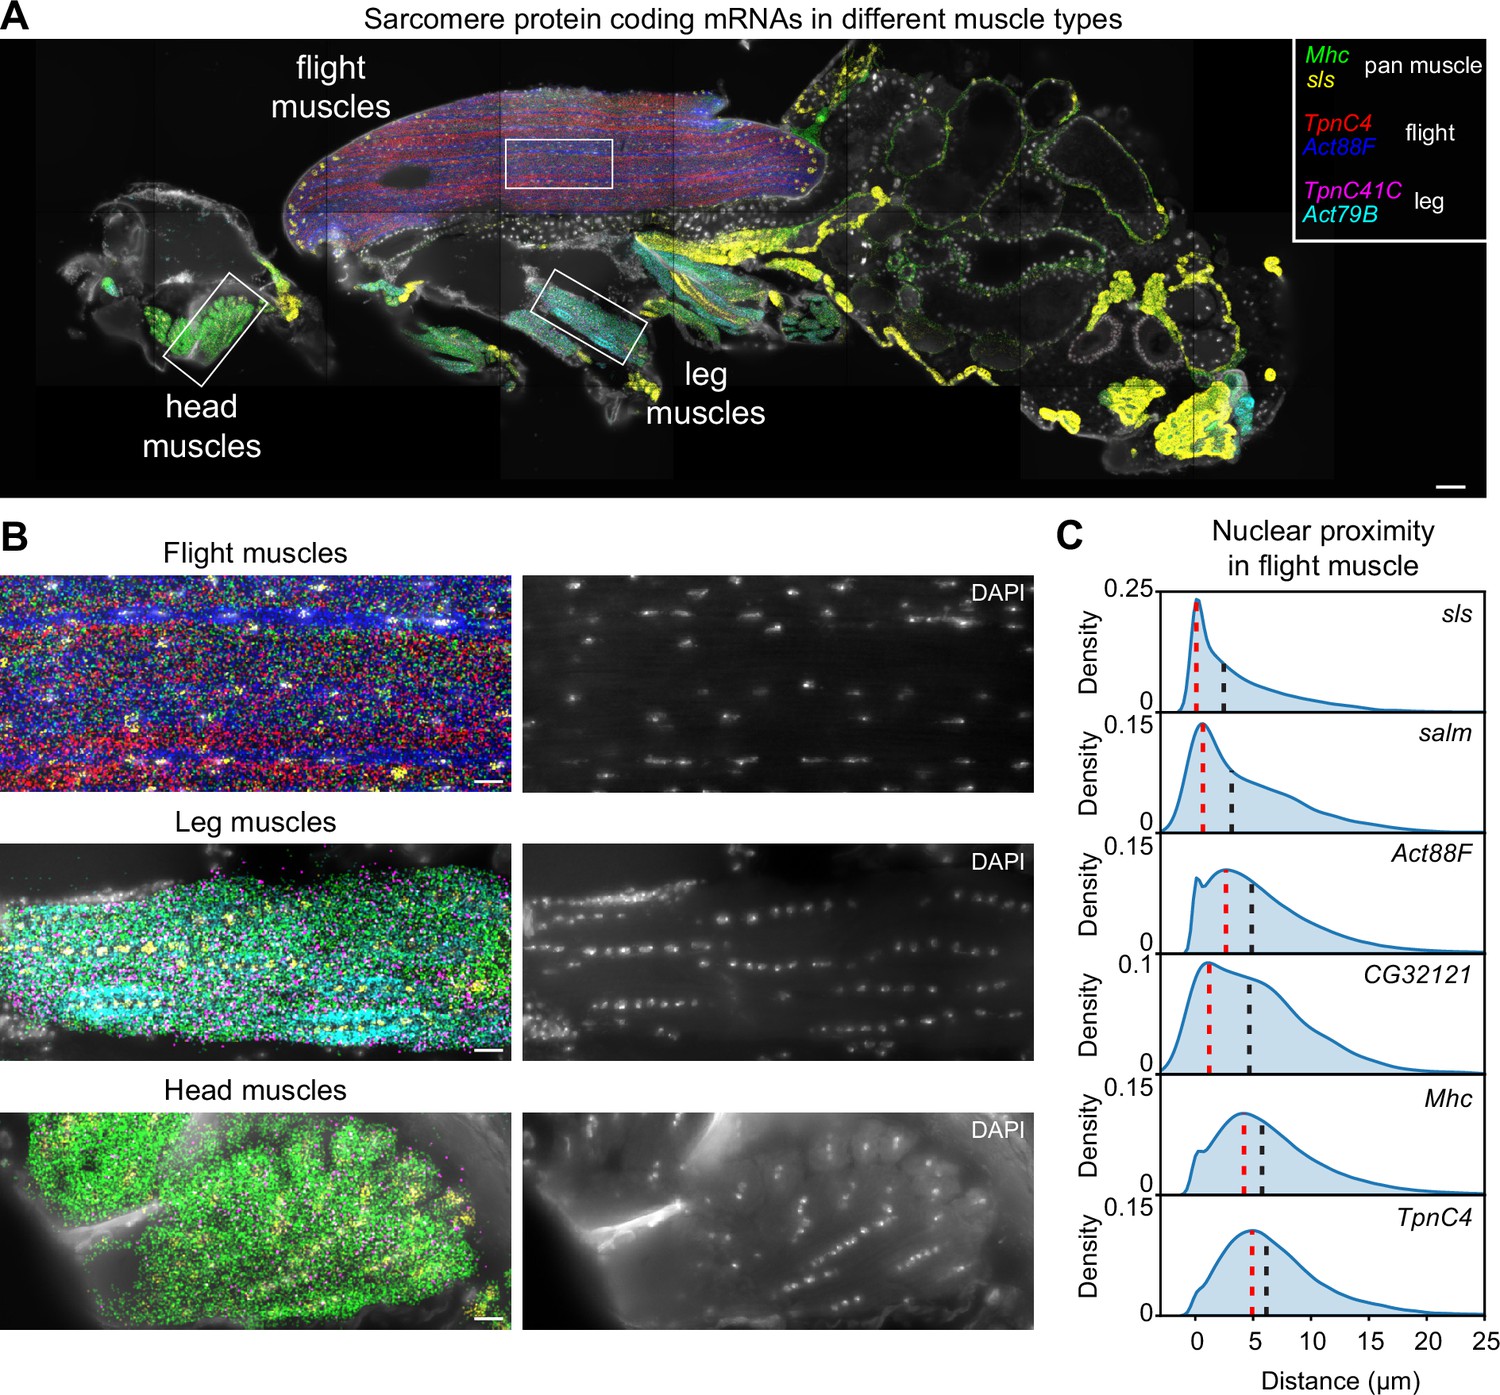
Molecular Cartography shows mRNA-specific nuclear enrichment.
(A) Molecular Cartography (MC) visualization of marker genes of muscle subtypes. White boxes mark zoom-in regions shown in (B) and Figure 3—figure supplement 1. (B) Zoom-in on flight, leg, and head muscles. Left, labels are the same as in (A); right, DAPI-labeled nuclei. (C). Density plots show the distance of each mRNA molecule of the indicated genes to its nearest nucleus. Red dotted lines mark the peak density, and black dotted lines the median distance. Scale bars represent 50 µm in (A) and 10 µm in (B). Background stain labels DAPI.
Figure 3—figure supplement 1
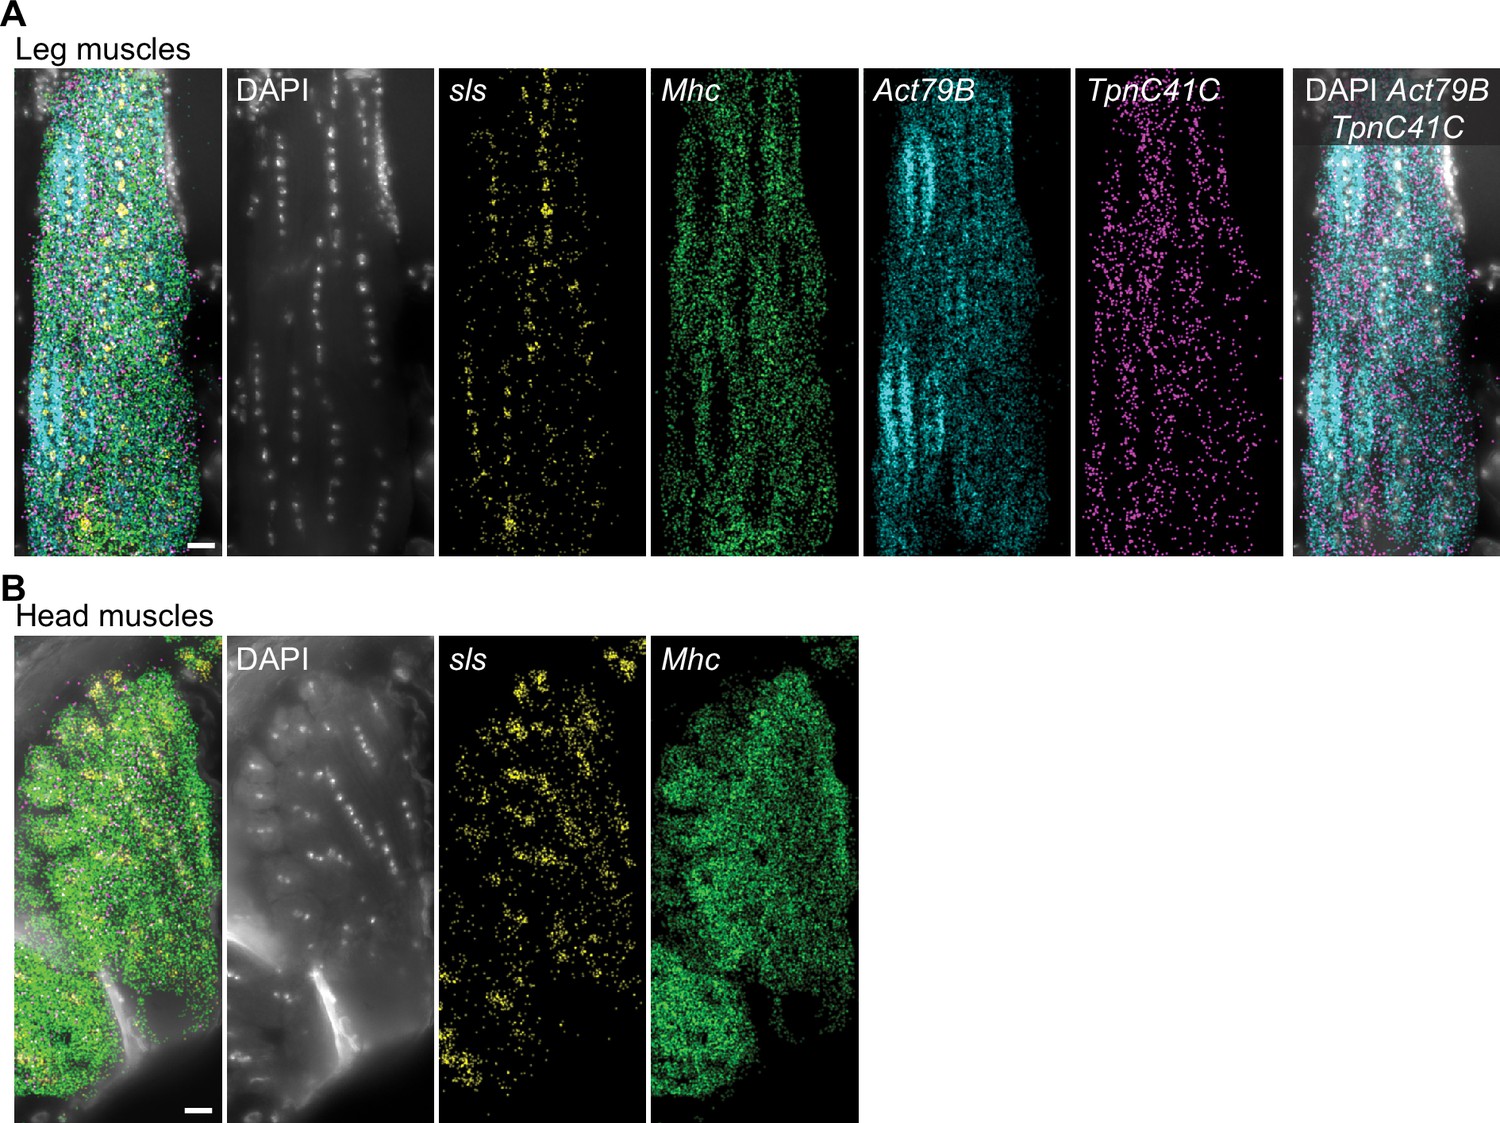
Subcellular mRNA localization in leg and head muscles.
(A) Molecular Cartography of sls, Act79B, Tpn41C and Mhc mRNAs in leg muscles, showing nuclei enrichment for sls mRNA and proximity of Act79B mRNA to leg muscle nuclei. (B) Molecular Cartography of sls and Mhc mRNAs in head muscles, showing nuclei enrichment for sls mRNAs. Scale bars represent 10 µm. Background stain labels DAPI.
Figure 4 with 1 supplement
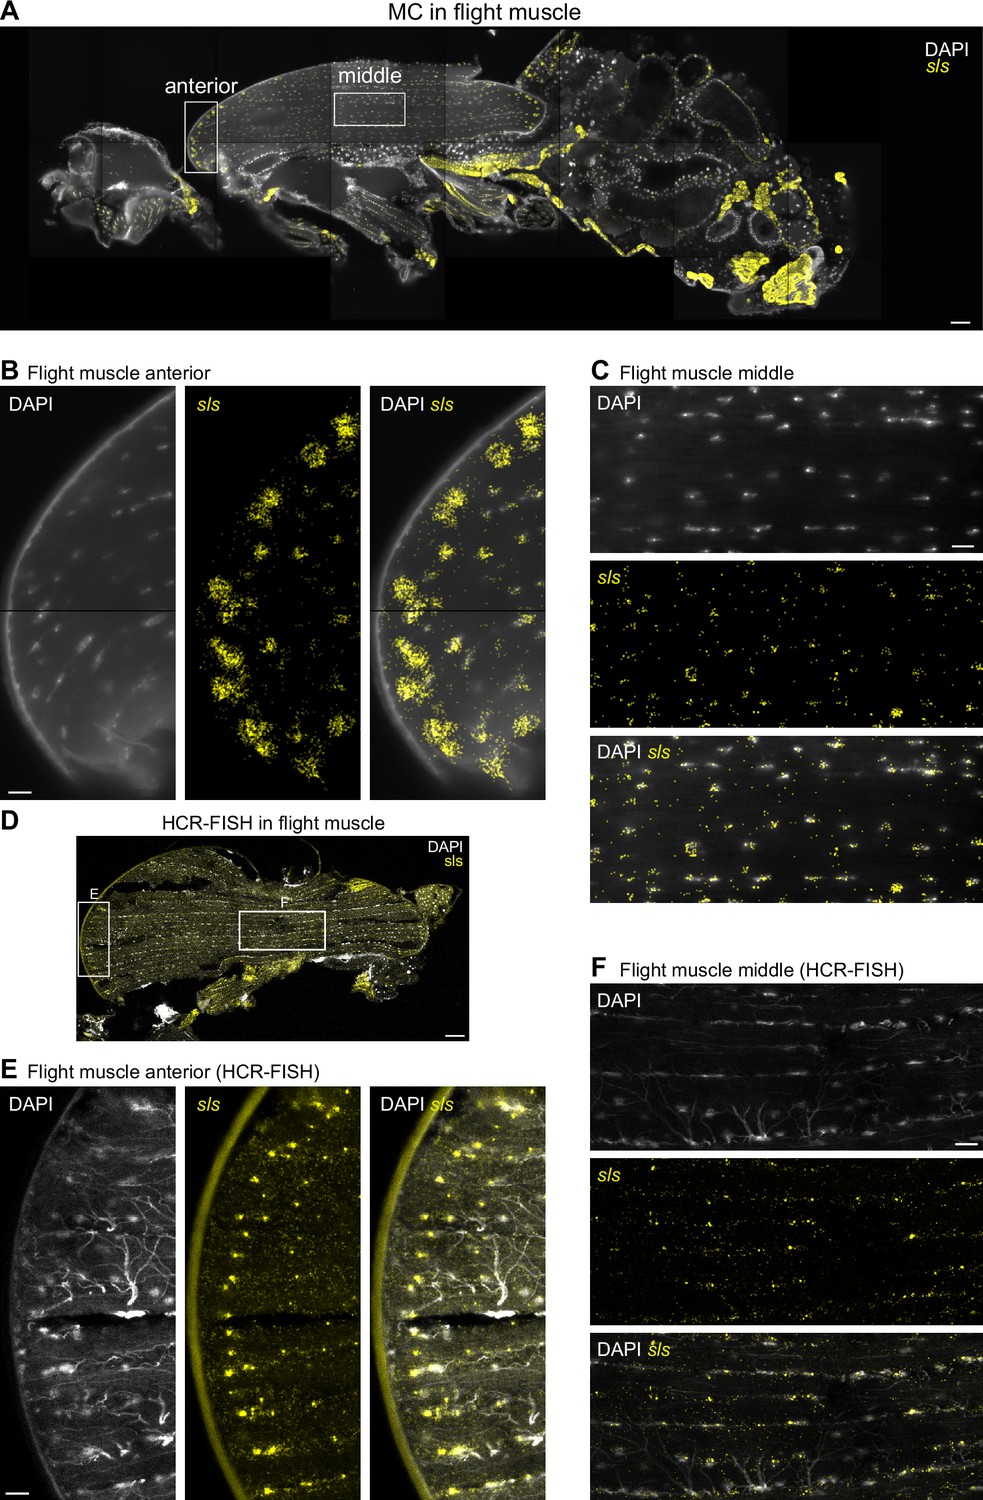
sls mRNA shows nuclear enrichment with increased concentration close to muscle-tendon junctions.
(A) Molecular Cartography visualization of sls mRNA (yellow) as pan muscle maker (same section as in Figure 3). White boxes mark zoom-in regions shown in (B) and (C). (B, C) Zoom-in on indirect flight muscles showing colocalization of sls mRNAs and DAPI stained nuclei in anterior (B) or central (C) regions of the flight muscle. (D) Hybridization chain reaction-fluorescence in situ hybridization (HCR-FISH) imaging of sls mRNA in an adult thorax. White boxes mark zoom-in regions shown in (E) and (F). (E, F) Zoom-ins on flight muscle at anterior (E) or middle (F) regions. Note the sls mRNA and DAPI co-localization (tracheal cells show background stain in the DAPI channel). Scale bars represent 50 µm in (A) and (D), and 10 µm in (B), (C), (E), and (F). Background stain labels DAPI.
Figure 4—figure supplement 1
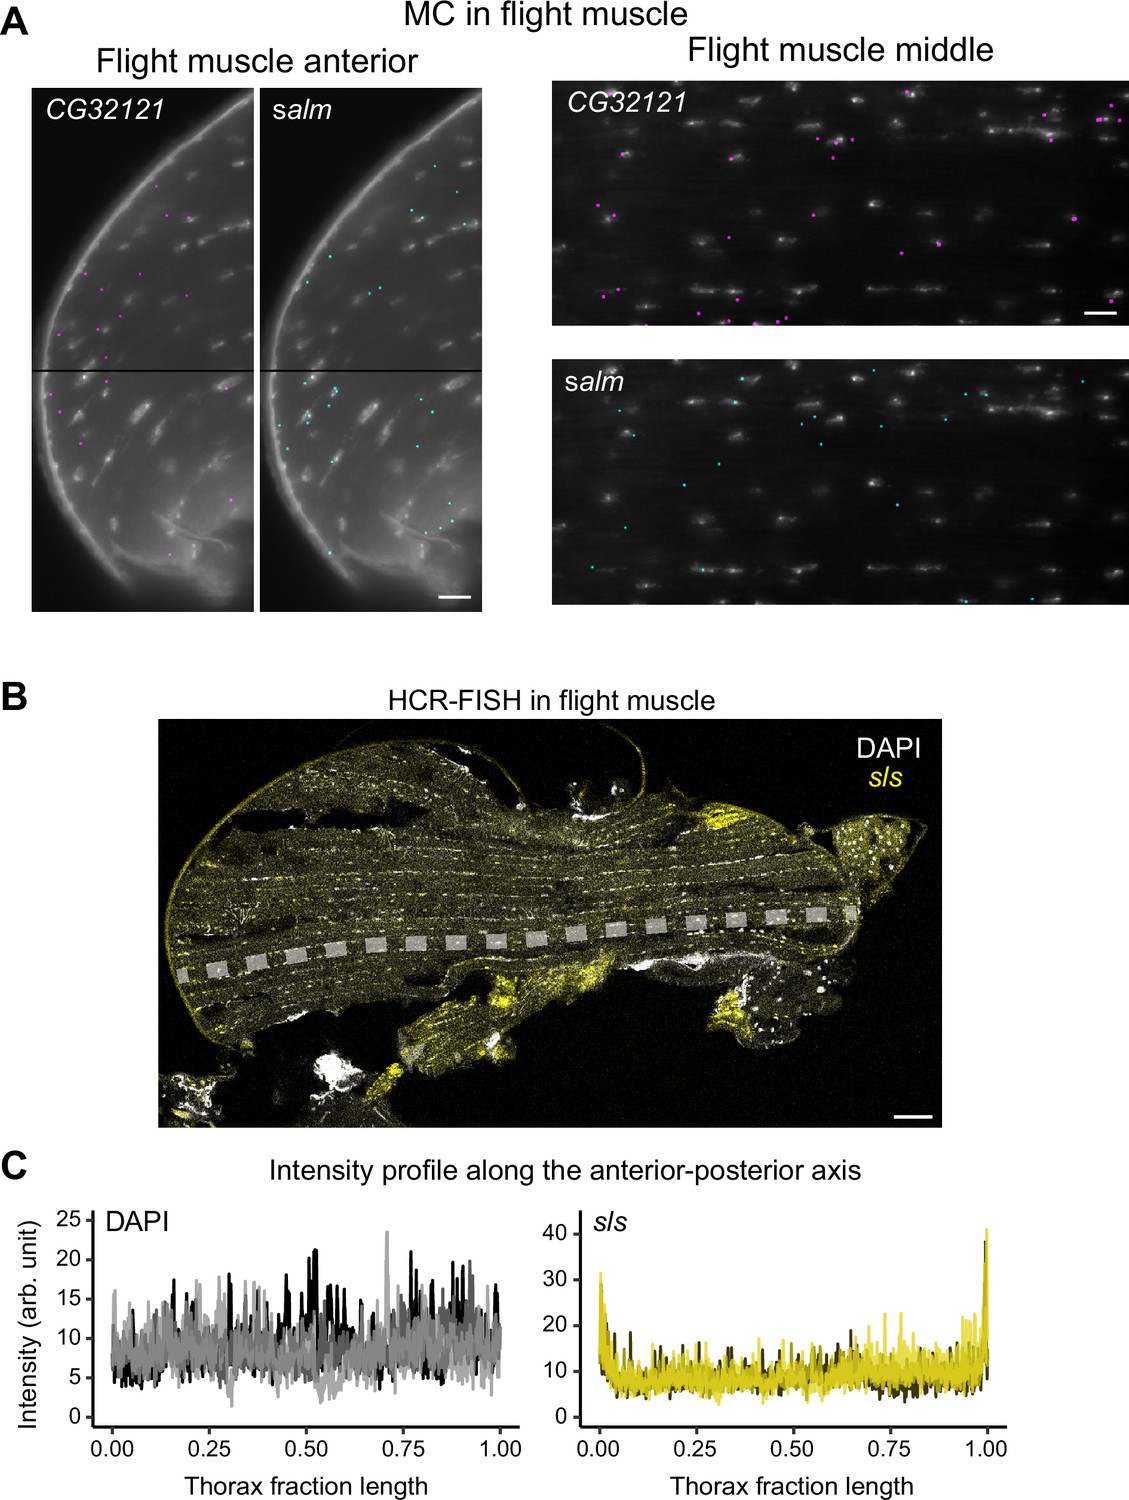
Nuclear and sls mRNA localization.
(A) Molecular Cartography of sparsely expressed genes (salm and CG32121) at the anterior (right) and middle (left) flight muscle regions labeled in Figure 4A (see also the quantification of nuclear proximity for both genes shown in Figure 3C). Note the proximity of both mRNAs to the nuclei but no mRNA enrichment in anterior regions. (B) Hybridization chain reaction-fluorescence in situ hybridization (HCR-FISH) imaging of sls mRNAs (yellow) in an adult thorax. The dashed line marks the region in which the intensity measurement was achieved. The scale bar represents 50 µm. (C) Quantification of sls mRNA localization: intensity profile plots of DAPI (left) and sls mRNAs (right) along the anteroposterior axis for three sections from three different flies indicated in different colors. The positions along the anteroposterior axis were normalized. Note the homogenous DAPI distribution but the terminal sls mRNA enrichment. Scale bars represent 10 µm in (A) and 50 µm in (B).
Figure 5 with 1 supplement
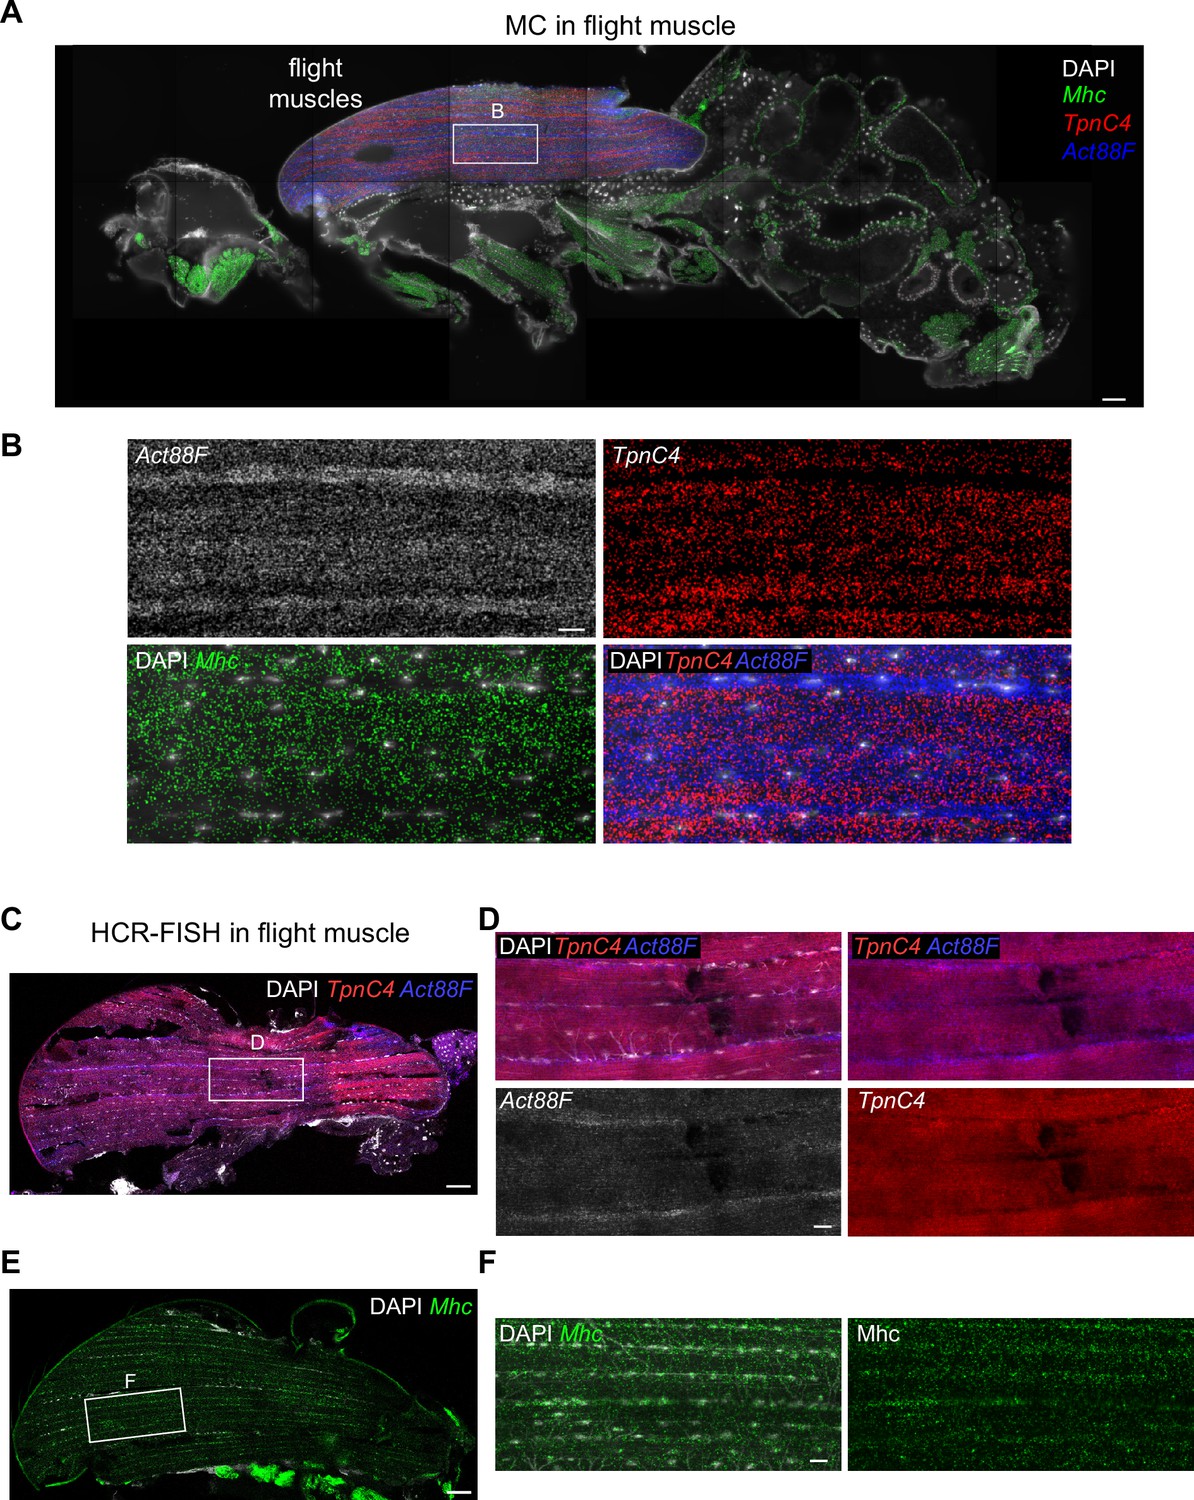
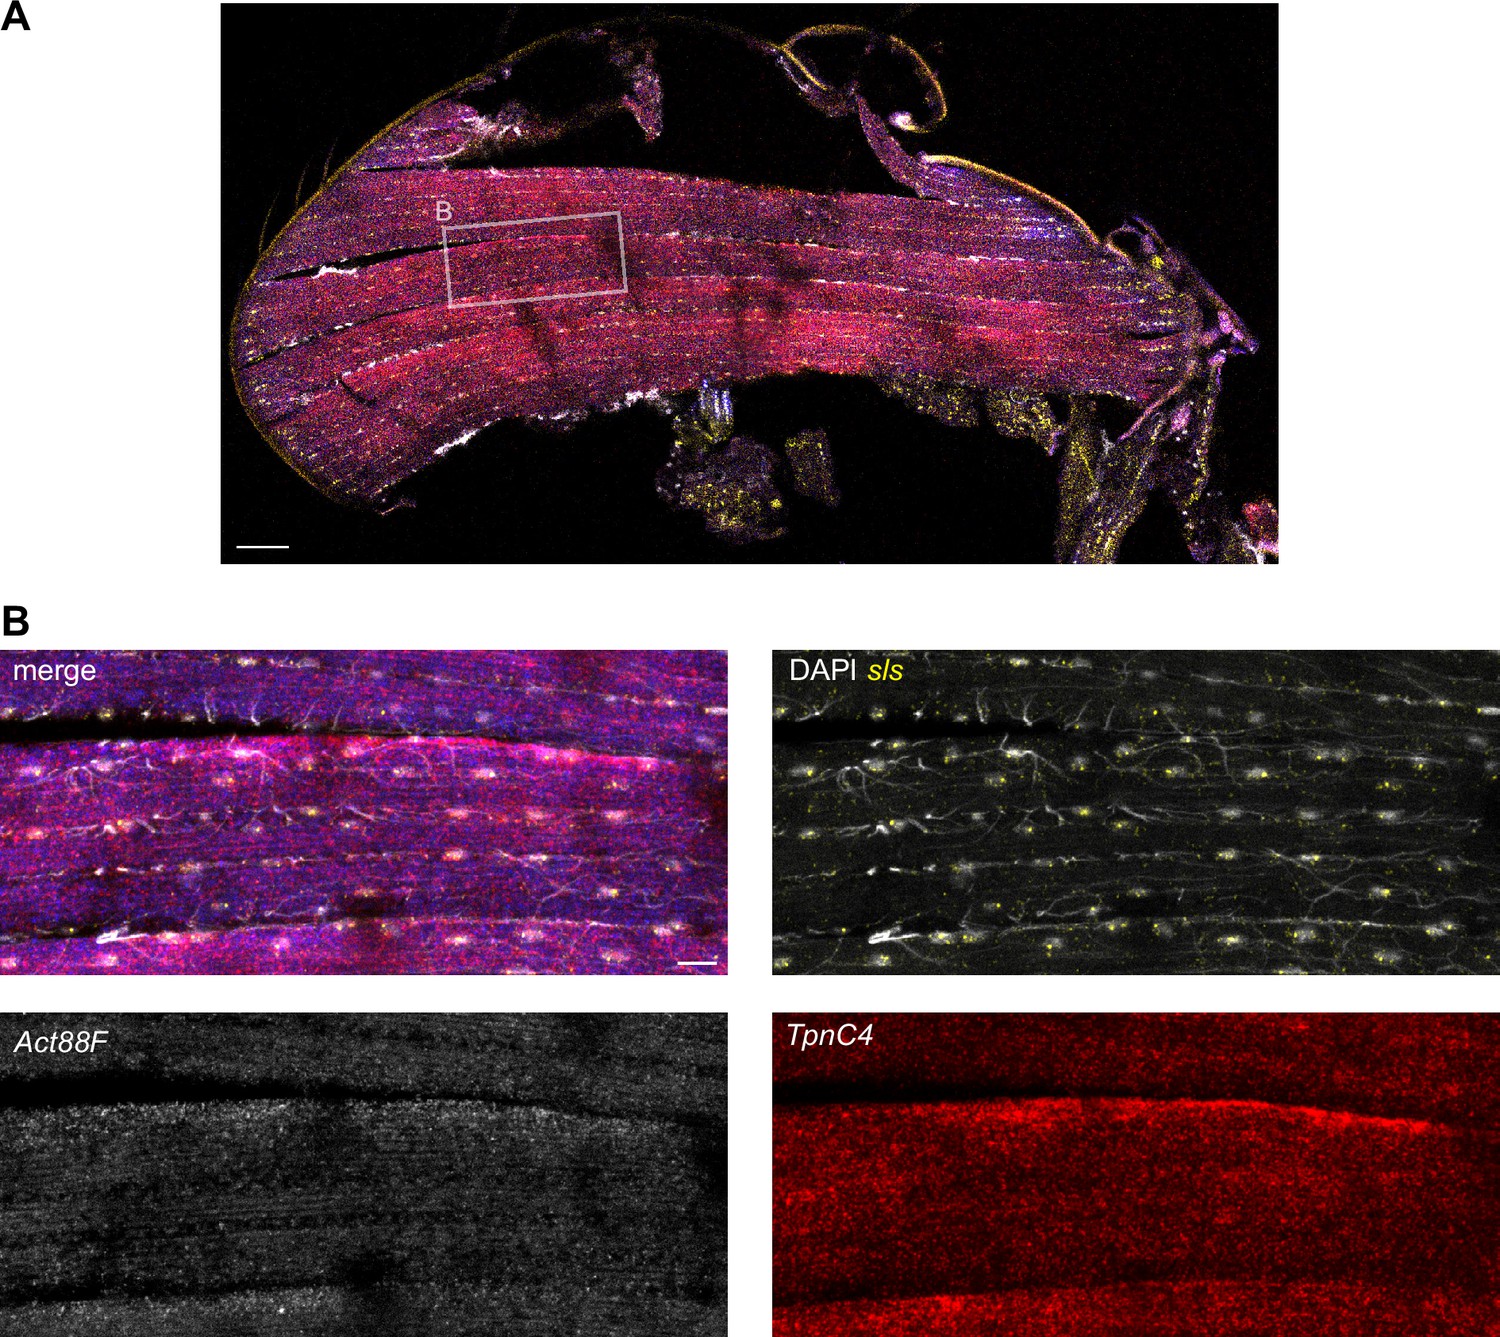
TpnC4, Act88F, and Mhc mRNAs flight muscle patterning.
(A) Molecular Cartography visualization of TpnC4, Act88F, and Mhc mRNAs on an adult fly section (same section as in Figure 3). The white box marks the zoom-in region shown in (B). (B) Zoom-in on the flight muscle showing the striped patterns of TpnC4, Act88F (blue in overlay), and Mhc mRNAs in the indirect flight muscle. (C) Hybridization chain reaction-fluorescence in situ hybridization (HCR-FISH) of TpnC4 and Act88F mRNAs in an adult thorax. The white box marks zoom-in the region shown in (D). (D) Zoom-in on the flight muscle of HCR-FISH labeling TpnC4 and Act88F mRNAs (same section as in Figure 4D). (E) HCR-FISH of Mhc mRNAs in an adult thorax. The white box marks the zoom-in region shown in (F). (F) Zoom-in on the flight muscle of HCR-FISH labeling Mhc mRNAs. Scale bars represent 50 µm in (A), (C), (E). and 10 µm in (B), (D), (F). Background stain labels DAPI.
Figure 5—figure supplement 1
Variation in mRNA localization using Hybridization chain reaction-fluorescence in situ hybridization (HCR-FISH).
(A) HCR-FISH of TpnC4, Act88F, and sls mRNAs in an adult fly thorax. The white box marks the zoom-in region shown in (B). (B) Zoom-in of HCR-FISH of TpnC4, Act88F (blue in overlay), and sls mRNAs in an adult indirect flight muscle. Note that Act88F and TpnC4 mRNAs largely overlap in this example. The scale bar represents 50 µm in (A) and 10 µm in (B).
Figure 6 with 1 supplement
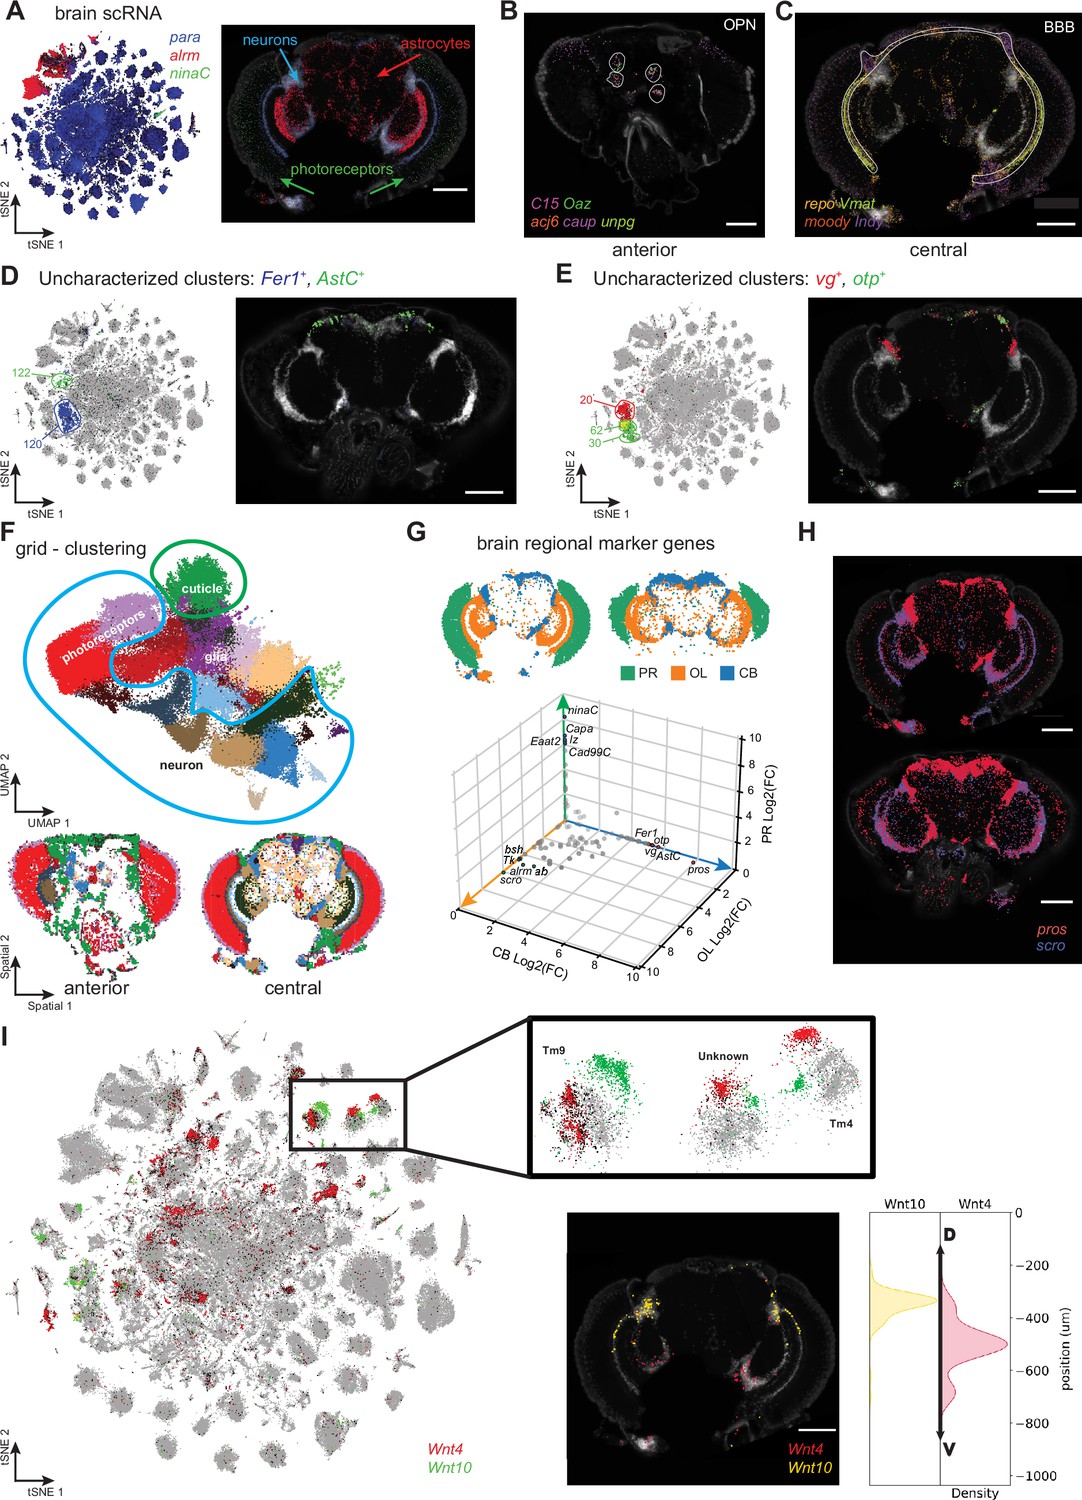
Adult head cell types.
(A) tSNE showing expression of photoreceptor (ninaC), neuronal (para) and glial (repo) markers (left). Molecular Cartography of the same marker genes (right). (B, C) Molecular Cartography of marker genes for olfactory projection neurons (OPN), in an anterior head slice (B) and of perineurial glia of the blood-brain barrier (BBB) in a more central brain slice (C). (D, E) Using Molecular Cartography to localize uncharacterized clusters found in scRNA-seq data. (F) UMAP showing clustering of 5 µm × 5 µm grid spots (top). Spatial location of grid clusters in the brain (bottom). (G) Differential expression of central brain (CB), optic lobe (OL) and photoreceptor regions (PR). (H) Molecular Cartography of pros and scro in the brain. (I) tSNE showing split in optic lobe clusters by expression of Wnt4 and Wnt10. Insert shows Molecular Cartography of Wnt4 and Wnt10, spatially localized in ventral and dorsal brain regions, respectively. Scale bars represent 100 µm. Background stain labels DAPI.
Figure 6—figure supplement 1
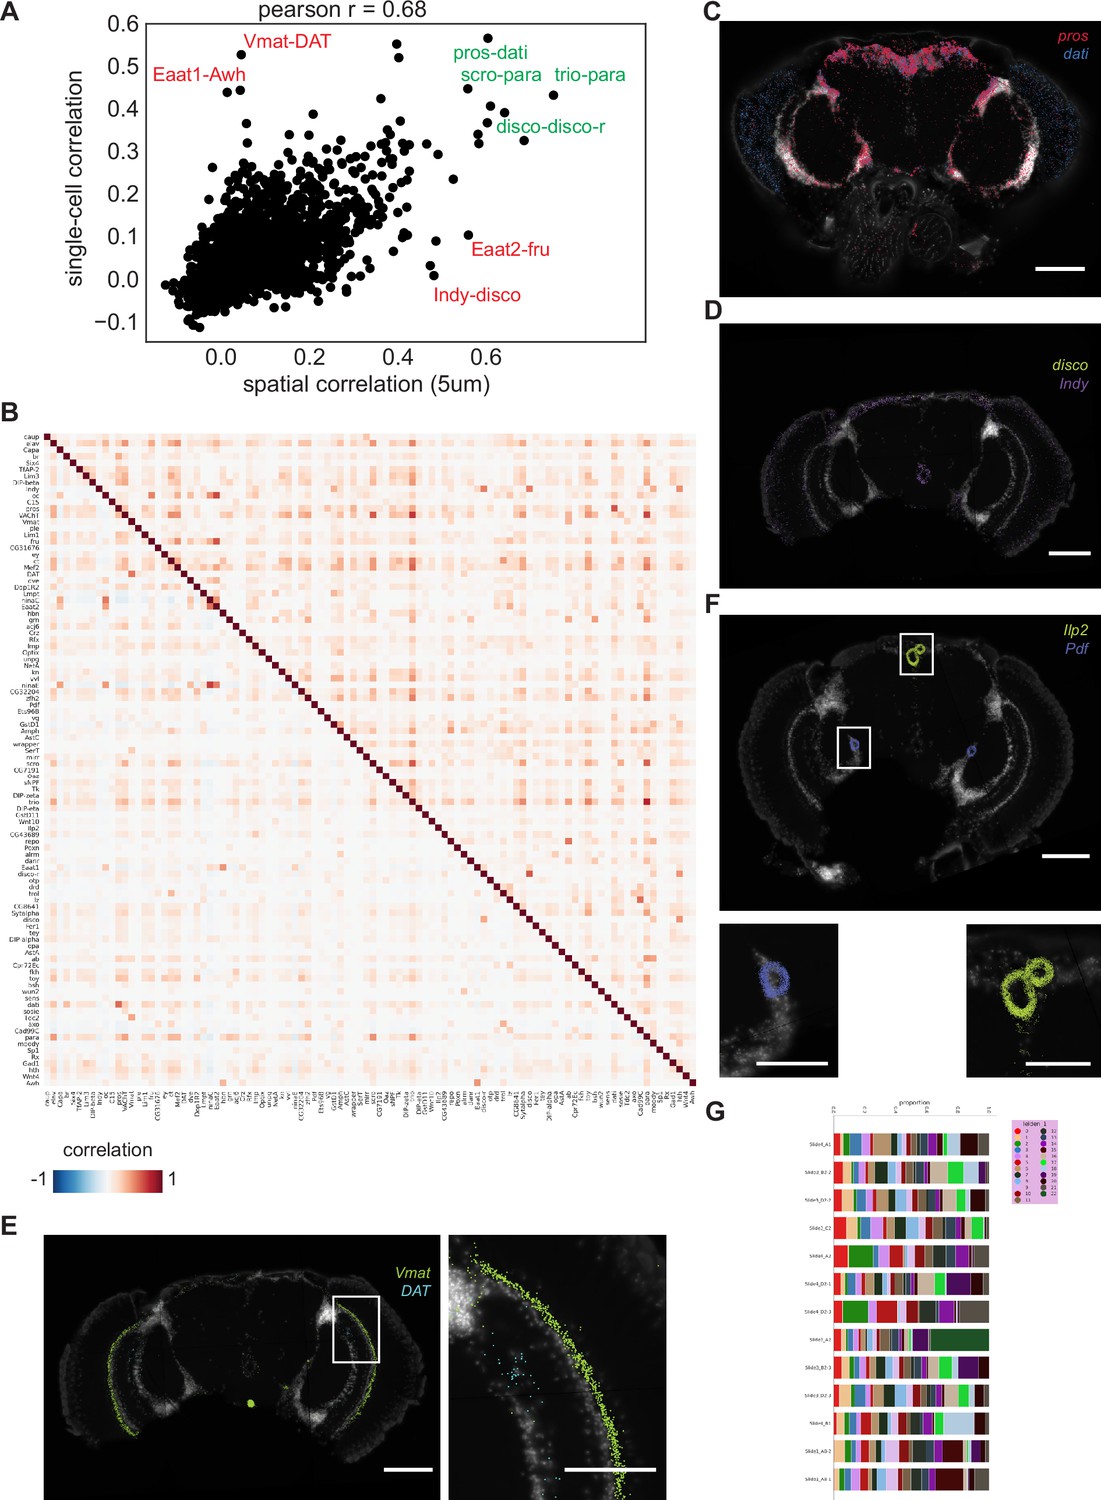
Comparison of head spatial datasets with brain single-cell datasets.
(A) Gene-gene correlation measured across grid-based 5 µm squares and cells. Example mismatches shown in red, matching co-expression in green. (B) Composite heatmap showing gene-gene co-expression based on Pearson correlation. Bottom triangle calculated on spatial datasets (using grid-based 5 µm squares). Top triangle calculated using single-cell data. (C) Molecular Cartography showing high co-expression of pros and dati. (D) Molecular Cartography showing co-expression of Indy and disco. (E) Molecular Cartography showing expression of Vmat and DAT. Zoom shows non-overlapping expression and expression of Vmat outside of nuclei marked by white DAPI. (F) Molecular Cartography showing expression of mRNA coding for neuropeptides Ilp2 and Pdf. Zooms show expression outside of nuclei marked by white DAPI signal. (G) Stacked barplot showing sample composition based on Leiden 1 clustering. Background stain labels DAPI. Scale bars represent 100 µm in (C-F) and 50 µm in the zoomed regions of (E, F).
Figure 7 with 1 supplement
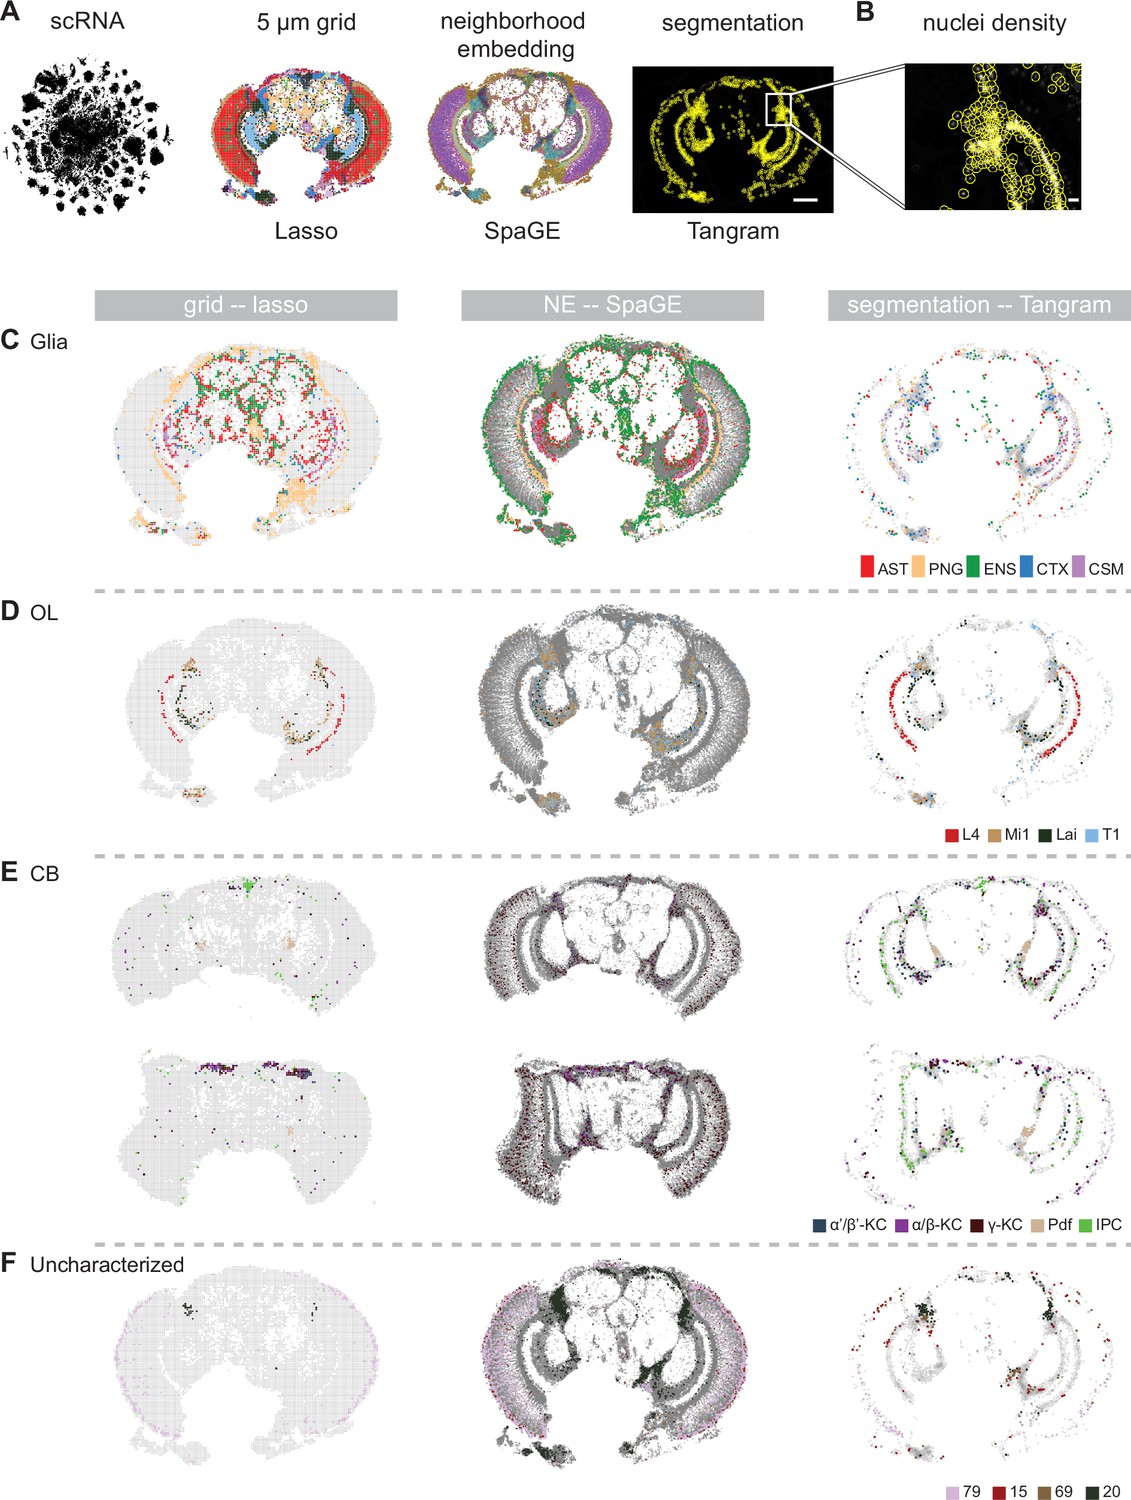
Comparison of different techniques for annotating the adult head samples.
(A) Overview of different spatial analysis methods which were used to annotate Molecular Cartography with labels from single-cell RNA-seq: grid-based, neighborhood embedding and nuclei segmentation. Scale bar represents 100 µm. (B) Zoom-in on a high-density region with corresponding segmented nuclei. Scale bar represents 10 µm. (C-F) Comparison of annotation of spatial data with single-cell RNA-seq for three different quantification methods. Grid-based squares/neighborhoods/nuclei are colored based on matching single-cell clusters for (C) glia, (D) optic lobe, (E) central brain, and (F) four uncharacterized clusters. In (E) two brain slices are shown at different depths: central (top) and posterior (bottom). NE: neighborhood embedding.
Figure 7—figure supplement 1
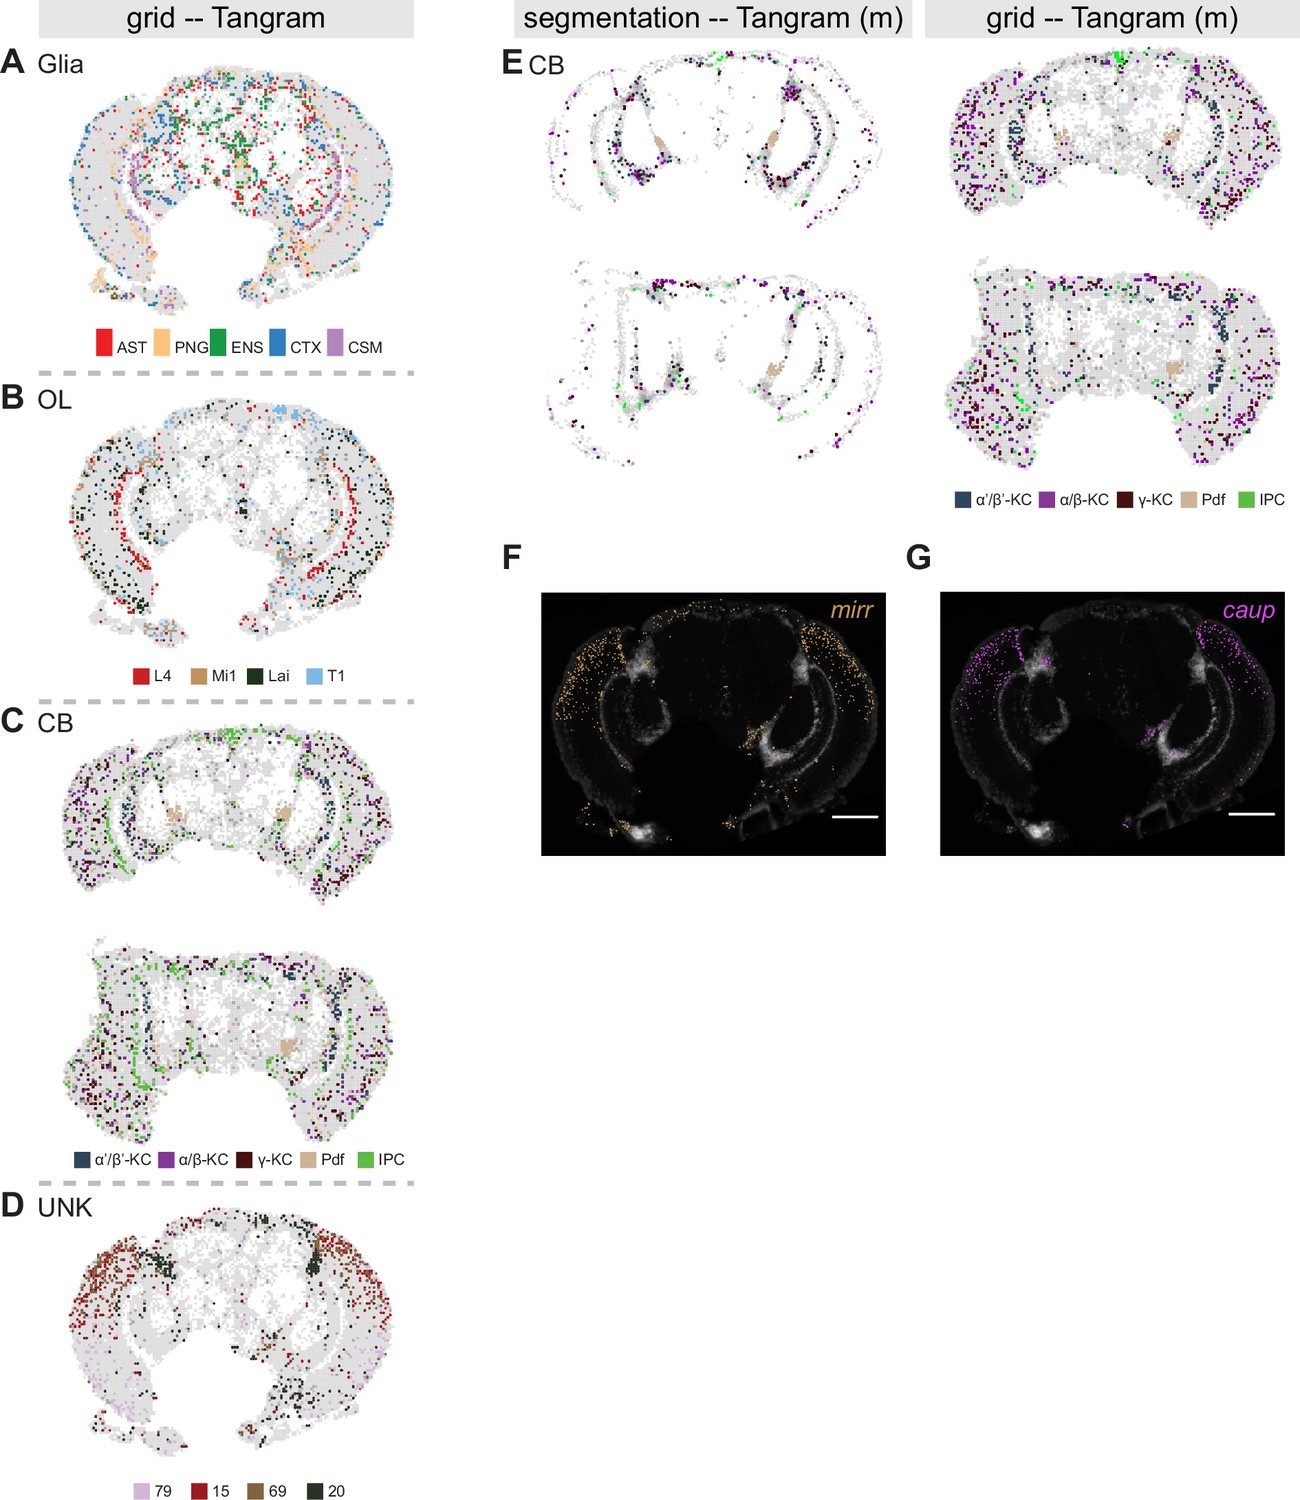
Tangram on grid-based quantification.
(A-D) Comparison of annotation of spatial data with single-cell RNA-seq. Grid-based squares are colored based on mapped single-cell cluster labels for (A) glia, (B) optic lobe, (C) central brain, and (D) uncharacterized clusters using Tangram. In (F) two brain slices are shown at different depths: central (top) and posterior (bottom). (E) Effect of manually adjusted thresholds on Tangram score for nuclei segmentation (left) and grid-based quantification (right) for central brain clusters: 98%-quantile for assigning Pdf-neurons and 99%-quantile for IPC labels. (F) Molecular Cartography showing expression of mirr. (G) Molecular Cartography showing expression of caup. Scale bars represent 100 µm. Background stain labels DAPI.
Author response image 1

Barplots showing total number of mRNA molecules detected in Molecular Cartography (MC, Resolve, spatial spots) and in snRNA-seq data from the Fly Cell Atlas (10x Genomics, UMIs).
Individual black dots show individual experiments, counts are only shown for the chosen gene panel for each sample. Bar shows the mean, with error bars representing the standard error.
Tables
Key resources table
| Reagent type (species) or resource | Designation | Source or reference | Identifiers | Additional information |
|---|---|---|---|---|
| strain, strain background (Drosophila melanogaster) | Luminy | Loreau et al., 2023 | ||
| gene (Drosophila melanogaster) | sls | http://flybase.org/reports/FBgn0086906 | FBgn0086906 | |
| gene (Drosophila melanogaster) | Act88F | http://flybase.org/reports/FBgn0000047 | FBgn0000047 | |
| gene (Drosophila melanogaster) | Act88F | http://flybase.org/reports/FBgn0000047 | FBgn0000047 | |
| gene (Drosophila melanogaster) | TpnC4 | http://flybase.org/reports/FBgn0033027 | FBgn0033027 | |
| gene (Drosophila melanogaster) | Mhc | http://flybase.org/reports/FBgn0264695 | FBgn0264695 | |
| chemical compound, drug | OCT | VWR | 00411243 | |
| chemical compound, drug | Gelatin | Merck | porcine skin, 300 g Bloom Type A | |
| software, algorithm | SCANPY | Wolf et al., 2018; https://github.com/scverse/scanpy | RRID:SCR_018139 Version: v.1.8.1 | |
| software, algorithm | Tangram | Biancalani et al., 2021; https://github.com/broadinstitute/Tangram | Version: v1.0.2 | |
| software, algorithm | SpaGE | Abdelaal et al., 2020; https://github.com/tabdelaal/SpaGE | ||
| software, algorithm | Spage2Vec | Partel and Wählby, 2021; https://github.com/wahlby-lab/spage2vec | Version: v2.0 | |
| software, algorithm | Cellprofiler | Stirling et al., 2021; https://cellprofiler.org/ | RRID:SCR_007358 Version: v4.0.7 | |
| software, algorithm | SpatialNF | https://github.com/aertslab/SpatialNF |
Additional files
-
MDAR checklist
- https://cdn.elifesciences.org/articles/92618/elife-92618-mdarchecklist1-v1.pdf
-
Supplementary file 1
All 50 genes used for body MC experiments, including their expression levels and top expressing cell types inferred from the FCA.
- https://cdn.elifesciences.org/articles/92618/elife-92618-supp1-v1.xlsx
-
Supplementary file 2
All 100 genes used for head MC experiments, including their expression levels and top expressing cell clusters inferred from the Pech et al., 2024.
- https://cdn.elifesciences.org/articles/92618/elife-92618-supp2-v1.xlsx
-
Supplementary file 3
Detailed description of the 13 head section samples.
- https://cdn.elifesciences.org/articles/92618/elife-92618-supp3-v1.xlsx
-
Supplementary file 4
All probe sequences used for the HCR-FISH experiments.
- https://cdn.elifesciences.org/articles/92618/elife-92618-supp4-v1.xlsx
Download links
A two-part list of links to download the article, or parts of the article, in various formats.
Downloads (link to download the article as PDF)
Open citations (links to open the citations from this article in various online reference manager services)
Cite this article (links to download the citations from this article in formats compatible with various reference manager tools)
Spatial transcriptomics in the adult Drosophila brain and body
eLife 13:RP92618.
https://doi.org/10.7554/eLife.92618.3


