Rule-based modulation of a sensorimotor transformation across cortical areas
- Solomon H. Snyder Department of Neuroscience, Kavli Neuroscience Discovery Institute, Brain Science Institute, Johns Hopkins University School of Medicine, United States
- Zanvyl Krieger Mind/Brain Institute, Johns Hopkins University, United States
Figures
Figure 1 with 2 supplements
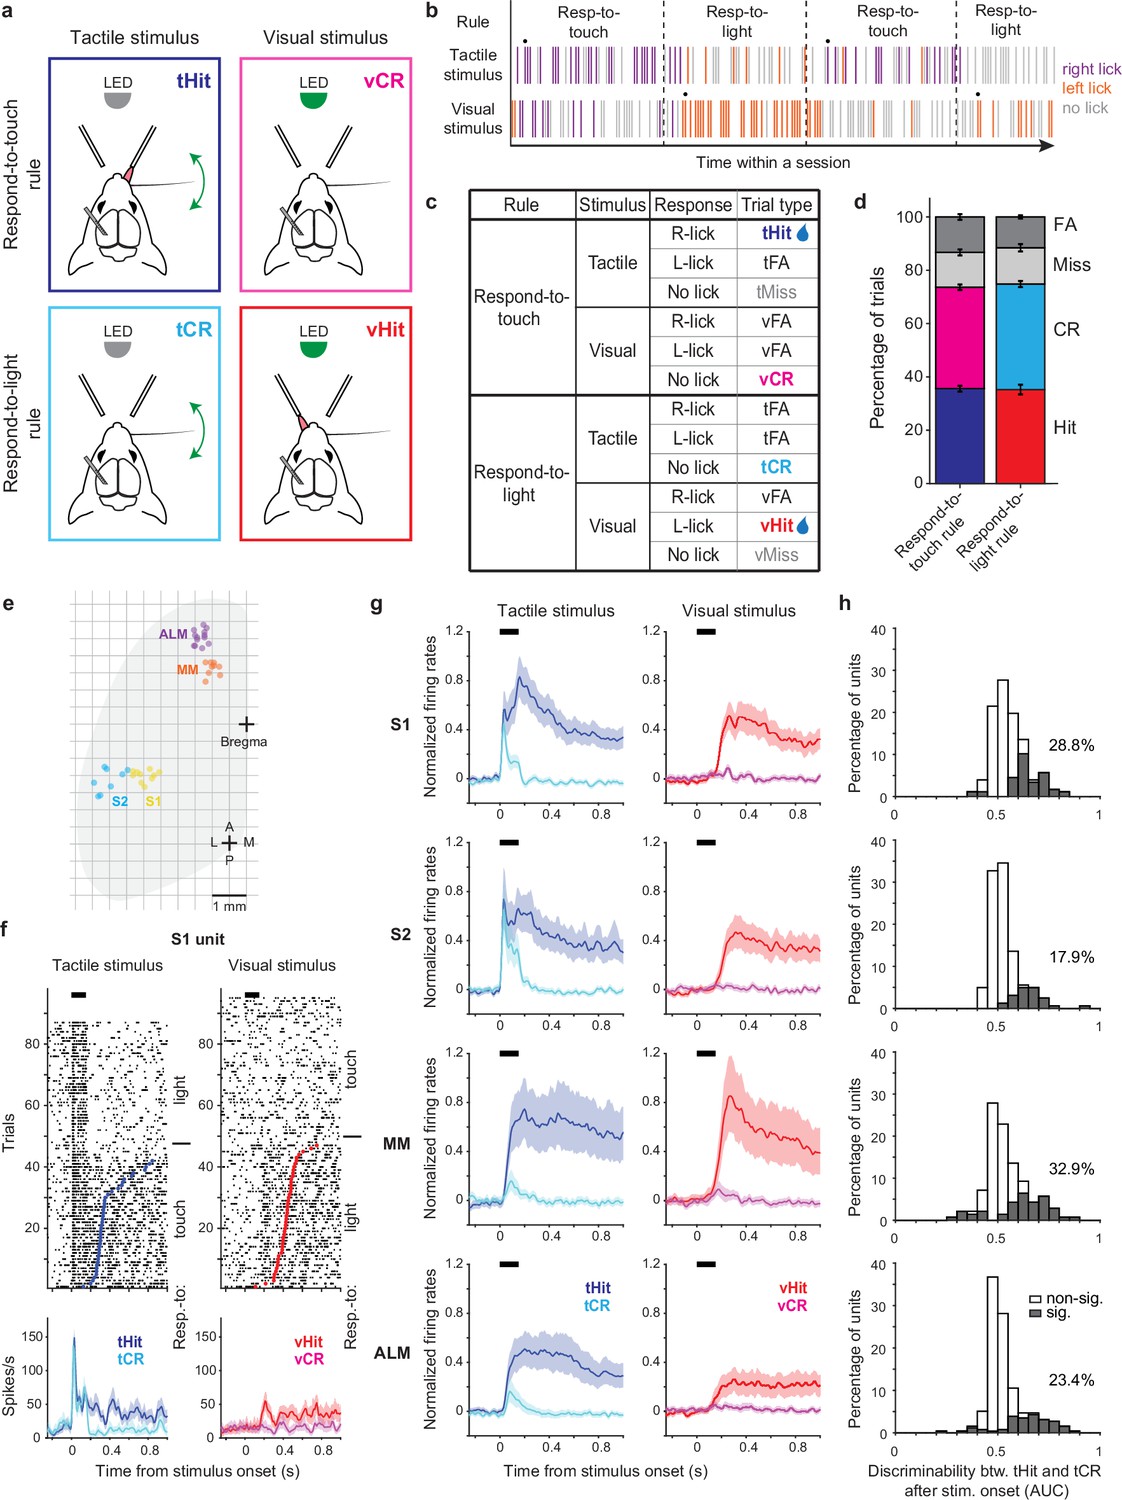
Touch-evoked activity of individual neurons is modulated by task rules.
(a) Schematic of the cross-modal sensory selection task. Tactile and visual stimuli were associated with water reward during the respond-to-touch and respond-to-light rules, respectively. Mice were trained to lick to the right reward port after a tactile stimulus during the respond-to-touch rule, and lick to the left reward port after a visual stimulus during the respond-to-light rule. Mice withheld licking after a reward irrelevant stimulus (tactile stimulus during the respond-to-light rule or visual stimulus during the respond-to-touch rule). (b) Example behavioral session. Tactile and visual trials were randomly interleaved. Respond-to-touch and respond-to-light rules alternated in different blocks of trials during a behavioral session (~60 trials/block). The mouse adaptively changed its stimulus-response strategies based on the task rules. Each bar represents a trial and colors indicate lick responses (right lick: purple; left lick: orange; no lick: gray). A drop of water was delivered to the new reward port on the 9th trial (black dot) to cue mice to the rule switch. (c) Task design and trial outcomes. Correct licking responses were hits, and correct withholding of responses were correct rejections (CR). Failed responses were misses, and incorrect licking responses were false alarms (FA). Two sensory modalities and four types of trial outcomes comprise eight trial types. (d) The fractions of trial outcomes were similar between the respond-to-touch and respond-to-light rules (touch vs light: hit [36 ± 1% vs 35 ± 2%]; correct rejection [38 ± 1% vs 40 ± 1%]; miss [13 ± 1% vs 14 ± 1%]; false alarm [13 ± 1% vs 12 ± 1%]). The behavioral performance was ~75% correct for both rules (touch: 74 ± 1%, light: 75 ± 1%). Means ± s.e.m.; n=12 mice. (e) Reconstructed locations of silicon probes. S1: primary somatosensory cortex (6 mice, 10 sessions). S2: secondary somatosensory cortex (5 mice, 8 sessions). MM: medial motor cortex (7 mice, 9 sessions). ALM: anterolateral motor cortex (8 mice, 13 sessions). (f) Raster plots (top) and trial-averaged activity (bottom) of an example S1 unit. Correct tactile (left) and visual (right) trials were sorted by rule and response (tactile hit [tHit], blue; tactile correct rejection [tCR], cyan; visual hit [vHit], red; visual correct rejection [vCR], magenta). Dots indicate the first lick in hit trials. Thick black bars show the stimulus delivery window. Error shading: bootstrap 95% confidence interval (CI). (g) Normalized activity (z-score) across the population of recorded neurons in S1 (177 neurons), S2 (162 neurons), MM (140 neurons), and ALM (256 neurons). Error shading: bootstrap 95% CI. (h) Distribution of tHit and tCR discriminability for individual neurons. Discriminability of tHits and tCRs was defined as the ability of an ideal observer to discriminate tHits from tCRs on a trial-by-trial basis (0–150 ms; 10 ms bins). Approximately 15–35% of neurons showed significant difference between tHit and tCR responses (gray area; Bonferroni corrected 95% CI of area under the receiver-operating curve (AUC) does not include 0.5 for at least three consecutive time bins) in S1 (28.8%), S2 (17.9%), MM (32.9%), and ALM (23.4%).
Figure 1—figure supplement 1
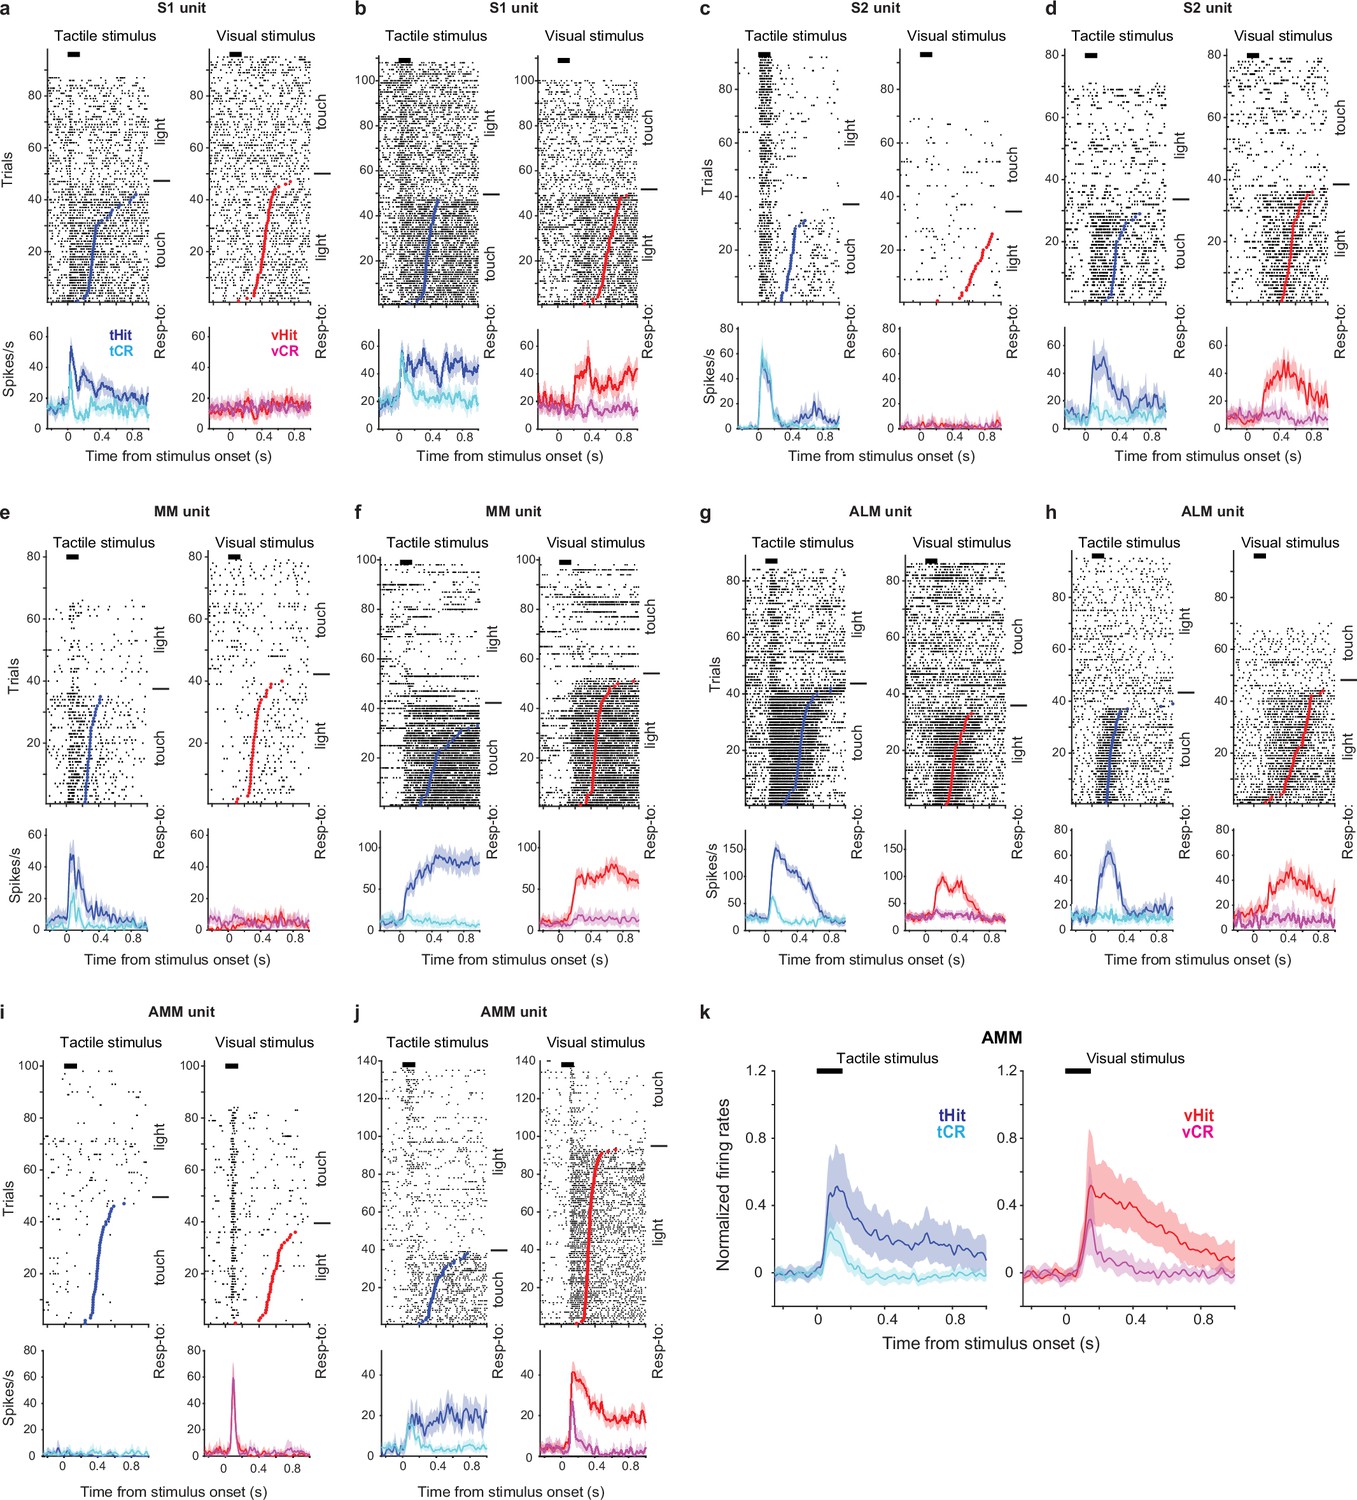
Additional examples of single-unit responses during the cross-modal selection task.
(a, b) Raster plots (top) and trial-averaged activity (bottom) of two example S1 units. Correct tactile (left) and visual (right) trials were grouped by rules and responses (tactile hit, blue; tactile correct rejection, cyan; visual hit, red; visual correct rejection, magenta). Dots indicate the first lick in hit trials. Thick black bars show periods of stimulus delivery. Error shading shows bootstrap 95% CI. (c–j) Same as (a) and (b) but for example units from S2 (c, d), MM (medial motor cortex) (e, f), ALM (anterolateral motor cortex) (g, h), and AMM (the anteromedial part of the motor cortex; (i, j). (k)) Normalized activity (z-score) across the population of recorded neurons in AMM (110 neurons). Error shading: bootstrap 95% CI.
Figure 1—figure supplement 2
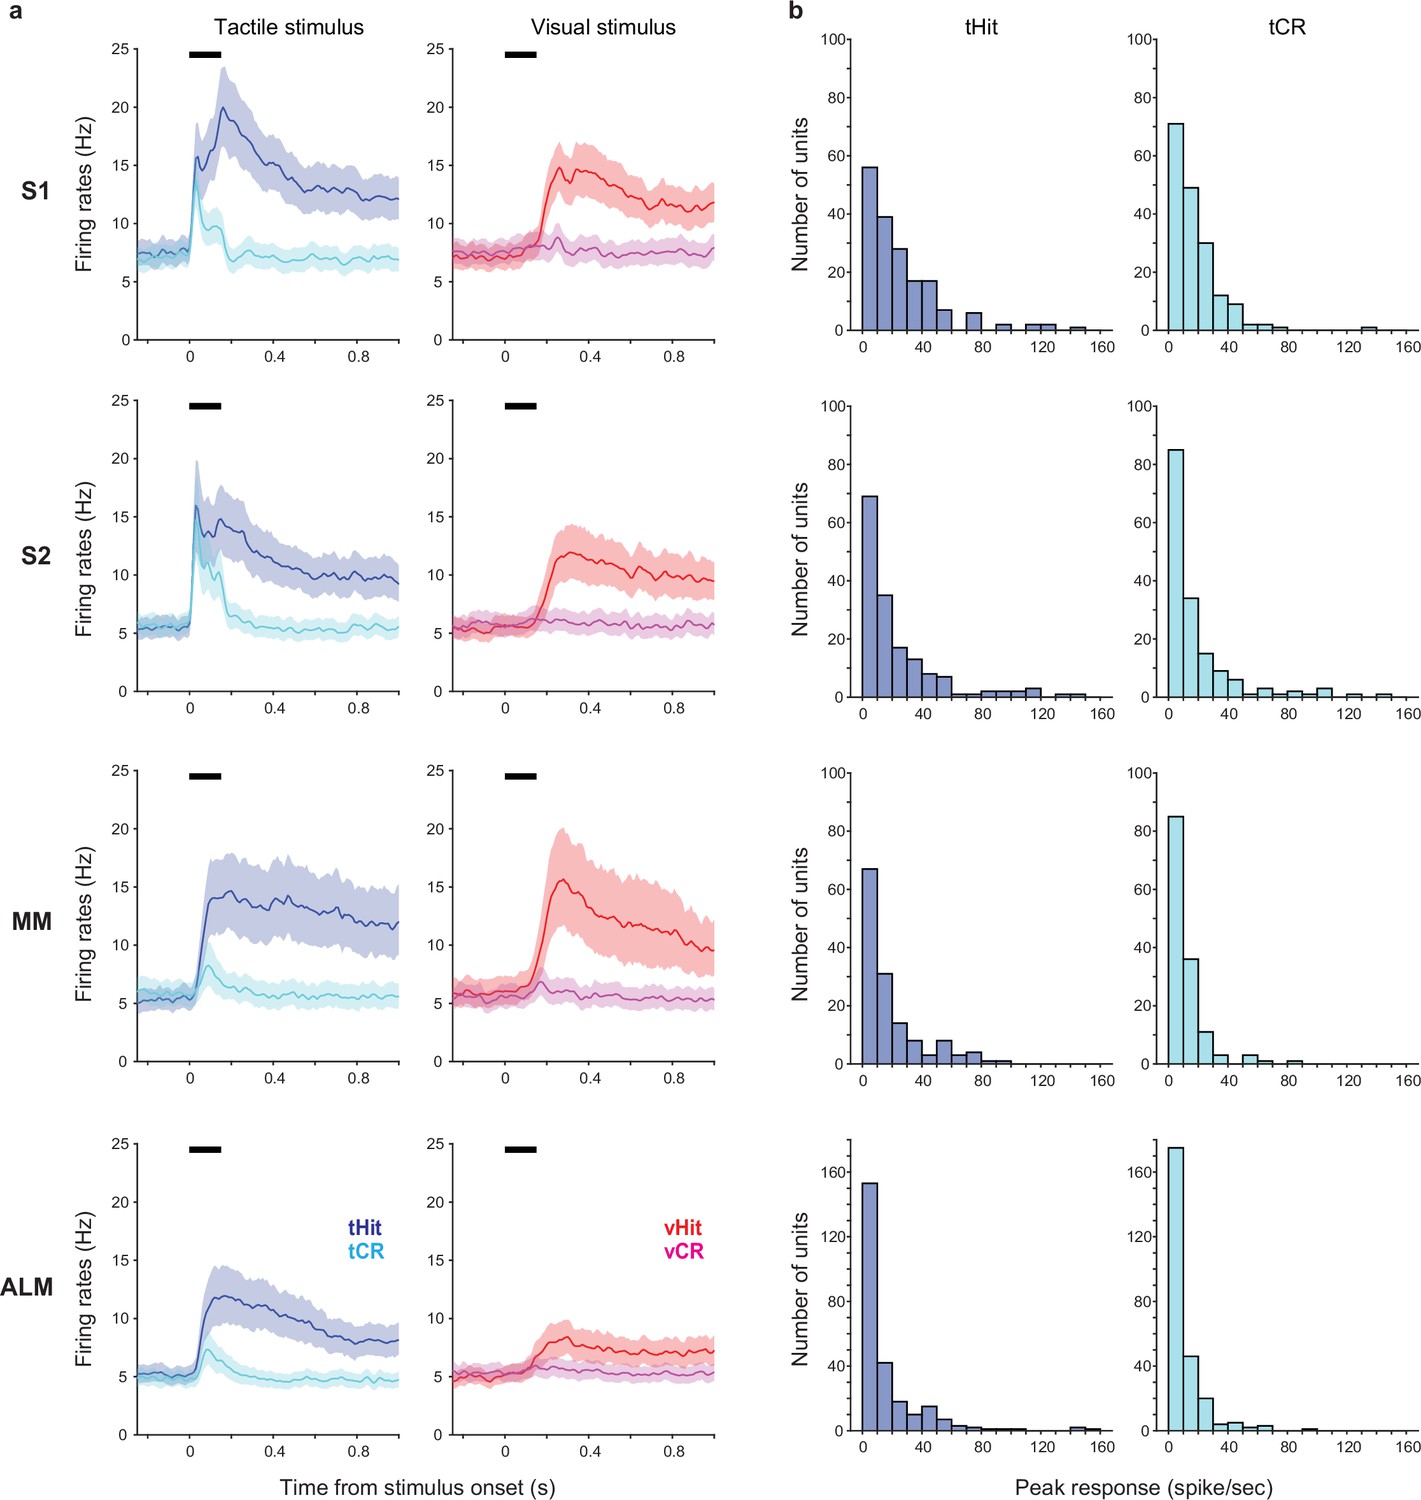
Mean firing rates across neurons and distributions of peak touch-evoked responses.
(a) Mean firing rates across the population of recorded neurons in S1 (177 neurons), S2 (162 neurons), medial motor cortex (MM) (140 neurons), and anterolateral motor cortex (ALM) (256 neurons). Left panel: Responses in correct tactile trials (tactile hits [tHit], blue; tactile correct rejections [tCR], cyan). Right panel: Responses in correct visual trials (visual hits [vHit], red; visual correct rejections [vCR], magenta). Thick black bars show the stimulus delivery window. Error shadings show bootstrap 95% CIs. (b) Distribution of peak responses during the stimulus period in tHit (left) and tCR (right) trials for the neurons shown in a.
Figure 2
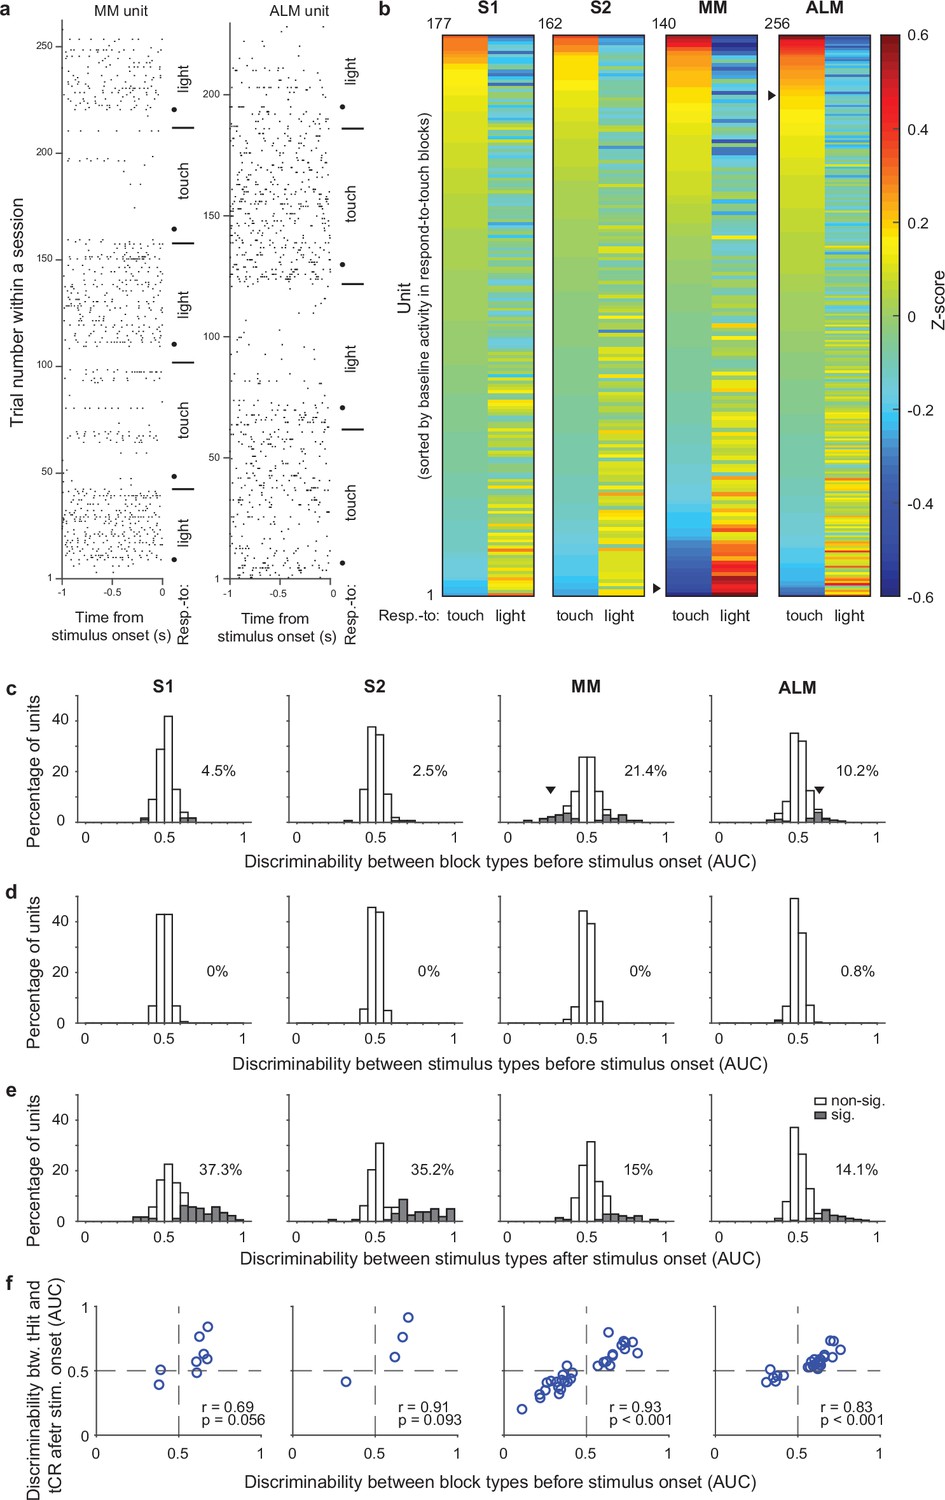
Single-unit activity before stimulus delivery reflects task rules.
(a) Raster plots for example units from medial motor cortex (MM) (left) and anterolateral motor cortex (ALM) (right). Neural activity before stimulus delivery (−1 to 0 s from stimulus onset) changed across blocks within a session. Horizontal lines show block transitions and black dots indicate switch cues. (b) Heatmap of normalized (z-scored) pre-stimulus activity (−100 to 0 ms) across correct trials in respond-to-touch and respond-to-light blocks for units in S1 (n=177), S2 (n=162), MM (n=140), and ALM (n=256). Right-pointing triangles label example units in (a). (c) Distribution of respond-to-touch and respond-to-light discriminability for individual neurons. The respond-to-touch and respond-to-light discriminability was measured by the ability of an ideal observer to discriminate respond-to-touch from respond-to-light pre-stimulus activity (−100 to 0 ms) on a trial-by-trial basis (area under the receiver-operating curve [AUC]). The percentages of units showing significant discriminability (gray areas: Bonferroni corrected 95% CI of AUC did not include 0.5) were higher in motor cortical regions (MM: 21.4%; ALM: 10.2%) than in sensory cortical regions (S1: 4.5%; S2: 2.5%). Downward-pointing triangles label example units in (a). (d) Distribution of stimulus discriminability (tactile vs visual stimuli) for individual neurons during the pre-stimulus-onset window (−100 to 0 ms). Almost no units show significant stimulus discriminability before the stimulus onset (S1: 0%; S2: 0%; MM: 0%; ALM: 0.8%). (e) Same as (d) but for the post-stimulus-onset window (0–100 ms). A large percentage of units show significant stimulus discriminability after the stimulus onset (S1: 37.3%, S2: 35.2%, MM 15%, and ALM 14.1%). (f) Relationship between block-type discriminability before stimulus onset and tHit-tCR discriminability after stimulus onset for units showing significant block-type discriminability prior to the stimulus. Pearson correlation: S1: r=0.69, p=0.056, 8 neurons; S2: r=0.91, p=0.093, 4 neurons; MM: r=0.93, p<0.001, 30 neurons; ALM: r=0.83, p<0.001, 26 neurons. tHit, tactile hit; tCR, tactile correct rejection.
Figure 3 with 1 supplement
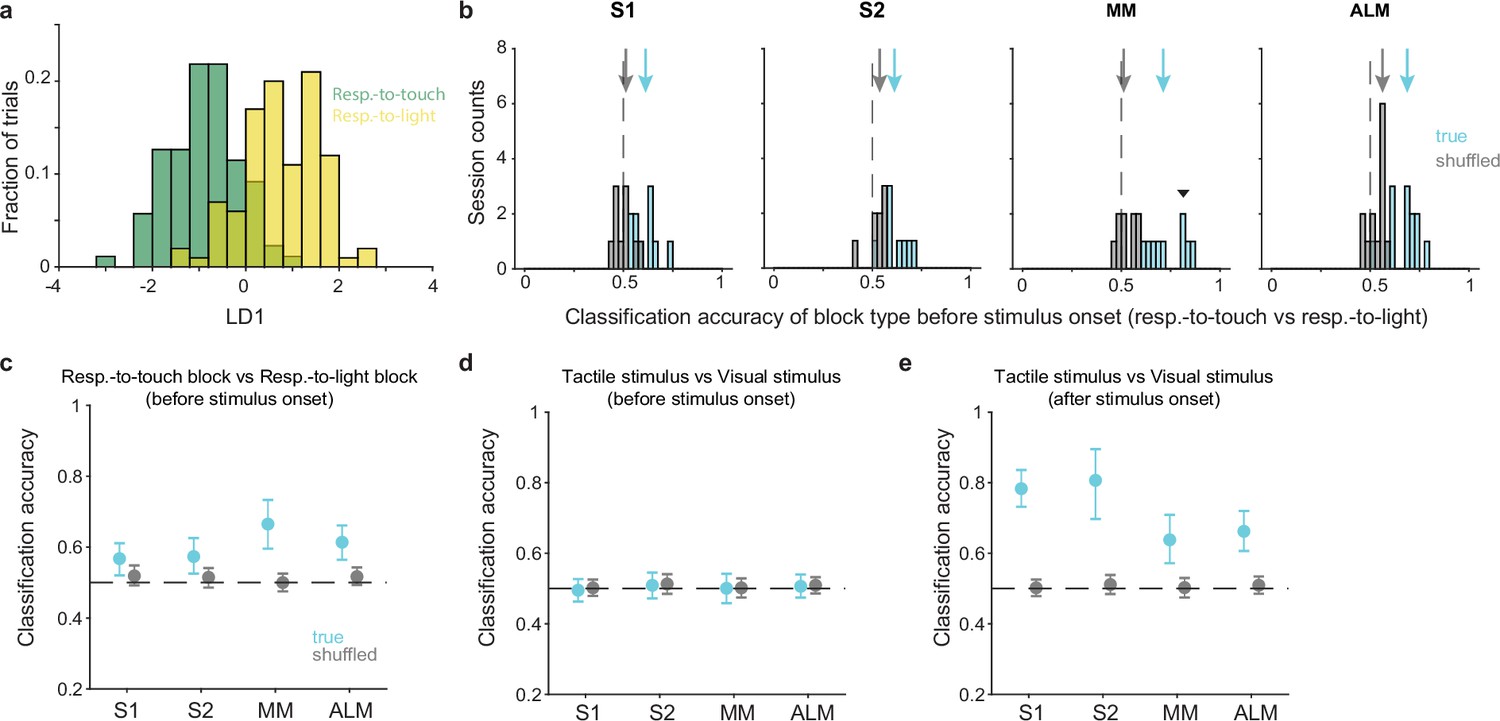
Pre-stimulus states of neural populations are rule-dependent.
(a) Decoding of task rule (respond-to-touch vs respond-to-light) through linear discriminant analysis (LDA) for an example session. Pre-stimulus population activity (medial motor cortex [MM]; 21 neurons; –100 to 0 ms from stimulus onset) in respond-to-touch (green) and respond-to-light (yellow) blocks were projected onto the first linear discriminant (LD1). This plot shows the histogram of the projections onto the LD1 axis. (b) Distribution of classification accuracy for task rule (respond-to-touch vs respond-to-light) based on pre-stimulus activity for simultaneously recorded neurons in each session (S1: 10 sessions; S2: 8 sessions; MM: 9 sessions; anterior lateral motor cortex [ALM]: 13 sessions). The true (cyan) data showed better classification accuracy compared with the shuffled (gray) data (medians of classification accuracy [true vs shuffled]: S1 [0.61 vs 0.5]; S2 [0.62 vs 0.53]; MM [0.7 vs 0.52]; ALM [0.68 vs 0.55]). Arrows show classification accuracy medians. Dashed lines indicate the chance level (0.5). The downward-pointing triangle shows the example session in (a). (c) Session-averaged classification accuracy for task rules based on pre-stimulus population activity in S1 (95% CI of true [cyan] and shuffled [gray] data: true [0.52,0.61], shuffled [0.49,0.55]), S2 (true [0.53,0.63], shuffled [0.49, 0.54]), MM (true [0.60,0.73], shuffled [0.48, 0.53]) and ALM (true [0.56,0.66], shuffled [0.49, 0.54]). Error bars show bootstrap 95% CI. (d) Same as (c) but for the classification accuracy for stimulus types. (e) Same as (c) but for the classification accuracy for stimulus types based on population activity after stimulus onset (0–100 ms).
Figure 3—figure supplement 1
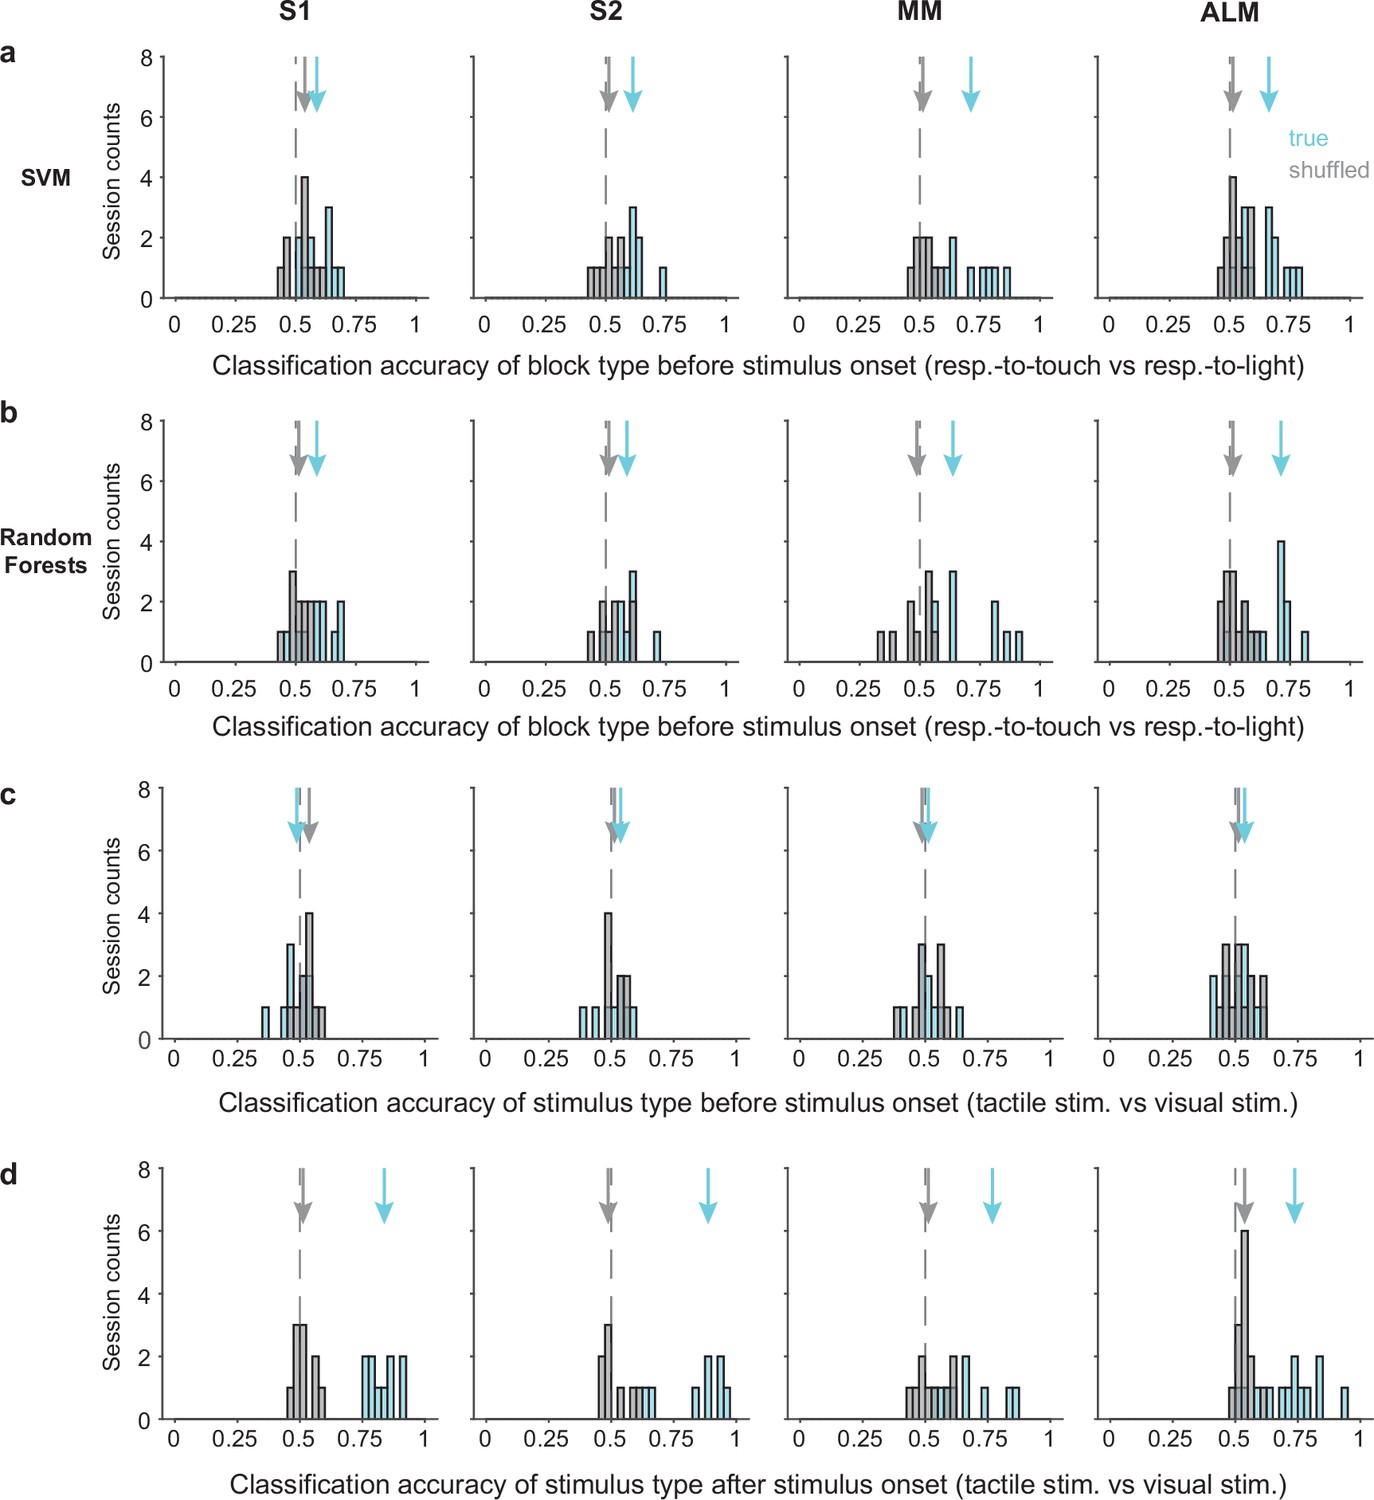
Classification accuracy for task rules and stimulus types.
(a) Distribution of classification accuracy for task rule (respond-to-touch vs respond-to-light) based on pre-stimulus population activity (−100 to 0 ms from stimulus onset) using a support vector machine (SVM). Arrows show classification accuracy medians for true (cyan) and shuffled (gray) data. Dashed lines indicate the chance level (0.5). (b) Same as (a) but using a Random Forests classifier. (c) Distribution of classification accuracy for stimulus types (tactile stimulus vs visual stimulus) based on pre-stimulus population activity using linear discriminant analysis (LDA). (d) Same as (c) but based on population activity after stimulus onset (0–100 ms from stimulus onset). S1: 10 sessions, S2: 8 sessions, medial motor cortex (MM): 9 sessions, anterior lateral motor cortex (ALM): 13 sessions.
Figure 4 with 1 supplement

Pre-stimulus states predict subsequent tactile processing.
(a) Schematic of distance (dashed line) between tactile hit (tHit) (blue) and tactile correct rejection (tCR) (cyan) trajectories. (b) Distance between tHit and tCR trajectories in S1, S2, medial motor cortex (MM), and anterior lateral motor cortex (ALM). Gray traces show the time varying tHit-tCR distance in individual sessions and black traces are session-averaged tHit-tCR distance (S1:10 sessions; S2: 8 sessions; MM: 9 sessions; ALM: 13 sessions). (c) Distance between tHit and tCR trajectories. Traces show individual sessions (n=40) pooled across areas and were sorted and labeled based on the distance prior to the stimulus (top 50%: green; bottom 50%: orange). The post-stimulus-onset distance was larger in the top 50% group than the bottom 50% group (permutation test, p<0.001). In (b) and (c) thick black bars show periods of stimulus delivery. (d) Schematic of the subspace overlap between tHit and tCR. A subspace (green parallelogram) for population activity of tHit (blue) is in a high-dimensional neural state space (left panel). If the subspaces of tHit and tCR are aligned, the tHit subspace could explain much of the variance of tCR (high subspace overlap; middle panel). That is, the projection of tCR onto the tHit subspace (purple) preserves much of the variance of tCR (cyan). If the subspaces of tHit and tCR are unaligned, the projection of tCR onto the tHit subspace preserves little of the variance of tCR (right panel). (e) Subspace overlap for control tHit (gray) and tCR (purple) trials in the somatosensory and motor cortical areas. Each circle is a subspace overlap of a session. Paired t-test, tCR – control tHit: S1: –0.23, 8 sessions, p=0.0016; S2: –0.23, 7 sessions, p=0.0086; MM: –0.36, 5 sessions, p<0.001; ALM: –0.35, 11 sessions, p<0.001; significance: ** for p<0.01, *** for p<0.001. (f) Relationship between pre- and post-stimulus-onset subspace overlaps. The subspace overlaps between tHit and tCR trials, calculated during pre- and post-stimulus-onset periods, were correlated (Pearson correlation, r=0.68, p<0.001; linear regression [black line]; 31 sessions).
Figure 4—figure supplement 1
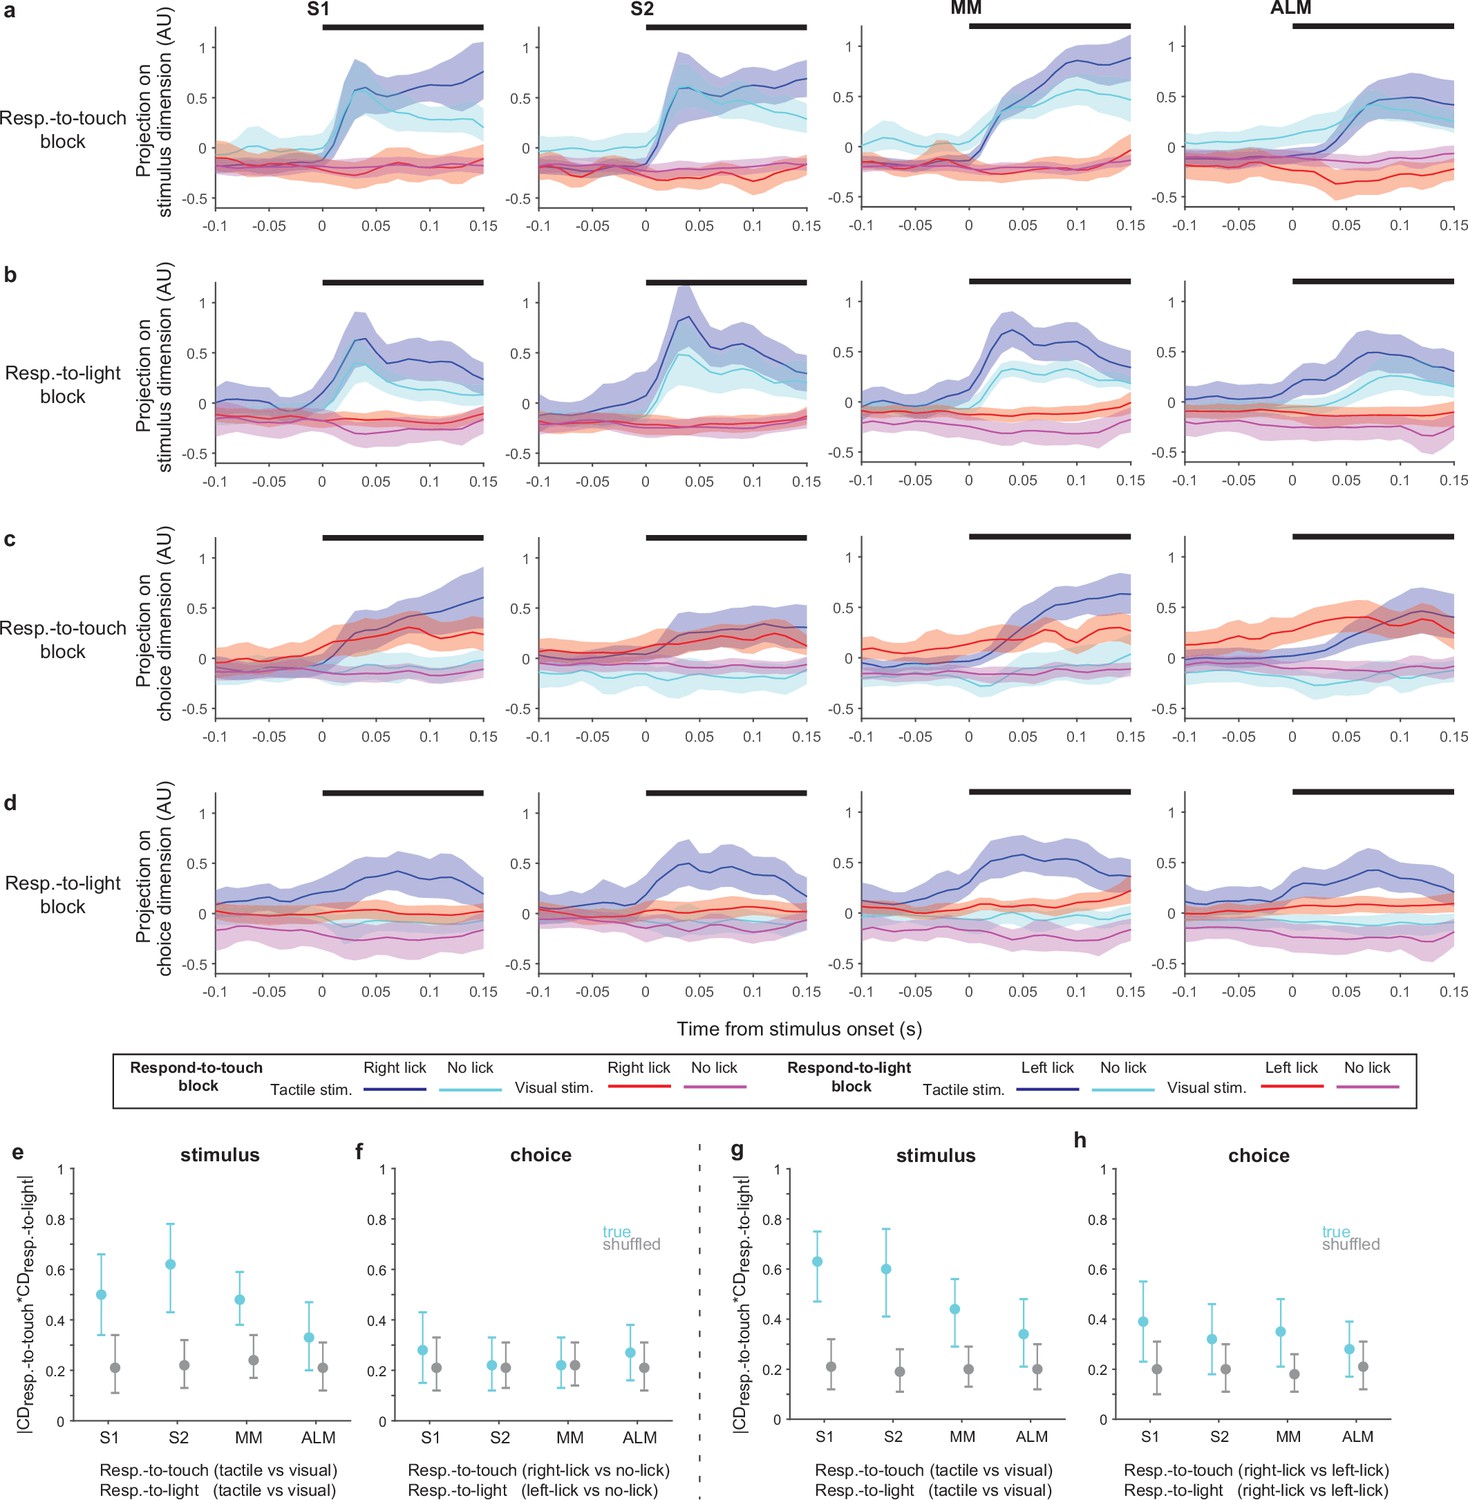
Stimulus and choice coding dimensions (CDs) in respond-to-touch and respond-to-light blocks.
(a) Population activity projected on the stimulus CD in respond-to-touch blocks. Two stimulus types and two behavioral responses compose four conditions (tactile-right-lick: blue; tactile-no-lick: cyan; visual-right-lick: red; visual-no-lick: magenta). Thick black bars (on the top of each panel) show periods of stimulus delivery (0–150 ms). Error shading: bootstrap 95% CI. (b) Population activity projected on the stimulus CD in respond-to-light blocks. Two stimulus types and two behavioral responses compose four conditions (tactile-left-lick: blue; tactile-no-lick: cyan; visual-left-lick: red; visual-no-lick: magenta). (c) Same as (a) but for choice CDs. (d) Same as (b) but for choice CDs. (e) Magnitude of dot product between the stimulus CDs in respond-to-touch and respond-to-light blocks. We used tactile vs visual trials to obtain the stimulus CDs in respond-to-touch and respond-to-light blocks. Means ± 95% CI from bootstrapping. (f) Magnitude of dot product between the choice CDs in respond-to-touch and respond-to-light blocks. To obtain choice CDs, we used right-lick vs no-lick trials in respond-to-touch blocks and left-lick vs no-lick trials in respond-to-light blocks. (g, h) Same as (e, f) but using tactile-right-lick, tactile-left-lick, visual-right-lick, and visual-left-lick trials, with choice CDs calculated based on right-lick vs left-lick trials.
Figure 5 with 1 supplement
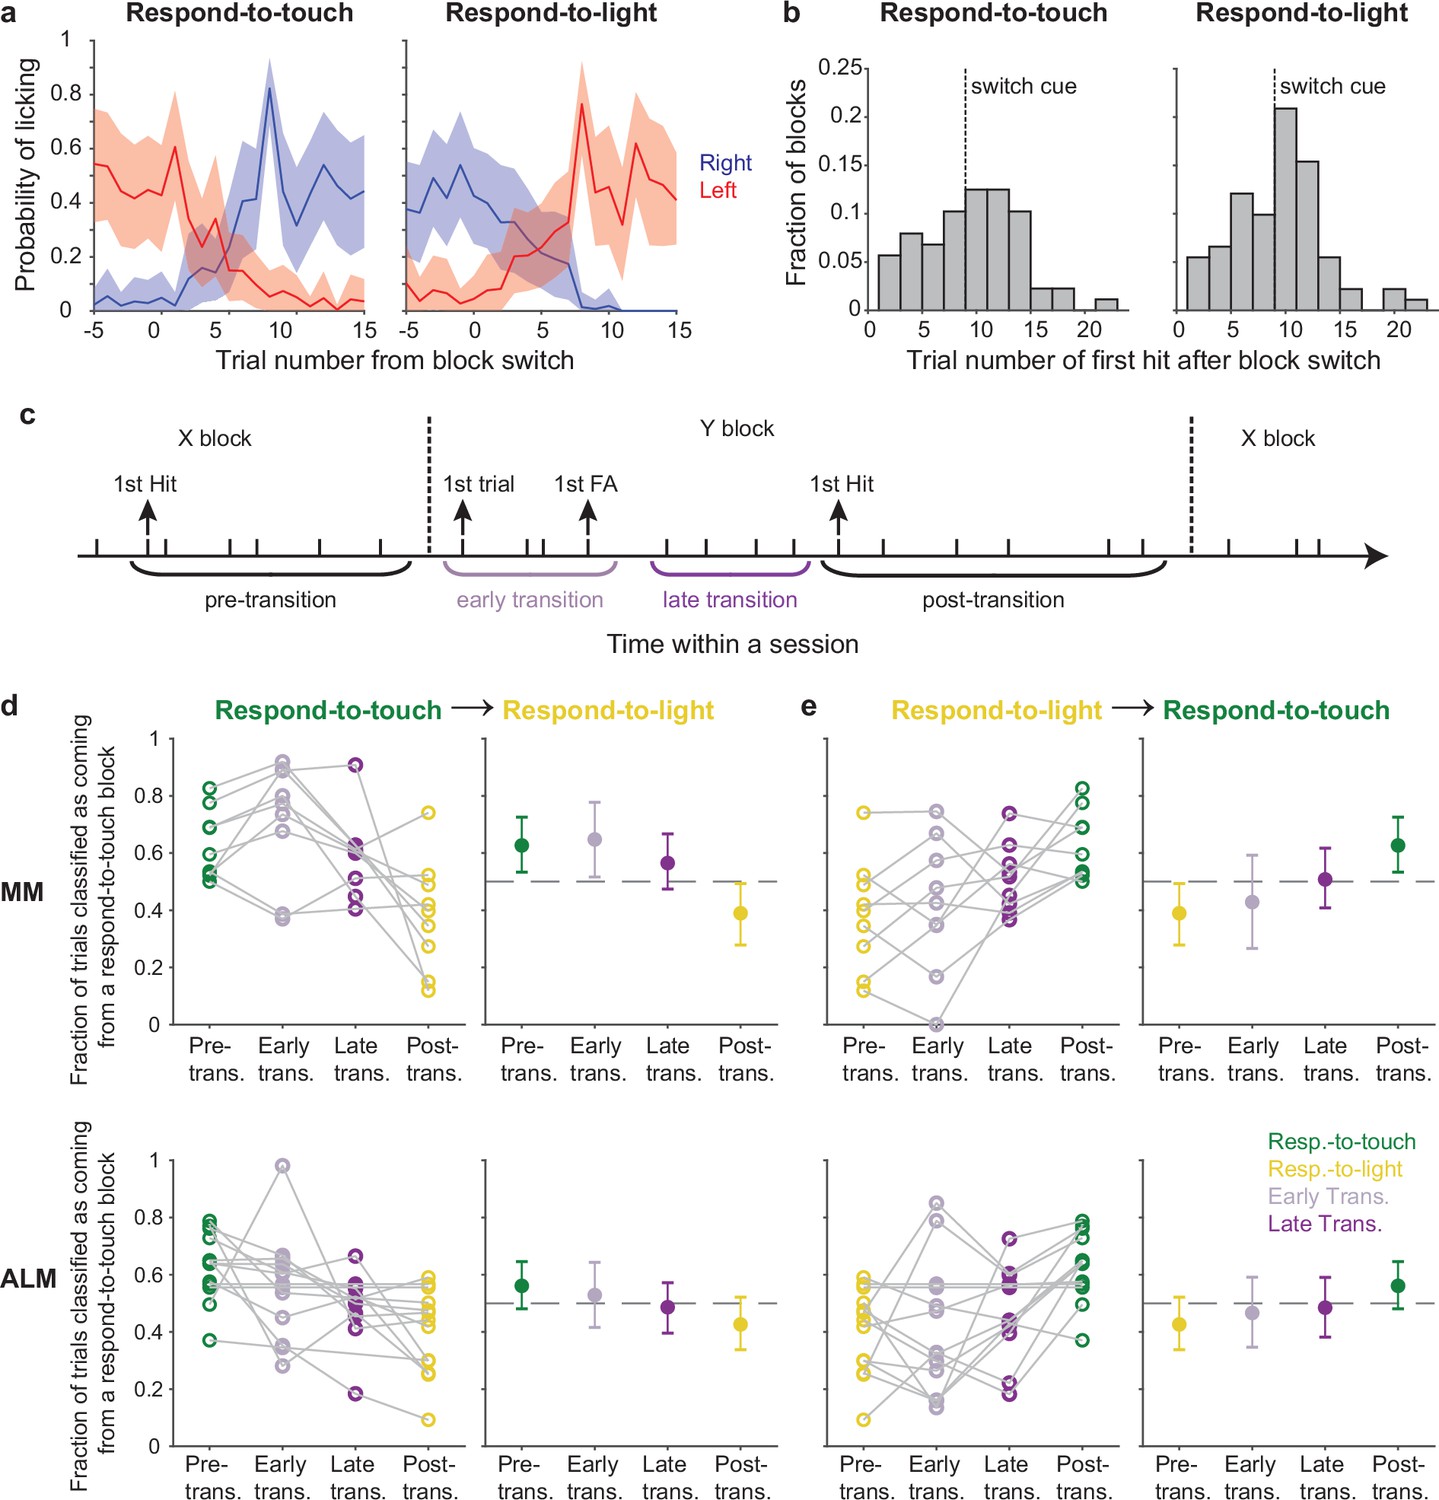
Pre-stimulus states of the motor cortical areas track behavioral rule switching.
(a) Probabilities of right-licks (blue) and left-licks (red) during block transitions (left panel: respond-to-light → respond-to-touch transitions; right panel: respond-to-touch → respond-to-light transitions). Mean ± 95% CI across 12 mice. (b) Histogram showing the distribution of the trial number of the first hit after block switch. Most first hits in respond-to-touch (left) and respond-to-light (right) blocks occurred before or immediately after the switch cue (dashed line). (c) Schematic of rule transition in the cross-modal selection task. A transition period was defined as spanning from the first trial after the block switch until the first hit trial of that block. ‘Early’ and ‘late’ transitions were separated by the first false alarm trial of that block. (d) Fraction of trials classified as coming from a respond-to-touch block based on the pre-stimulus population state, for trials occurring in different periods (see c) relative to respond-to-touch → respond-to-light transitions. For medial motor cortex (MM) (top row) and anterior lateral motor cortex (ALM) (bottom row), progressively fewer trials were classified as coming from the respond-to-touch block as analysis windows shifted later relative to the rule transition. Kendall’s tau (rank correlation): MM: –0.39, 9 sessions; ALM: –0.29, 13 sessions. Left panels: individual sessions, right panels: mean ± 95% CI. Dashed lines are chance levels (0.5). (e) Same as (d) but for respond-to-light → respond-to-touch transitions. Kendall’s tau: MM: 0.37, 9 sessions; ALM: 0.27, 13 sessions.
Figure 5—figure supplement 1
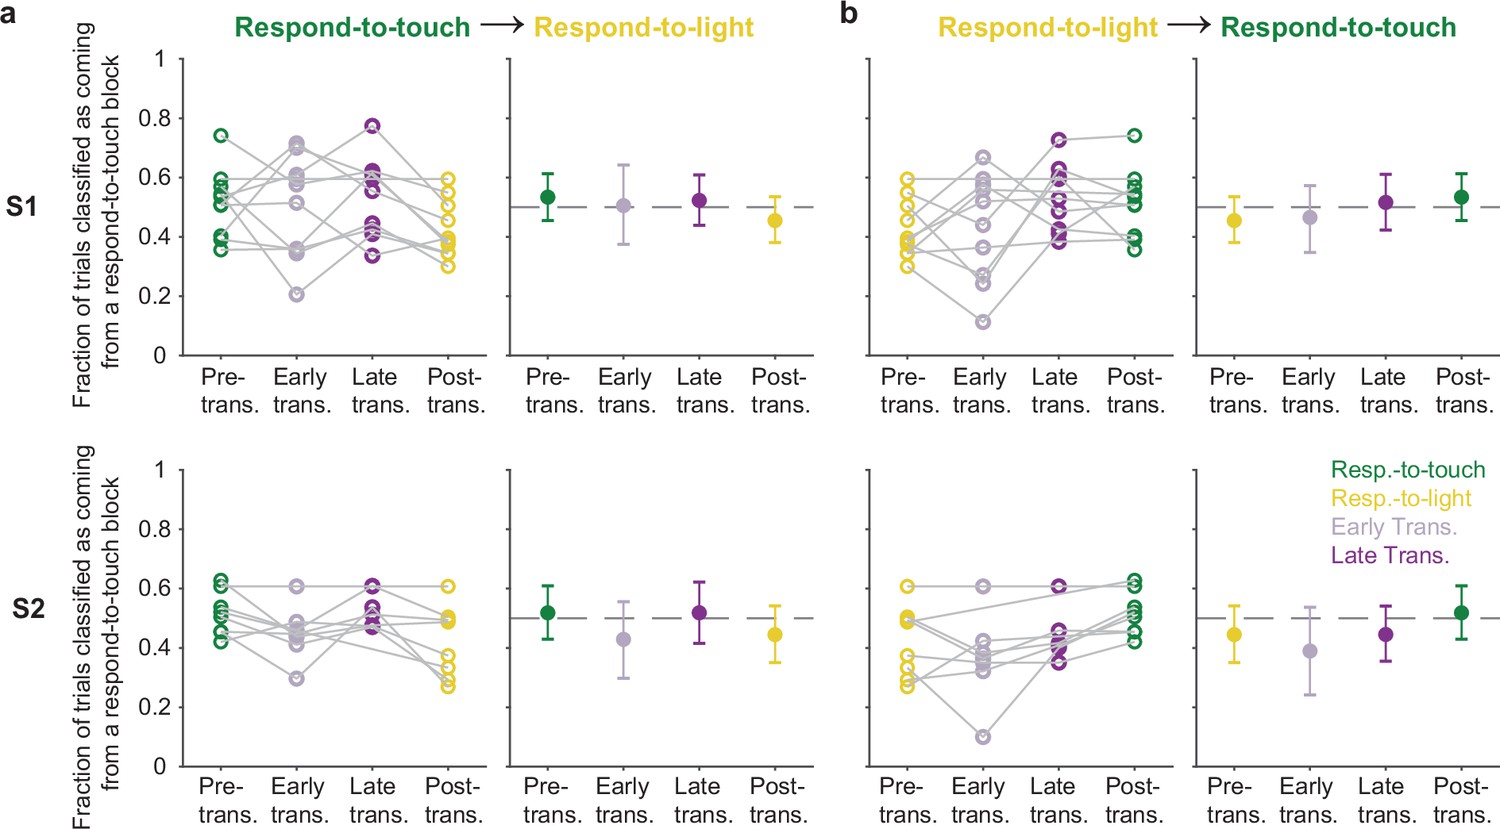
Pre-stimulus states of neural populations in the sensory cortex during rule transitions.
(a) Fraction of trials classified as coming from a respond-to-touch block based on the pre-stimulus population state, for trials occurring in different periods (see Figure 5c) relative to respond-to-touch → respond-to-light transitions. Top row: S1; bottom row: S2. Left panels: individual sessions; right panels: mean ± 95% CI across 10 (S1) or 8 (S2) sessions. Kendall’s tau (rank correlation): S1: –0.16; S2: –0.15. (b) Same as (a) but for respond-to-light → respond-to-touch transitions. Kendall’s tau: S1: 0.21; S2: 0.25.
Figure 6 with 2 supplements
Inhibition of pre-stimulus states in the motor cortex impairs rule-dependent tactile detection.
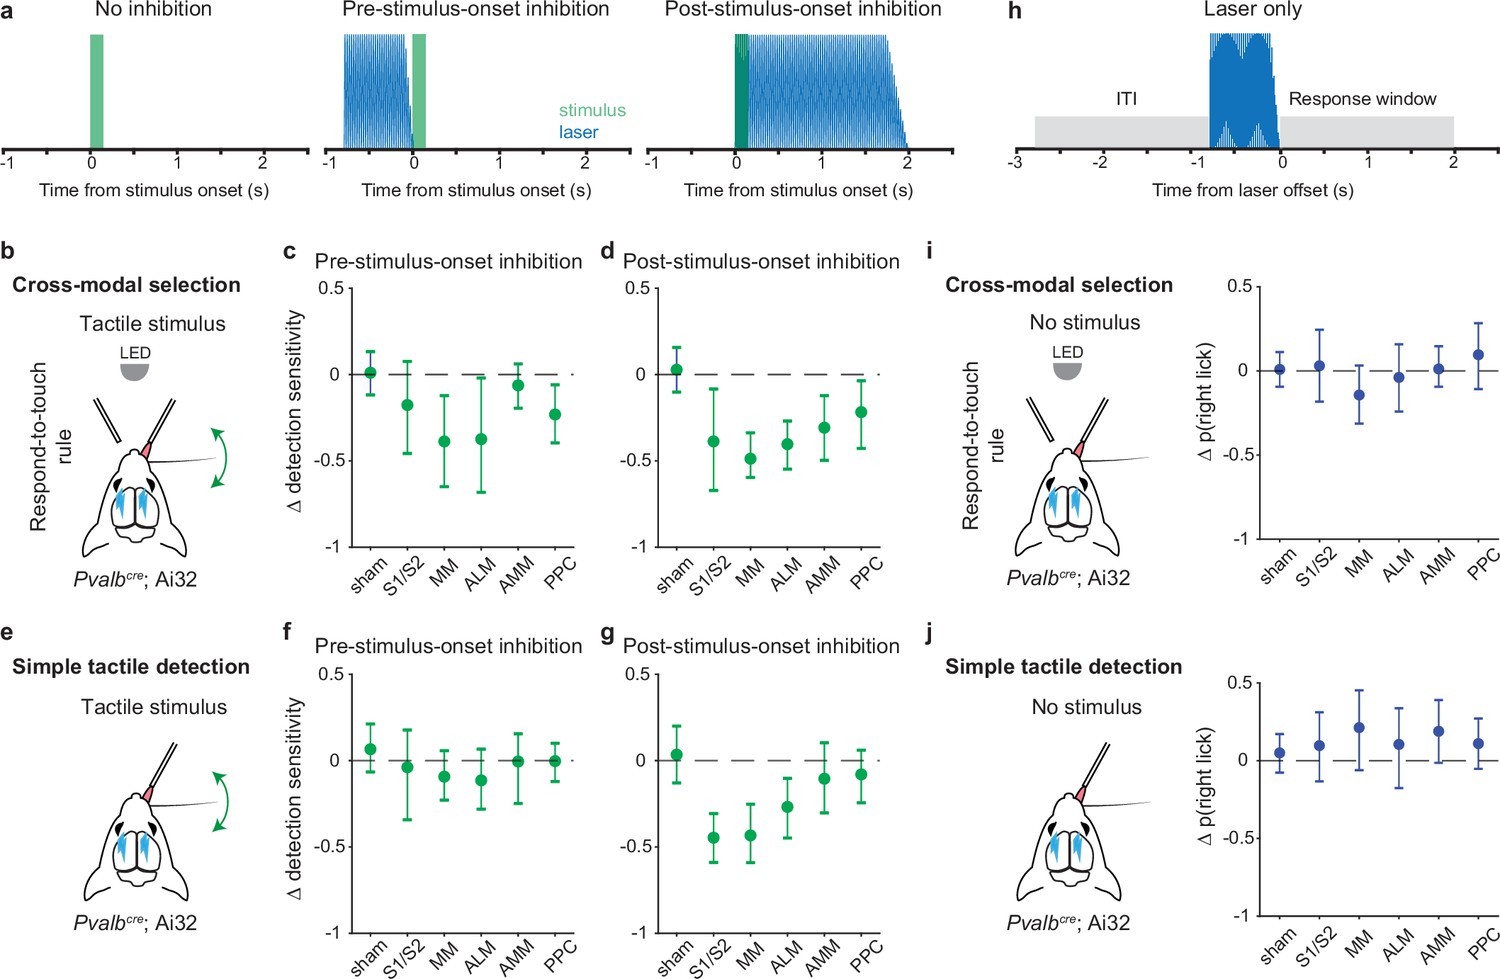
(a) Schematic of inhibition conditions for stimulus trials. Sessions comprised 80% stimulus trials and 20% laser-only trials (see h). In 15% of the stimulus trials, optogenetic inhibition occurred before tactile or visual stimuli (middle, –0.8 to 0 s from stimulus onset) to suppress pre-stimulus activity in the targeted cortical area. In another 15% of stimulus trials, optogenetic inhibition began simultaneously with the stimulus onset (right, 0–2 s from stimulus onset) in order to suppress sensory-evoked activity. (b–d) Changes in detection sensitivity for tactile stimuli during respond-to-touch blocks in the cross-modal selection task when each cortical area was optogenetically inhibited. For pre-stimulus-onset inhibition (c), detection sensitivity decreased when medial motor cortex (MM) and anterior lateral motor cortex (ALM) but not S1 and S2 were suppressed. For post-stimulus-onset inhibition (d), the detection sensitivity decreased when sensory and motor cortical regions were suppressed. S1/S2: 4 mice, 10 sessions; MM: 4 mice, 11 sessions; ALM: 4 mice, 10 sessions. Sham: 7 mice, 28 sessions. AMM: anteromedial motor cortex, 7 mice, 21 sessions. PPC: posterior parietal cortex, 7 mice, 21 sessions. (e–g) Same as (b–d) but for a simple tactile detection task (not cross-modal selection task). Detection sensitivity for tactile stimuli was reduced when the sensory (S1 and S2) and motor (MM and ALM) cortical areas were inhibited during the post-stimulus-onset window (g) but not during the pre-stimulus-onset window (f). Sham: 5 mice, 9 sessions; S1/S2: 3 mice, 3 sessions; MM: 3 mice, 5 sessions; ALM: 3 mice, 4 sessions; AMM: 3 mice, 4 sessions; PPC: 3 mice, 4 sessions. (h) Schematic of inhibition conditions for ‘laser-only’ trials. The probability of licking during the response window (0–2 s from laser offset) was compared with the probability of licking during the intertrial interval (ITI, –2 to 0 s from laser onset). (i) Changes in the probability of right licks within the laser-only trials during respond-to-touch blocks in the cross-modal selection task. (j) Changes in the probability of right licks within the laser-only trials in the simple tactile detection task. Error bars show bootstrap 95% CI. Criterion to be considered significant: 95% CI did not include 0.
Figure 6—figure supplement 1
Hit and false alarm rates during the inhibition of population states in the dorsal cortex.
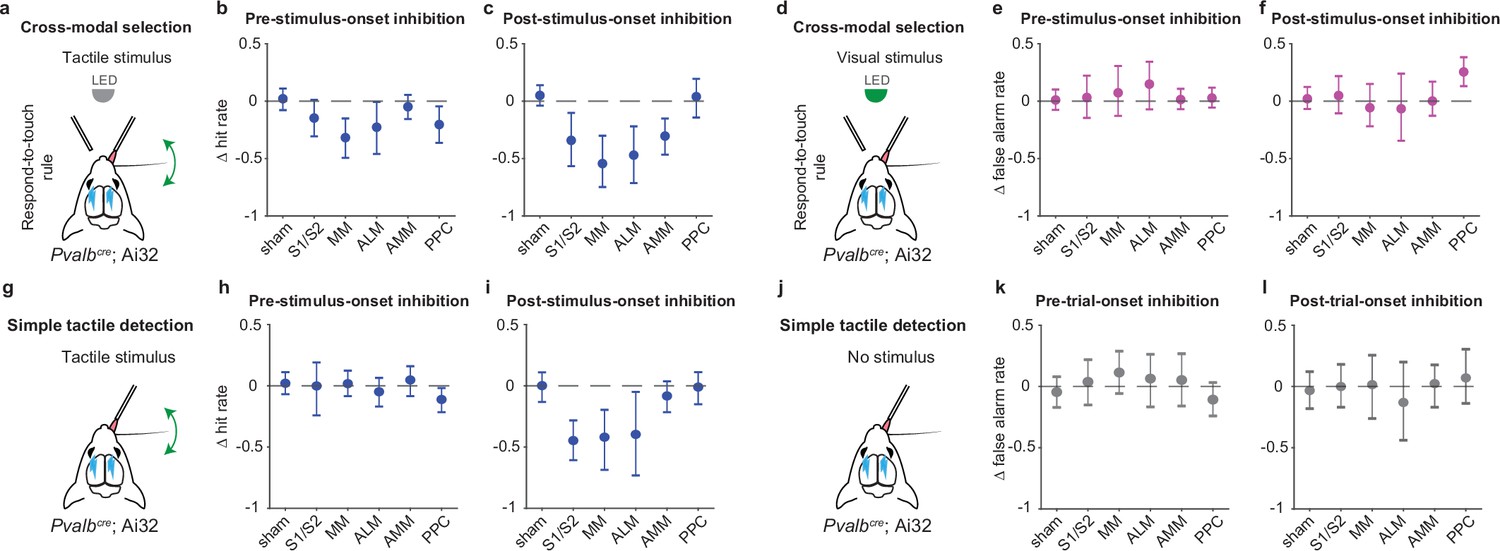
(a) Schematic of inhibition within tactile stimulus trials during respond-to-touch blocks in the cross-modal selection task. (b) Changes in tactile hit rate when each cortical area was optogenetically inhibited before stimulus onset. The tactile hit rate is the probability of right licks for tactile stimuli during respond-to-touch blocks. S1/S2: 4 mice, 10 sessions; medial motor cortex (MM): 4 mice, 11 sessions; anterior lateral motor cortex (ALM): 4 mice, 10 sessions. Sham: 7 mice, 28 sessions. Anteromedial motor cortex (AMM): 7 mice, 21 sessions. Posterior parietal cortex (PPC): 7 mice, 21 sessions. Means± 95% CI from bootstrapping. Criterion to be considered significant: 95% CI did not include 0. (c) Same as (b) but for inhibition after stimulus onset. (d) Schematic of inhibition within visual stimulus trials during respond-to-touch blocks in the cross-modal selection task. (e) Changes in visual false alarm rate when each cortical area was optogenetically inhibited before stimulus onset. The false alarm rate is the probability of right licks for visual stimuli during respond-to-touch blocks. (f) Same as (e) but for inhibition after stimulus onset. (g) Schematic of inhibition within tactile stimulus trials in the tactile detection task. (h) Changes in tactile hit rate when each cortical area was optogenetically inhibited before stimulus onset. The tactile hit rate is the probability of right licks for tactile stimuli in the tactile detection task. Sham: 5 mice, 9 sessions; S1/S2: 3 mice, 3 sessions; MM: 3 mice, 5 sessions; ALM: 3 mice, 4 sessions; AMM: 3 mice, 4 sessions; PPC: 3 mice, 4 sessions. Means ± 95% CI from bootstrapping. (i) Same as (h) but for inhibition after stimulus onset. (j) Schematic of inhibition when there was no stimulus in the tactile detection task. (k) Changes in false alarm rate when each cortical area was optogenetically inhibited before trial onset. The false alarm rate is the probability of right licks when there was no stimulus. (l) Same as (k) but for inhibition after trial onset.
Figure 6—figure supplement 2
Inhibition of pre-stimulus states in the medial parts of motor cortex impairs rule-dependent visual detection.
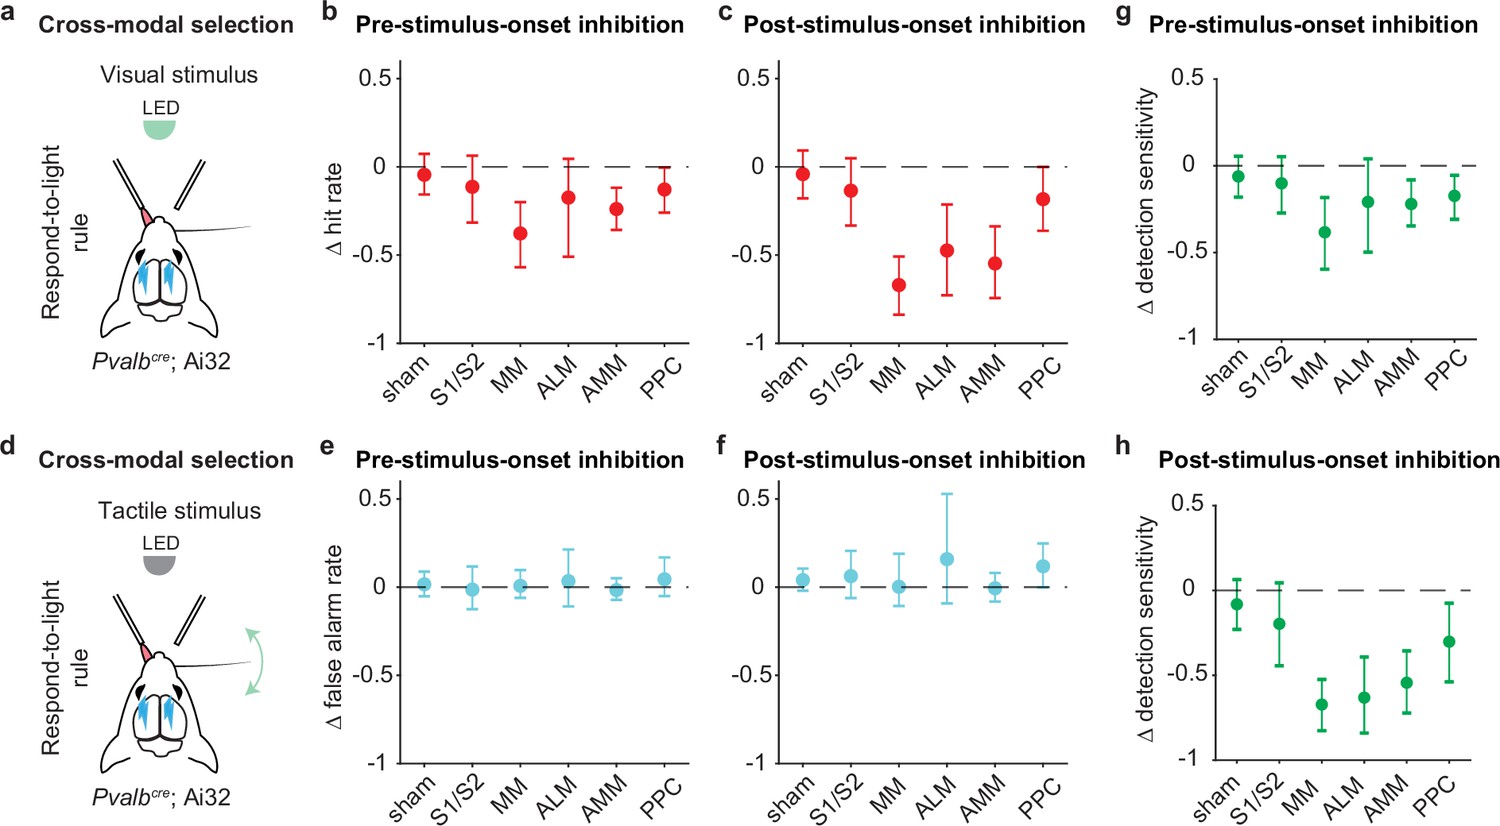
(a) Schematic of inhibition within visual stimulus trials during the respond-to-light blocks in the cross-modal selection task. (b) Changes in visual hit rate when each cortical area was optogenetically inhibited before stimulus onset. The visual hit rate is the probability of left licks for visual stimuli during respond-to-light blocks. S1/S2: 4 mice, 10 sessions; MM: 4 mice, 11 sessions; anterior lateral motor cortex (ALM): 4 mice, 10 sessions. Sham: 7 mice, 28 sessions. Anteromedial motor cortex (AMM): 7 mice, 21 sessions. Posterior parietal cortex (PPC): 7 mice, 21 sessions. Means ± 95% CI from bootstrapping. Criterion to be considered significant: 95% CI did not include 0. (c) Same as (b) but for inhibition after stimulus onset. (d) Schematic of inhibition within tactile stimulus trials during respond-to-light blocks in the cross-modal selection task. (e) Changes in tactile false alarm rate when each cortical area was optogenetically inhibited before stimulus onset. The false alarm rate is the probability of left licks for tactile stimuli during respond-to-light blocks. (f) Same as (e) but for inhibition after stimulus onset. (g) Changes in detection sensitivity for visual stimuli when each cortical area was inhibited before stimulus onset. The detection sensitivity for visual stimuli was determined by the difference of visual hit rate and tactile false alarm rate during respond-to-light blocks. (h) Same as (g) but for inhibition after stimulus onset.
Tables
Key resources table
| Reagent type (species) or resource | Designation | Source or reference | Identifiers | Additional information |
|---|---|---|---|---|
| Strain, strain background (Mus musculus, male and female) | PvalbCre: B6.129P2-Pvalbtm1(cre)Arbr/J | The Jackson Laboratory | 008069 | Materials and methods >Mice |
| Strain, strain background (M. musculus, male and female) | Emx1Cre: B6.129S2-Emx1tm1(cre)Krj/J | The Jackson Laboratory | 005628 | Materials and methods >Mice |
| Strain, strain background (M. musculus, male and female) | Ai32: B6.129S-Gt(ROSA)26Sortm32(CAG-COP4*H134R/EYFP)Hze/J | The Jackson Laboratory | 012569 | Materials and methods >Mice |
| Strain, strain background (M. musculus, male and female) | Slc32a1ChR2-EYFP: B6.Cg-Tg (Slc32a1-COP4*H134R/ EYFP)8Gfng/J | The Jackson Laboratory | 014548 | Materials and methods >Mice |
| Software, algorithm | MATLAB | MathWorks | 2019a | https://www.mathworks.com/help/matlab/release-notes-R2019a.html |
| Software, algorithm | BControl software | Brody, Princeton University | https://brodywiki.princeton.edu/bcontrol/index.php?title=Main_Page | |
| Software, algorithm | Kilosort | Pachitariu et al., 2016; Pachitariu et al., 2024 | Kilosort 1 | https://github.com/MouseLand/Kilosort |
| Other | Isoflurane | Penn Veterinary | VED1360CS | Materials and methods >Surgery |
| Other | Dental acrylic | Jet Repair Acrylic | L25-0335 | Materials and methods >Surgery |
| Other | Clear adhesive luting cement (C&B Metabond) | Parkell | S399 | Materials and methods >Surgery |
| Other | Silicone elastomer | World Precision Instruments | KWIK-CAST | Materials and methods >Surgery |
| Other | Dil Stain | Thermo Fisher Scientific | D282 | Materials and methods >Ephy. |
| Other | Piezo actuator | Piezo Systems | D220-A4-203YB | Materials and methods >Behav. tasks |
| Other | Piezo controller | Thorlabs | MDTC93B | Materials and methods >Behav. tasks |
| Other | LED | Thorlabs | M470F1 | Materials and methods >Behav. tasks |
| Other | Optic fiber | Thorlabs | M43L01, TM200FL1B | Materials and methods >Behav. tasks and Opto. inhibition |
| Other | Density filter | Thorlabs | NE530B | Materials and methods >Behav. tasks |
| Other | Stereotaxic apparatus (Mouse Gas Anesthesia Head Holder) | David Kopf Instruments | Model 923-B | Materials and methods >Surgery |
| Other | Silicon probe | Cambridge NeuroTech | ASSY-77 H3 | Materials and methods >Ephy. |
| Other | Intan recording system | Intan Technologies | RHD2000 | Materials and methods >Ephy. |
| Other | Laser, 473 nm | UltraLasers | DHOM-L-473–200 mW | Materials and methods >Opto. inhibition |
| Other | Acousto-optic modulator | QuantaTech | MTS110-A3-VIS | Materials and methods >Opto. inhibition |
Table 1
Experimental subjects.
Tabulated metadata for each mouse, including appearances in each figure.
Additional files
Download links
A two-part list of links to download the article, or parts of the article, in various formats.
Downloads (link to download the article as PDF)
Open citations (links to open the citations from this article in various online reference manager services)
Cite this article (links to download the citations from this article in formats compatible with various reference manager tools)
Rule-based modulation of a sensorimotor transformation across cortical areas
eLife 12:RP92620.
https://doi.org/10.7554/eLife.92620.3


