Comparative transcriptomics reveal a novel tardigrade-specific DNA-binding protein induced in response to ionizing radiation
- Département AVIV, MNHN, CNRS UMR7196, INSERM U1154, France
- Université Paris-Saclay, France
- Département AVIV, MNHN, CNRS UMR7221, France
- CeMIM, MNHN, CNRS UMR7245, France
- Génomique ENS, Institut de Biologie de l’ENS (IBENS), Ecole Normale Supérieure, CNRS, INSERM, Université PSL, France
- Univ. Grenoble Alpes, INSERM, CEA, UA13 BGE, CNRS, CEA, France
- Institut Curie, Inserm U1021-CNRS UMR 3347, Université Paris-Saclay, Université PSL, France
- Plateforme RADEXP, Institut Curie, France
- Plateforme technique de Microscopie Electronique, MNHN, France
- Département AVIV MNHN, UMR7245, France
- MMBM, Institut Curie, CNRS UMR168, France
- Department of Life Sciences, University of Modena and Reggio Emilia, Italy
- NBFC, National Biodiversity Future Center, Italy
Figures
Figure 1 with 3 supplements
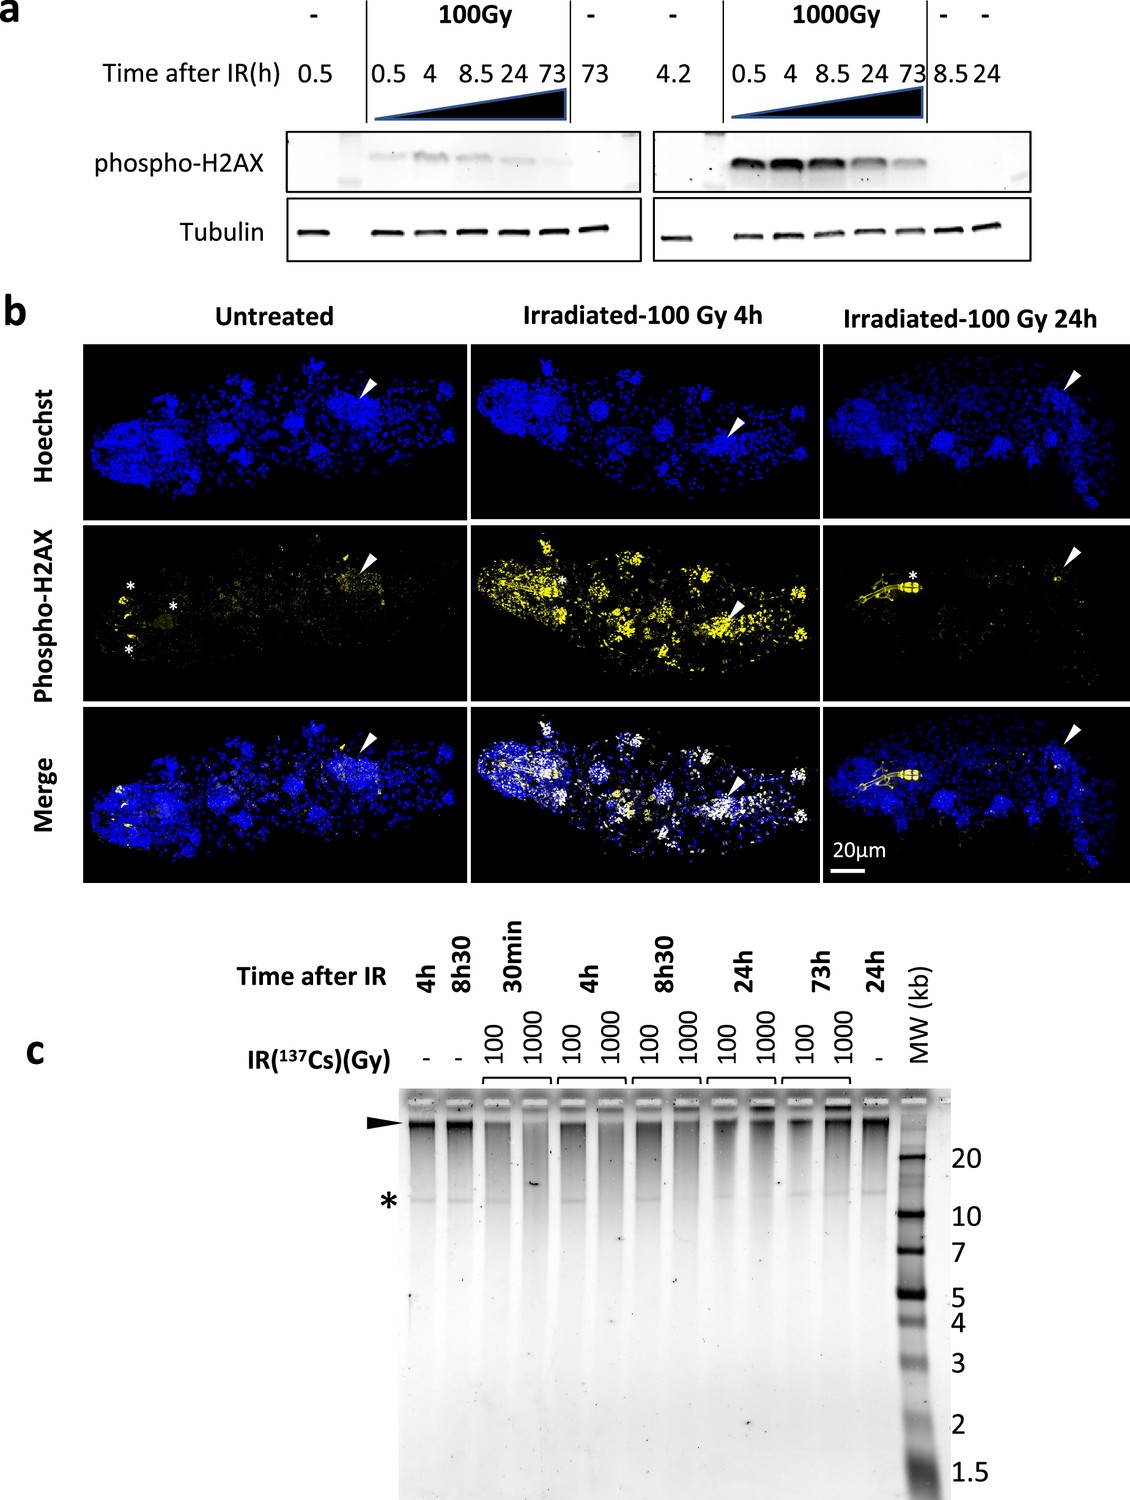
Analysis of DNA damage and repair in H. exemplaris after γ-ray irradiation.
(a) Analysis of phospho-H2AX expression after exposure of H. exemplaris to ionizing radiation (IR). Western blot analysis with in-house antibody against phosphorylated H. exemplaris H2AX (anti-phospho-H2AX) at indicated time points after irradiation of tardigrades with indicated dose of γ-ray irradiation. Phospho-H2AX levels were normalized by total alpha-tubulin expression levels and quantification is provided in Figure 1—figure supplement 2a. (-) lanes show extracts from control tardigrades processed in parallel to irradiated tardigrades at indicated time points post-irradiation. (b) Analysis of phospho-H2AX expression in whole-mount H. exemplaris after exposure to 100Gy. Tardigrades were exposed to 100Gy, fixed with 4% PFA at 4 hr and 24hr post-irradiation, immunolabeled with anti-phospho-H2AX antibody and anti-rabbit IgG conjugated to Alexa Fluor 488 and visualized by confocal microscopy using the Airyscan2 module. Maximum projection of confocal Z-stack are shown. Images at different time points were taken with identical settings so that signal intensity could be compared. Upper panel shows Hoechst staining of nuclei (in blue). Arrowhead indicates position of the gonad (revealed by intense Hoechst and larger nuclei signal). The gonad exhibits intense labeling phospho-H2AX at 4hr which is no longer detected at 24hr, showing efficient DNA repair consistent with preservation of the capacity to lay eggs and reproduce after 100Gy IR (Beltrán-Pardo et al., 2015). * indicates autofluorescence of bucco-pharyngeal apparatus. Scale bar 20µm. (c) Analysis of single-strand breaks by denaturing agarose gel electrophoresis of DNA isolated from~8000 H. exemplaris at indicated time points post-irradiation (100Gy or 1000Gy γ-rays from 137Cs source). (-) indicates DNA from control, non-irradiated tardigrades collected and processed in parallel to treated samples from indicated time points. MW corresponds to the molecular weight ladder. * indicates a discrete band of single-stranded DNA detected in H. exemplaris genomic DNA. Arrowhead indicates high molecular weight single-stranded DNA that is not resolved by agarose gel electrophoresis. (-) lanes show DNA from control tardigrades processed in parallel to irradiated tardigrades at 4hr or 8h30 post-irradiation as indicated.
-
Figure 1—source data 1
Zip file containing all the raw 16 bit images used in Figure 1a.
- https://cdn.elifesciences.org/articles/92621/elife-92621-fig1-data1-v1.zip
-
Figure 1—source data 2
Pdf file showing annotated uncropped images used in Figure 1a.
- https://cdn.elifesciences.org/articles/92621/elife-92621-fig1-data2-v1.pdf
-
Figure 1—source data 3
Raw 16 bit image used in Figure 1c.
- https://cdn.elifesciences.org/articles/92621/elife-92621-fig1-data3-v1.zip
Figure 1—figure supplement 1
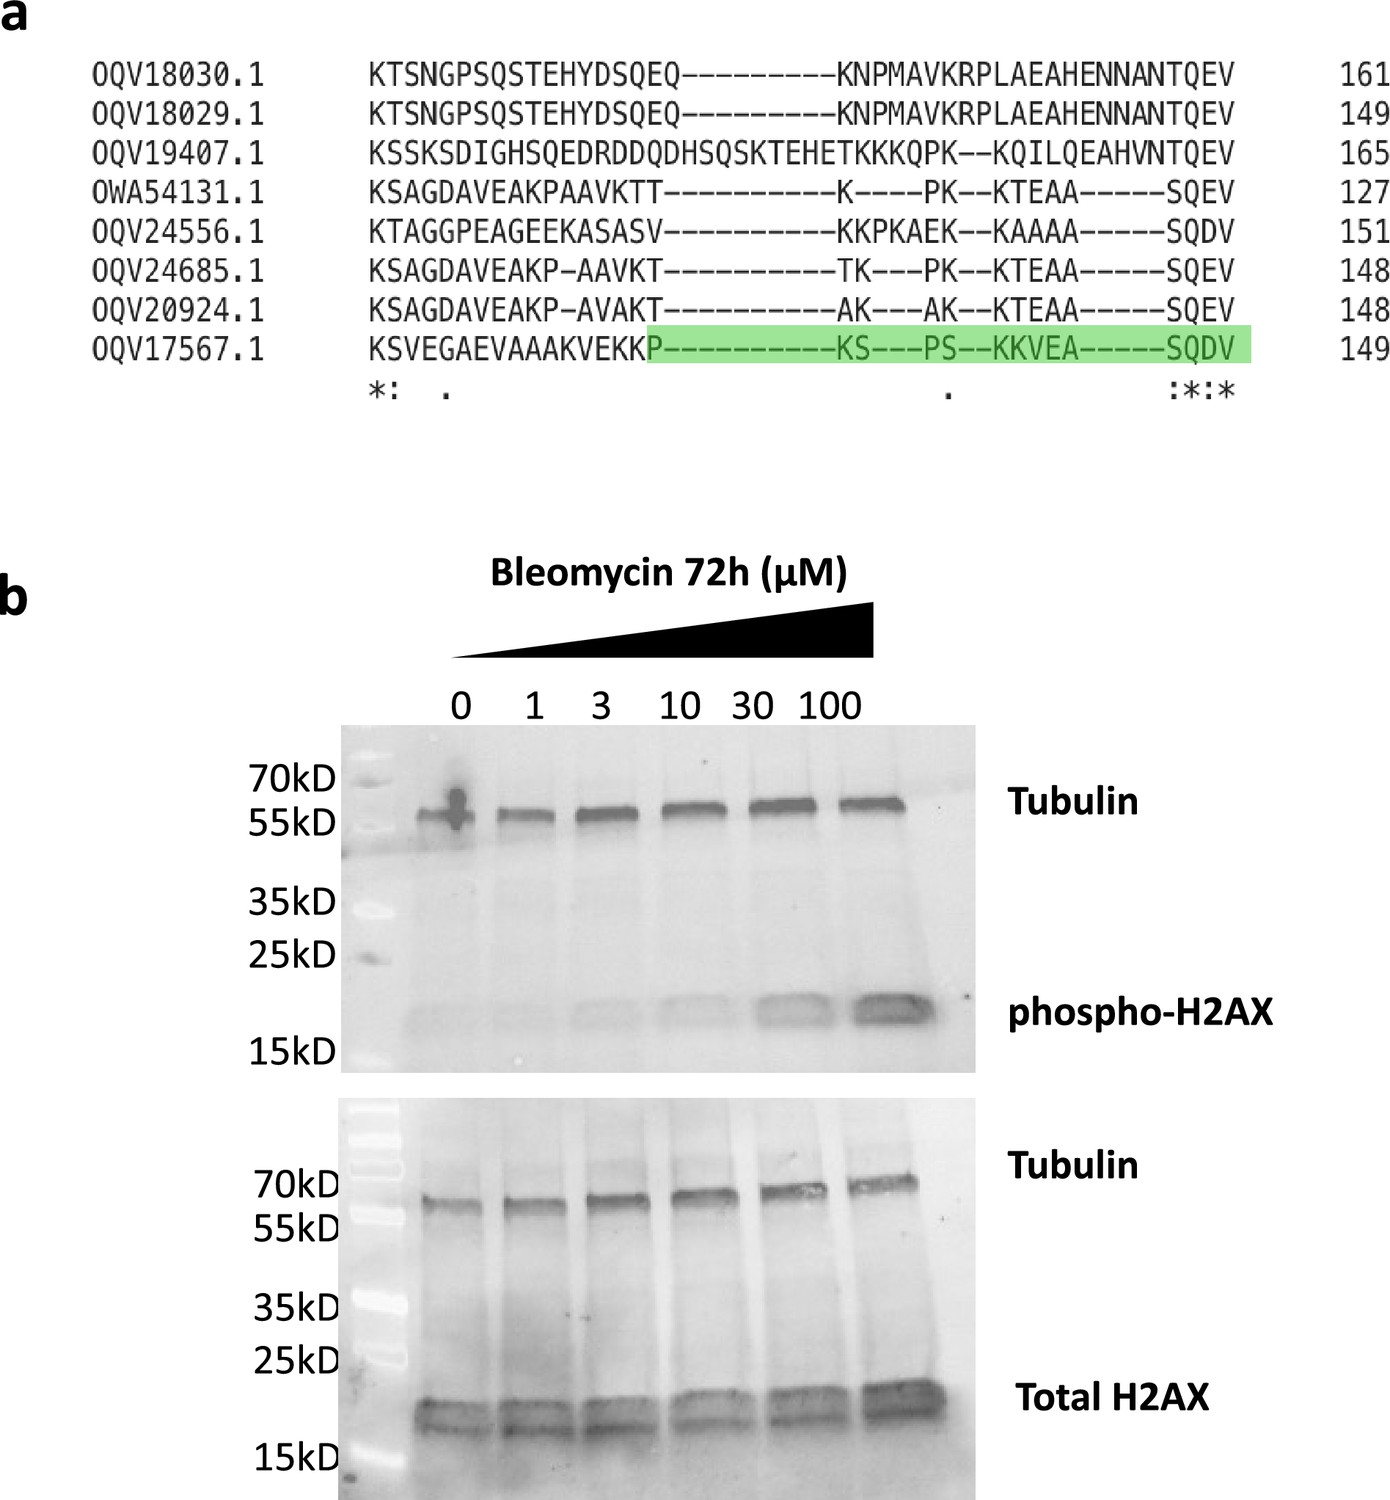
Characterization of anti-phospho-H2AX antibody.
(a) Alignment of C-terminal end of candidate H2AX homologs in H. exemplaris. (b) Western blot analysis of protein extracts from H. exemplaris treated with indicated concentrations of Bleomycin for 4days using anti-phospho-H2AX raised against H2AX C-terminal peptide derived from homolog highlighted in green in (a) with phosphorylated Ser 145 and purified by negative/positive affinity chromatography to unphosphorylated/phosphorylated peptide respectively (upper panel). Unpurified antibody was used to detect total H2AX (lower panel).
Figure 1—figure supplement 2
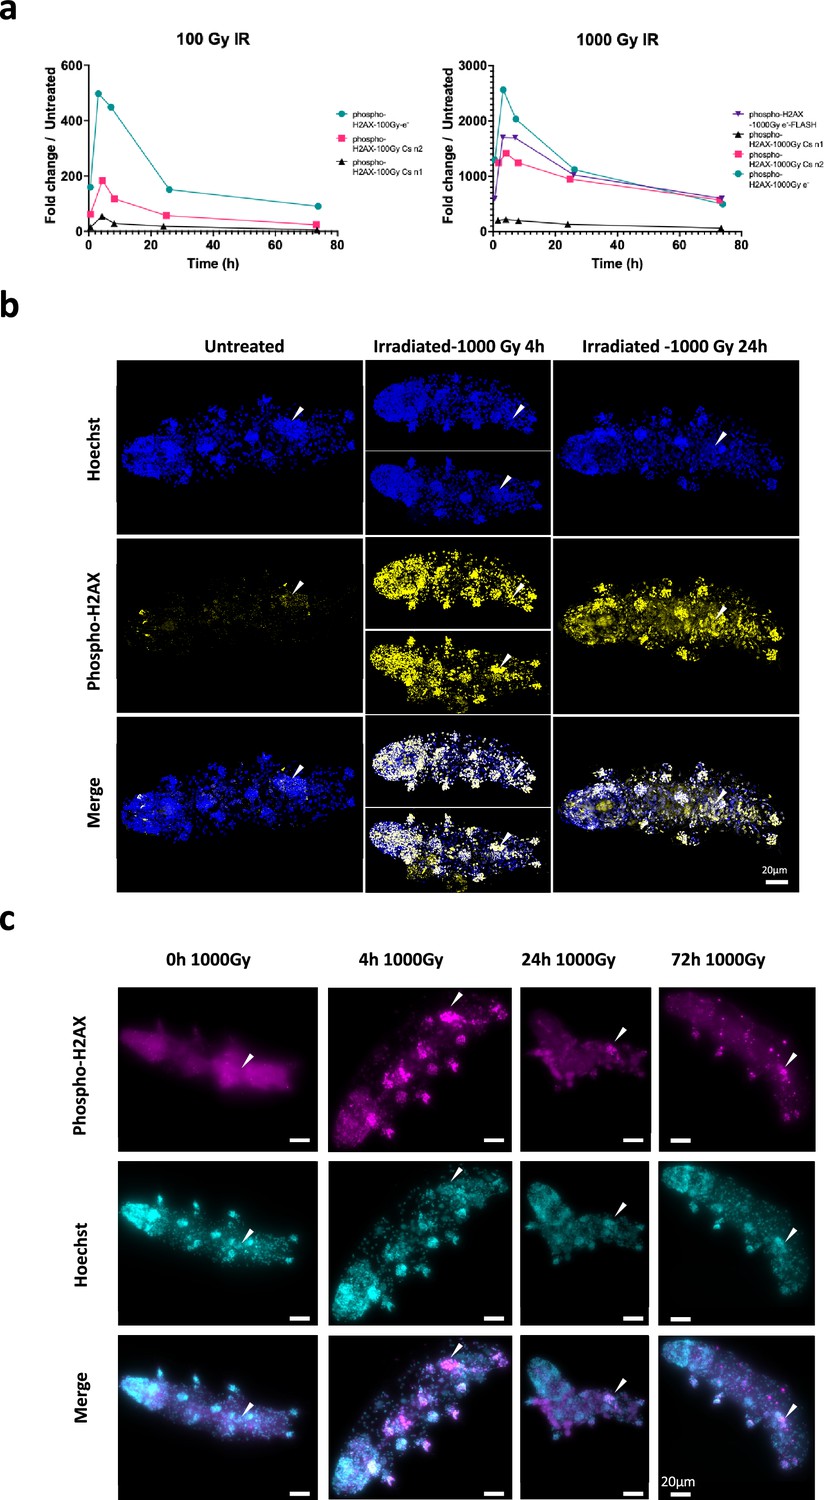
Analysis of DNA damage after γ-ray irradiation.
(a) Quantification of phospho-H2AX after 137Cs gamma irradiation or accelerated electronic beam irradiation in the conventional mode or FLASH mode as indicated. Independent experiments labeled n1 and n2 are represented (as indicated in caption labeling). Phospho-H2AX levels from western blots were normalized by tubulin levels and quantification is provided. (b) Analysis of phospho-H2AX expression in whole-mount H. exemplaris after exposure to 1000Gy by confocal imaging. H. exemplaris were exposed to 1000Gy, fixed with 4% PFA at 4 hr and 24hr post-irradiation, immunolabeled with anti-phospho-H2AX antibody and anti-rabbit IgG conjugated to Alexa Fluor 488 and visualized by confocal microscopy. Images at different time points were taken with identical settings so that signal intensity could be compared. Scale bar corresponds to 20µM. Arrowhead indicates position of the gonad. (c) Analysis of phospho-H2AX expression in whole-mount H. exemplaris after exposure to 1000Gy was also performed by standard fluorescence microscopy (enabling to readily image multiple specimens). Arrowhead indicates position of the gonad. At 24hr, while phospho-H2AX labeling had widely decreased in other tissues, strong, persistent labeling was still detected in the gonad, which likely explains that H. exemplaris are no longer able to lay eggs and have become sterile after 1000Gy ionizing radiation (IR) (Beltrán-Pardo et al., 2015).
Figure 1—figure supplement 3
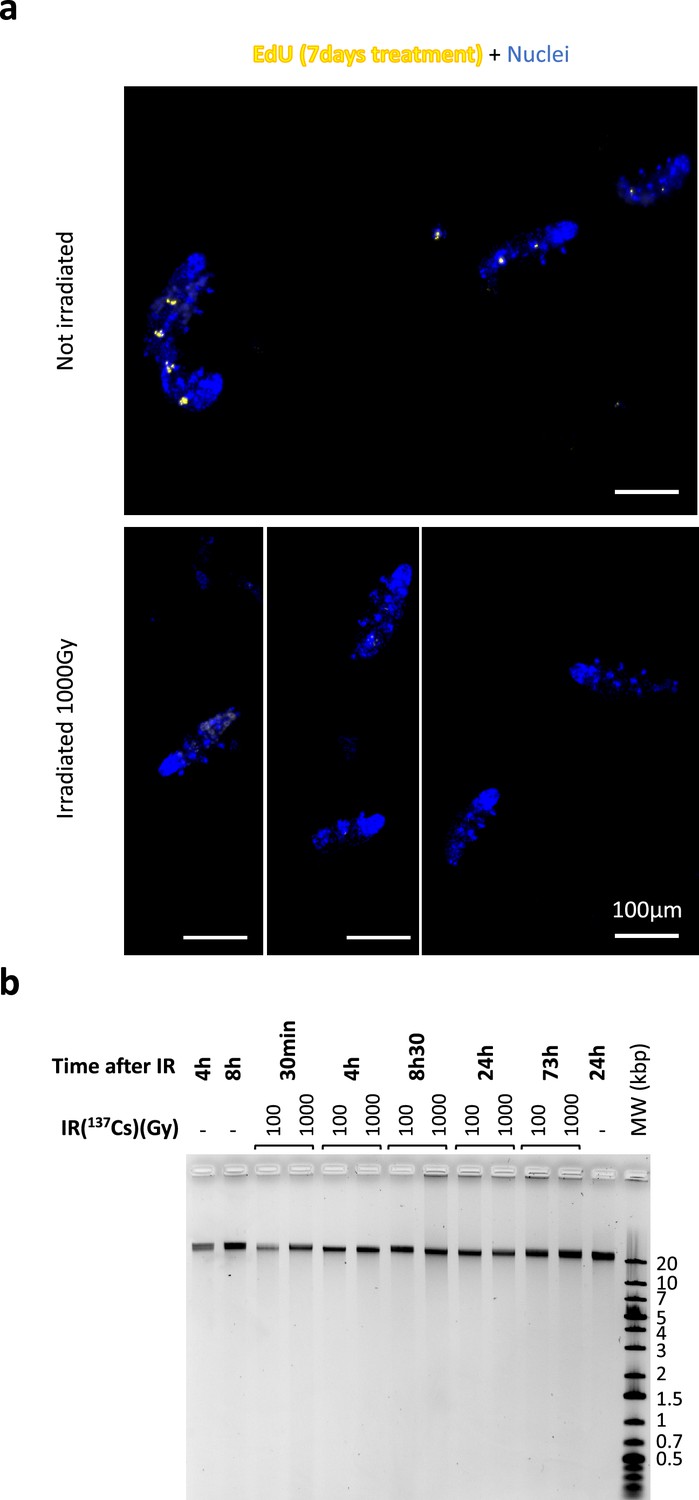
DNA damage and synthesis after 1000Gy γ-ray irradiation.
(a) Analysis of DNA synthesis in control, non-irradiated tardigrades and after 1000Gy. H. exemplaris were exposed to 1000Gy and incubated with EdU as described by Gross et al., 2018, except for EdU concentration and time, which was 50µM EdU for 7days, to maximize staining and sensitivity of potential DNA synthesis. After fixation with 4% PFA, EdU labeling was revealed as described (Gross et al., 2018) and imaging was performed by standard fluorescence microscopy. As shown in Gross et al., 2018, non-irradiated, control animals exhibit intense labeling in intestinal cells whereas in irradiated tardigrades, no labeling can be detected. (b) Analysis of double-strand breaks by native agarose gel electrophoresis of DNA isolated from~8000 H. exemplaris individuals at indicated time points post-irradiation (100 Gy or 1000Gy γ-rays from 137Cs source). (-) lanes show DNA from control, non-irradiated H. exemplaris.
-
Figure 1—figure supplement 3—source data 1
Raw 16 bit image used in Figure 1—figure supplement 3b.
- https://cdn.elifesciences.org/articles/92621/elife-92621-fig1-figsupp3-data1-v1.zip
Figure 2 with 4 supplements
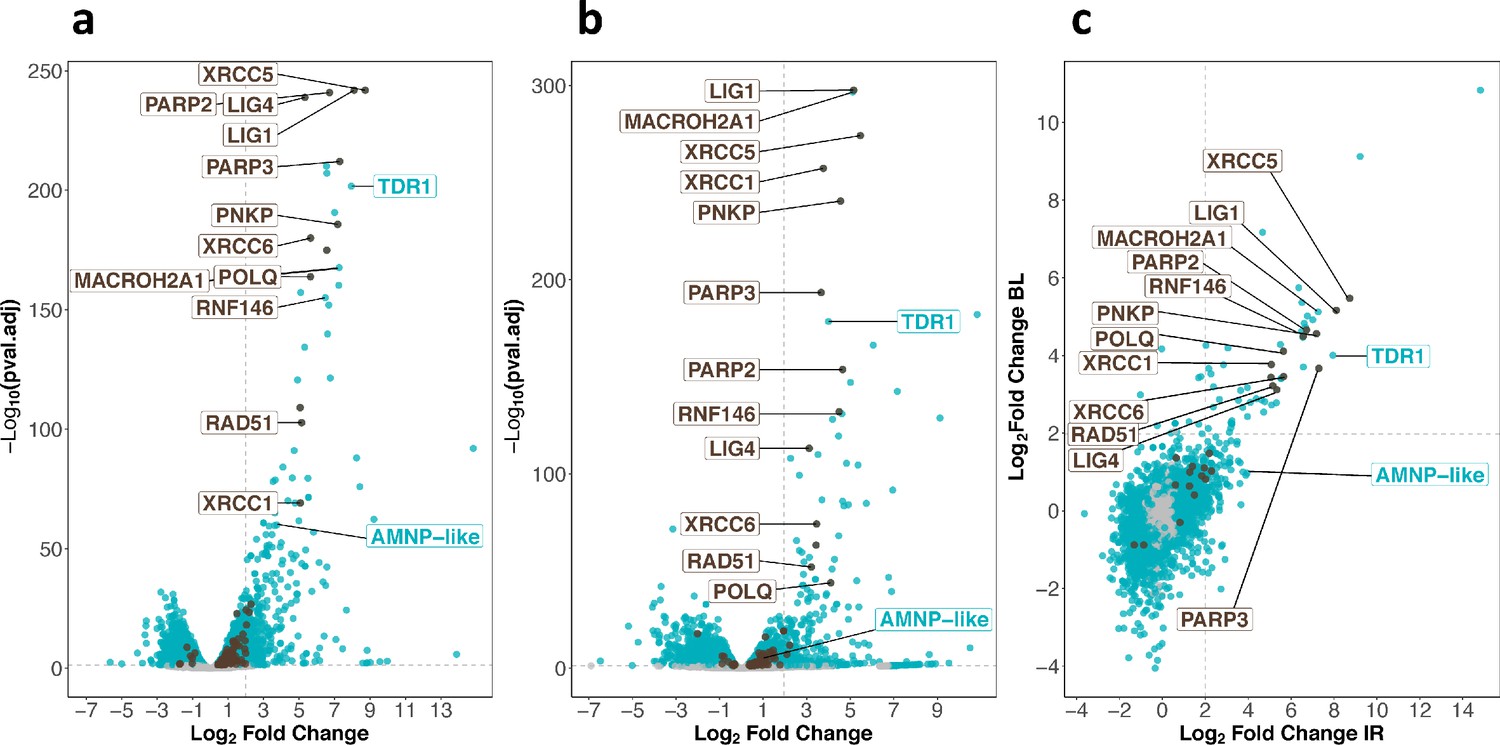
Transcriptomic response of H. exemplaris to ionizing radiation (IR) and Bleomycin.
(a) and (b) Volcano plots representing Log2 Fold Change and adjusted p-value (−log base 10) of RNA levels between H. exemplaris irradiated with 1000Gy γ-rays and untreated controls (n=3) (a) and between H. exemplaris treated with 100µM Bleomycin for 4days and untreated controls (n=3) (b). The vertical dotted lines indicate the Log2 Fold Change value of 2 (Fold Change of 4). (c) Correlation between Log2 Fold Change after exposure to IR and after Bleomycin (BL) treatment for abundant transcripts (with baseMean>500 after DESeq2 analysis). The horizontal and vertical dotted lines indicate the Log2 Fold Change value of 2 (Fold Change of 4). Blue dots represent transcripts with a Log2 Fold Change with an adjusted p-value<0.05. Brown dots indicate transcripts of DNA repair genes (based on KEGG DNA repair and recombination gene group ko03400) that have a Log2 Fold Change with adjusted p-value<0.05. Gray dots represent transcripts with a Log2 Fold Change with an adjusted p-value>0.05. Brown labels indicate representative strongly upregulated genes of DNA repair. Blue labels indicate two tardigrade-specific genes induced in response to IR: the TDR1 gene identified in this work, and the AMNP-like gene (BV898_10264), a member of the family of AMNP/g12777-like genes upregulated in response to desiccation and UVC (Yoshida et al., 2022).
-
Figure 2—source data 1
Table of differentially expressed genes after ionizing radiation (IR) in H. exemplaris.
- https://cdn.elifesciences.org/articles/92621/elife-92621-fig2-data1-v1.xlsx
-
Figure 2—source data 2
Table of differentially expressed genes after Bleomycin treatment in H. exemplaris.
- https://cdn.elifesciences.org/articles/92621/elife-92621-fig2-data2-v1.xlsx
-
Figure 2—source data 3
Table of most abundant (baseMean>500) differentially expressed genes after ionizing radiation (IR) and Bleomycin treatment in H. exemplaris.
- https://cdn.elifesciences.org/articles/92621/elife-92621-fig2-data3-v1.xlsx
Figure 2—figure supplement 1
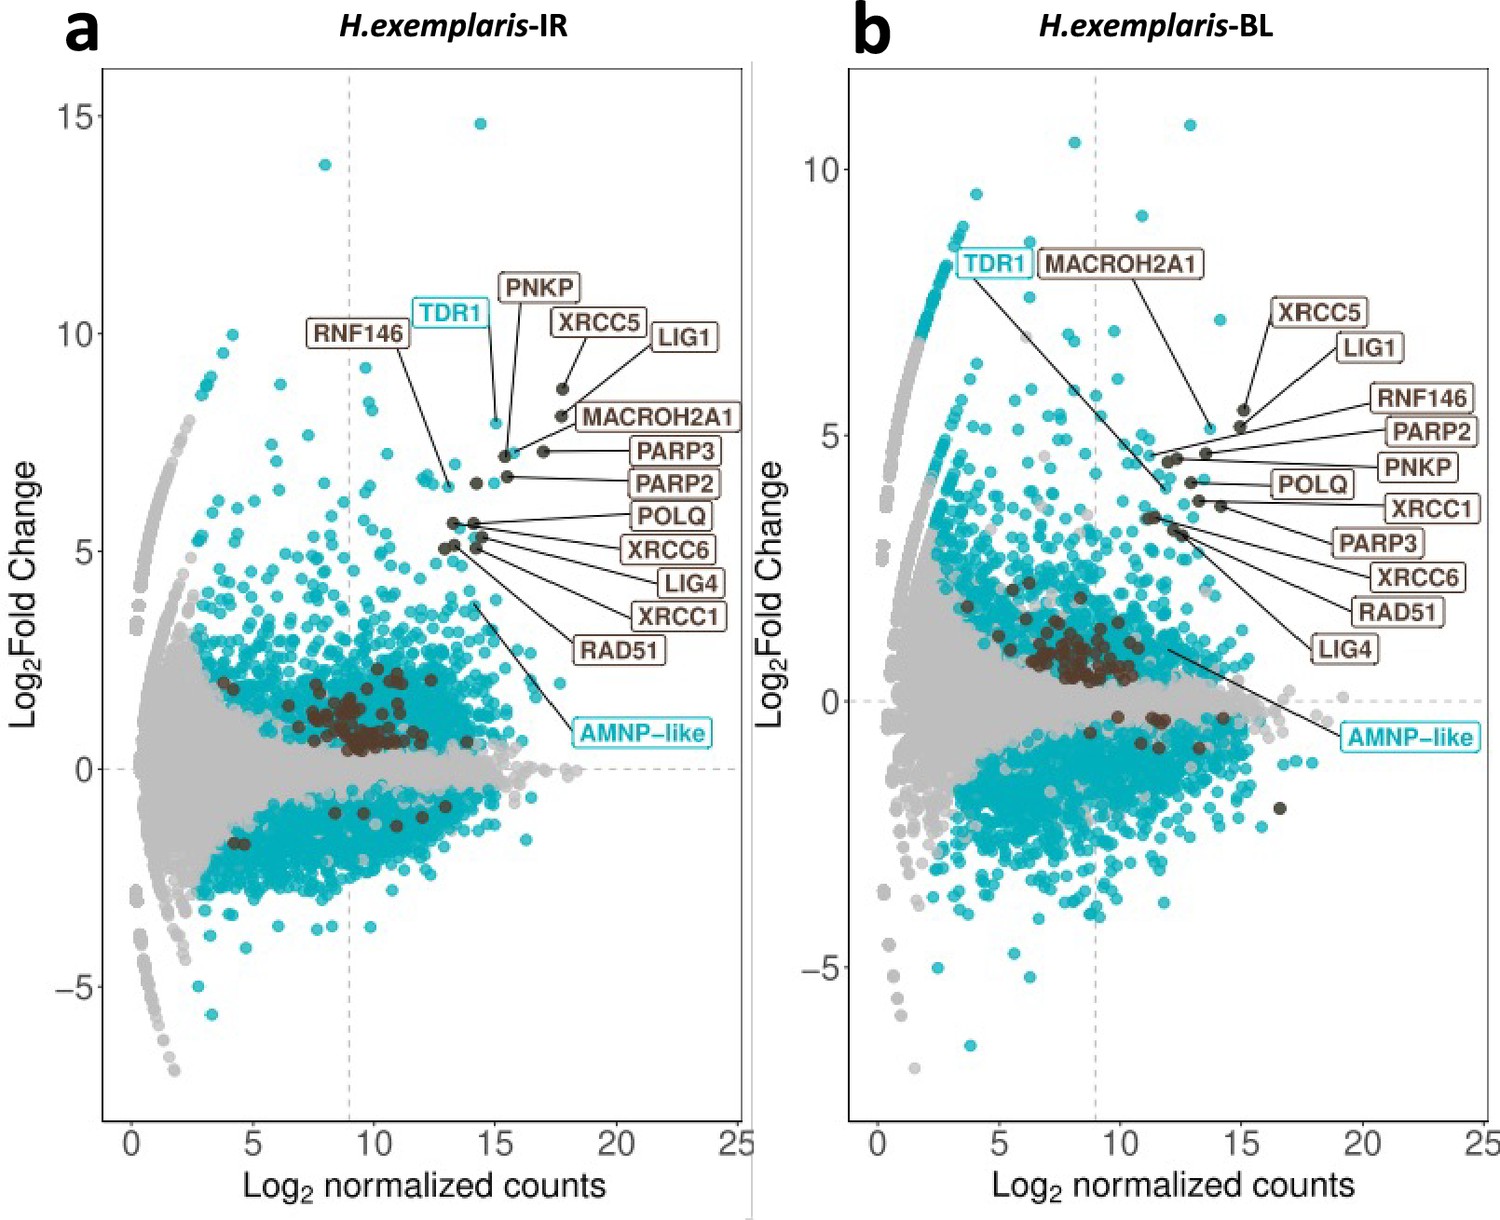
Abundance of H. exemplaris differentially expressed genes after ionizing radiation (IR) and Bleomycin treatment.
(a) MA plot of H. exemplaris differentially expressed genes after ionizing radiation (IR) treatment. (b) MA plot of H. exemplaris differentially expressed genes after Bleomycin treatment.
Figure 2—figure supplement 2
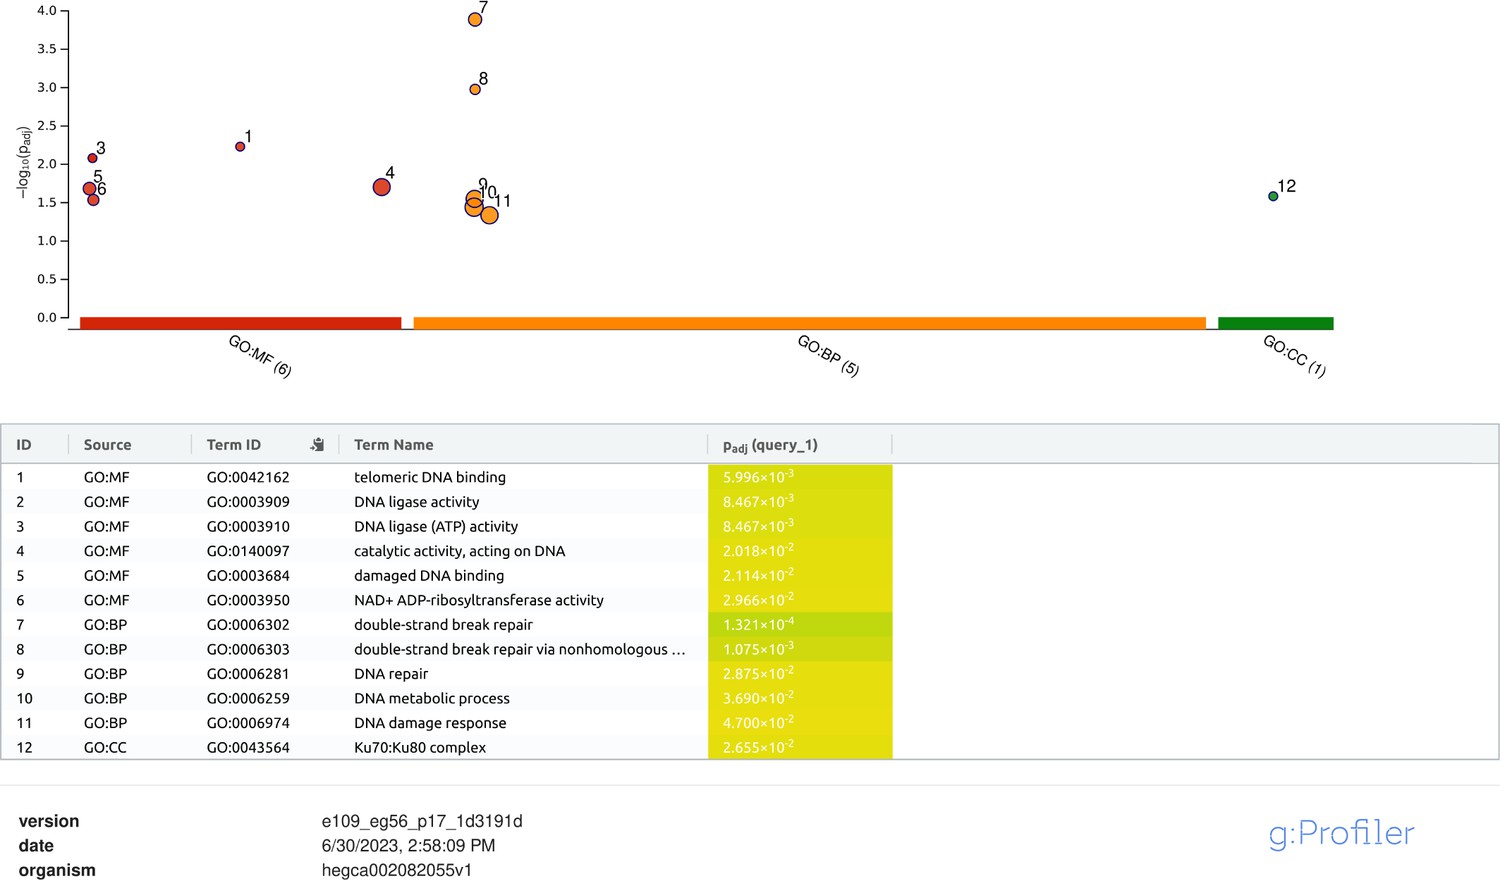
g:Profiler analysis of differentially expressed genes with adjusted p-value<0.05 in H. exemplaris after ionizing radiation (IR).
Figure 2—figure supplement 3
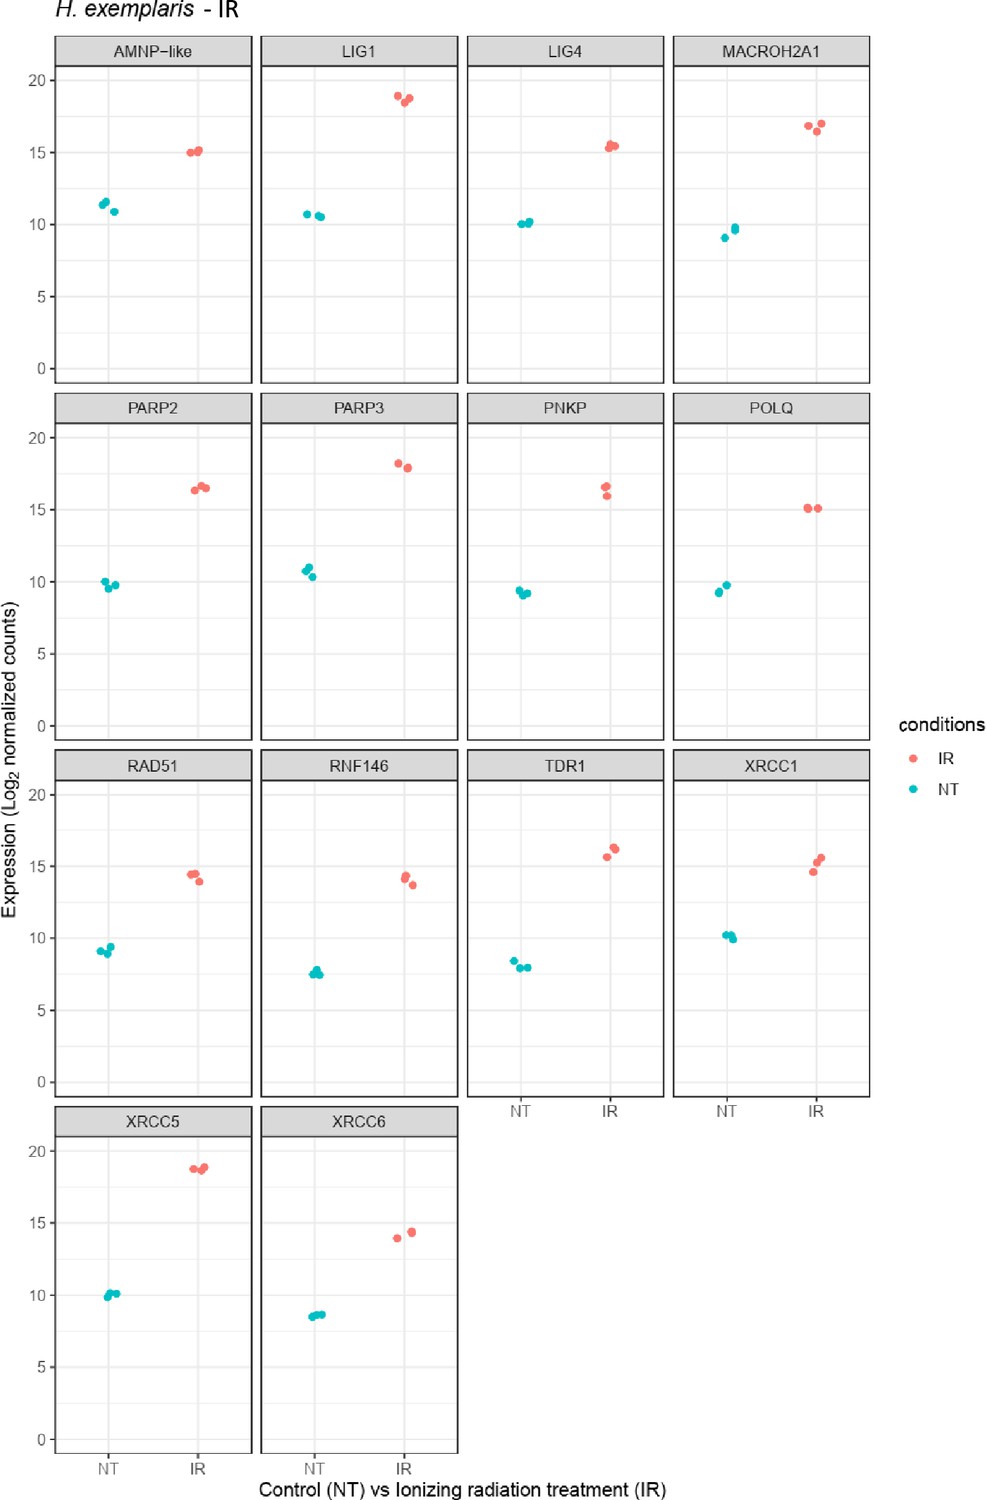
Relative abundance of selected genes represented in Figure 2a.
Figure 2—figure supplement 4
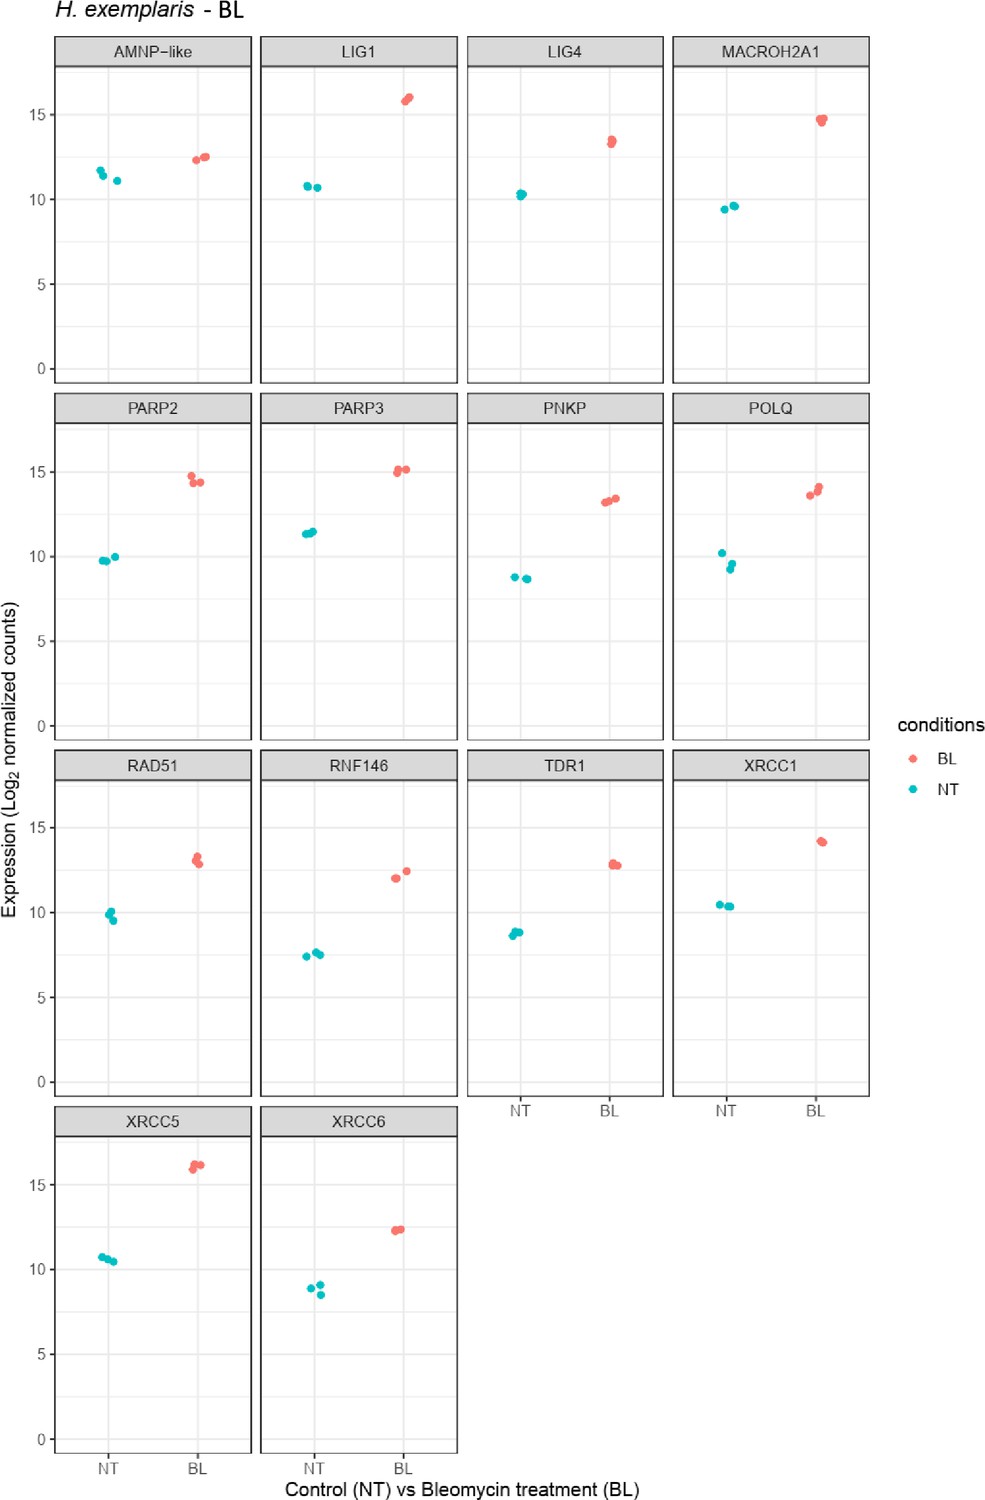
Relative abundance of selected genes represented in Figure 2b.
Figure 3 with 2 supplements
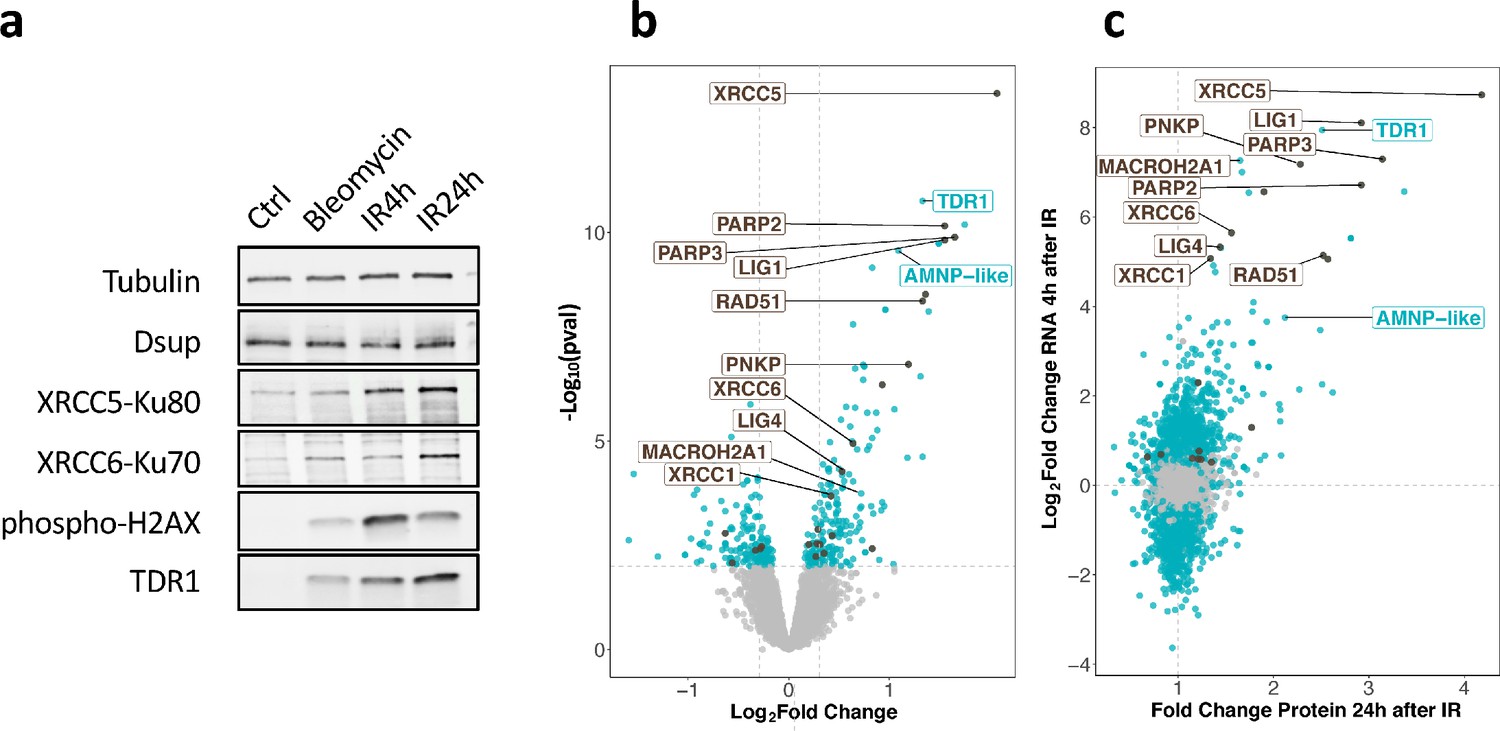
Changes in protein expression in H. exemplaris after exposure to ionizing radiation (IR).
(a) Western blot analysis of He-TDR1, He-XRCC5, He-XRCC6 (among the most strongly stimulated genes at the RNA level) and He-Dsup (not stimulated at the RNA level) in irradiated H. exemplaris tardigrades control, untreated H. exemplaris (Ctrl) or H. exemplaris treated with 100µM Bleomycin for 4days, or with 1000Gy γ-rays and extracts prepared at indicated times post-irradiation (IR4h and IR24h). Alpha-tubulin was used for normalization and phospho-H2AX for showing induction of DNA double-strand breaks. Quantification of four independent experiments are shown in Figure 3—figure supplement 1c. Molecular weight marker present in uncropped western blots (Figure 3—source data 2 ) is consistent with the expected 16kDa size of TDR1. (b) Volcano plot representing Log2 Fold Change and −Log10(limma p-value) of proteins between H. exemplaris 24hr post-irradiation with 1000Gy γ-rays and untreated control animals (n=4). Blue dots represent proteins with a Log2 Fold Change with a −Log10(limma p-value)≥2. Brown dots represent DNA repair proteins (based on KEGG DNA repair and recombination gene group ko03400) with −Log10(limma p-value)≥2. Gray points represent proteins with Log2 Fold Change with −Log10(limma p-value)<2and the vertical gray lines delimit Log2 Fold Change>0.3or <−0.3. Brown labels indicate representative strongly upregulated genes of DNA repair. Blue labels indicate two tardigrade-specific genes induced in response to IR: the TDR1 gene identified in this work, and the AMNP-like gene (BV898_10264), a member of the family of AMNP/g12777-like genes upregulated in response to desiccation and UVC (Yoshida et al., 2022). (c) Correlation between Fold Changes of protein levels 24hr post-irradiation with 1000Gy (as measured in (b)) and Log2 Fold Change of RNA levels 4hr post-irradiation (as measured in Figure 2a).
-
Figure 3—source data 1
Zip file containing all the 16 bit images used in Figure 3a.
- https://cdn.elifesciences.org/articles/92621/elife-92621-fig3-data1-v1.zip
-
Figure 3—source data 2
Pdf file showing annotated uncropped images used in Figure 3a.
- https://cdn.elifesciences.org/articles/92621/elife-92621-fig3-data2-v1.pdf
-
Figure 3—source data 3
Table of differentially expressed proteins after ionizing radiation (IR) 4hr or 24hr post-irradiation and after Bleomycin treatment 5days in H. exemplaris.
- https://cdn.elifesciences.org/articles/92621/elife-92621-fig3-data3-v1.xlsx
Figure 3—figure supplement 1
Expression of selected proteins by western blot and quantifications.
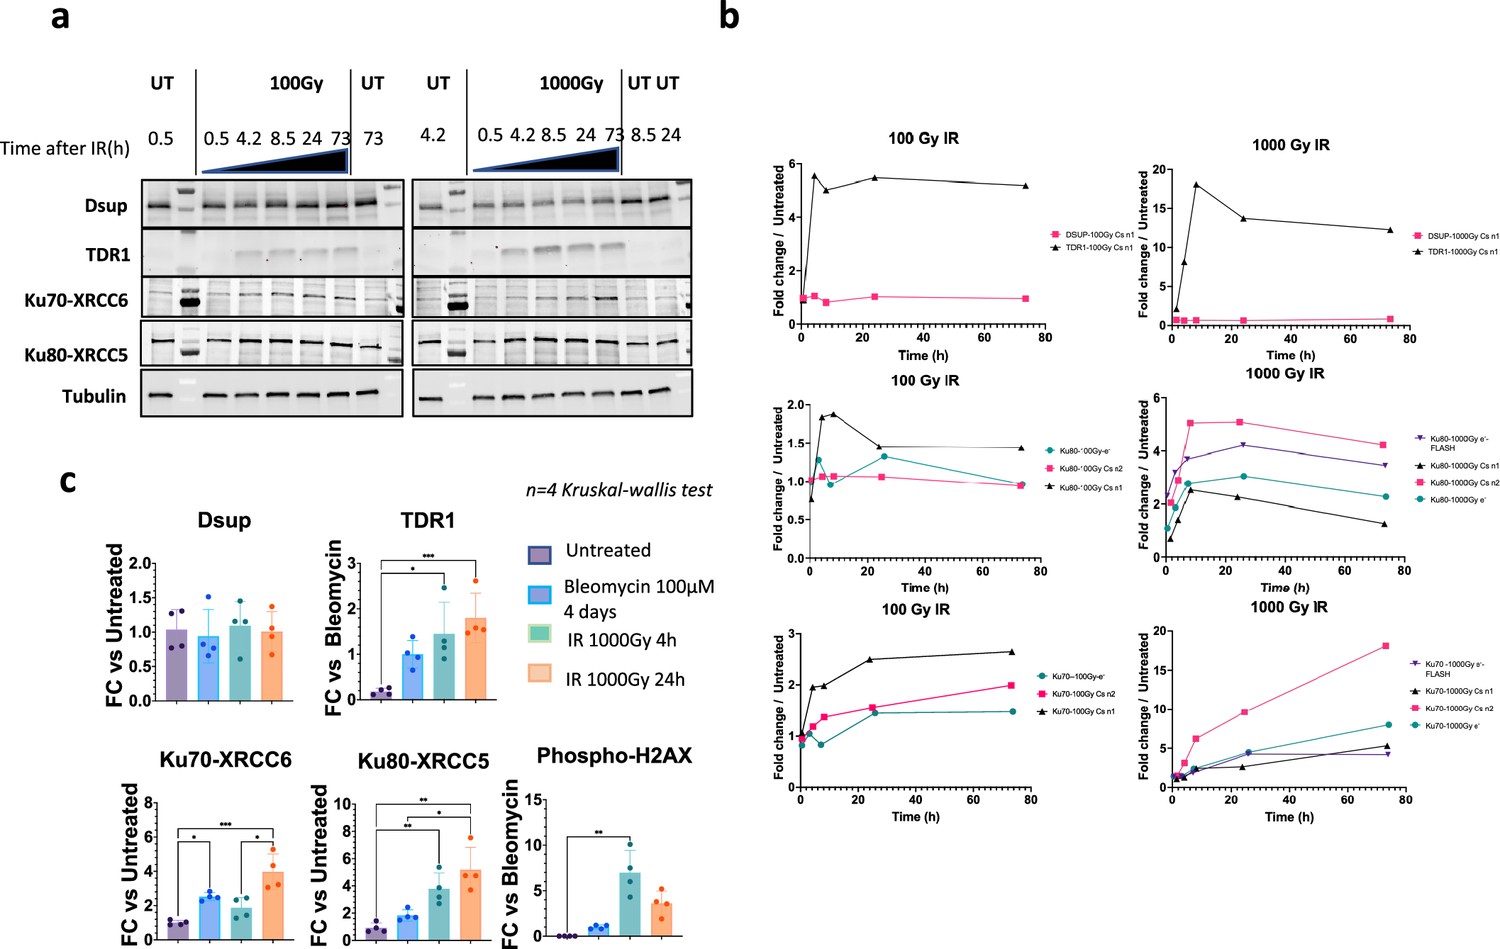
(a) Kinetics of protein expression after γ-irradiation (100Gy, left-side panel, and 1000Gy, right-side panel) assessed by western blots with antibodies against HeDsup, HeTDR1, HeKu70-XRCC6, HeKu80-XRCC5, and alpha-tubulin for normalization. (b) Quantification of western blots from experiments carried out with a cesium source (two independent experiments, labeled Csn1and Csn2, respectively, were performed) or with accelerated electron beam in conventional electron mode or FLASH electron mode as indicated. Signal is normalized with alpha-tubulin. Western blots from experiment Csn1 are shown in (a).(c) Quantification of western blots of samples used for differential proteomic analysis reported in Figure 3 (normalized to alpha-tubulin signal) n=4 independent experiments. FC stands for Fold Change. Kruskal-Wallis statistical test: *, p-value<0.05; **, p-value<0.005; ***, p-value<0.0005.
-
Figure 3—figure supplement 1—source data 1
Zip file containing all the raw 16 bit images used in Figure 3—figure supplement 1a.
- https://cdn.elifesciences.org/articles/92621/elife-92621-fig3-figsupp1-data1-v1.zip
-
Figure 3—figure supplement 1—source data 2
Pdf file showing the annotated uncropped images used in Figure 3—figure supplement 1a.
- https://cdn.elifesciences.org/articles/92621/elife-92621-fig3-figsupp1-data2-v1.pdf
Figure 3—figure supplement 2
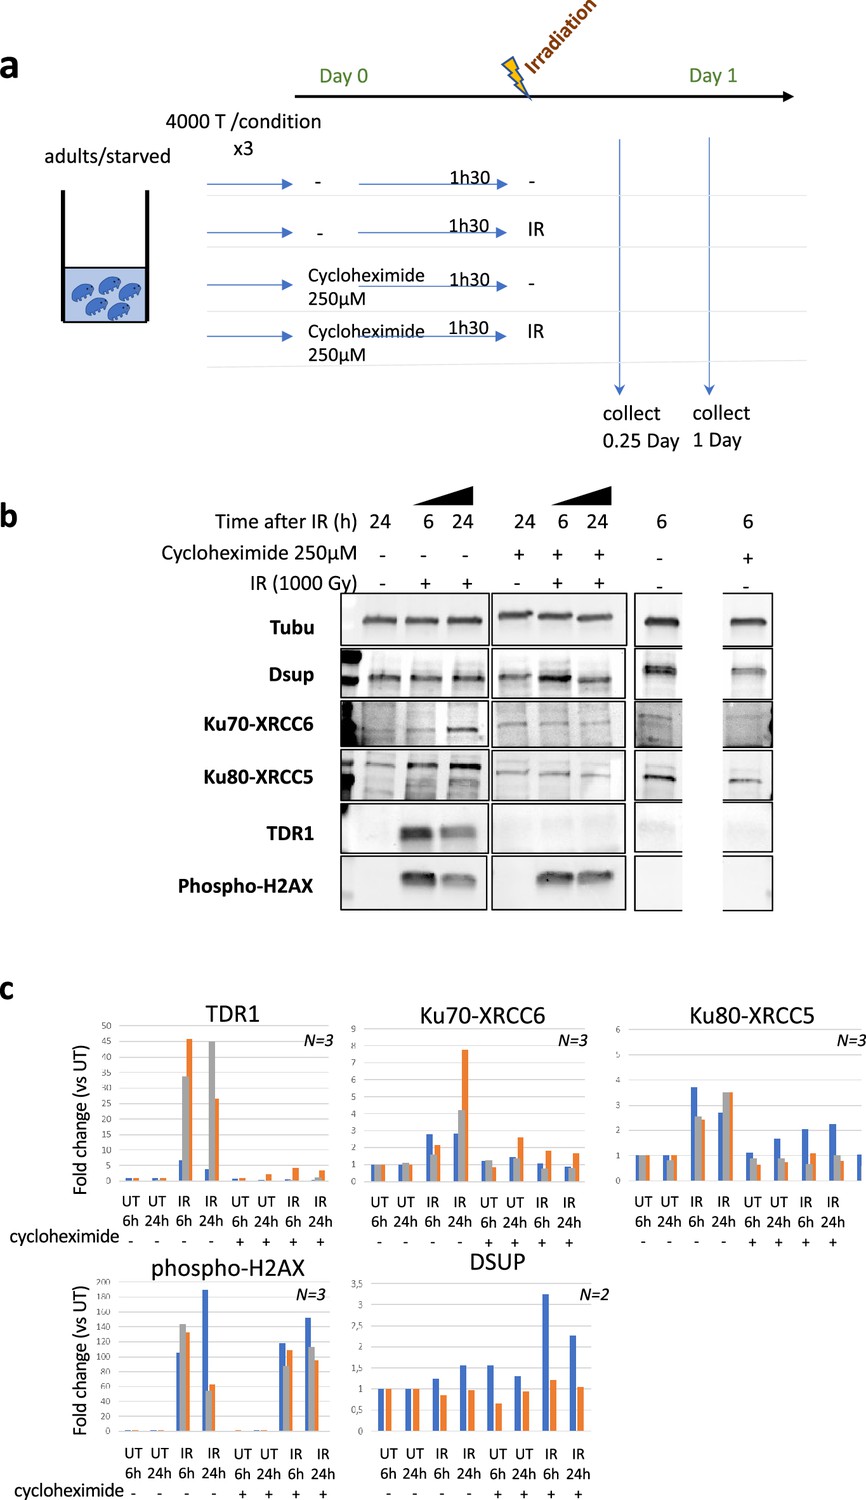
Impact of cycloheximide on protein levels in H. exemplaris after exposure to ionizing radiation (IR).
(a) Schematic showing experimental setup used to determine the impact of cycloheximide on protein levels in H. exemplaris after exposure to IR. (b) Western blot analysis of TDR1, XRCC5, XRCC6 (among the most strongly stimulated genes at the RNA level) and Dsup (not stimulated at the RNA level) in irradiated H. exemplaris tardigrades untreated (-) or treated with 1000Gy γ-rays and extracts prepared at indicated times after irradiation. On the left hand side of the panel, molecular weight markers are partially visible (see source data file). On the right hand side, between the two 6h post-IR lanes, a lane from extracts of animals subjected to an unrelated treatment was masked (see source data file). (c) Quantification of western blots (normalized to alpha-tubulin signal).
-
Figure 3—figure supplement 2—source data 1
Zip file containing all the raw 16 bit images used in Figure 3—figure supplement 2b.
- https://cdn.elifesciences.org/articles/92621/elife-92621-fig3-figsupp2-data1-v1.zip
-
Figure 3—figure supplement 2—source data 2
Pdf file showing the annotated uncropped images used in Figure 3—figure supplement 2b.
- https://cdn.elifesciences.org/articles/92621/elife-92621-fig3-figsupp2-data2-v1.pdf
Figure 4 with 5 supplements
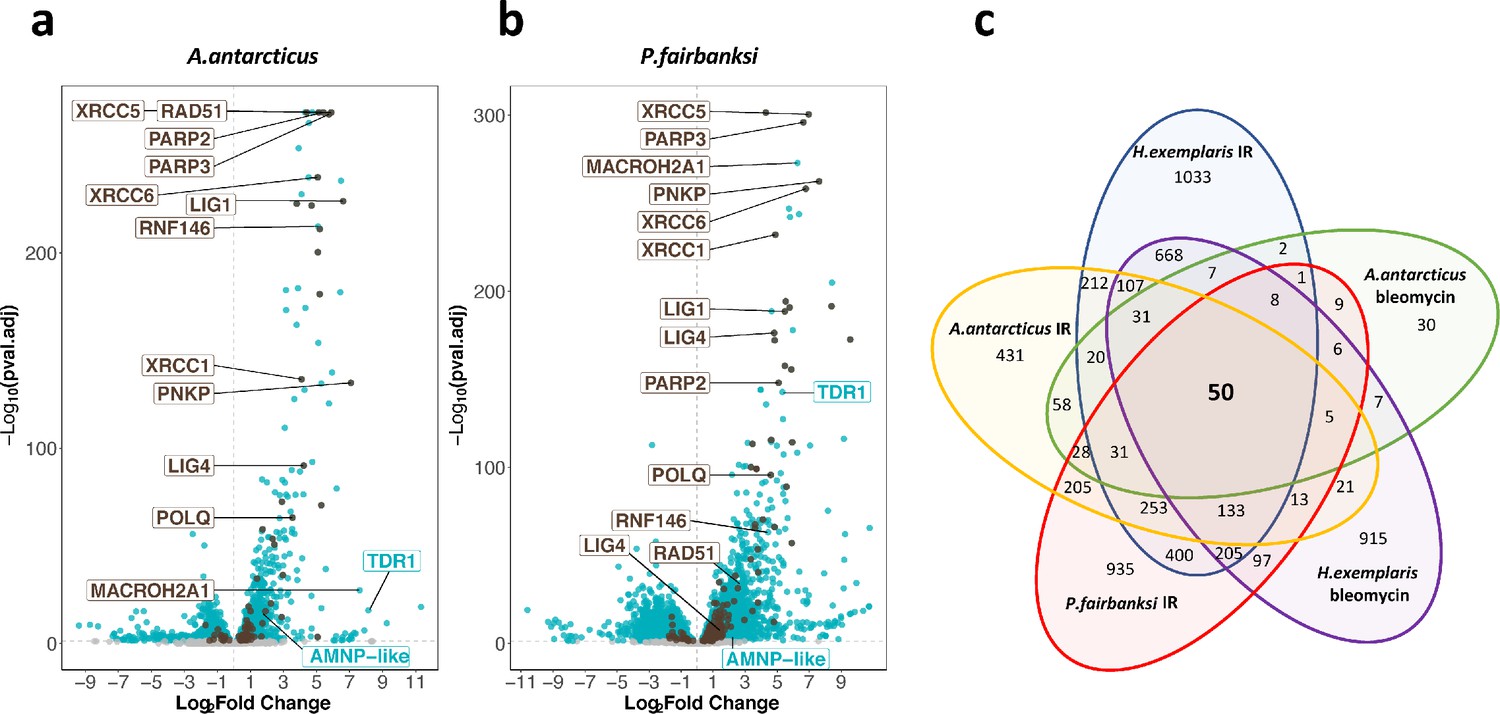
Transcriptomic response of A. antarcticus and P. fairbanksi to ionizing radiation (IR).
(a) and (b) volcano plots representing Log2 Fold Change and adjusted p-value (−log base 10) of RNA levels after irradiation with 1000Gy γ-rays between irradiated A. antarcticus and untreated controls (n=3) (a) and between irradiated P. fairbanksi and untreated controls (n=3) (b). Blue dots represent transcripts with an adjusted p-value<0.05. Brown dots indicate transcripts of DNA repair genes (based on KEGG DNA repair and recombination gene group ko03400) with an adjusted p-value<0.05. Brown labels indicate representative strongly upregulated genes of DNA repair. Blue labels indicate two tardigrade-specific genes induced in response to IR: the TDR1 gene identified in this work, and the AMNP-like gene (BV898_10264), a member of the family of AMNP/g12777-like genes upregulated in response to desiccation and UVC (Yoshida et al., 2021). (c) Venn diagram showing upregulated genes with an adjusted p-value<0.05 common to the transcriptomic response to IR in the three species analyzed and to Bleomycin in H. exemplaris and A. antarcticus.
-
Figure 4—source data 1
Table of differentially expressed genes after ionizing radiation (IR) in A. antarcticus.
- https://cdn.elifesciences.org/articles/92621/elife-92621-fig4-data1-v1.xlsx
-
Figure 4—source data 2
Table of differentially expressed genes after Bleomycin treatment in A. antarcticus.
- https://cdn.elifesciences.org/articles/92621/elife-92621-fig4-data2-v1.xlsx
-
Figure 4—source data 3
Table of differentially expressed genes after ionizing radiation (IR) in P. fairbanksi.
- https://cdn.elifesciences.org/articles/92621/elife-92621-fig4-data3-v1.xlsx
Figure 4—figure supplement 1
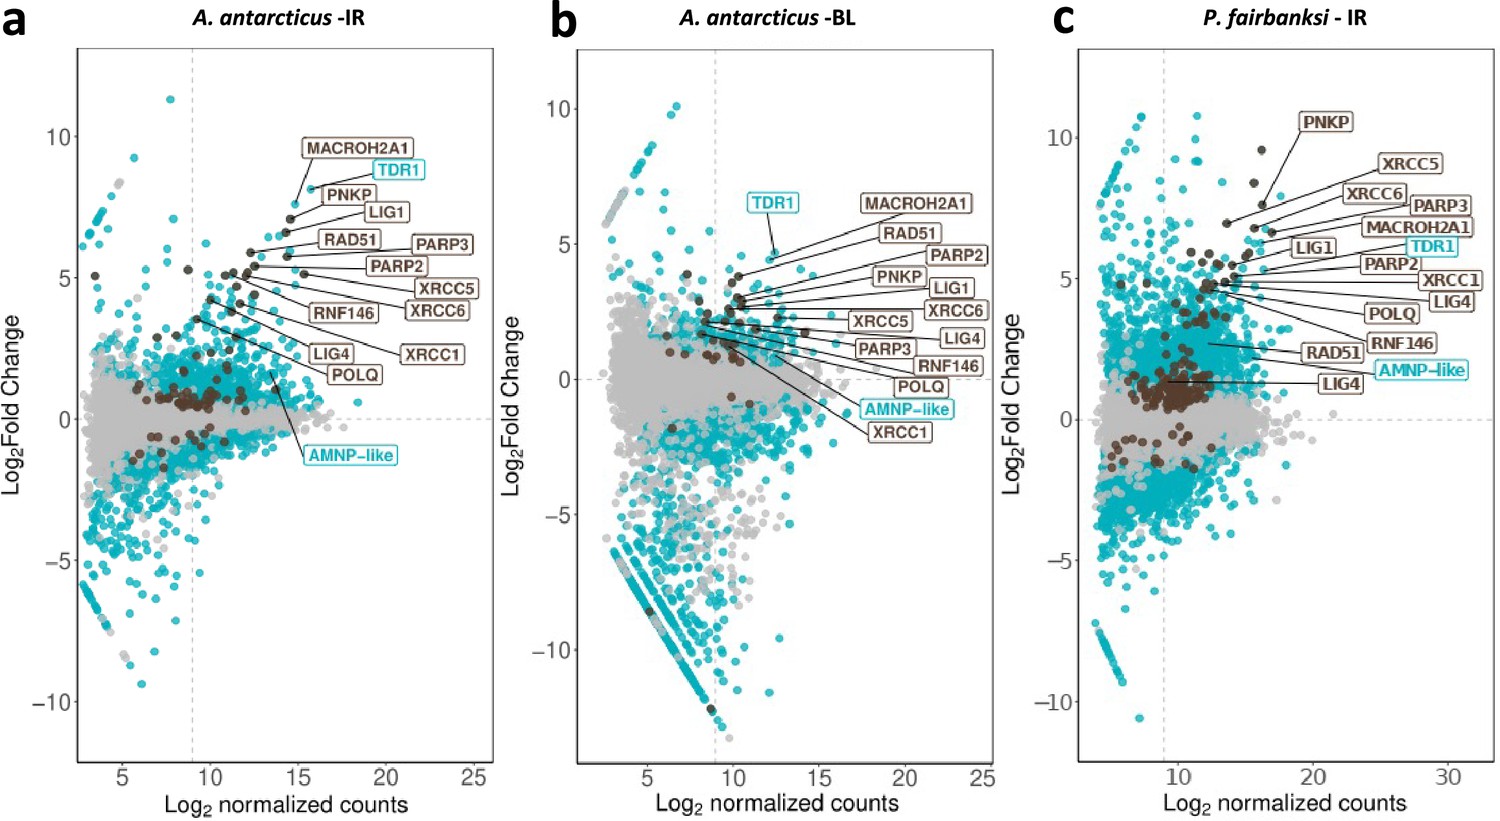
Abundance of differentially expressed genes of A. antarcticus and P. fairbanksi after ionizing radiation (IR) and of A. antarcticus after Bleomycin treatment.
(a) MA plot of A. antarcticus differentially expressed genes after IR treatment. (b) MA plot of A. antarcticus differentially expressed genes after Bleomycin treatment. (c) MA plot of P. fairbanksi differentially expressed genes after IR treatment.
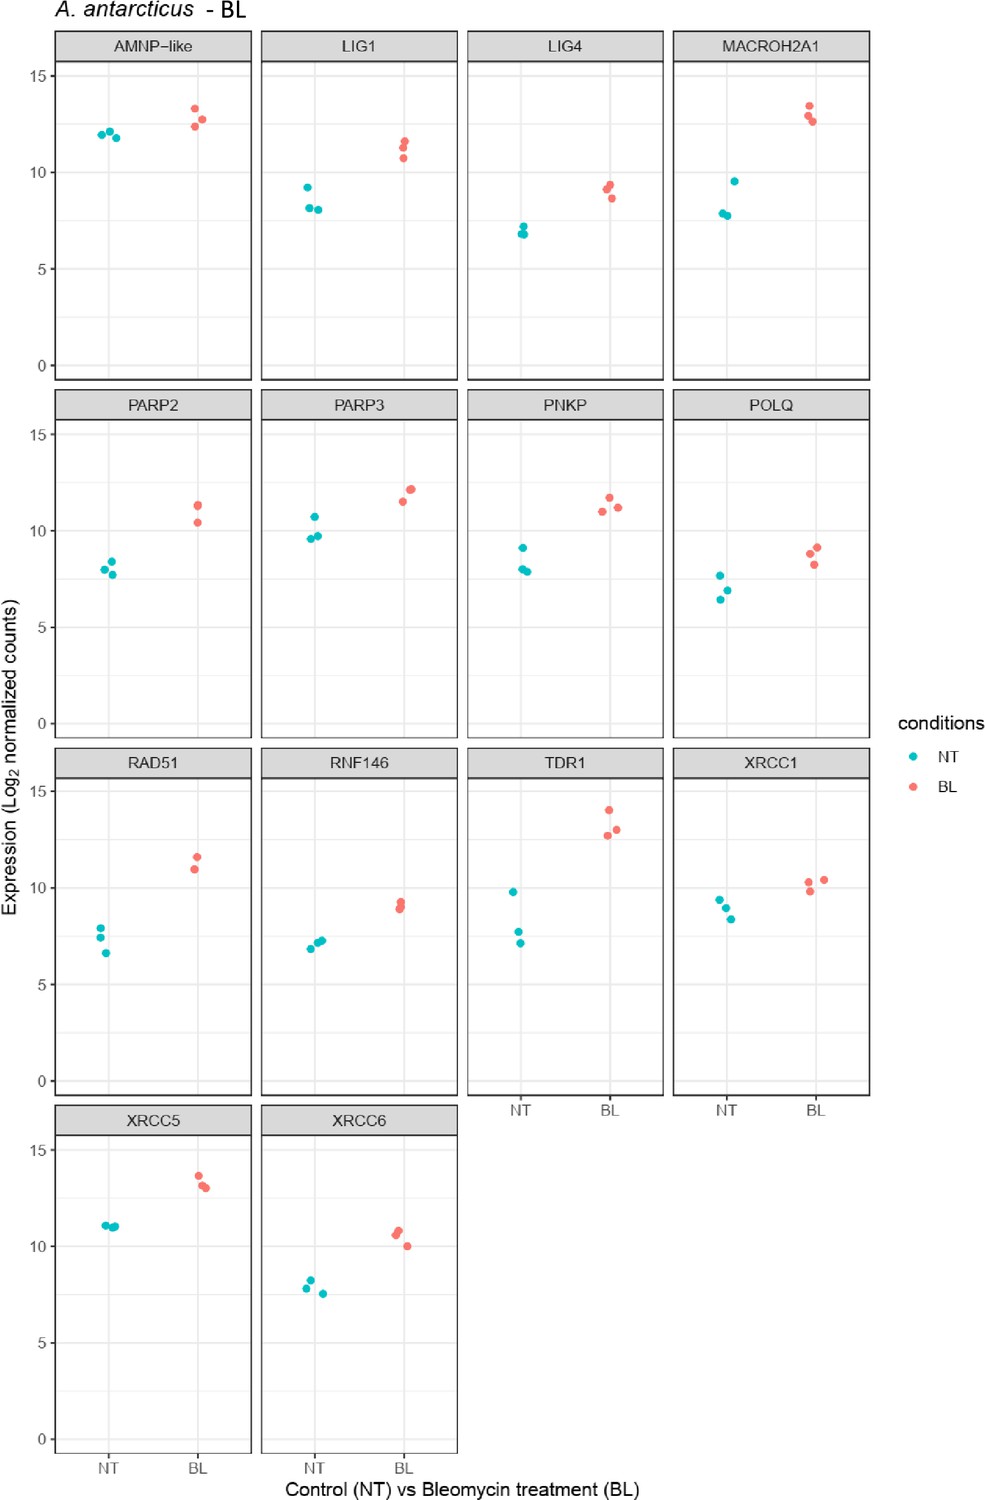
Figure 4—figure supplement 2
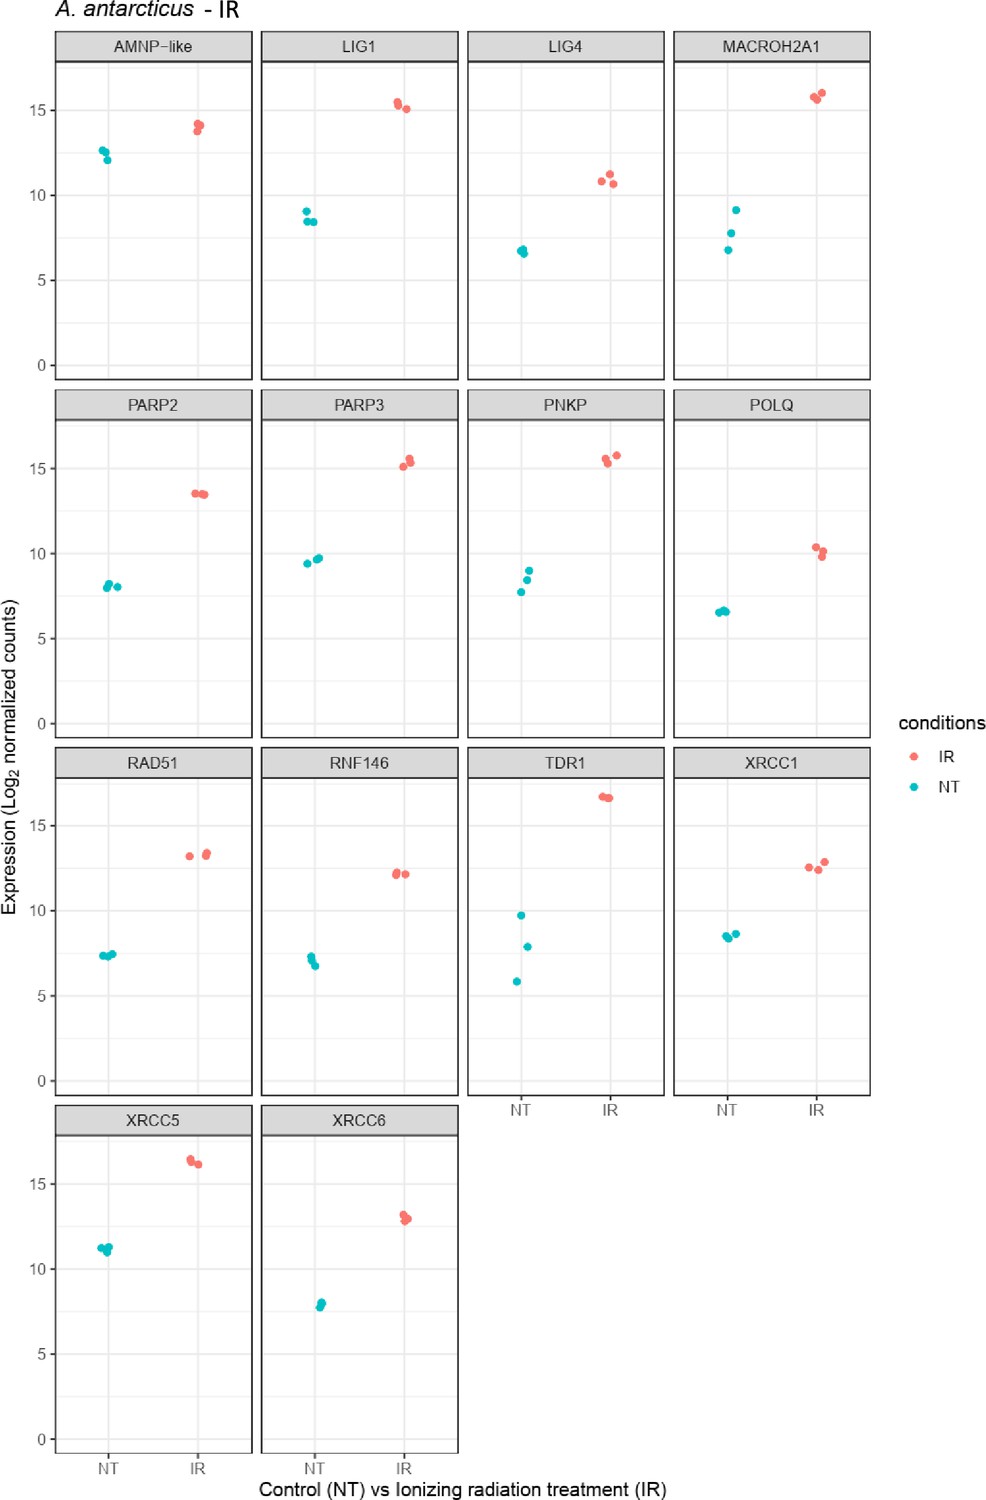
Relative abundance of selected genes represented in Figure 4a and Figure 4—figure supplement 1a.
Figure 4—figure supplement 3
Relative abundance of selected genes represented in Figure 4—figure supplement 1b.
Figure 4—figure supplement 4
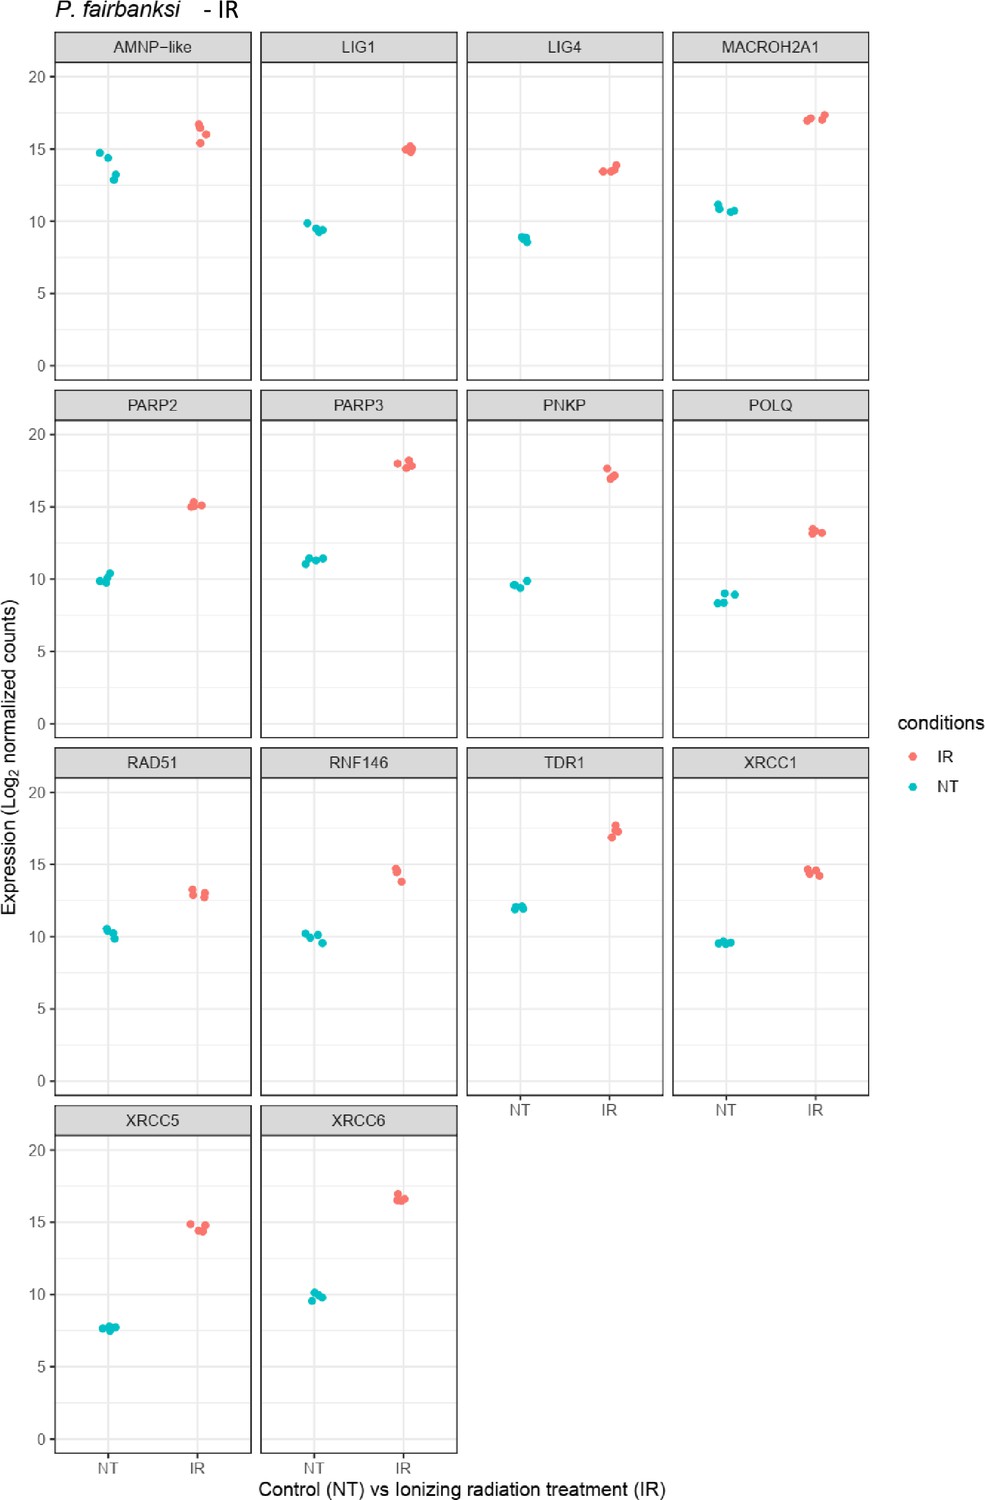
Relative abundance of selected genes represented in Figure 4b and Figure 4—figure supplement 1c.
Figure 4—figure supplement 5
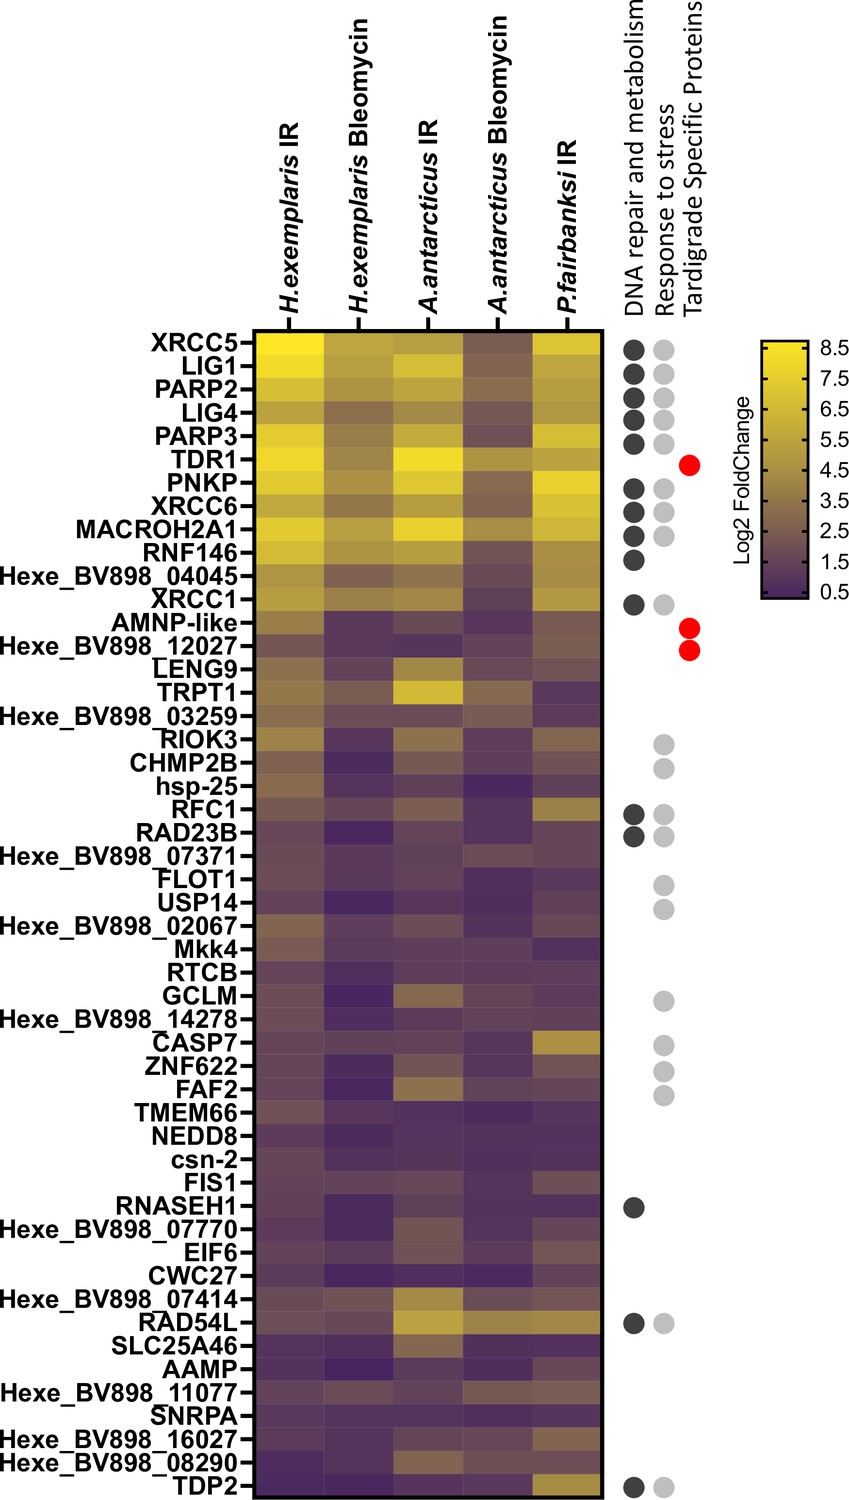
Heatmap of 50 putative orthologous genes upregulated in response to ionizing radiation (IR) in all the three species analyzed, H. exemplaris, A. antarcticus, and P. fairbanksi, and in response to Bleomycin in both H. exemplaris and A. antarcticus.
Heatmap of Log2 Fold Change (ordered by adjusted p-value) is represented. On the right, information on gene annotation is given. KEGG annotation groups are indicated as well as tardigrade-specific proteins as found in this work (see Materials and methods section for the criterion used to define tardigrade-specific genes/proteins). 14/50 genes are DNA repair genes and the other commonality is that 21/50 genes are stress response genes.
Figure 5 with 2 supplements
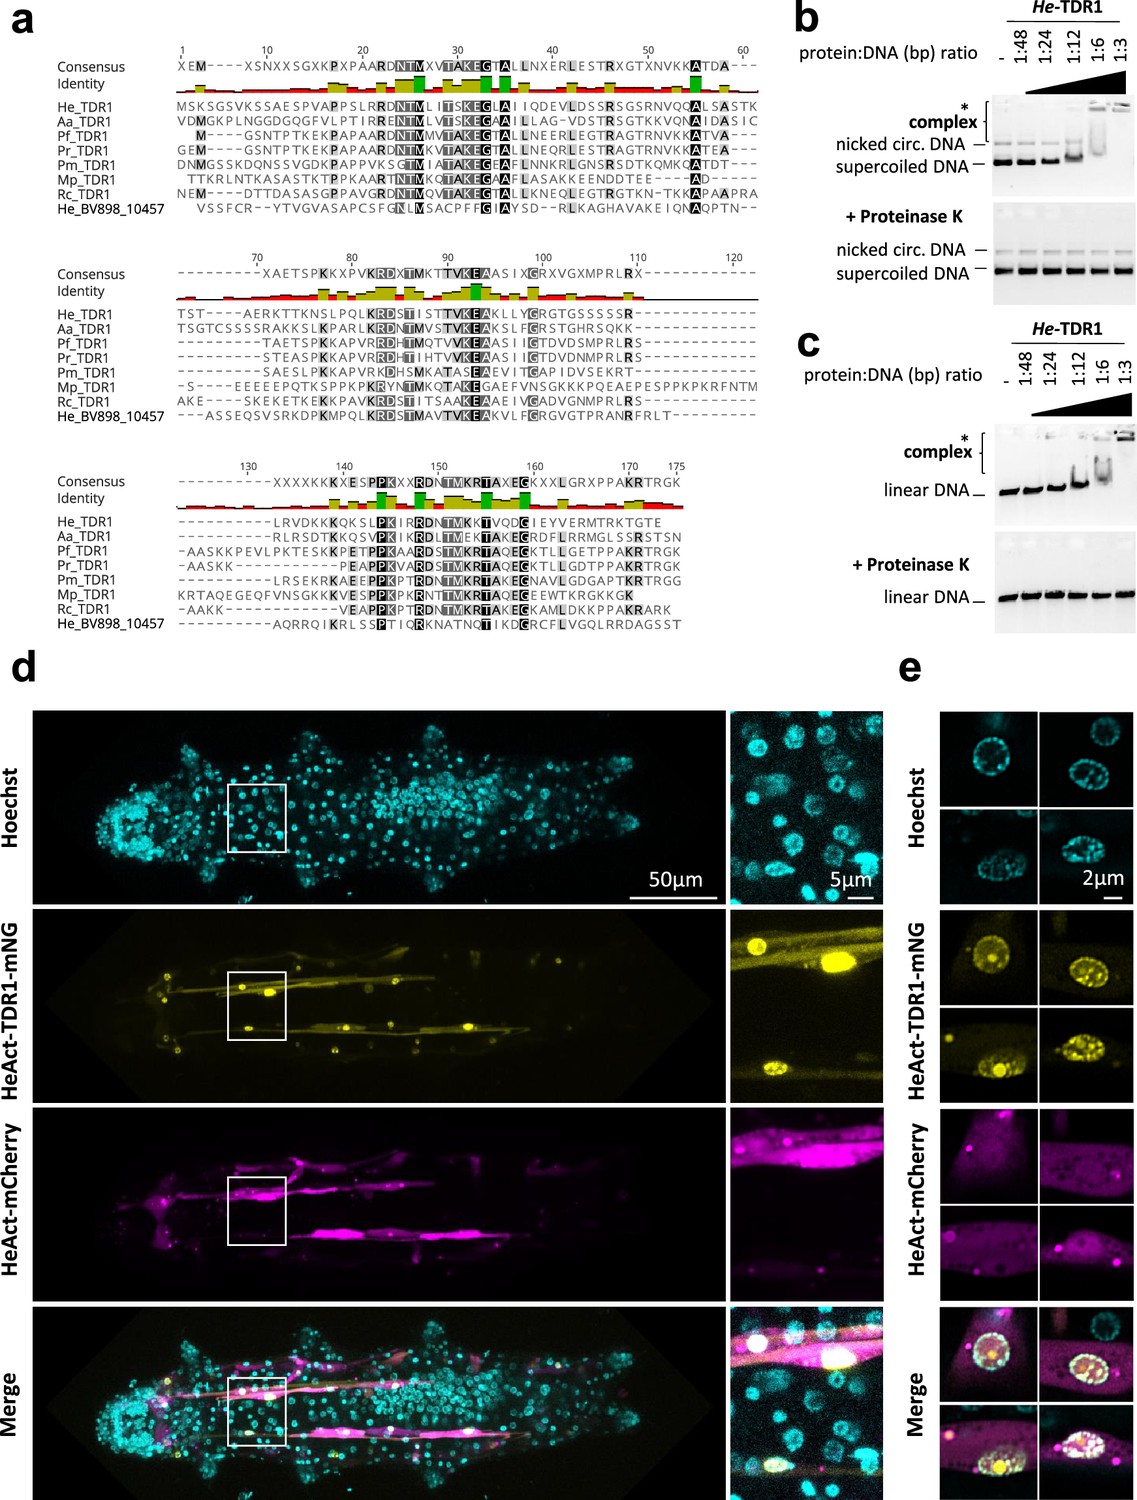
He-TDR1 interacts directly with DNA.
(a) Sequence alignment of the conserved C-terminal domain of TDR1 proteins from H. exemplaris (He), A. antarcticus (Aa), P. fairbanksi (Pf) (identified in this work), and from Paramacrobiotus richtersi (Pr) (NCBI transcriptome assembly GFGY00000000.1, now known as Paramacrobiotus spatialis), P. metropolitanus (Pm), Richtersius coronifer (Rc) (Kamilari et al., 2019), Mesobiotus philippinicus (Mp) (Mapalo et al., 2020). He_BV898_10457 corresponds to a paralog of HeTDR1 in H. exemplaris with weaker sequence identity to He-TDR1 than TDR1 homologs from other species. (b–c) Gel shift assay of recombinant He-TDR1 with circular plasmid (b) or linear plasmid (c). Mixes of plasmid DNA and recombinant He-TDR1 at indicated protein to DNA (bp) ratios were incubated at 25°C for 20min and migrated, either directly or after proteinase K digestion, at room temperature on 0.75% agarose with ethidium bromide. Fluorescence was revealed with a ChemiDoc MP imager. Complexes of plasmid DNA and recombinant He-TDR1 are indicated by a bracket. High molecular weight complexes that remained in the loading wells and did not migrate into the gel are indicated by an asterisk. (d) Expression of He-TDR1-mNeonGreen in transient transgenic H. exemplaris tardigrades. Expression plasmids of He-TDR1-mNeonGreen (mNG) and mCherry (both under control of the He-Actin promoter) were microinjected into the body fluid of H. exemplaris adults and electroporation was performed to induce delivery into cells following the protocol of Tanaka et al., 2023. Confocal microscopy was carried out on live animals immobilized in carbonated water at day 8 post-microinjection after 2days of treatment with 20µM Hoechst 33342 to stain nuclei. Maximum projections of confocal Z-stack are shown. (e) High-resolution imaging of nuclei expressing He-TDR1-mNG and Hoechst staining of the nucleus using the Airyscan2 module (one Z-slice is shown). Nuclear He-TDR1-mNG is co-localized with Hoechst staining except for one big foci which was observed in some high-resolution images (yellow channel), likely corresponding to nucleolar accumulation of overexpressed He-TDR1-mNG.
-
Figure 5—source data 1
Zip file containing all the raw 16 bit images used in Figure 5b and c.
- https://cdn.elifesciences.org/articles/92621/elife-92621-fig5-data1-v1.zip
-
Figure 5—source data 2
Pdf file showing the annotated uncropped images used in in Figure 5b and c.
- https://cdn.elifesciences.org/articles/92621/elife-92621-fig5-data2-v1.pdf
Figure 5—figure supplement 1
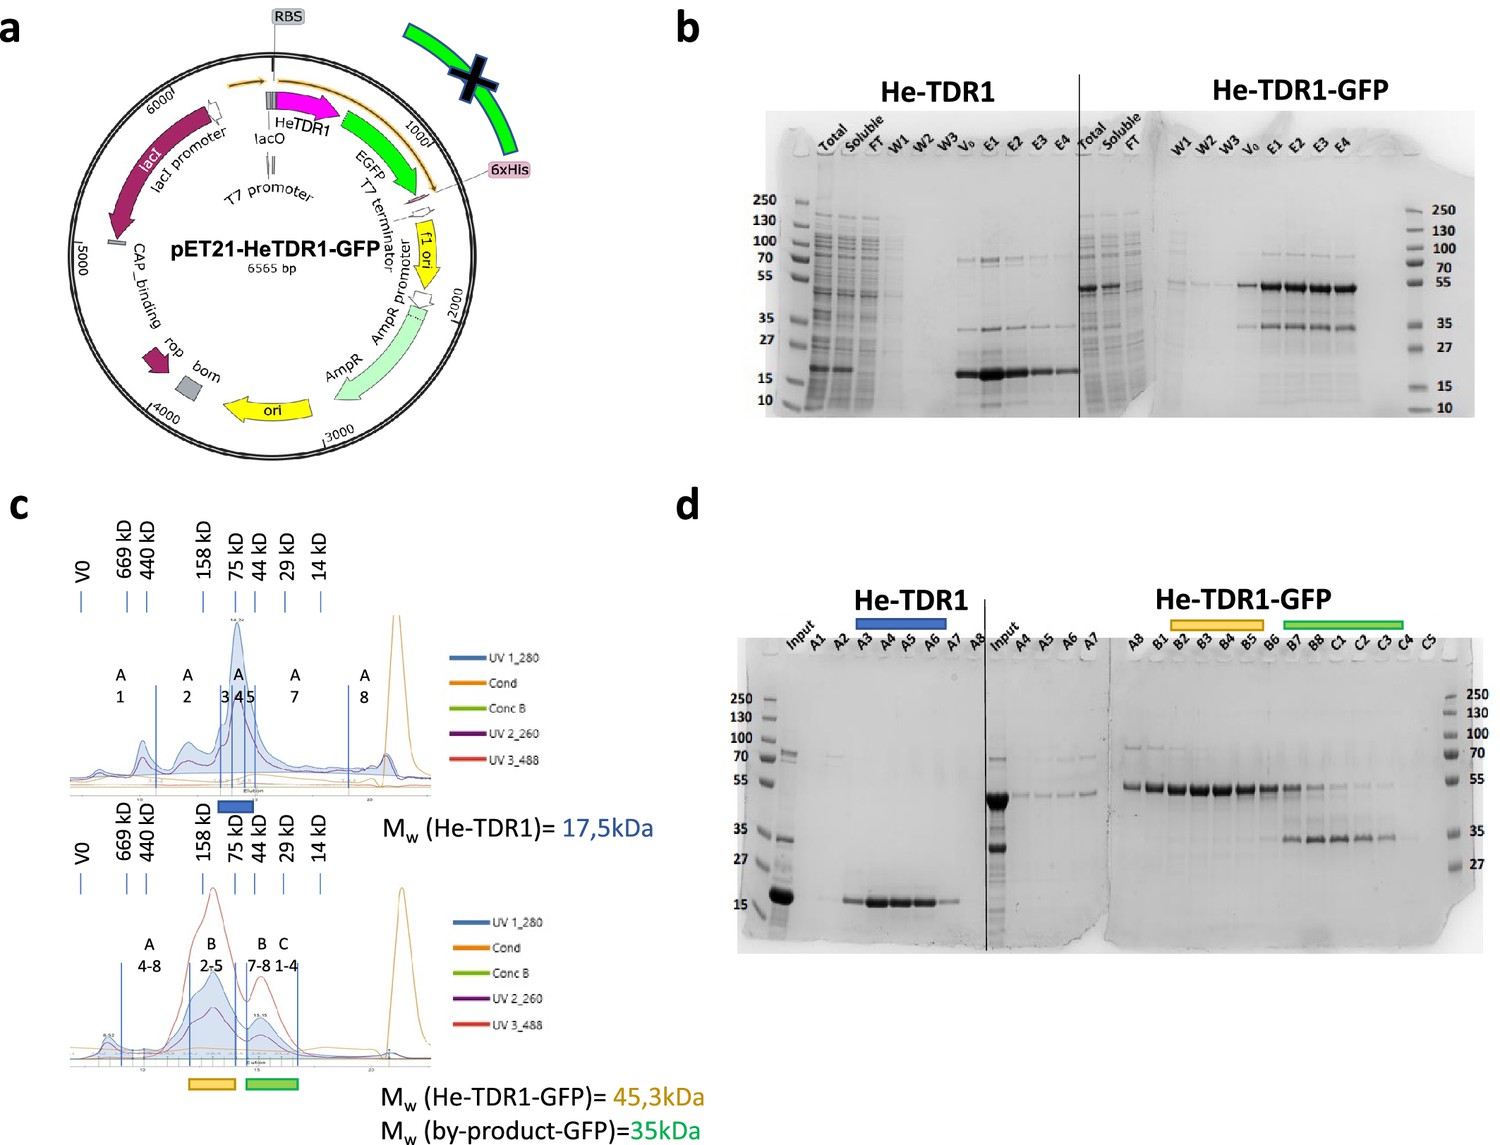
Production of recombinant He-TDR1 and He-TDR1-GFP.
(a) Map of vector for expression in Escherichia coli Rosetta 2(DE3): He-TDR1 (Mw = 17.5kDa) and its GFP fusion (Mw = 45.3KDa) are His-tagged at their C-terminal end for affinity purification on Nickel Sepharose beads. (b) SDS-PAGE after His-TRAP Sepharose beads chromatography (Instant blue stained). Both proteins are soluble. Fraction V0 to E4 were collected and concentrated on 10kDa MWCO Amicon for gel filtration. (c) Chromatogram (UV absorbance at 260nm, 280nm, and 488nm for GFP). (d) SDS-PAGE of indicated fractions obtained after Superdex 200 Increase gel filtration for He-TDR1 (c, upper panel) and He-TDR1-GFP (c, bottom panel). V0 and Mw calibration protein volume are reported for comparison to the apparent Mw of He-TDR1 (purified protein peak shown in blue) and He-TDR1-GFP (purified protein peak shown in yellow). By-product GFP protein is also purified (shown in green) and is used as internal Mw control. Apparent Mw of He-TDR1 and its GFP fusion are higher than expected and suggest a possible multimerization of the He-TDR1 protein.
Figure 5—figure supplement 2
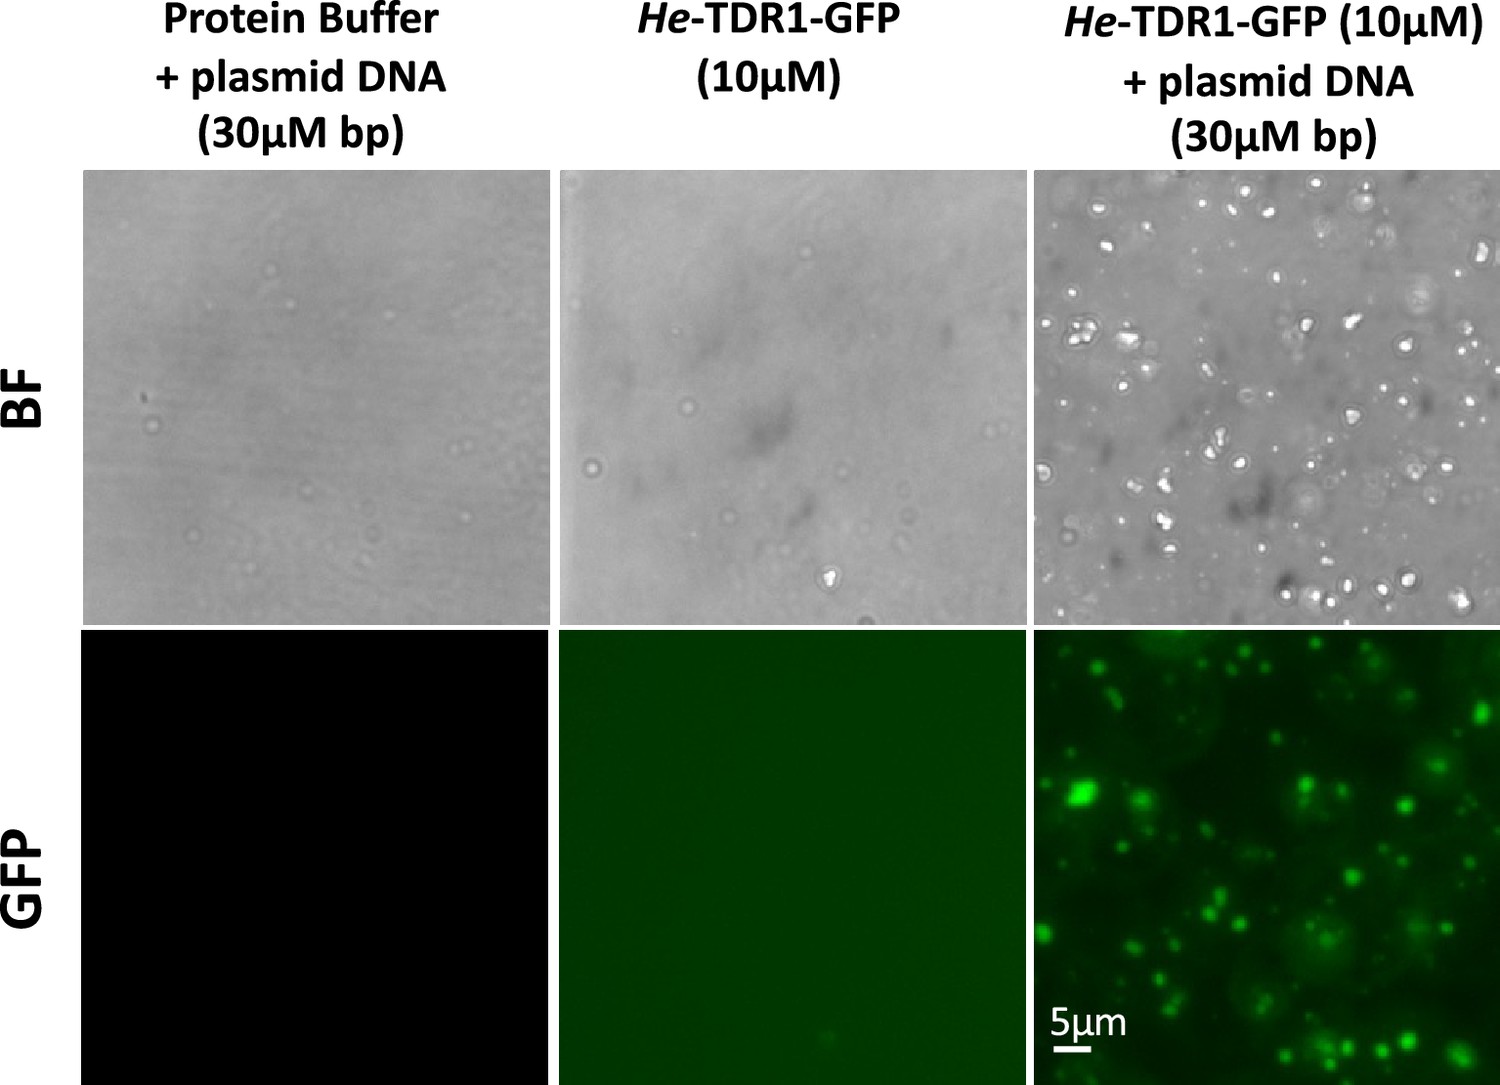
Formation of aggregates of He-TDR1 and DNA.
Bright-field and GFP fluorescence imaging of plasmid DNA 10µM in bp (5900bp) incubated in the presence of 10µM of He-TDR1-GFP (10min at 25°C in 10mM Tris-HCl pH 8, NaCl 150mM, glycerol 10%, 1mM TCEP). No aggregates are observed with the DNA or the protein alone. Large aggregates of DNA with the protein are observed both in bright-field and in fluorescence imaging as a result of the binding of He-TDR1-GFP (similar aggregates were observed in bright-field for He-TDR1 (not shown)).
Figure 6 with 1 supplement
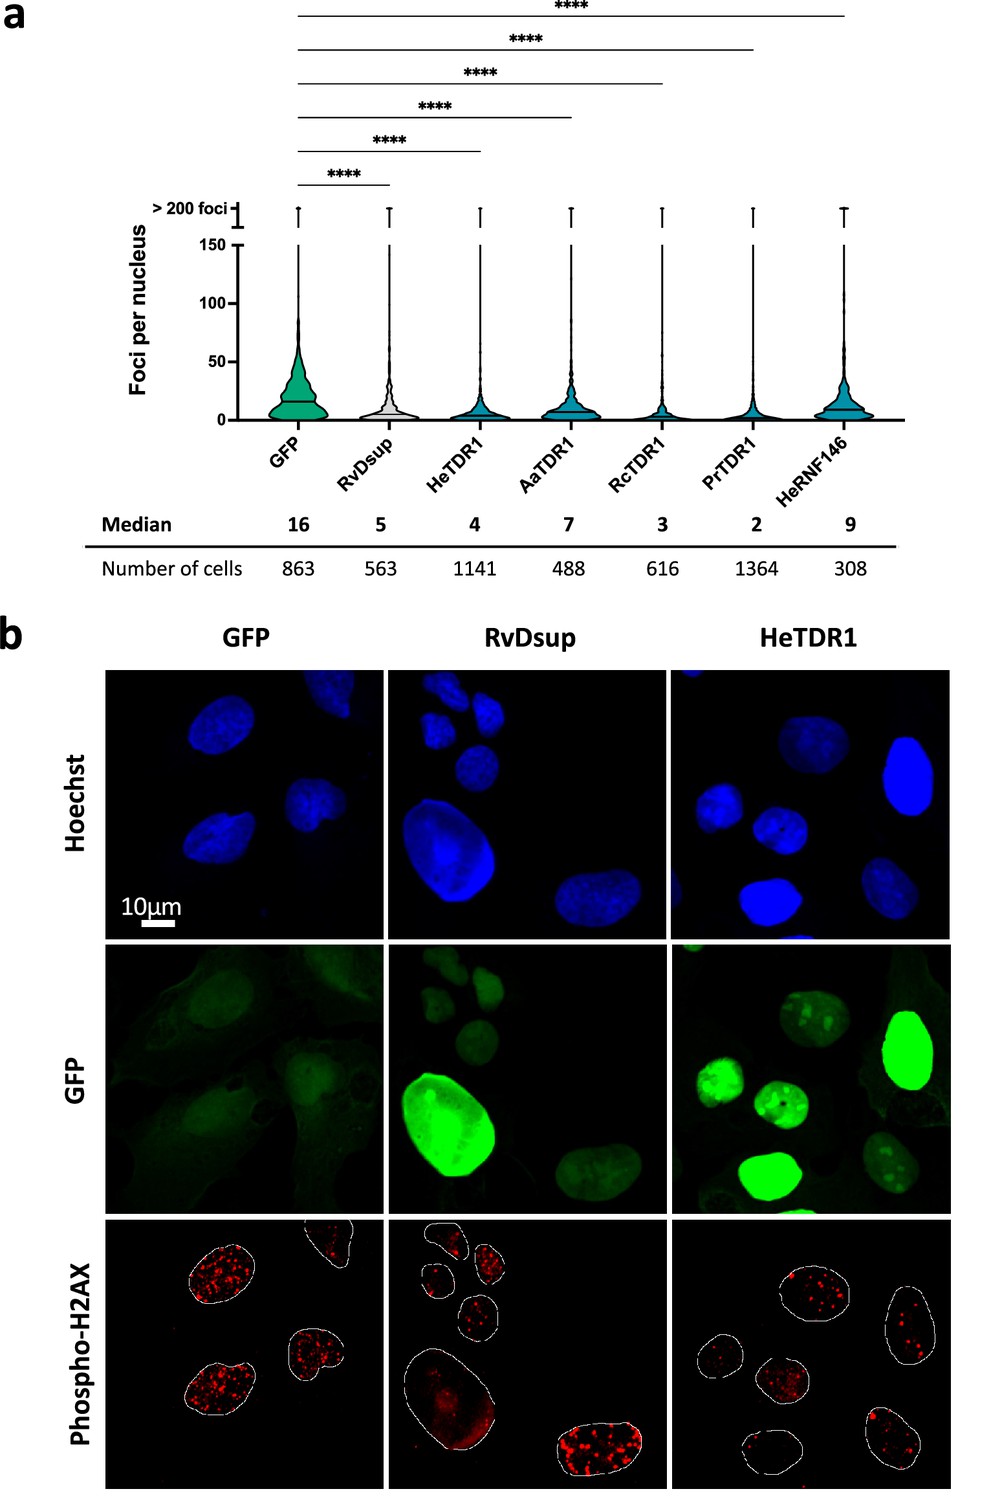
Reduced numbers of phospho-H2AX foci after Bleomycin treatment in human U2OS cells expressing TDR1-GFP from multiple tardigrade species.
(a) Violin plot of the number of phospho-H2AX foci per nucleus of cells expressing the indicated protein. Phospho-H2AX foci were counted after 1 µg/mL Bleomycin 1 hr treatment of U2OS cells electroporated with a plasmid expressing either eGFP (control), RvDsup-GFP, TDR1-GFP from H. exemplaris (He), A. antarcticus (Aa), R. coronifer (Rc), and P. richtersi (Pr), He-RNF146-GFP. Cells were fixed with a 4% PFA PBS solution for 1hr, immunolabeled with chicken anti-GFP and mouse anti-phospho-H2AX antibodies and imaged by confocal microscopy. **** indicates p<0.0001 (Kruskal-Wallis test). A minimum of 308 nuclei were counted in each experimental condition (n=3). A representative experiment is shown here. Data from independent replicates are given in Figure 6—figure supplement 1. (b) Representative confocal fluorescence imaging of experiment analyzed in (a).Images were taken with identical settings and printed with same thresholding so that signal intensity could be compared. Scale bar corresponds to 10µM.
Figure 6—figure supplement 1
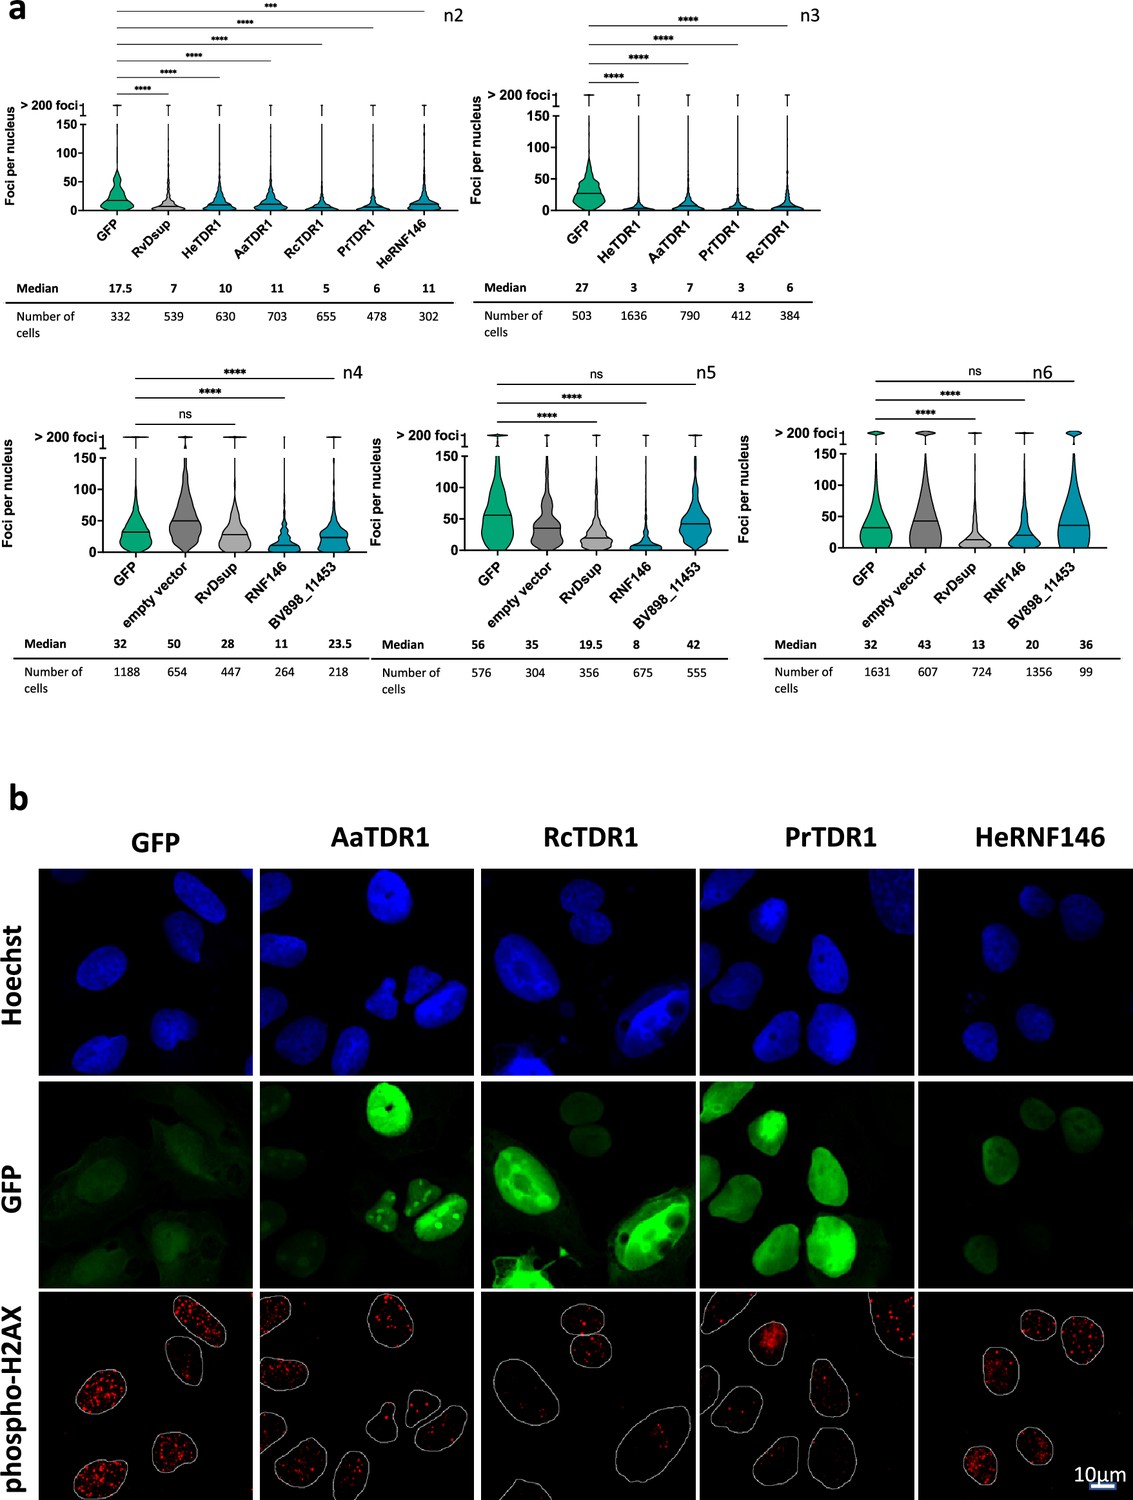
Independent replicates of experiments of Figure 6.
Tables
Table 1
Proteomic analysis metrics: numbers of differentially expressed (DE) proteins (with limma p-value<0.01and Log2 Fold Change<−0.3 or >0.3) for each indicated condition in H. exemplaris.
The numbers of tardigrade-specific DE proteins are also indicated. Nine tardigrade-specific DE proteins were common to the three conditions, the corresponding list is provided in Supplementary file 4. Tardigrade-specific proteins are defined as detailed in the Materials and methods section. IR4h, 4hr post-1000 Gy γ-ray irradiation; IR24h, 24hr post-1000 Gy γ-ray irradiation; Ctrl, Control.
| IR4h vs Ctrl | IR24h vs Ctrl | Bleomycin vs Ctrl | |
|---|---|---|---|
| Total number of proteins identified in the three conditions | 5625 | ||
| DE proteins | 58 | 266 | 185 |
| DE proteins up | 42 | 168 | 128 |
| DE proteins down | 16 | 98 | 57 |
| DE proteins in the three conditions | 36 | ||
| Tardigrade-specific DE proteins | 13 | 61 | 70 |
| Tardigrade-specific DE proteins up | 11 | 52 | 47 |
| Tardigrade-specific DE proteins down | 2 | 9 | 23 |
| Tardigrade-specific DE proteins in the three conditions | 9 | ||
Table 2
Number of differentially expressed genes (DEG with adjusted p-value<0.05) after ionizing radiation (IR) with 1000Gy γ-rays vs untreated in three species (H. exemplaris, A. antarcticus, P. fairbanksi) and Bleomycin treatment for 4 or 5days in H. exemplaris and A. antarcticus.
A heatmap of the 50 putative orthologous upregulated genes common to all conditions is given in Figure 4—figure supplement 5.
| γ-irradiation vs control | H. exemplaris | A. antarcticus | P. fairbanksi | Bleomycin vs control | H. exemplaris | A. antarcticus |
|---|---|---|---|---|---|---|
| Total number of DEG | 6209 | 3708 | 7515 | Total number of DEG | 5116 | 1458 |
| DEG up | 3178 | 1875 | 3687 | DEG up | 2284 | 399 |
| DEG down | 3031 | 1833 | 3828 | DEG down | 1113 | 1059 |
Additional files
-
Supplementary file 1
Manual annotation of TDR1 gene correcting the H. exemplaris reference genome annotation.
(a) Alignment of H. exemplaris genome assembly GCA_002082055.1 with cDNA sequence of He-TDR1 obtained from Oxford Nanopore Technology (ONT) long read sequencing and cDNA cloning showed that a portion of TDR1 sequence is missing in the current assembly. (b) Alignment of PacBio reads used for genome assembly with H. exemplaris genome assembly GCA_002082055.1 and He-TDR1 cDNA. A zoom on the missing sequence (boxed in orange) shows the poor quality of PacBio reads used for genome assembly at this locus, likely explaining the absence of the missing He-TDR1 cDNA sequence in the current genome assembly. PacBio reads (SRX2495681, Yoshida et al., 2017) were downloaded from NCBI, mapped with minimap2 (Li, 2018) and alignment visualization was performed with Geneious Prime (v2023.1). Blue and red dots respectively indicate mismatches and indels in the alignment. cDNA sequence of He-TDR1 is provided in Supplementary file 2 and encodes for a 146 amino acid long protein.
- https://cdn.elifesciences.org/articles/92621/elife-92621-supp1-v1.pdf
-
Supplementary file 2
Sequences of plasmids and proteins of this study.
- https://cdn.elifesciences.org/articles/92621/elife-92621-supp2-v1.xlsx
-
Supplementary file 3
BLAST and HMMER hit tables for He-TDR1 homologs.
- https://cdn.elifesciences.org/articles/92621/elife-92621-supp3-v1.xlsx
-
Supplementary file 4
List of tardigrade-specific proteins differentially expressed in all three conditions analyzed by mass spectrometry-based quantitative proteomics (4hr after irradiation, 24hr after irradiation and after Bleomycin treatment).
Tardigrade-specific proteins are ranked according to the Log2 Fold Change (from highest to lowest) at 4hr post-irradiation.
- https://cdn.elifesciences.org/articles/92621/elife-92621-supp4-v1.xlsx
-
Supplementary file 5
Genes of major DNA repair pathways of DNA damages caused by ionizing radiation (IR) are upregulated in all three species studies.
(a) g:Profiler analysis of differentially expressed genes in A. antarcticus after IR. (b) g:Profiler analysis of differentially expressed genes in P. fairbanksi after IR. (c) Schematic representation of DNA repair genes up- or downregulated in H. exemplaris after IR. Genes in green colored boxes are upregulated with adjusted p-value<0.05. Genes in red colored boxes are downregulated with adjusted p-value<0.05. Genes with no homolog identified in H. exemplaris genome are checked with a black cross. (d) Table of DNA repair genes up- or downregulated in H. exemplaris, A. antarcticus, or P. fairbanksi after IR, classified based on the KEGG database. Note that the alternative end joining pathway, also called the micro-homology-mediated end joining (MMEJ) pathway is not currently included in the KEGG database. In the KEGG database, the POLQ gene is included in the BER pathway only. Only genes showing differential gene expression with adjusted p-value<0.05 are shown.
- https://cdn.elifesciences.org/articles/92621/elife-92621-supp5-v1.pdf
-
Supplementary file 6
Phylogenomics of tardigrade-specific genes involved in resistance to desiccation and DNA damages.
Green and white boxes indicate presence and absence, respectively, of the indicated gene or gene family as found in Arakawa, 2022, and in this work for TDR1. Light green indicates presence of potential Rv-Dsup ortholog with hypothetical function in radio-resistance (Arakawa, 2022). The figure in Supplementary file 6 is adapted from Figure 3 of Arakawa, 2022, and augmented with additional information from this work. A TDR1 homolog could not be identified by BLAST analysis of R. varieornatus genome and available transcriptomics data. Sequence similarity of a potential TDR1 protein in R. varieornatus may be too low and indicate alternative mechanisms of radio-resistance in R. varieornatus, e.g., based on stronger activity of the Rv-Dsup compared to He- and Aa-Dsup. Investigation in additional species may help to clarify the presence/absence of TDR1 in the Ramazzottius genus.
- https://cdn.elifesciences.org/articles/92621/elife-92621-supp6-v1.pdf
-
Supplementary file 7
Identification of P. fairbanksi tardigrades isolated and reared from moss garden.
(a) Scanning electron microscope (SEM) of adult specimen with magnification of mouth and claws. (b) SEM of egg with magnification of characteristic spikes decorating the egg surface. Bright-field morphological analysis performed in parallel by one of the co-authors (R Guidetti) confirmed P. fairbanksi identification. Species identification was further confirmed by 28S, 18S, COX1, ITS2 sequencing (see next page). For further information on P. fairbanksi, see Kayastha et al., 2023.
- https://cdn.elifesciences.org/articles/92621/elife-92621-supp7-v1.docx
-
Supplementary file 8
Mapping of RNA sequencing reads statistics.
- https://cdn.elifesciences.org/articles/92621/elife-92621-supp8-v1.xlsx
-
MDAR checklist
- https://cdn.elifesciences.org/articles/92621/elife-92621-mdarchecklist1-v1.docx
Download links
A two-part list of links to download the article, or parts of the article, in various formats.
Downloads (link to download the article as PDF)
Open citations (links to open the citations from this article in various online reference manager services)
Cite this article (links to download the citations from this article in formats compatible with various reference manager tools)
Comparative transcriptomics reveal a novel tardigrade-specific DNA-binding protein induced in response to ionizing radiation
eLife 13:RP92621.
https://doi.org/10.7554/eLife.92621.3


