Distinct transcriptomic profile of satellite cells contributes to preservation of neuromuscular junctions in extraocular muscles of ALS mice
- Department of Kinesiology, College of Nursing and Health Innovation, The University of Texas at Arlington, United States
- Department of Neurology, Lewis Katz School of Medicine at Temple University, United States
- Department of Surgery, Division of Surgical Sciences, University of Virginia, United States
Figures
Figure 1 with 2 supplements
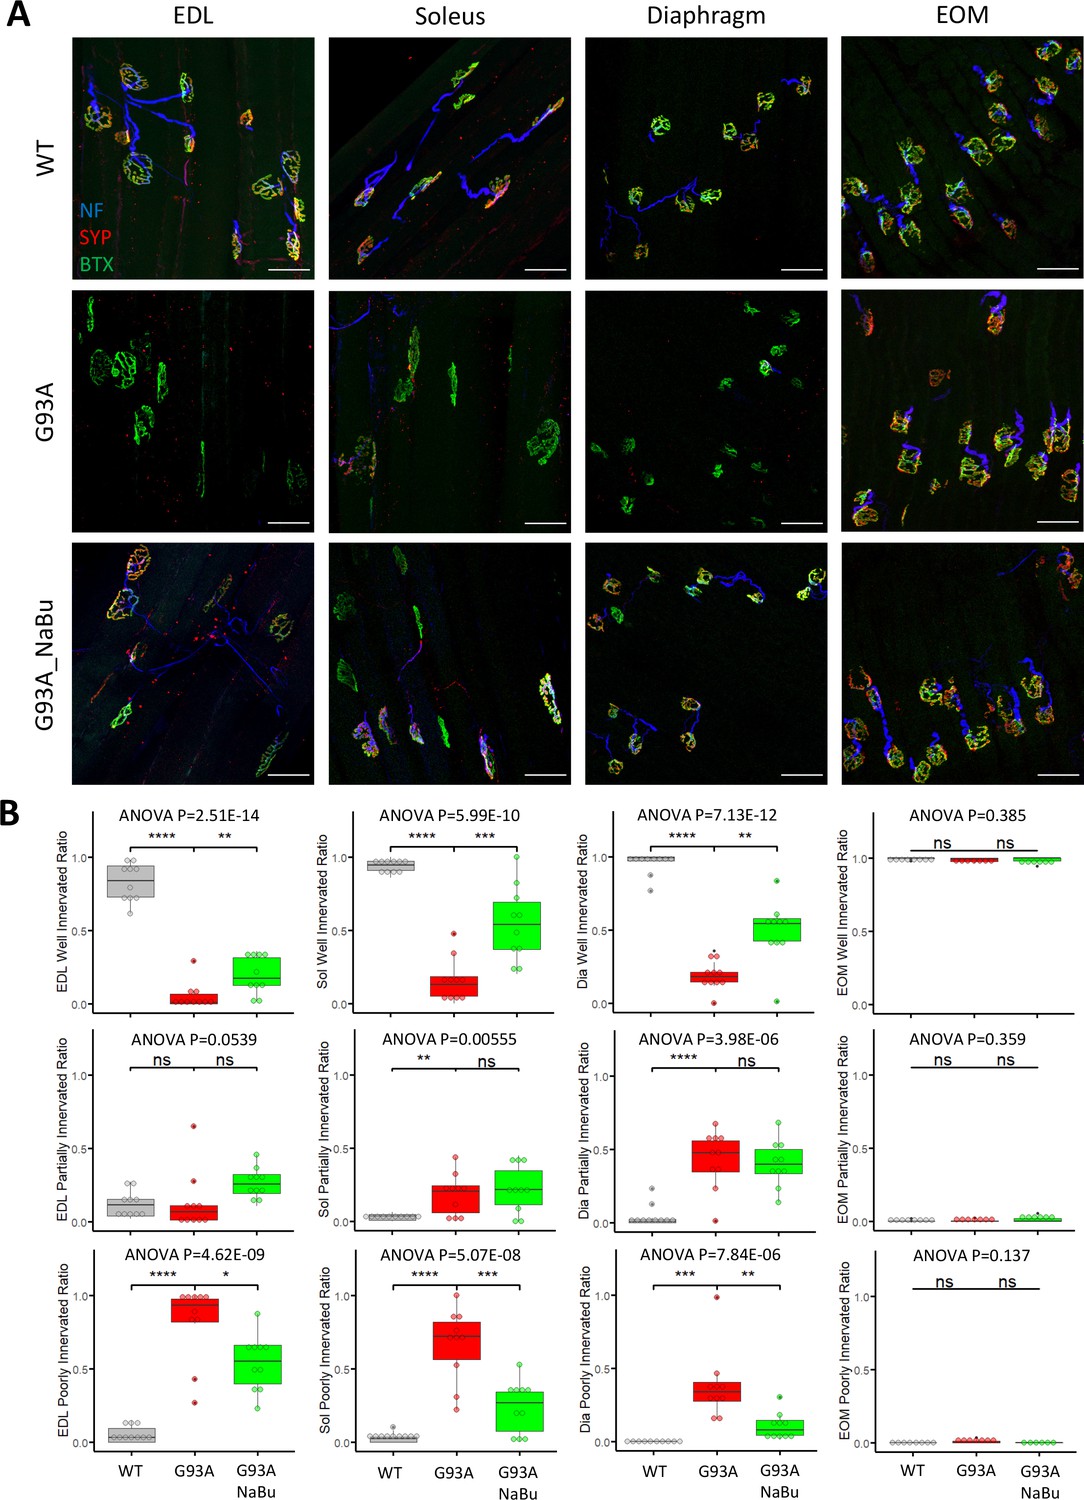
Characterizing NMJ integrity in muscles dissected from wild-type controls and end- stage G93A mice with or without NaBu feeding.
(A) Representative compacted z-stack scan images of whole-mount EDL, soleus diaphragm extraocular muscles stained with antibodies against neurofilament medium chain (NF, labeling axons), synaptophysin (SYP, labeling axon terminals) and Alexa Fluor 488 conjugated α-Bungarotoxin (BTX, labeling AChRs on muscle membrane). scale bars, 50 μm. (B) Mean ratios of well innervated NMJs (SYP signals are present in >60% of BTX-positive area), partially innervated NMJs (SYP signals are present in 30–60% of BTX positive area) and poorly innervated NMJs (SYP signals are present in <30% of BTX-positive area) and in different types of muscles dissected from WT controls and end-stage G93A mice with or without NaBu feeding (see Figure 1—figure supplement 1, Figure 1—figure supplement 2 and Figure 1—source data 1 for NMJs measured per muscle type per gender. Briefly, EDL, soleus and diaphragm muscles were from four male and six female mice per group; WT EOM group was from four male and four female mice; G93A EOM group was from three male and four female mice; G93A EOM with NaBu feeding group was from six female mice). Each dot in the box-and-dot plots represents quantification result from a single mouse. * p<0.05; ** p<0.01; **** p<0.0001; ns, not significant (t-test). ANOVA p values are also shown.
-
Figure 1—source data 1
Quantification results of the three types of NMJs in muscles of different origins and treatment conditions.
- https://cdn.elifesciences.org/articles/92644/elife-92644-fig1-data1-v1.docx
-
Figure 1—source data 2
qRT-PCR results for Scn5a relative expression in whole muscles of different origins and treatment conditions.
The calculation of ddCt used the averaged dCt value of Scn5a of EDL muscles derived from WT mice as the normalization control.
- https://cdn.elifesciences.org/articles/92644/elife-92644-fig1-data2-v1.docx
Figure 1—figure supplement 1
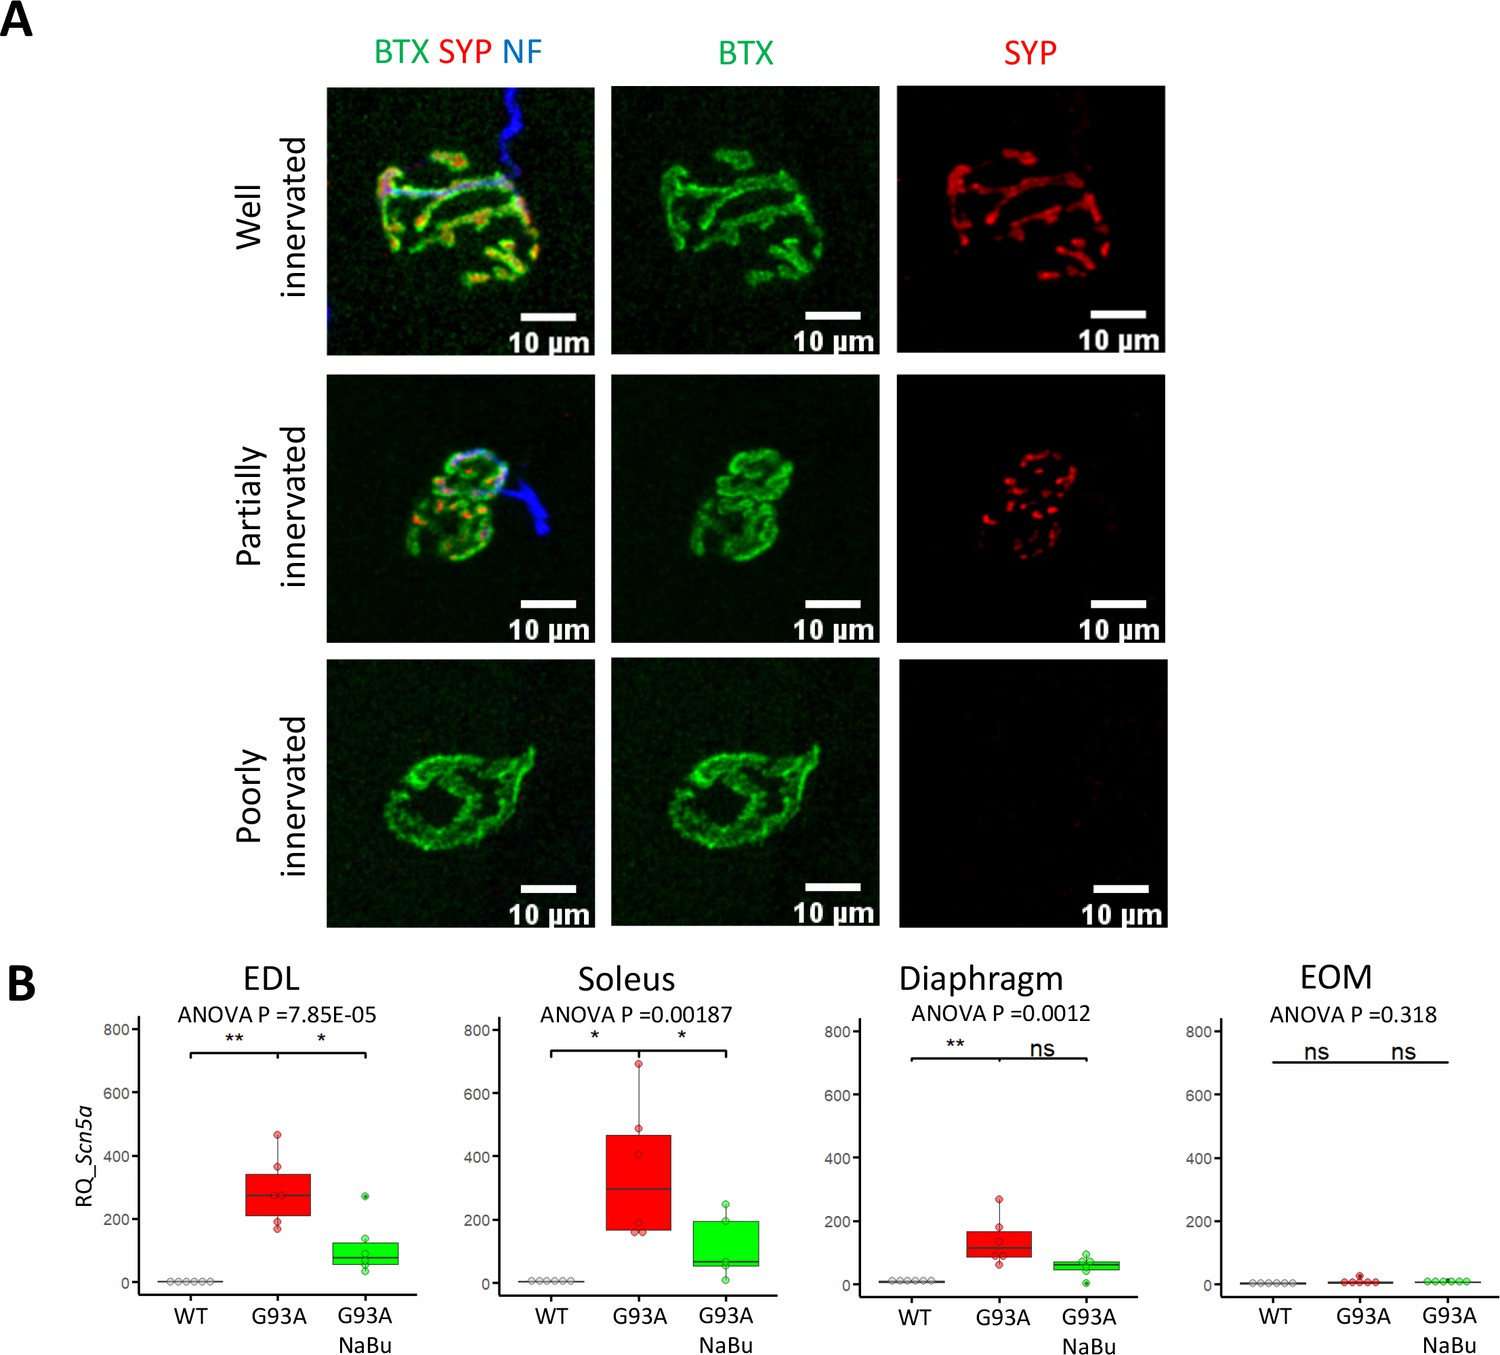
Representative images of the three types of NMJs and qRT-PCR results of Scn5a expression in whole muscles.
(A) Representative images of well-innervated, partially innervated and poorly innervated NMJs in WT diaphragm muscles. BTX: Alexa Fluor 488 conjugated α-Bungarotoxin; SYP: synaptophysin; NF: neurofilament medium chain. (B) qRT-PCR based relative quantification (RQ, fold of change against WT muscles) of Scn5a expression using RNAs extracted from whole muscles of EDL, soleus, diaphragm and EOM. Each dot in the box-and-dot plots represent result from one mouse. Please also see Figure 1—source data 2. Briefly, muscles in WT and G93A groups were from three male and three female mice per group; G93A EDL with NaBu feeding group were from three male and three female mice. G93A soleus with NaBu feeding group were from two male and three female mice; G93A diaphragm with NaBu feeding group were from two male and four female mice; G93A EOM with NaBu feeding group were from four male and two female mice. * p<0.05; ** p<0.01; ns, not significant (t-test). ANOVA p values are also shown.
Figure 1—figure supplement 2
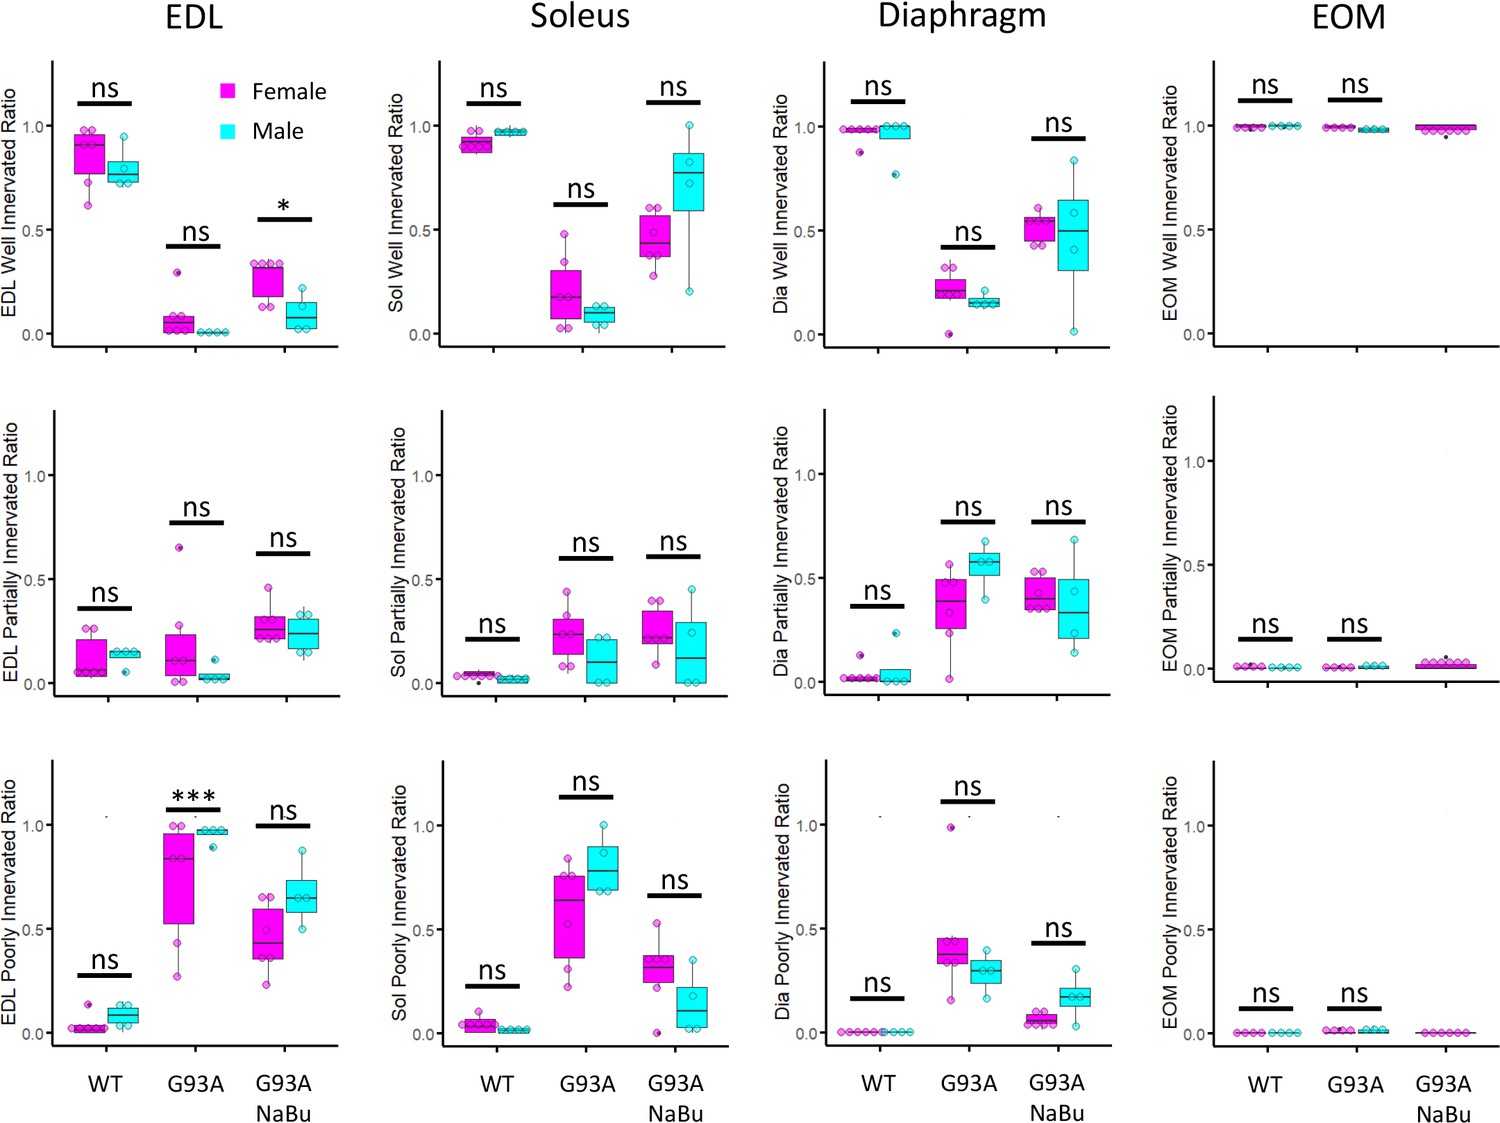
Cross-gender comparison of NMJ integrity in muscles dissected from wild-type controls and end-stage G93A mice with or without NaBu feeding.
Mean ratios of well innervated, partially innervated and poorly innervated NMJs shown in Figure 1B separated by gender of the mice. Samples from male mice are colored in cyan and samples from female mice are colored in magenta. * p<0.05; *** p<0.001; ns, not significant (t-test).
Figure 2
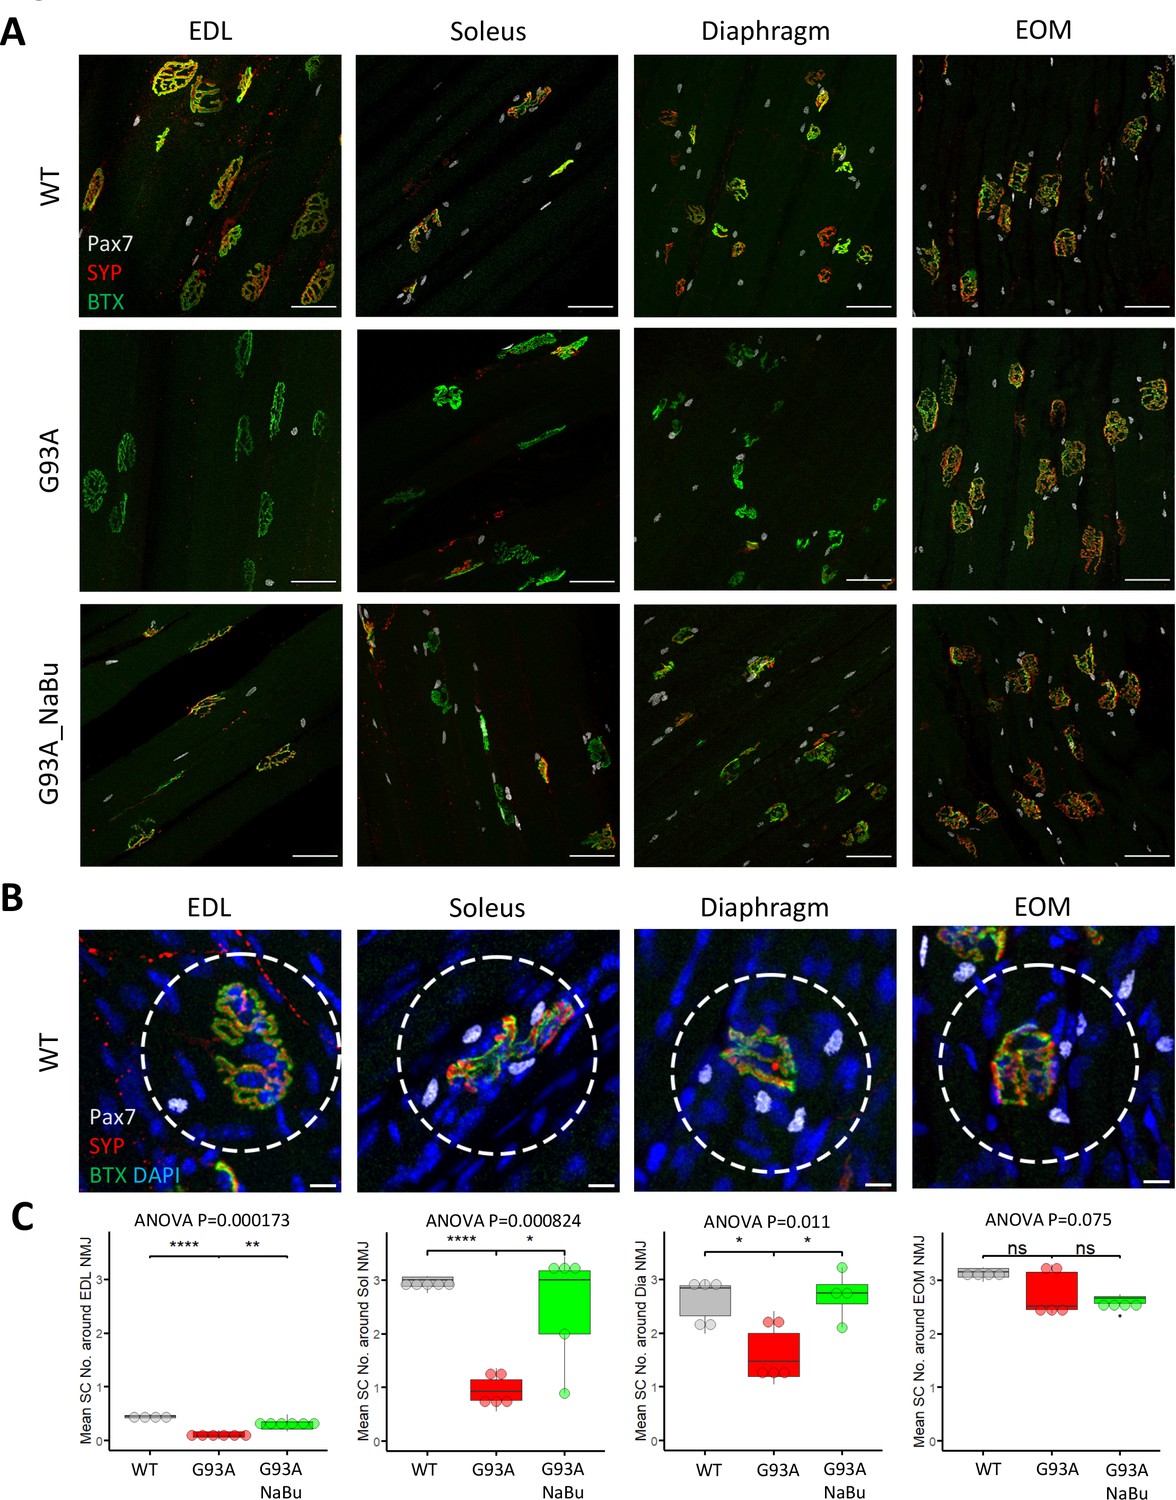
Quantification of peri-NMJ SC abundance in muscles dissected from wild-type controls and end-stage G93A mice with or without NaBu feeding.
(A) Representative compacted z-stack scan images of whole-mount EDL, soleus diaphragm extraocular muscles stained with antibodies against Pax7 (labeling SCs), SYP and BTX-Alexa Fluor 488. Scale bars, 50 μm. (B) To measure the abundance of SCs around NMJs, circles of 75 μm diameter were drawn around the NMJs and the number of nuclear Pax7+ cells (co-localized with DAPI) were counted. Scale bars, 10 μm. (C) Mean number of SCs around NMJs in different types of muscles dissected from WT controls and end-stage G93A mice with or without NaBu feeding (see Figure 2—source data 1 for NMJs measured per muscle type per gender. Briefly, WT EDL group was from two male and two female mice; G93A EDL group was from three male and three female mice; G93A EDL with NaBu feeding group was from two male and four female mice; WT soleus group was from two male and three female mice; G93A soleus group was from three male and two female mice; G93A soleus with NaBu feeding group was from one male and four female mice; WT diaphragm group was from one male and four female mice; G93A diaphragm group was from one male and four female mice; G93A diaphragm with NaBu feeding group was from four female mice; WT EOM group was from one male and three female mice; G93A EOM group was from five female mice; G93A EOM with NaBu feeding group was from one male and three female mice). Each dot in the box-and-dot plots represents quantification result from a single mouse. * p<0.05; ** p<0.01; **** p<0.0001; ns, not significant (t-test). ANOVA p values are also shown.
-
Figure 2—source data 1
Quantification results of averaged peri-NMJ SC numbers in muscles of different origins and treatment conditions.
- https://cdn.elifesciences.org/articles/92644/elife-92644-fig2-data1-v1.docx
Figure 3 with 2 supplements
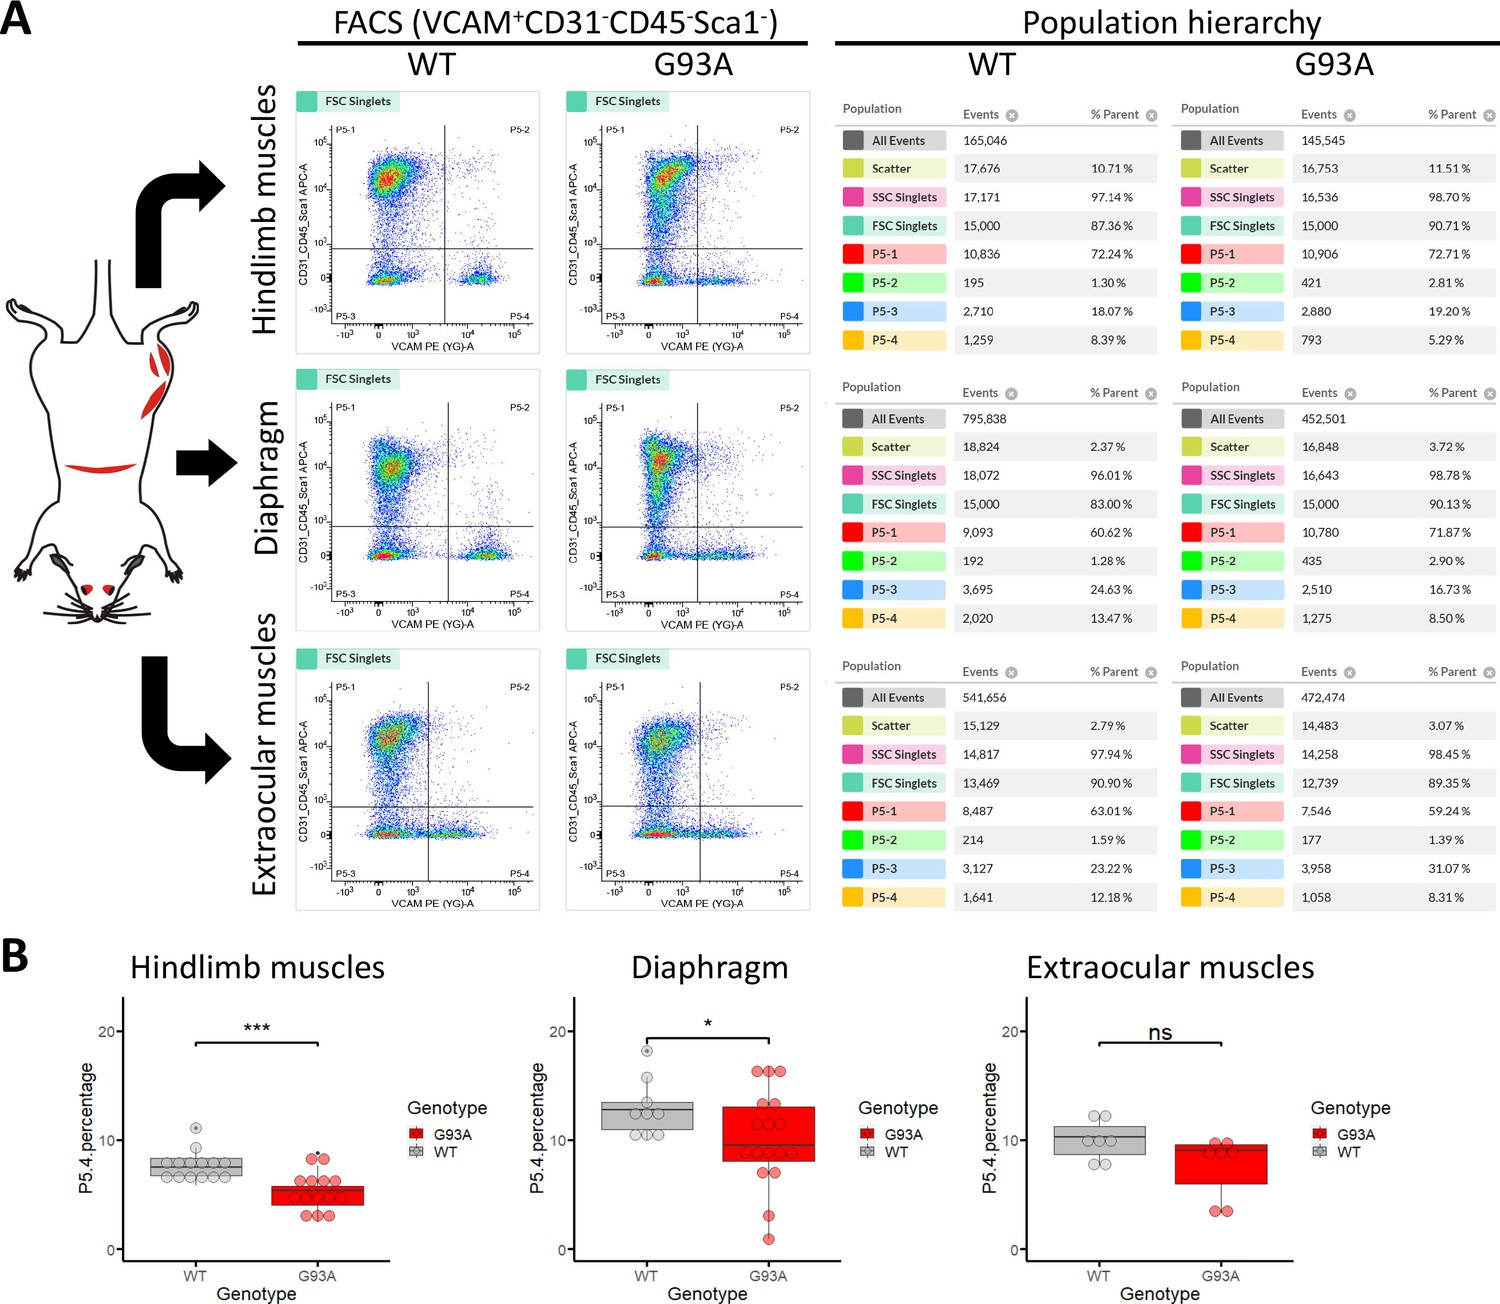
Isolation of SCs from wildtype and G93A muscles using fluorescence activated cell sorting.
(A) Representative FACS profiles during the isolation of Vcam1+CD31-CD45-Sca1- cells (gate P5-4). The corresponding population hierarchies are shown right to the plots. For single antibody staining controls, unstained controls and viability test, see Figure 3—figure supplement 1 and Figure 3—figure supplement 2. (B) Comparing the percentage of events in the P5-4 gate between cells isolated from WT and G93A mice. Each dot in the box-and-dot plots represents result from one round of sorting. WT HL SCs were from eight male and six female mice; G93A HL SCs were from nine male and five female mice; WT diaphragm SCs were from six male and three female mice; G93A diaphragm SCs were from 12 male and 5 female mice. WT EOM SCs were from six batches of male and one batch of female mice (each batch contains five to six mice of the same gender). G93A EOM SCs were from five batches of male and two batches of female mice. * p<0.05; *** p<0.001; ns: not significant (t-test).
-
Figure 3—source data 1
Percentage of P5-4 events recorded in different rounds of sorting.
- https://cdn.elifesciences.org/articles/92644/elife-92644-fig3-data1-v1.docx
Figure 3—figure supplement 1
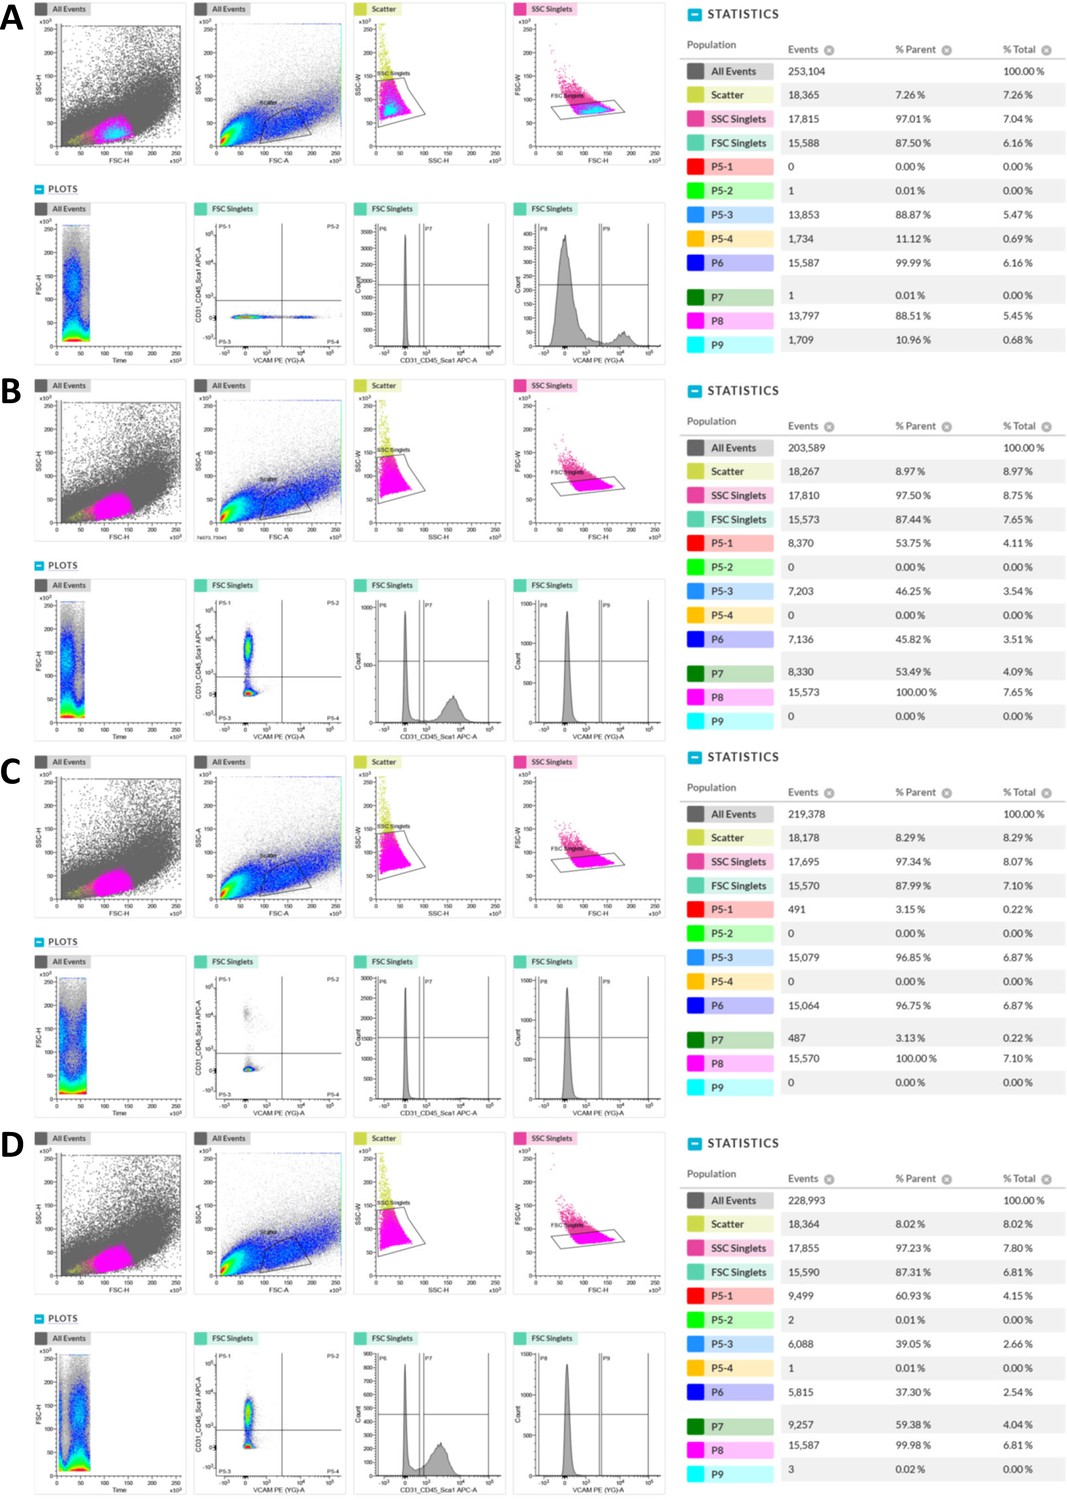
Representative FACS profiles of single antibody staining controls.
(A) FACS profile of cells isolated from WT HL muscles and stained only with PE conjugated anti-mouse Vcam1 antibody at 600 ng/106 cells. FSC-H/SSC-H, FSC-A/SSC-A, SSC-H/SSC-W, FSC-H/FSC-W, Time/FSC-H, Vcam1/CD31_CD45_Sca-1 plots, CD31_CD45_Sca-1 count histogram and Vcam1 count histogram are shown on the left. Population hierarchies were shown on the right. (B) FACS profile of cells stained only with APC conjugated anti-mouse CD31 antibody at 400 ng/106 cells. (C) FACS profile of cells stained only with APC conjugated anti-mouse CD45 antibody at 400 ng/106 cells. (D) FACS profile of cells stained only with APC conjugated anti-mouse Sca-1 antibody at 200 ng/106 cells.
Figure 3—figure supplement 2
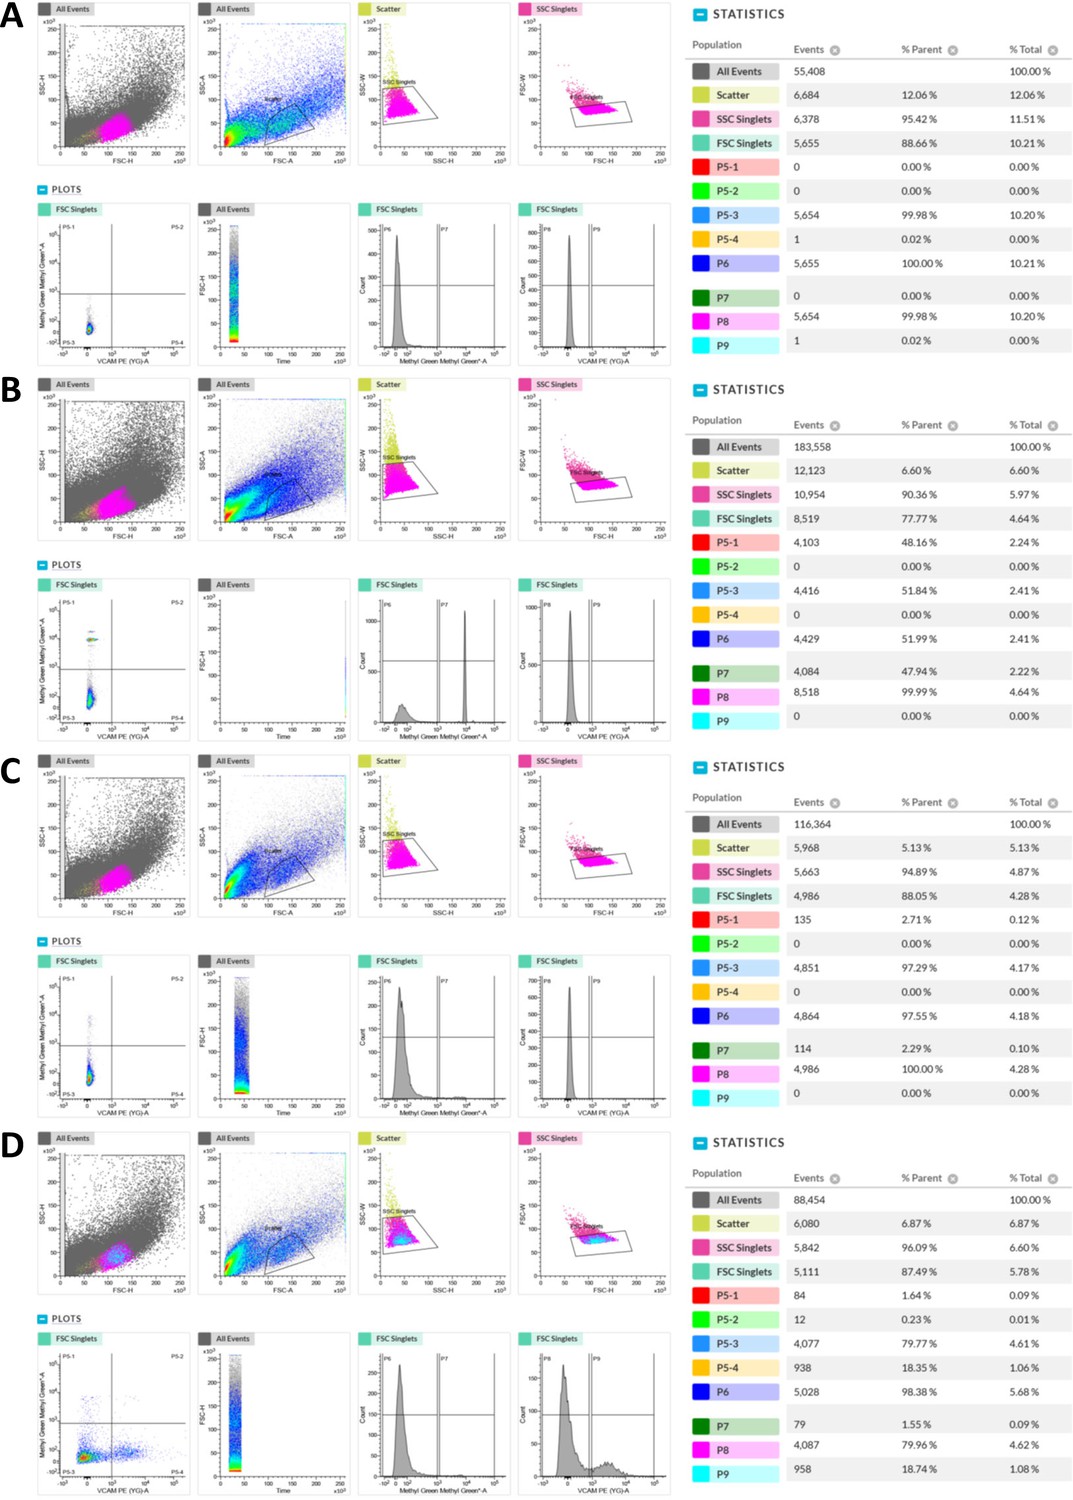
Viability assessment of cells for sorting using methyl green.
(A) FACS profile of unstained cells isolated from WT HL muscles. FSC-H/SSC-H, FSC-A/SSC-A, SSC-H/SSC-W, FSC-H/FSC-W, Vcam1/Methyl green, Time/FSC-H plots, Methyl green count histogram and Vcam1 count histogram are shown on the left. Population hierarchies were shown on the right. (B) FACS profile of methyl green stained cells with 50% dead cells (through methanol dehydration) spiked in. (C) FACS profile of methyl green stained cells without any spiked-in dead cells. (D) FACS profile of methyl green and Vcam1 double-stained cells (no dead cells spiked in).
Figure 4 with 2 supplements
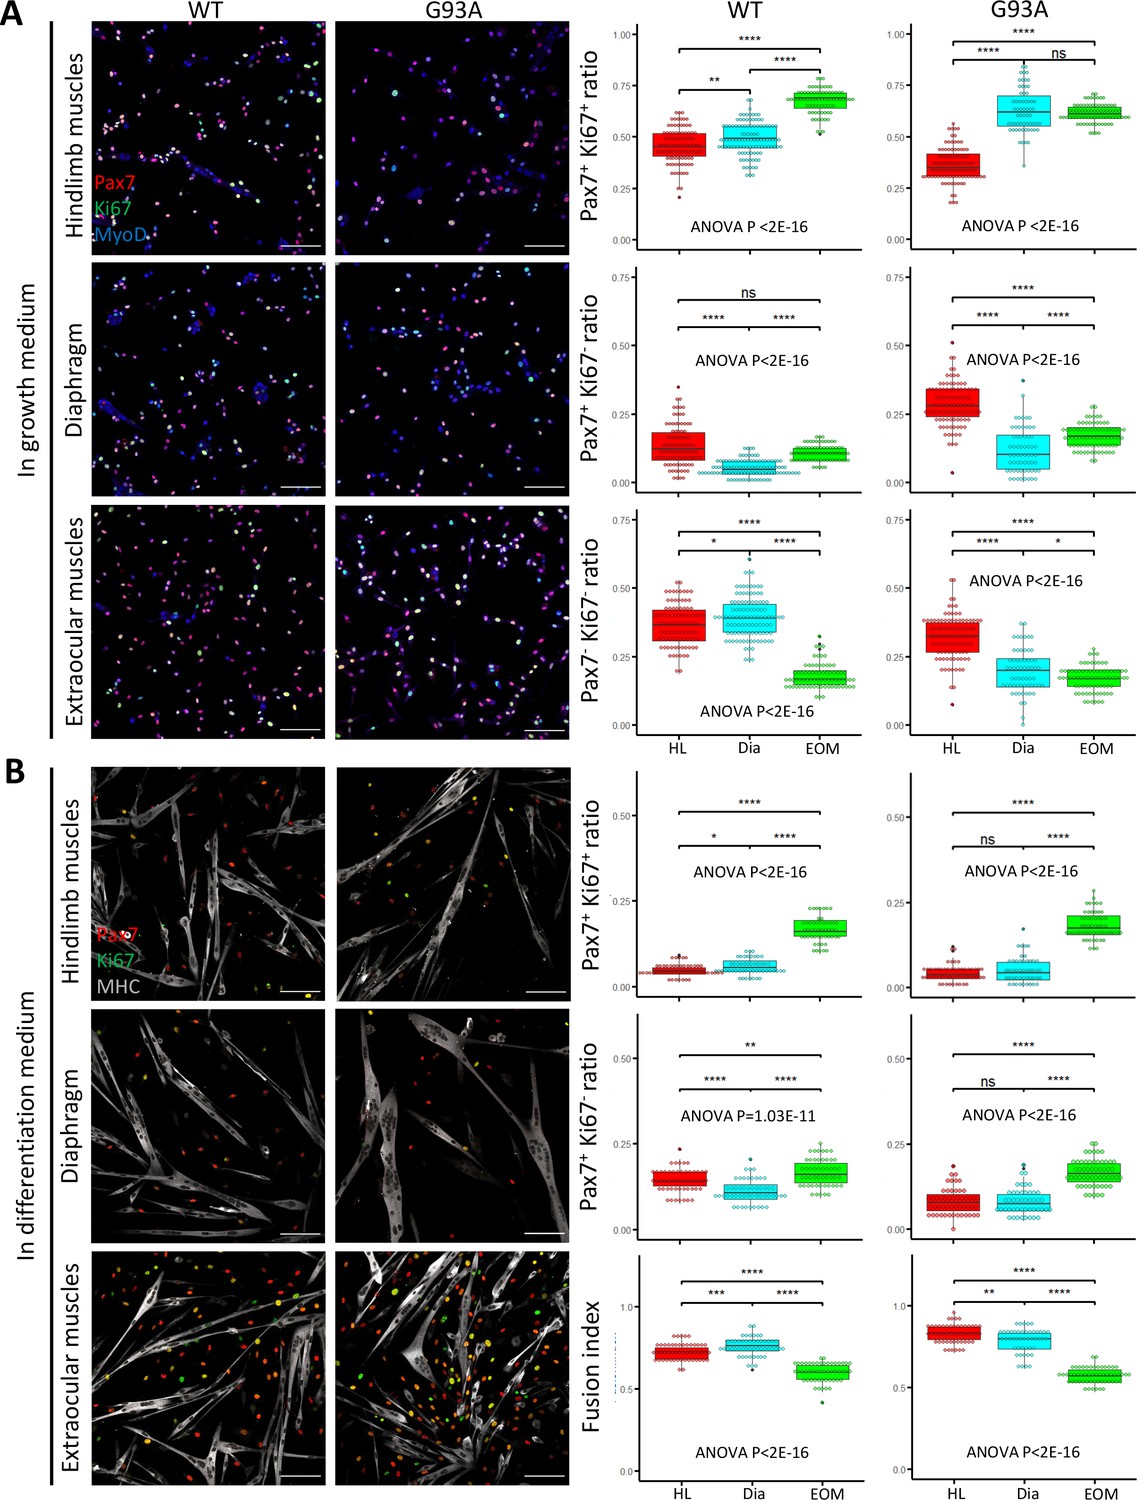
Proliferation and differentiation properties of FACS-isolated SCs in culture.
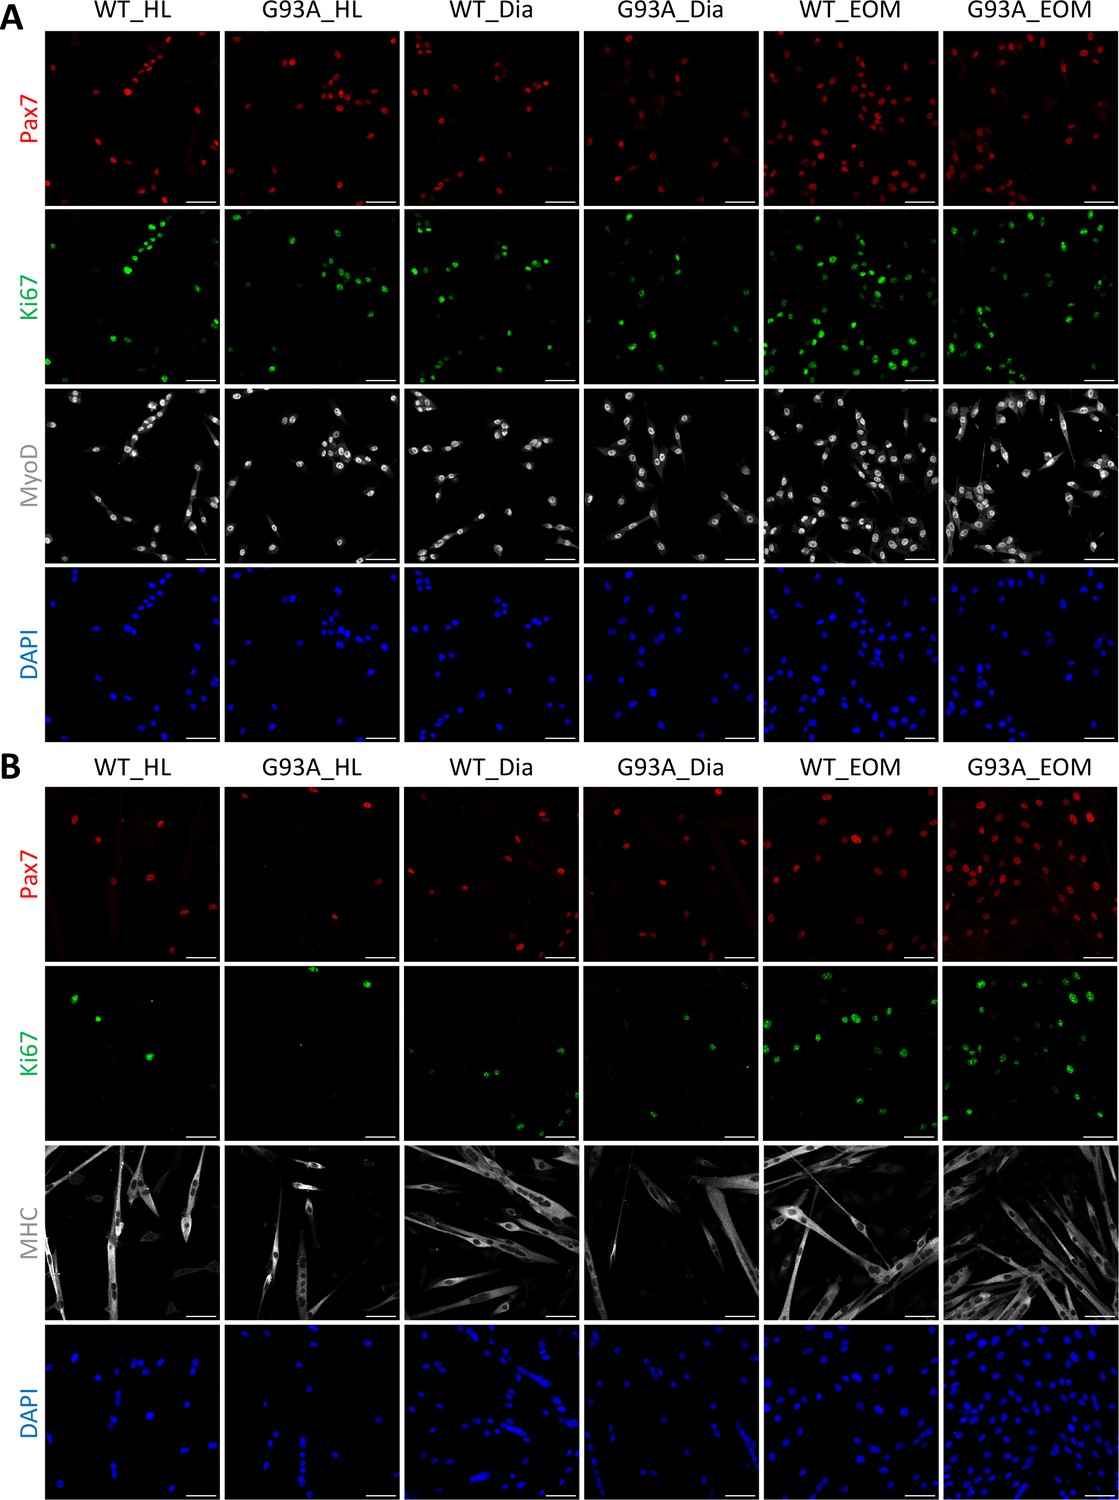
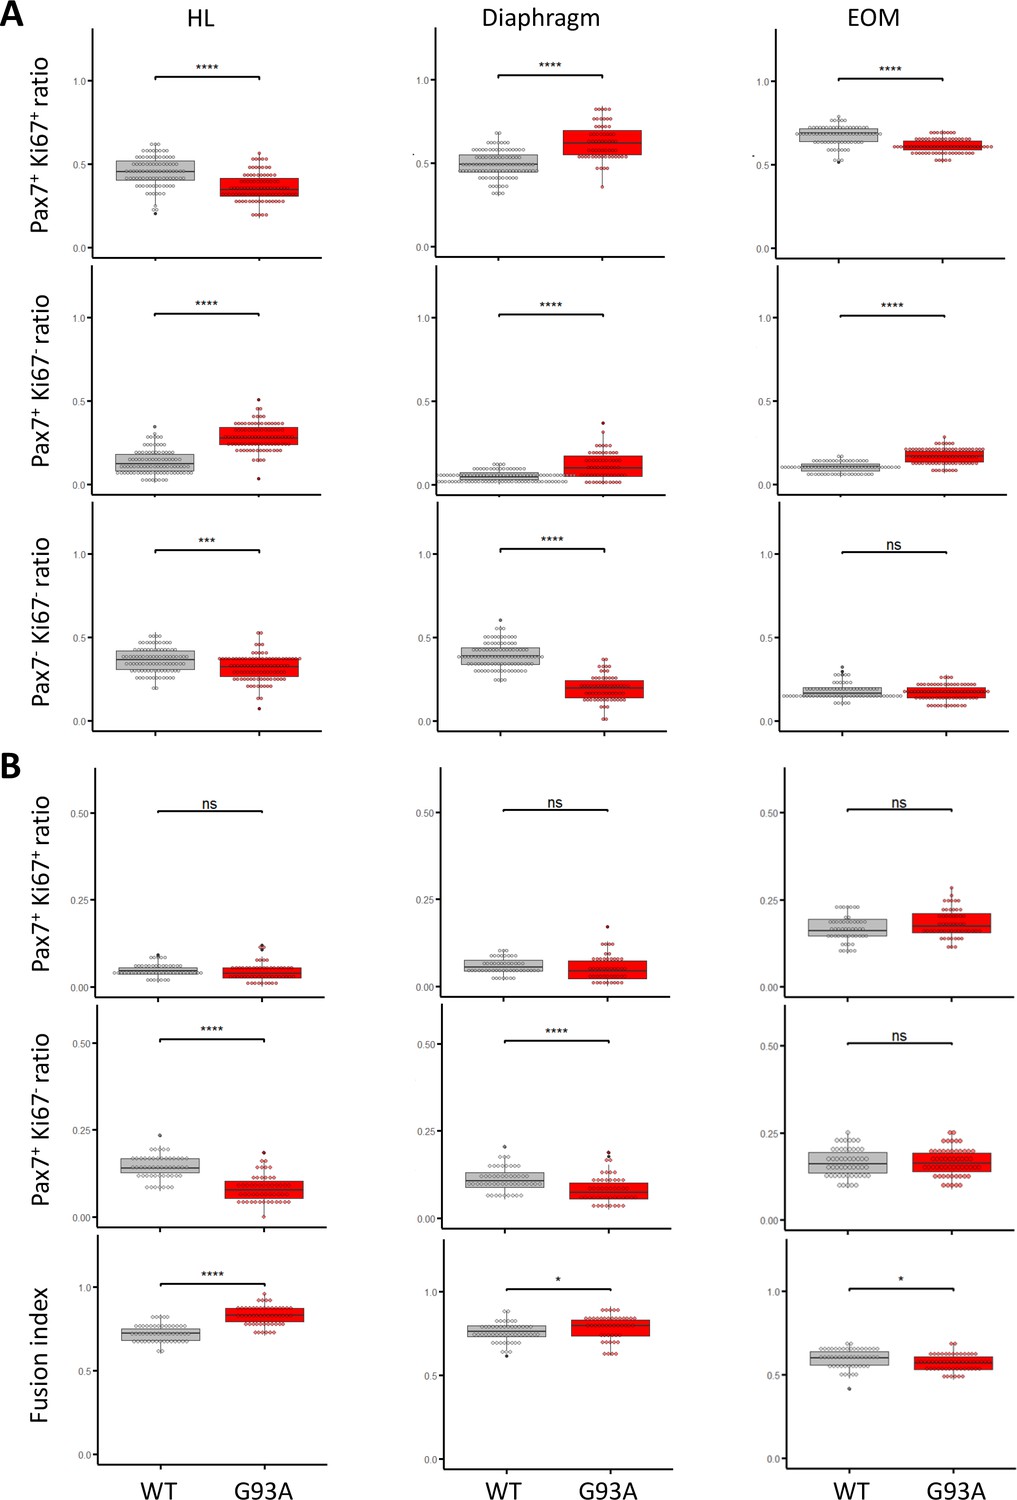
(A) Representative images of FACS-isolated SCs cultured for 4 days in growth medium stained with antibodies against Pax7, Ki67 (proliferating cell marker), MyoD (myogenic lineage marker). Measurement results for the ratios of Pax7+Ki67+, Pax7+Ki67-, and Pax7-Ki67- cells are shown in the right two panels. Scale bars, 100 μm. Each dot in the box-and-dot plots represents one image analyzed. For WT HL SCs, 94 images from 3 rounds of sorting; For WT Dia SCs, 107 images from 3 rounds of sorting; For WT EOM SCs, 75 images from 3 rounds of sorting; For G93A HL SCs, 96 images from 3 rounds of sorting; For G93A Dia SCs, 62 images from 3 rounds of sorting; For G93A EOM SCs, 79 images from 3 rounds of sorting. For the 3 rounds of sorting, 1 was from male and 2 were from female mice. * p<0.05; ** p<0.01; **** p<0.0001; ns, not significant (t-test). ANOVA p values are also shown. (B) Representative images of FACS-isolated SCs cultured for 4 days in growth medium and 2 days in differentiation medium stained with antibodies against Pax7, Ki67, myosin heavy chain (MHC, differentiated myotube marker). Measurement results for the ratios of Pax7+Ki67+ and Pax7+Ki67- cells, as well as the fusion indices are shown in the right two panels. Each dot in the box-and-dot plots represents one image analyzed. For WT HL SCs, 52 images from 3 rounds of sorting; For WT Dia SCs, 51 images from 3 rounds of sorting; For WT EOM SCs, 51 images from 3 rounds of sorting; For G93A HL SCs, 52 images from 3 rounds of sorting; For G93A Dia SCs, 47 images from 3 rounds of sorting; For G93A EOM SCs, 56 images from 3 rounds of sorting. For the 3 rounds of sorting, 1 was from male and 2 were from female mice. ANOVA P values are also shown.
Figure 4—figure supplement 1
Enlarged single channel images of SCs cultured in growth and differentiation medium.
(A) Representative images of FACS-isolated SCs cultured for 4 days in growth medium stained with antibodies against Pax7 (red), Ki67 (green), MyoD (grey) and DAPI (blue). (B) Representative images of FACS-isolated SCs cultured for 4 days in growth medium and 2 days in differentiation medium stained with antibodies against Pax7 (red), Ki67 (green), myosin heavy chain (grey), and DAPI (blue). Scale bars, 50 μm.
Figure 4—figure supplement 2
Comparing proliferation and differentiation properties of cultured SCs from WT and G93A muscles.
(A) Comparing the ratios of Pax7+Ki67+, Pax7+Ki67-, and Pax7-Ki67- cells in the SCs cultured in growth medium, respectively. **** p<0.0001; *** p<0.001; ns, not significant. (B) Comparing the ratios of Pax7+Ki67+, Pax7+Ki67- cells and fusion indices of the SCs cultured in differentiation medium, respectively. Each dot in the box-and-dot plots represents one image analyzed. **** p<0.0001; *** p<0.001; * p<0.05; ns, not significant (t-test).
Figure 5
Proliferation and differentiation properties of FACS-isolated SCs with different NaBu treatment conditions.
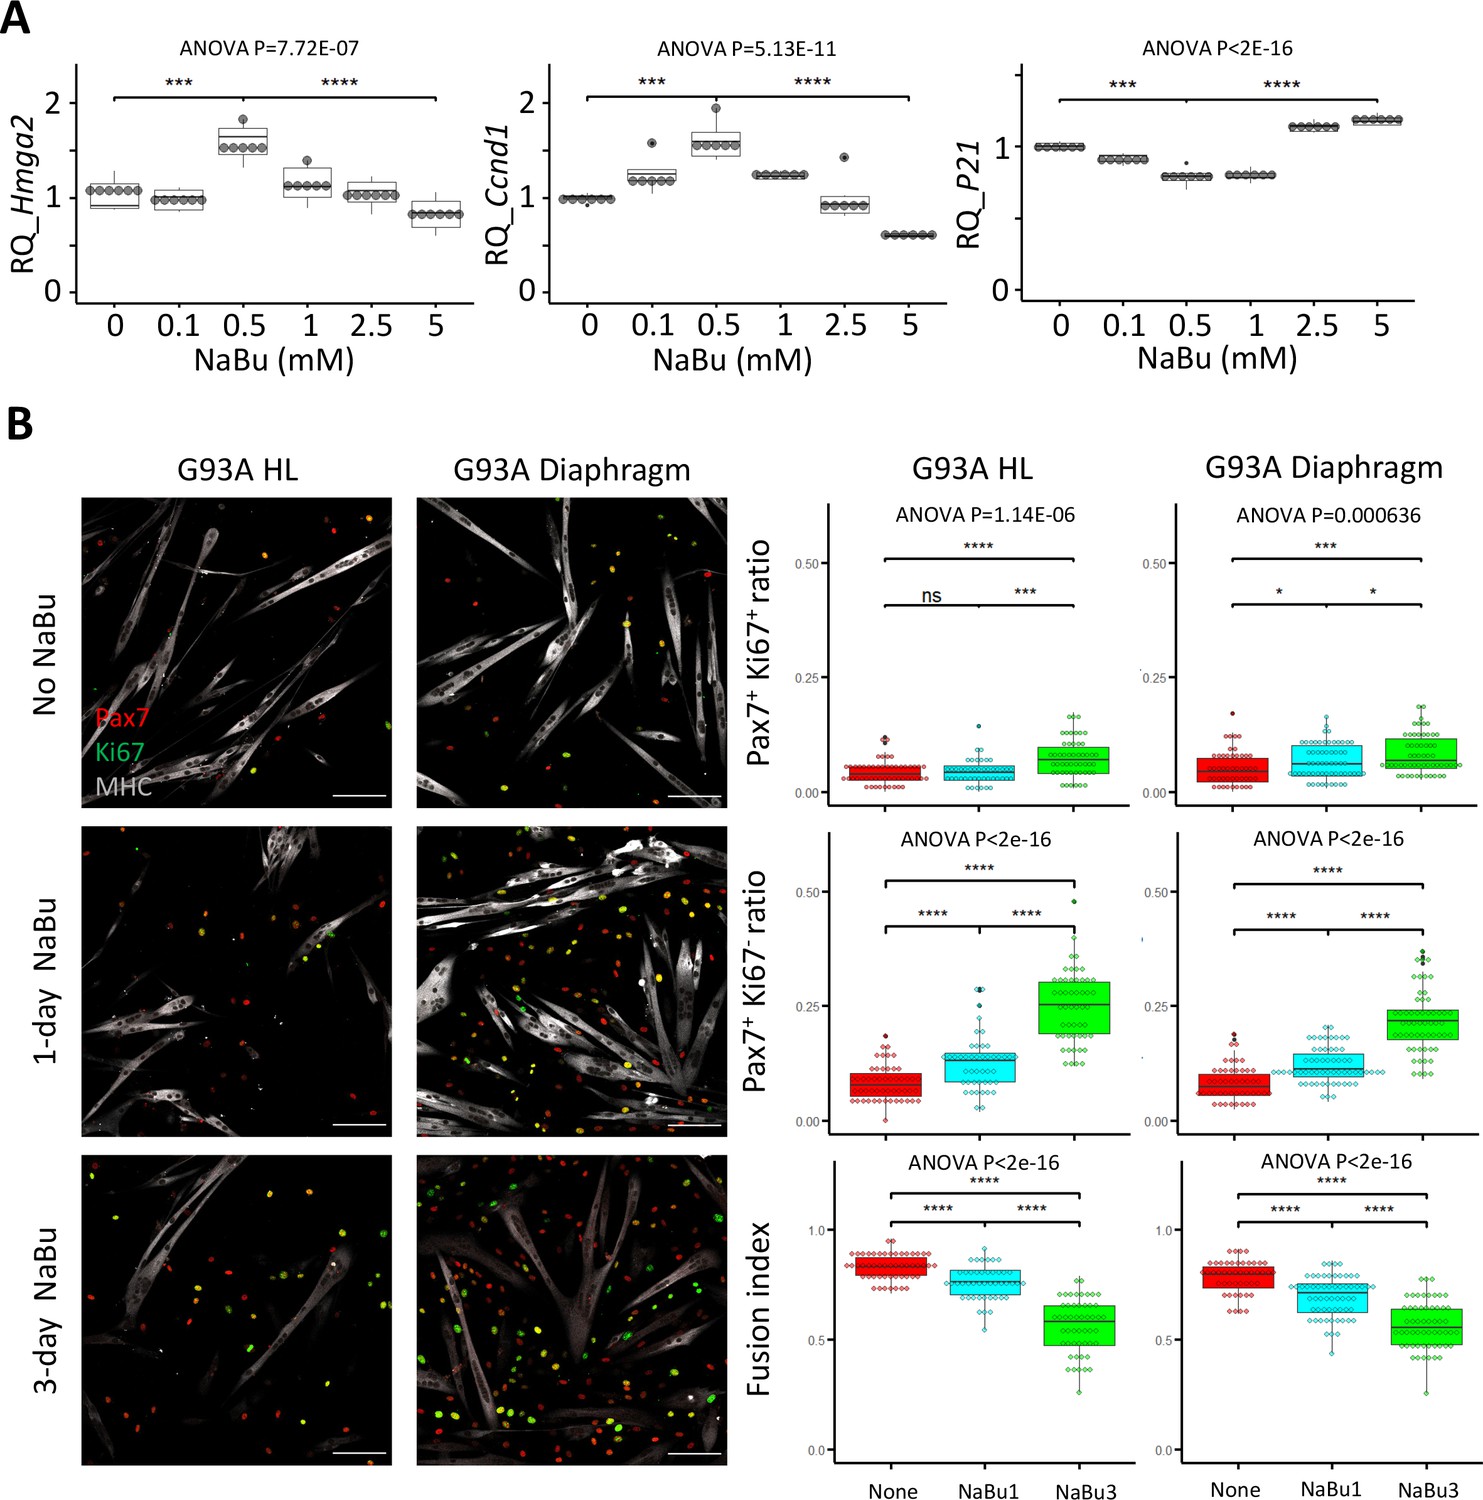
(A) qRT-PCR-based relative quantification of Hmga2, Ccnd1 and P21 expression in FACS-isolated G93A HL SCs cultured with different doses of NaBu in growth medium for 1 day (n=6, each dot in the box-and-dot plots represents one replicate of culture). HL SCs were from male mice. *** p<0.001; **** p<0.0001 (t-test). ANOVA p values are also shown. (B) Left two panels show the representative images of FACS-isolated G93A hindlimb and diaphragm SCs cultured in growth medium for 4 days and differentiation medium for 2 days and experienced different NaBu treatment conditions and stained with Pax7, Ki67, and MHC antibodies. Cells in top row were not treated with NaBu. Cells in the middle row were treated with NaBu for 1 day before the induction of differentiation (Day 4 of culture). Cells in the bottom row were treated with NaBu continuously for 3 days from the day before the induction of differentiation (Day 4–6 of culture). Scale bars, 100 μm. Measurement results for the ratios of Pax7+Ki67+ and Pax7+Ki67- cells, as well as the fusion indices are shown in the right two panels. Each dot in the box-and-dot plots represents one image analyzed. For G93A HL SCs, 52 images from 3 rounds of sorting; 1-day NaBu treatment, 45 images from 3 rounds of sorting; 3-day NaBu treatment, 51 images from 3 rounds of sorting; For G93A Dia SCs, 47 images from 3 rounds of sorting; 1-day NaBu treatment, 60 images from 3 rounds of sorting; 3-day NaBu treatment, 57 images from 3 rounds of sorting. For the 3 rounds of sorting, 2 were from male and 1 was from female mice. * p<0.05; ns, not significant (t-test). ANOVA p values are also shown.
Figure 6 with 1 supplement
Comparing the transcriptomic profile and homeostasis preferences of SCs from different muscle origins cultured in growth and differentiation medium.
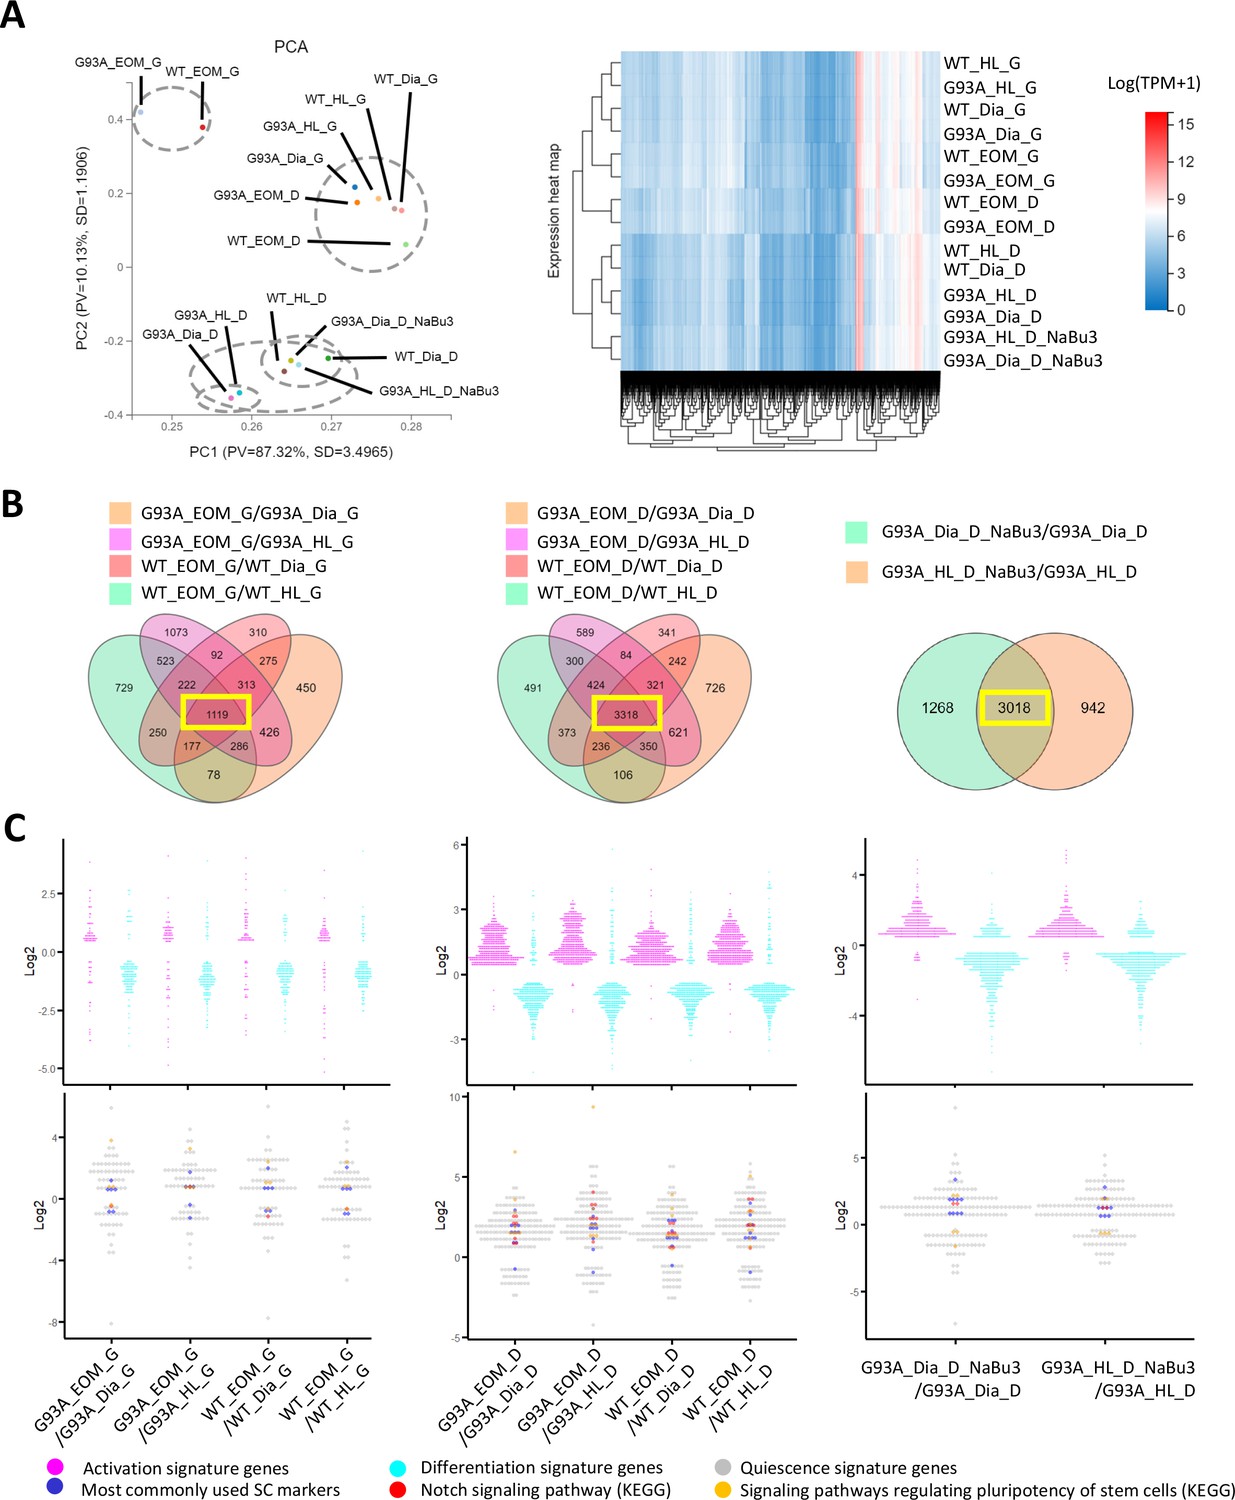
(A) PCA analysis and hierarchical clustering results of different RNA-Seq samples. Samples with suffix ‘G’ were SCs cultured in growth medium for 4 days. Suffix ‘D’ denote SCs cultured in growth medium for 4 days and differentiation medium for 2 days. Suffix ‘NaBu3’ denote SCs treated with 0.5 mM NaBu continuously for 3 days (Day 4–6 of culture). Dashed-line circles in PCA plot highlight samples close to each other in distance. All SC samples shown here were from female mice. (B) We identify genes differentially expressed in EOM SCs compared to their diaphragm and HL counterparts cultured in growth medium (leftmost panel) and differentiation medium (middle panel) by screening for genes shared by the four DEG lists (gold, magenta, pink, and green in color) shown in the Venn diagrams. All DEG lists were generated based on the standard of |log2FC| ≥ 0.4 and FDR ≤ 0.001. Yellow box highlights the shared genes. To identify NaBu treatment signature genes, we screened for genes shared by the two DEG lists (green and gold in color) shown in the rightmost Venn diagram. (C) Dot plots in the upper row show the Log2FC of activation signature genes (magenta) and differentiation signature genes (cyan) identified in the 1119, 3318, and 3018 genes highlighted in yellow boxes in (B). Dot plots in the lower row show the Log2 FC of quiescence signature genes identified in the yellow-box highlighted genes in (B). Additionally, genes belonging to the following subgroups of quiescent signature genes: most commonly used SC markers, Notch signaling components and pluripotency signaling components are colored in dark blue, red, and gold, respectively.
-
Figure 6—source data 1
Top 20 differentially expressed genes comparing EOM SCs to hindlimb and diaphragm counterparts cultured in growth and differentiation medium.
Log2FC and FDR are shown and genes are ranked according to log2FC. Columns 2–5 are genes expressed higher in EOM SCs and Columns 6–9 are genes expressed lower in EOM SCs.
- https://cdn.elifesciences.org/articles/92644/elife-92644-fig6-data1-v1.docx
-
Figure 6—source data 2
Top 20 differentially expressed genes comparing G93A to WT SCs of the same muscle origin cultured in growth and differentiation medium.
Log2FC and FDR are shown and genes are ranked according to log2FC. Columns 2–5 are genes expressed higher in G93A SCs and Columns 6–9 are genes expressed lower in G93A SCs.
- https://cdn.elifesciences.org/articles/92644/elife-92644-fig6-data2-v1.docx
-
Figure 6—source data 3
Top 20 differentially expressed genes comparing G93A hindlimb and diaphragm SCs with or without 3-day NaBu treatment.
Log2FC and FDR are shown and genes are ranked according to log2FC. Columns 2–5 are genes expressed higher in NaBu-treated group and Columns 6–9 are genes expressed lower in NaBu-treated group.
- https://cdn.elifesciences.org/articles/92644/elife-92644-fig6-data3-v1.docx
-
Figure 6—source data 4
Three subgroups of quiescent signature genes identified in the DEG lists comparing EOM SCs to diaphragm and HL counterparts cultured in differentiation medium.
Log2FC and FDR are shown and genes are ranked according to relative abundance (TPM, from highest to lowest) in WT EOM SCs.
- https://cdn.elifesciences.org/articles/92644/elife-92644-fig6-data4-v1.docx
-
Figure 6—source data 5
Three subgroups of quiescent signature genes identified in the DEG lists comparing EOM SCs to diaphragm and HL counterparts cultured in growth medium.
Log2FC and FDR are shown and genes are ranked according to relative abundance (TPM, from highest to lowest) in WT EOM SCs.
- https://cdn.elifesciences.org/articles/92644/elife-92644-fig6-data5-v1.docx
-
Figure 6—source data 6
Three subgroups of quiescent signature genes identified in the DEG lists comparing G93A diaphragm and HL SCs with and without 3-day NaBu treatment.
Log2FC and FDR are shown and genes are ranked according to relative abundance (TPM, from highest to lowest) in G93A HL SCs.
- https://cdn.elifesciences.org/articles/92644/elife-92644-fig6-data6-v1.docx
Figure 6—figure supplement 1
Compiling the activation signature gene and differentiation signature gene lists.
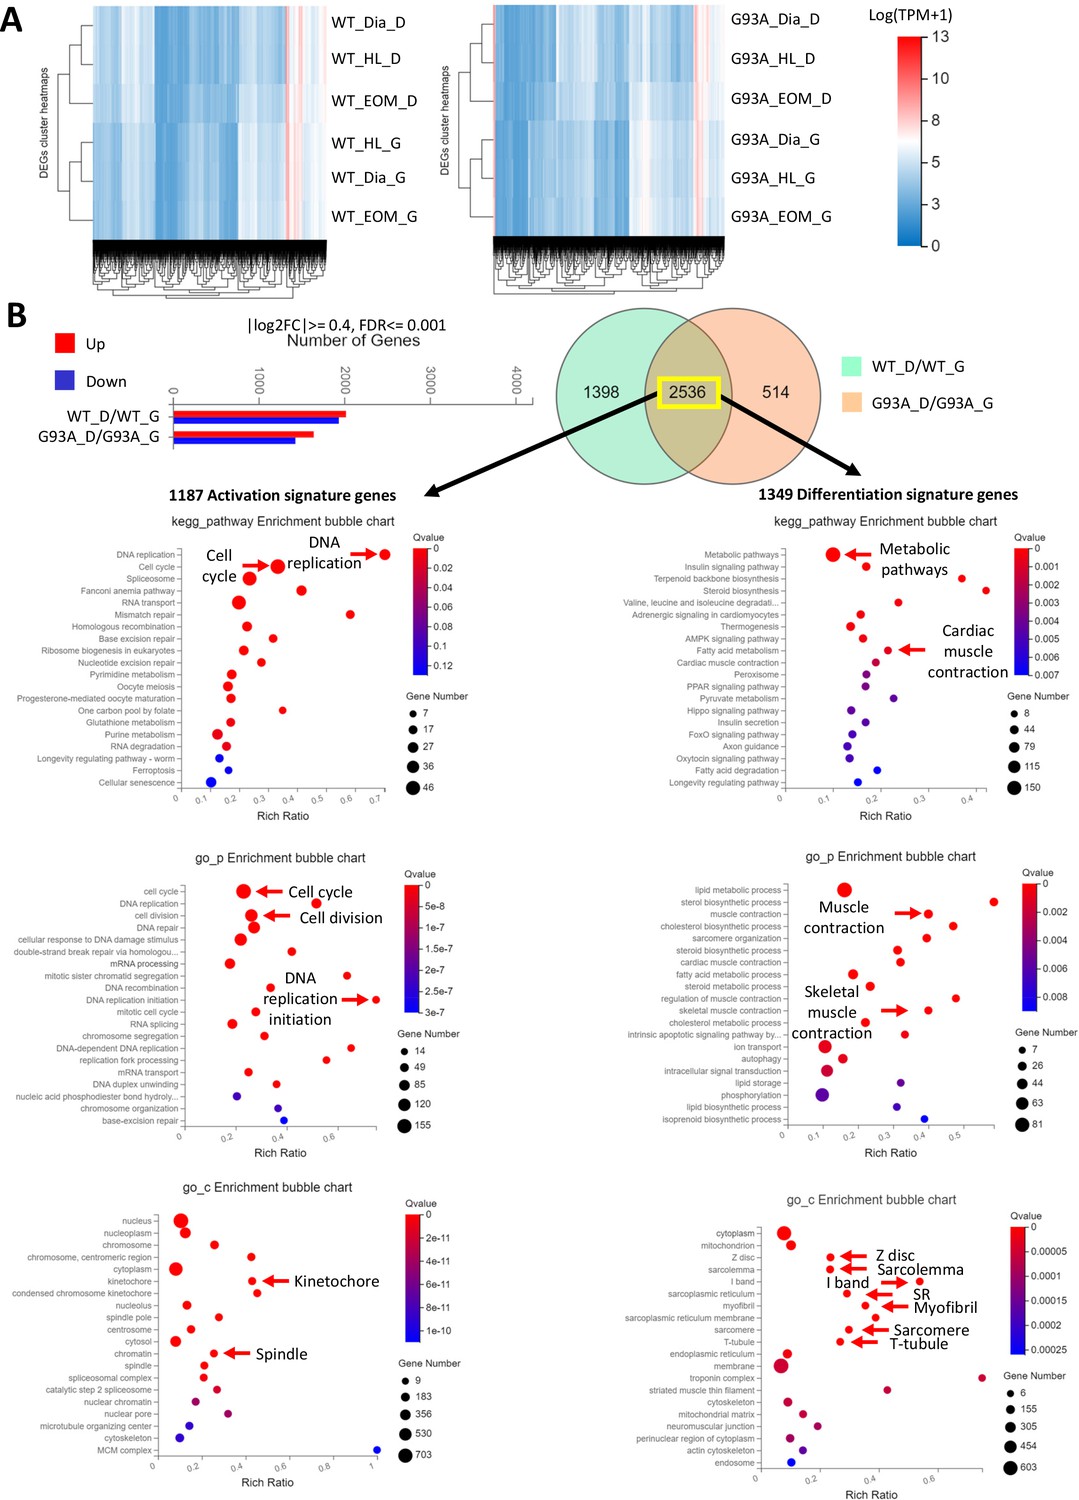
(A) Hierarchical clustering results of WT and G93A SCs cultured in growth and differentiation medium. In both cases samples cultured in the same medium condition are clustered together. (B) Bar chart on the left shows differentially expressed genes between SCs cultured in growth and differentiation medium, with SCs derived from WT and G93A mice analyzed separately. The Venn diagram highlights 2536 of these genes shared between WT and G93A SCs. 1187 of them expressed higher in SCs in growth medium are considered activation signature genes. The rest 1349 genes expressed higher in SCs in differentiation medium are considered differentiation signature genes. Functional annotation analysis below highlights top KEGG pathways, gene ontology_biological processes and gene ontology_cellular components enriched in these two lists of genes, respectively.
Figure 7 with 1 supplement
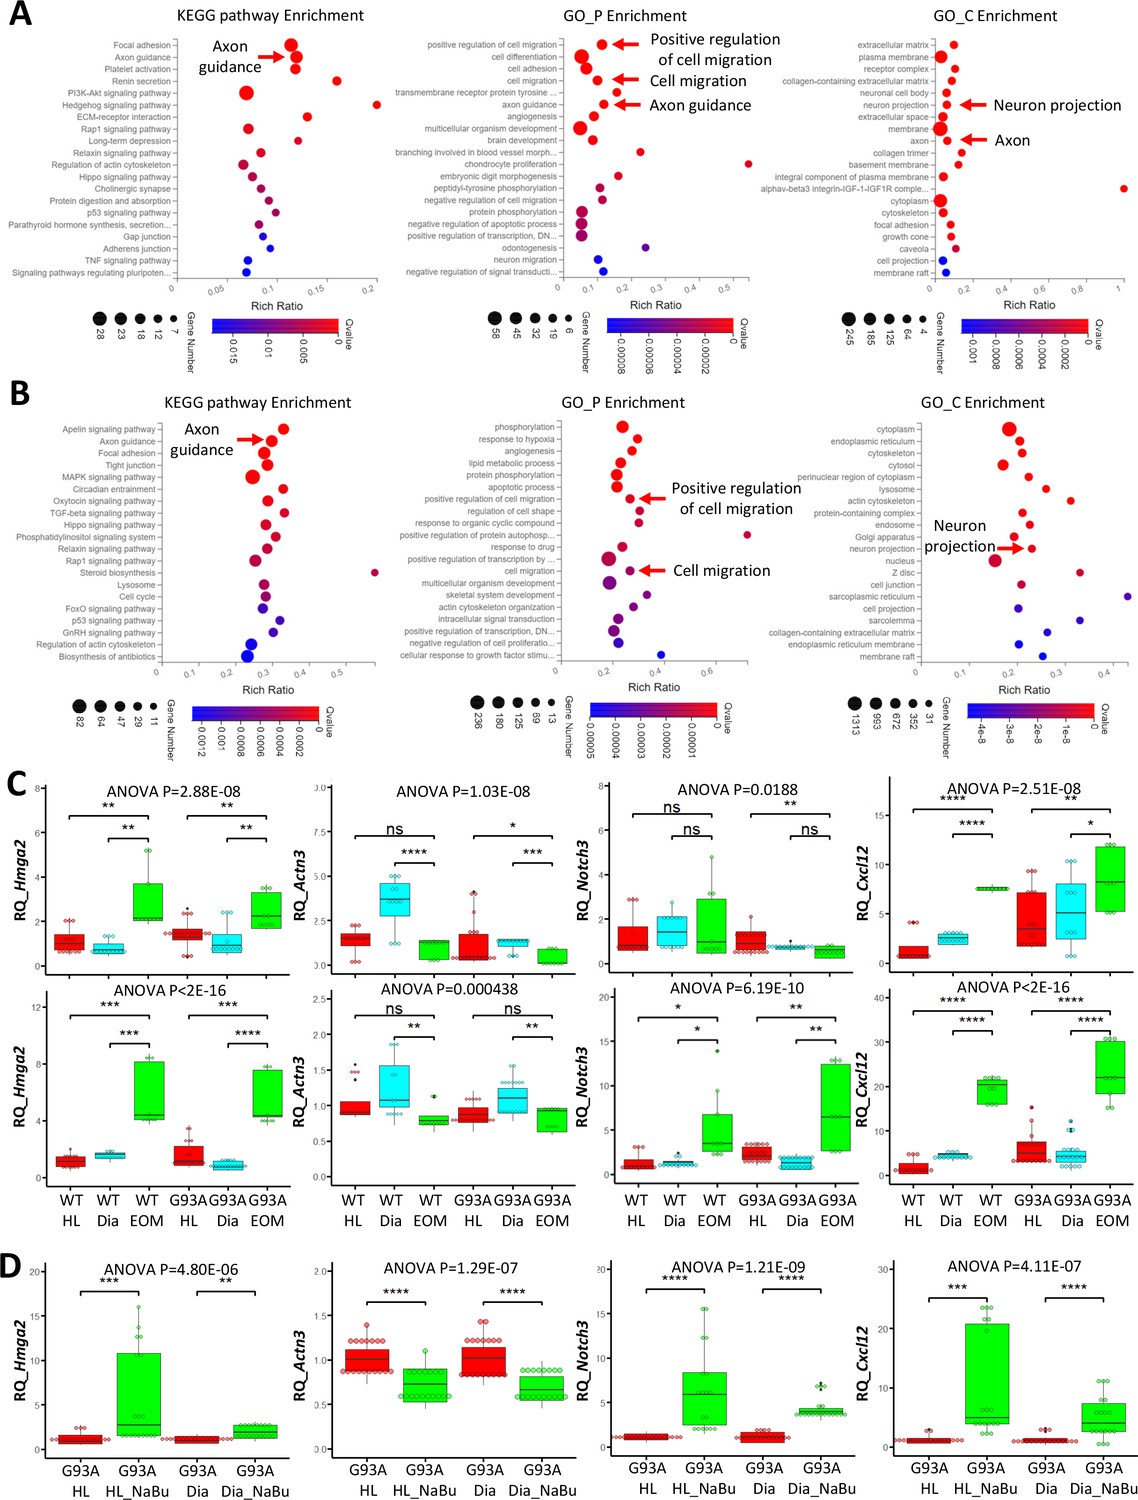
Functional annotation analysis of EOM SC signature genes and NaBu treatment signature genes and qRT-PCR results.
(A) Top KEGG pathway, GO_P and GO_C annotations of the 478 EOM signature genes (expressed higher in EOM SCs compared to diaphragm and HL counterparts cultured in both growth medium and differentiation medium). Arrows highlight annotations related to axon guidance and cell migration. (B) Top KEGG pathway, GO_P and GO_C annotations of the 3018 NaBu treatment signature genes shown in Figure 6B, rightmost panel. (C) qRT-PCR based relative quantification (RQ, fold of change against WT HL SCs) of Hmga2 (activation signature gene), Actn3 (differentiation signature gene), Notch3 (quiescence signature gene), and Cxcl12 (axon guidance molecule) expression in HL, diaphragm and EOM SCs cultured in growth (upper row) and differentiation medium (lower row), respectively. RNA samples were collected from three to six rounds of sorting and sorted cells were seeded into three dishes as replicates. Each dot in the box-and-dot plots represents one replicate of culture. WT HL SCs were from three male and one female mice. WT diaphragm SCs were from two male and two female mice; WT EOM SCs were from three male mice; G93A HL SCs were from four male and two female mice. G93A diaphragm SCs were from one male and three female mice; G93A EOM SCs were from three male mice. * p<0.05; ** p<0.01; *** p<0.001; **** p<0.0001; ns, not significant (t-test). ANOVA p values are also shown. (D) qRT-PCR based relative quantification (fold of change against G93A HL SCs without NaBu treatment) of Hmga2, Actn3, Notch3, and Cxcl12 expression in G93A hindlimb and diaphragm SCs with or without the 3-day NaBu treatment. RNA samples were collected from six rounds of sorting and sorted cells were seeded into three dishes as replicates. G93A HL SCs were from four male and two female mice; G93A diaphragm SCs were from two male and four female mice. ANOVA p values are also shown.
-
Figure 7—source data 1
Axon guidance related genes (KEGG) identified in EOM SC signature genes cultured in growth medium.
Log2FC and FDR are shown and genes are ranked according to relative abundance (TPM, from highest to lowest) in WT EOM SCs.
- https://cdn.elifesciences.org/articles/92644/elife-92644-fig7-data1-v1.docx
-
Figure 7—source data 2
Axon guidance related genes (KEGG) identified in EOM SC signature genes cultured in differentiation medium.
Log2FC and FDR are shown and genes are ranked according to relative abundance (TPM, from highest to lowest) in WT EOM SCs.
- https://cdn.elifesciences.org/articles/92644/elife-92644-fig7-data2-v1.docx
-
Figure 7—source data 3
Axon guidance related genes (KEGG) identified in NaBu treatment signature genes.
Log2FC and FDR are shown and genes are ranked according to relative abundance (TPM, from highest to lowest) in G93A HL SCs with 3-day NaBu treatment.
- https://cdn.elifesciences.org/articles/92644/elife-92644-fig7-data3-v1.docx
-
Figure 7—source data 4
qRT-PCR results for Hmga2, Actn3, Notch3, and Cxcl12 in SCs of different muscle origins cultured in growth medium.
The averaged dCt values of the genes of interest of WT HL SCs were used as the normalization controls during the calculation of ddCt.
- https://cdn.elifesciences.org/articles/92644/elife-92644-fig7-data4-v1.docx
-
Figure 7—source data 5
qRT-PCR results for Hmga2, Actn3, Notch3, and Cxcl12 in SCs of different muscle origins cultured in differentiation medium.
The averaged dCt values of the genes of interest of WT HL SCs were used as the normalization controls during the calculation of ddCt.
- https://cdn.elifesciences.org/articles/92644/elife-92644-fig7-data5-v1.docx
-
Figure 7—source data 6
qRT-PCR results for Hmga2, Actn3, Notch3, and Cxcl12 in G93A diaphragm and HL SCs with or without 3-day NaBu treatment.
The averaged dCt values of the genes of interest of G93A HL SCs were used as the normalization controls during the calculation of ddCt.
- https://cdn.elifesciences.org/articles/92644/elife-92644-fig7-data6-v1.docx
Figure 7—figure supplement 1
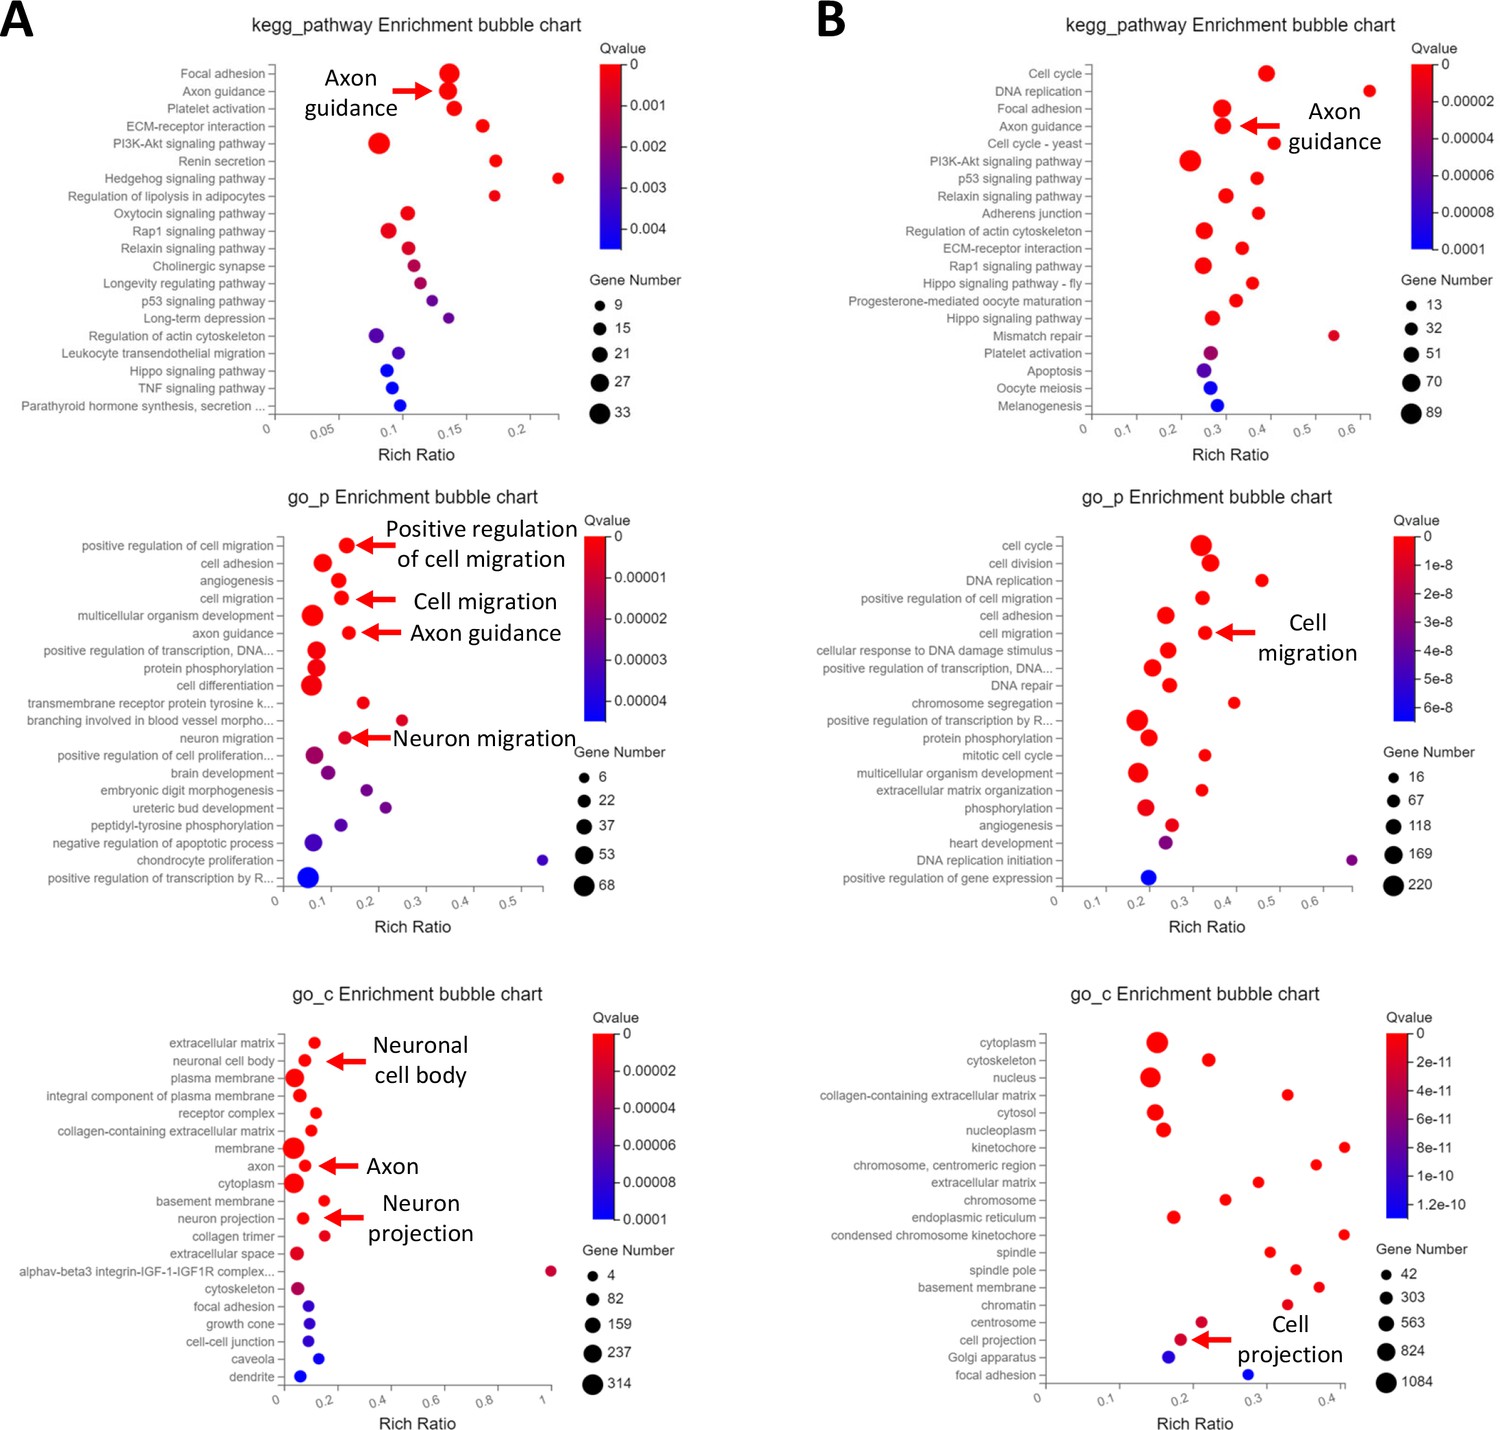
Top functional annotations of EOM SC signature genes cultured in growth medium and differentiation medium.
(A) Top KEGG pathway, GO_P and GO_C annotations of the 621 DEGs more abundant in EOM SCs compared to diaphragm and HL counterparts cultured in growth medium. (B) Top KEGG pathway, GO_P and GO_C annotations of the 2424 DEGS more abundant in EOM SCs compared to diaphragm and HL counterparts cultured in differentiation medium.
Figure 8 with 2 supplements
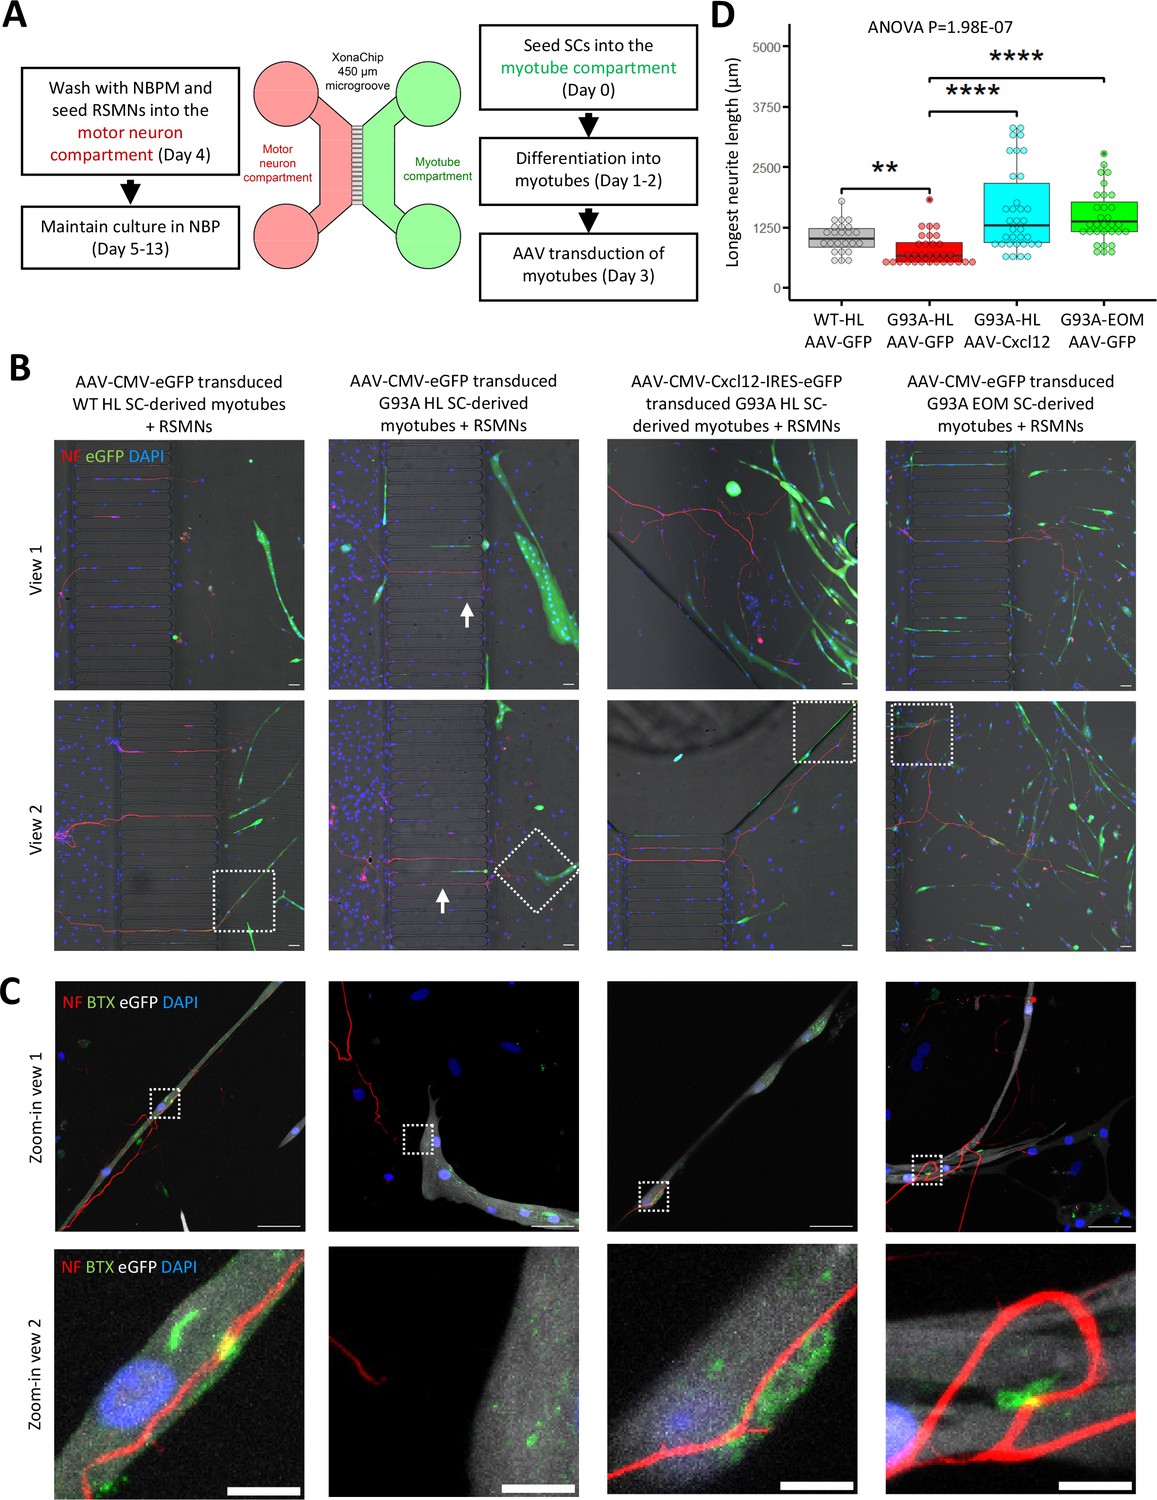
Coculture of AAV transduced SC-derived myotubes with rat spinal motor neurons in compartmentalized microfluidic chambers.
(A) Schematic representation of XonaChip spatial configuration and coculture experiment timeline. NBPM: Neurobasal Plus Medium; RSMNs: rat spinal motor neurons. (B) Representative composite images of RSMNs cocultured with: 1. WT HL SC-derived myotubes transduced with AAV-CMV-eGFP; 2. G93A HL SC-derived myotubes transduced with AAV- CMV-eGFP; 3. G93A HL SC-derived myotubes transduced with AAV-CMV-Cxcl12-IRES-eGFP; 4. G93A EOM SC-derived myotubes transduced with AAV-CMV-eGFP. Arrows highlight RSMN neurites crossed the microgrooves but stayed close to the edges and grew backward. Also see Figure 8—figure supplement 2A. Boxed regions are enlarged below. Scale bars: 50 μm. (C) Zoom-in views of RSMN neurites innervated or missed the AChR clusters (BTX positive patches). Boxed regions are further enlarged below. Scale bars: 50 μm, 10 μm. (D) Measured lengths of the longest neurites derived from RSMN cells (presumably axons) crossing the 450 μm microgrooves. n=24, 31, 34,31 for the four groups, respectively (from three rounds of coculture experiments). Each dot in the box-and-dot plot represents one neurite measured. HL and EOM SCs used for co-culture experiments were all from male mice. ** p<0.01; **** p<0.0001 (t-test). ANOVA p value is also shown.
Figure 8—figure supplement 1
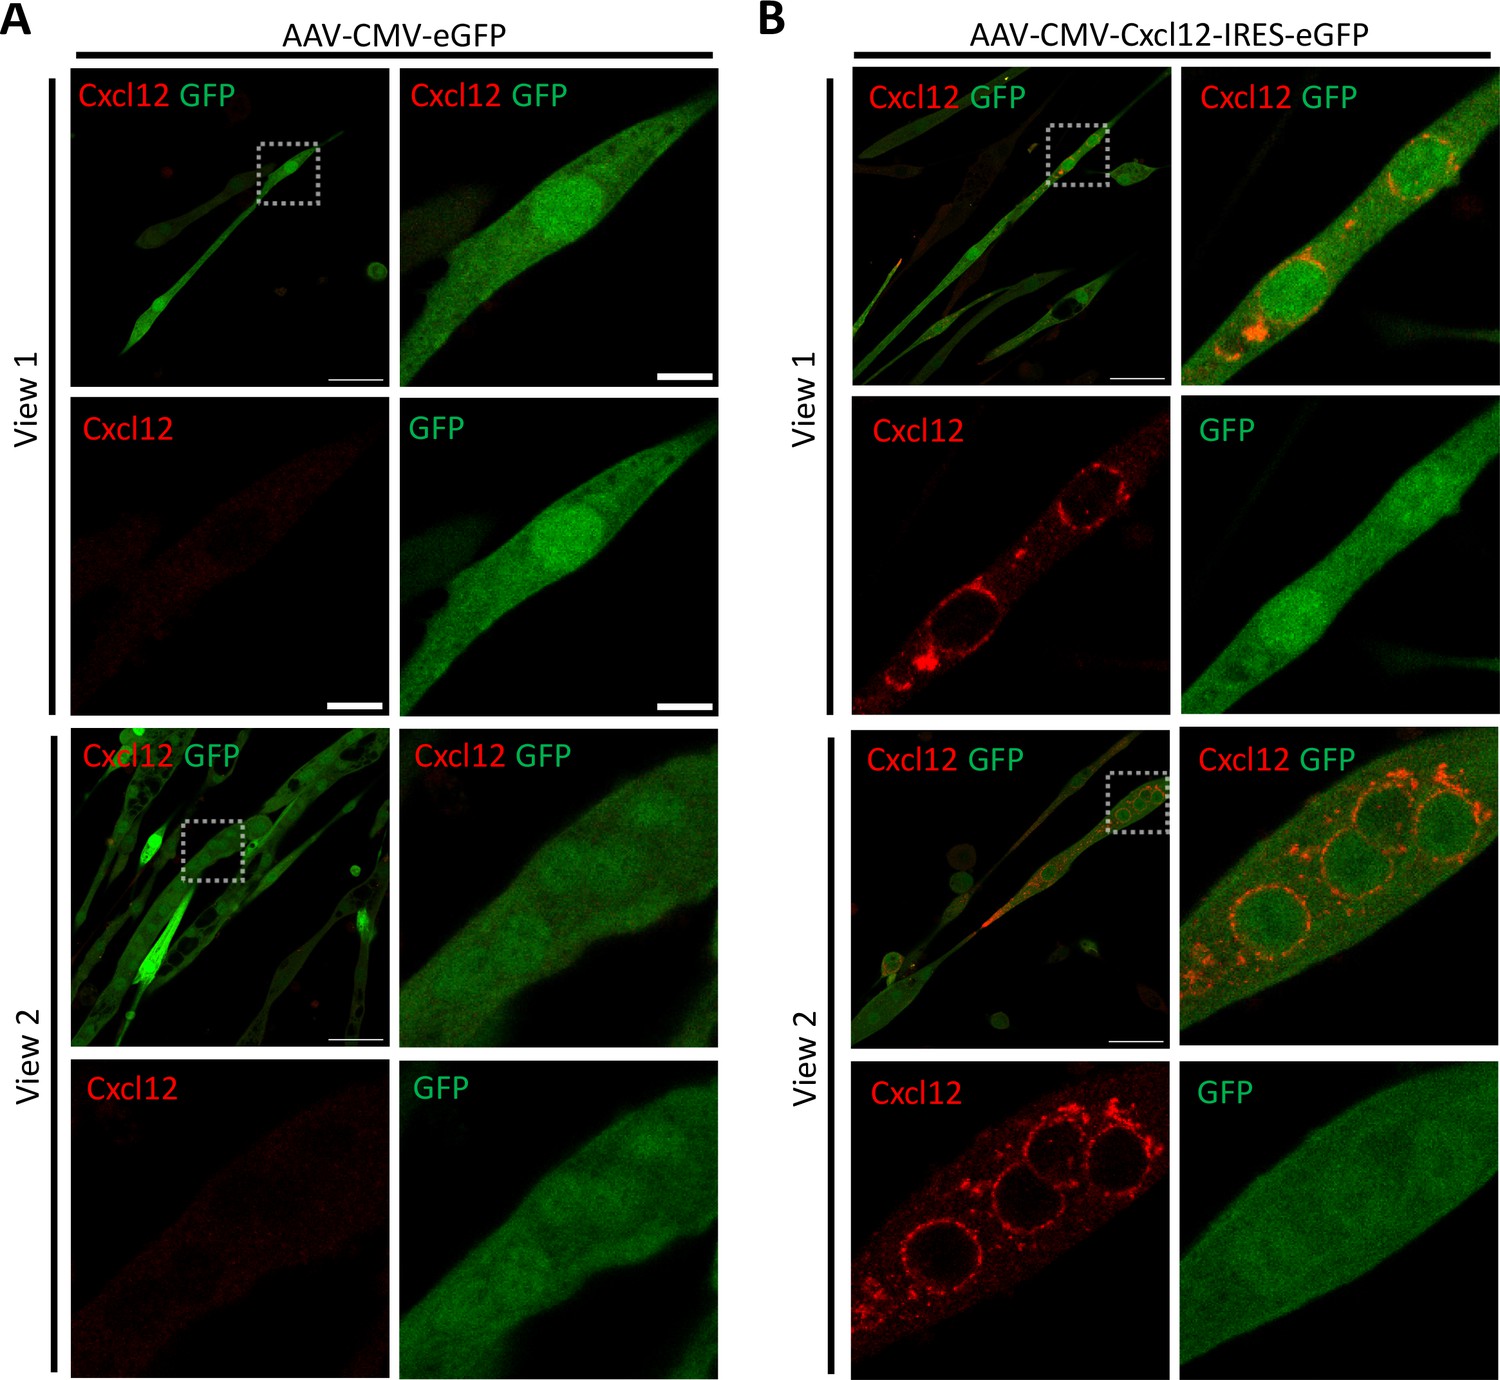
Representative views of AAV transduced G93A HL SC-derived myotubes stained with Cxcl12 and eGFP antibodies.
(A) G93A HL SC-derived myotubes transduced with AAV8-CMV-eGFP and stained with Cxcl12 and GFP antibodies. (B) G93A HL SC derived from myotubes transduced with AAV8-CMV-Cxcl12-IRES-eGFP and stained with Cxcl12 and GFP antibodies. Boxed regions are enlarged on the right and staining patterns of individual antibody are shown below. Note the elevated Cxcl12 expression in AAV8-CMV-Cxcl12-IRES-eGFP transduced myotubes. Scale bars: 50 μm, 10 μm (enlarged images).
Figure 8—figure supplement 2
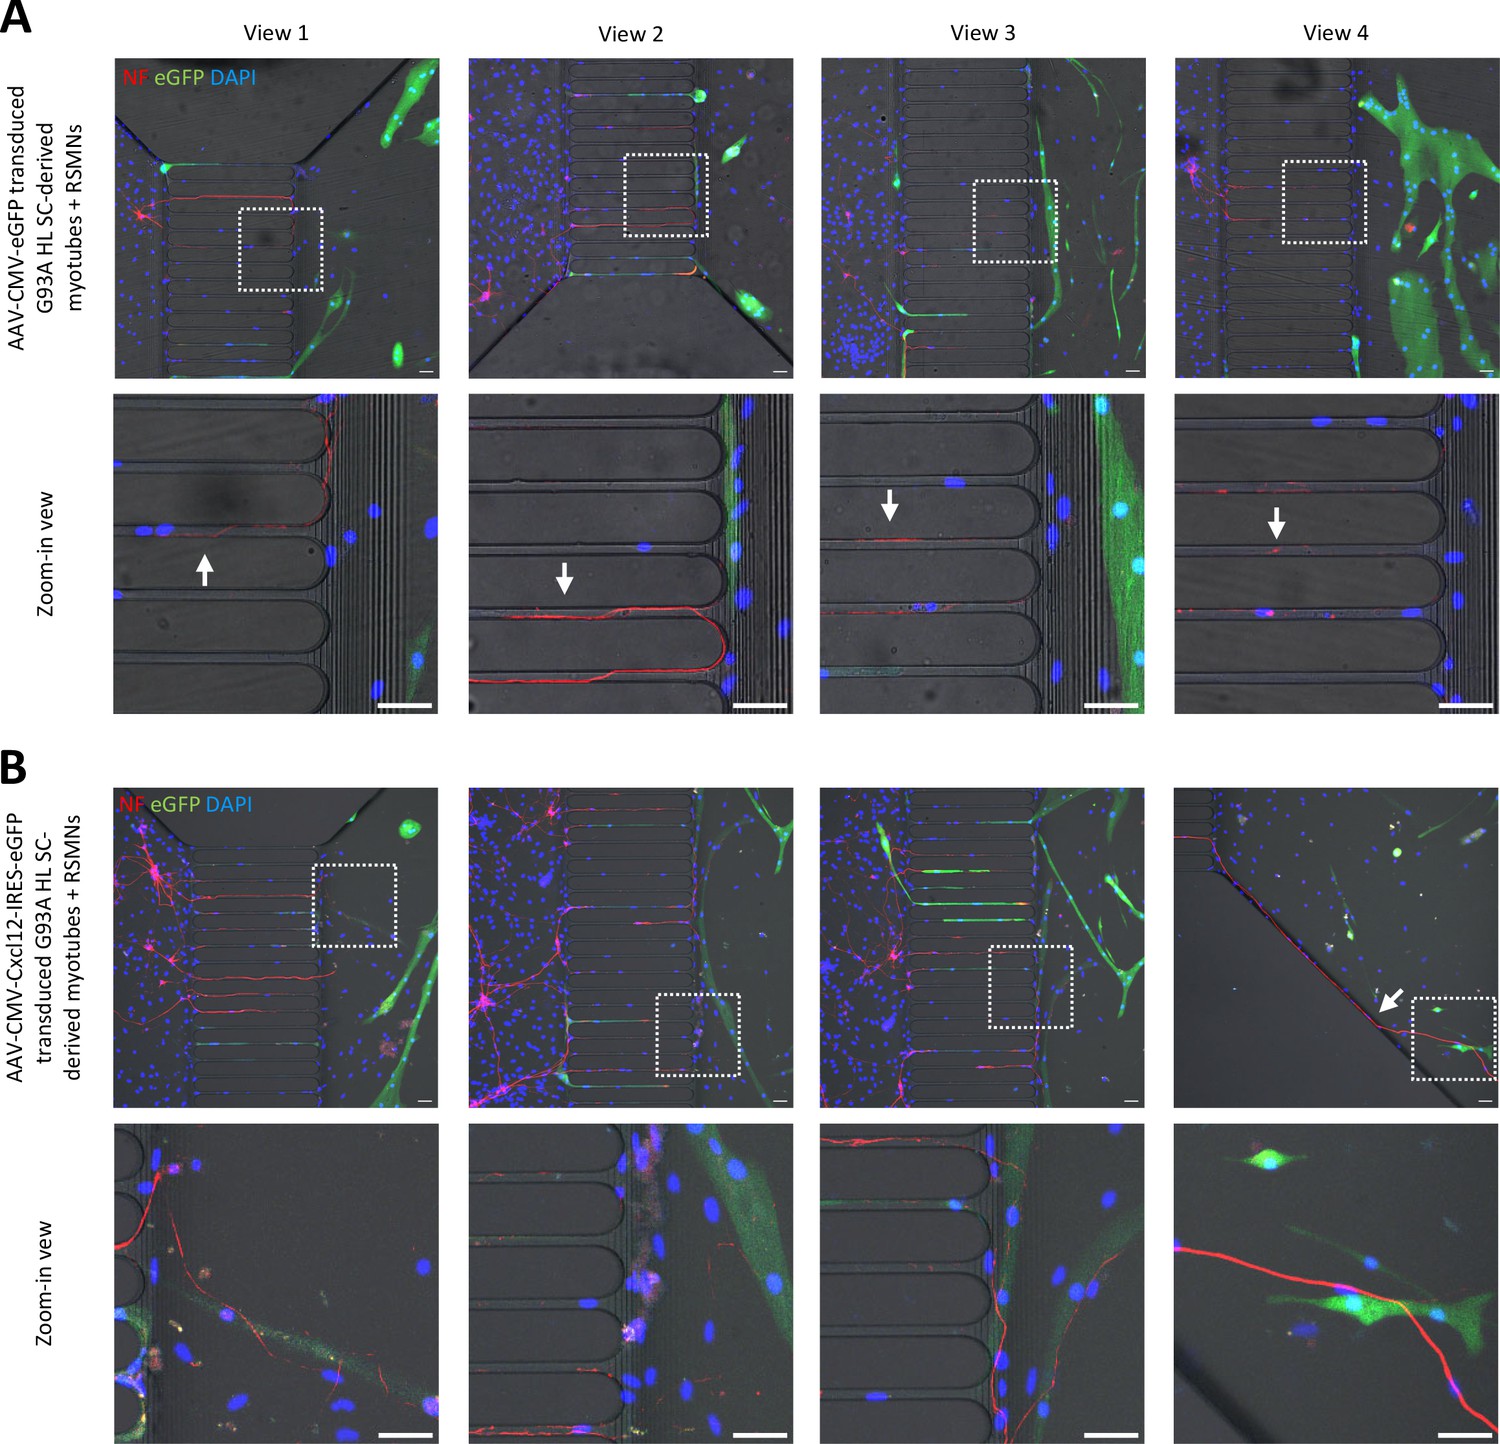
Additional representative views of neuromuscular coculture in compartmentalized microfluidic chamber.
(A) Cocultures of RSMNs with G93A HL SC-derived myotubes transduced with AAV8-CMV-eGFP. Boxed regions are enlarged below. Arrows highlight the RSMN axons turning back toward the neuronal compartment after crossing the 450 μm microgrooves. Scale bars: 50 μm. (B) Cocultures of RSMNs with G93A HL SC-derived myotubes transduced with AAV8-CMV-Cxcl12-IRES-eGFP. Boxed regions are enlarged below to highlight neurites extending along myotubes located close to the microgrooves. Scale bars: 50 μm.
Figure 9 with 1 supplement
Coculture of AAV transduced SC-derived myotubes with rat spinal motor neurons within the same compartment.
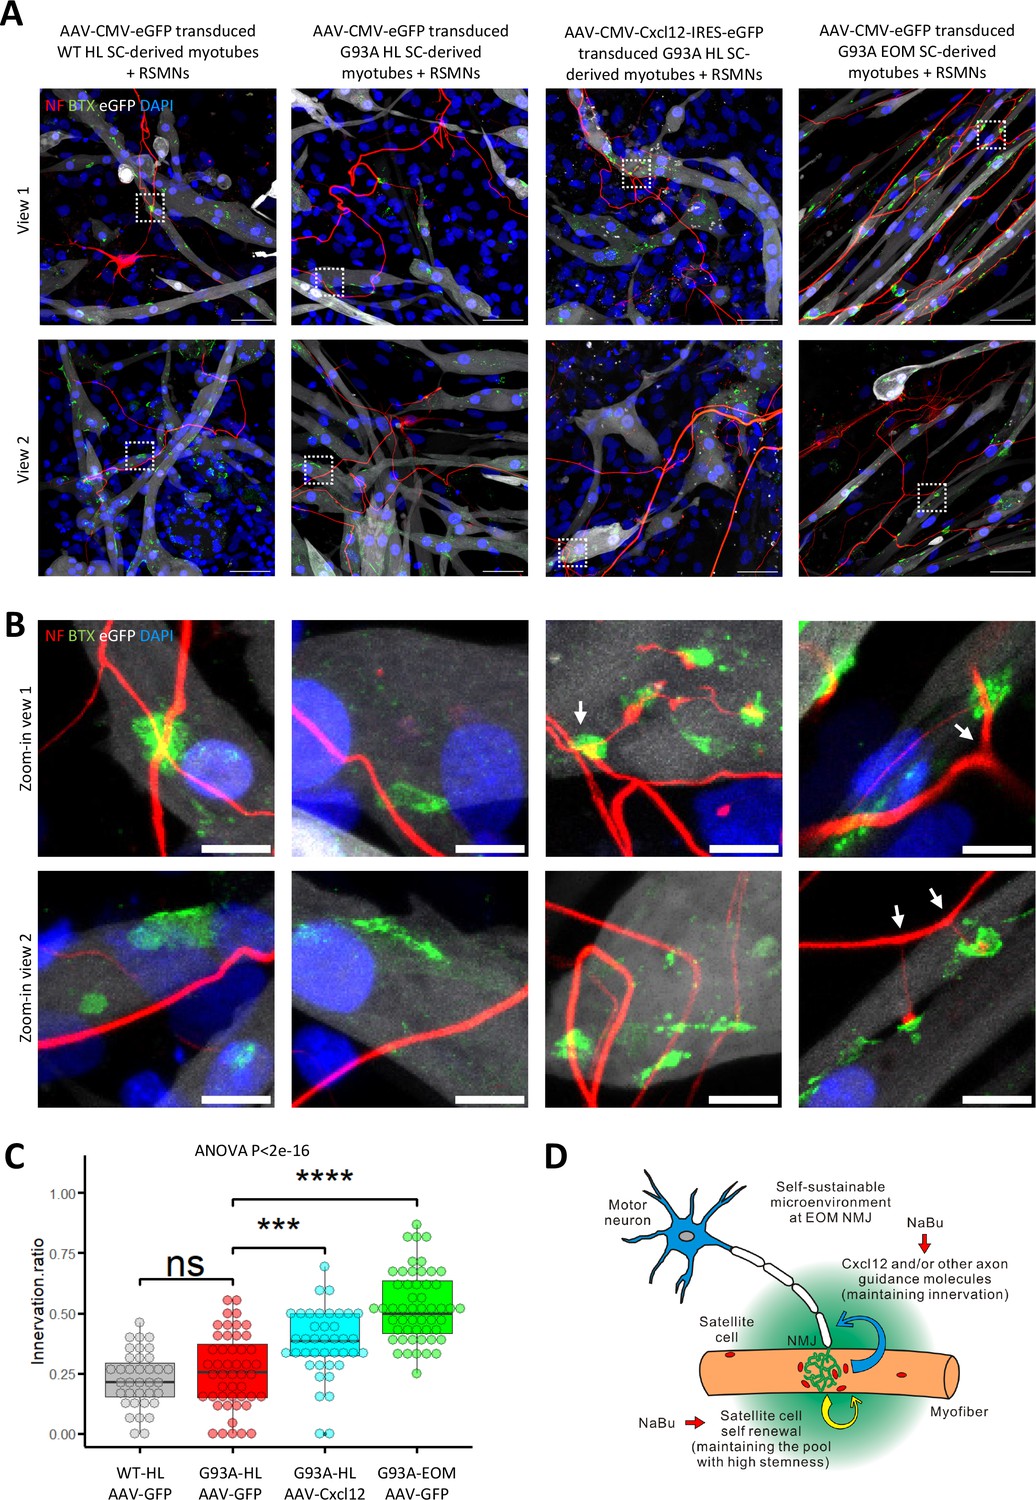
(A) Representative composite images of RSMNs cocultured with: 1. WT HL SC-derived myotubes transduced with AAV-CMV-eGFP; 2. G93A HL SC-derived myotubes transduced with AAV-CMV-eGFP; 3. G93A HL SC-derived myotubes transduced with AAV-CMV- Cxcl12-IRES-eGFP; 4. G93A EOM SC-derived myotubes transduced with AAV-CMV-eGFP. The timeline was the same as that in Figure 8 but RSMNs were seeded on top of myotubes. Boxed regions are enlarged in (B). Scale bars: 50 μm. (B) Zoom-in views of innervated and non-innervated AChR clusters on myotubes having contact with RSMN neurites. Arrows highlight branching phenomena observed in RSMN neurites innervating AChR clusters. Scale bars: 10 μm. (C) Quantification of innervation ratios of AChR clusters (area >10 μm2) in myotubes in contact with RSMN neurites. n=37, 48, 40, 52 z-stack images for the four groups, respectively (from three rounds of coculture experiments). Also see Materials and methods for detailed description. Each dot in the box-and-dot plot represents one image analyzed. HL and EOM SCs used for co-culture experiments were all from male mice. *** p<0.001; **** p<0.0001; ns, not significant (t-test). ANOVA p value is also shown. (D) Graphic summary of the potential mechanisms contributing to EOM NMJ integrity maintenance during ALS progression mimicked by NaBu treatment.
Figure 9—figure supplement 1
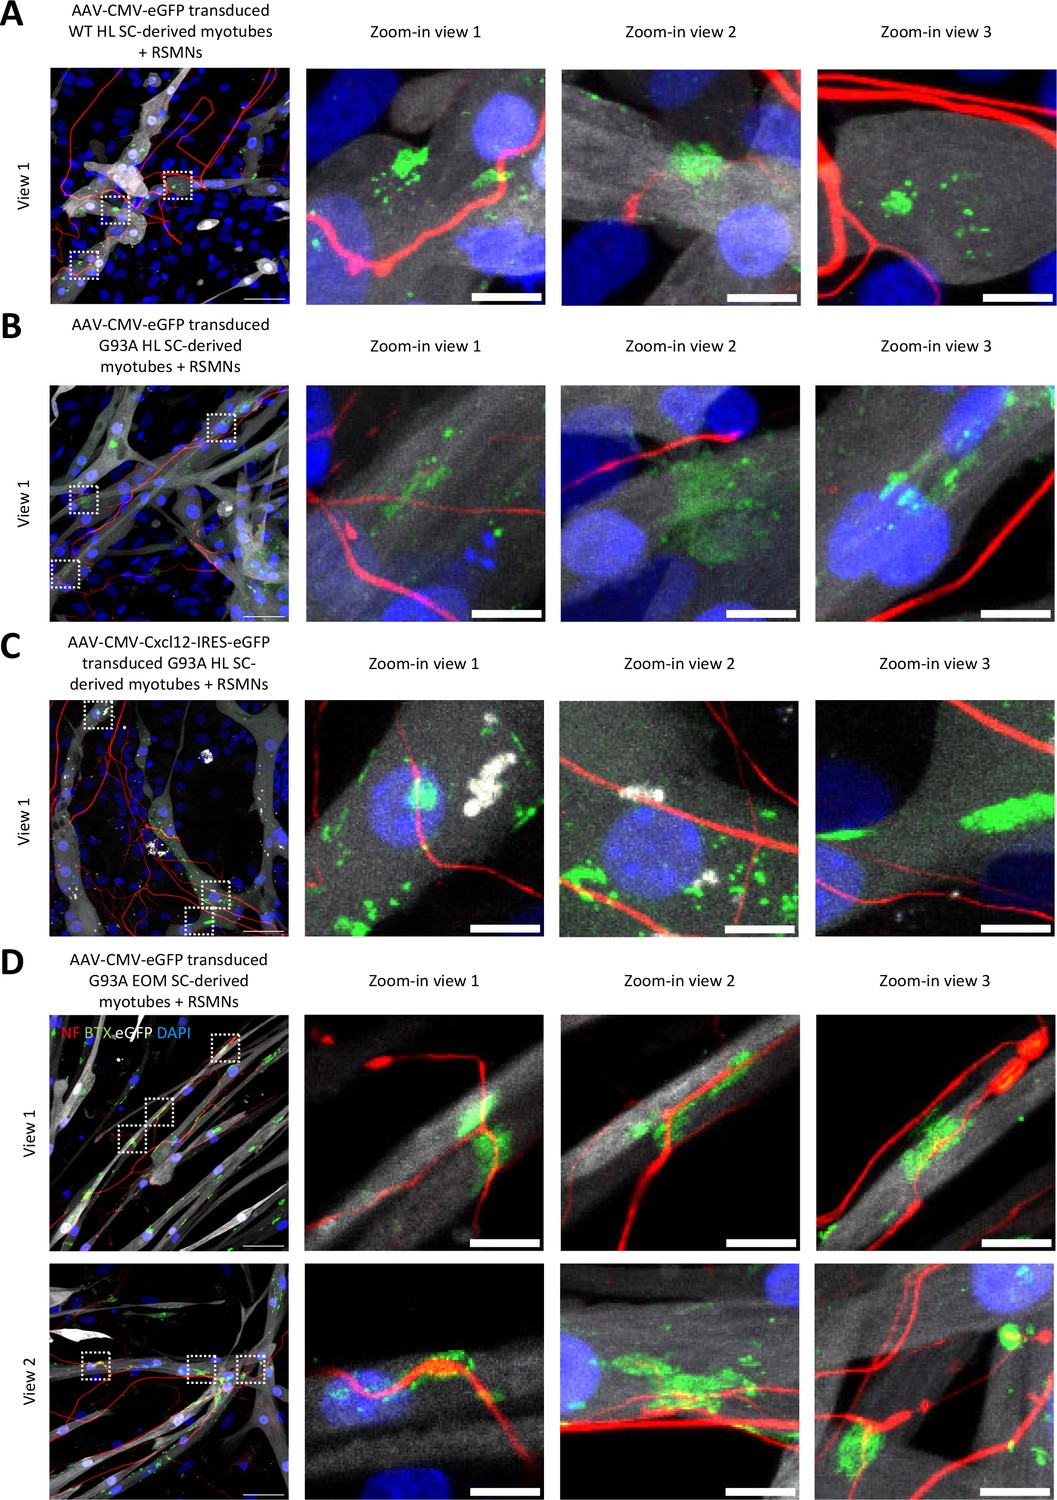
Additional representative views of neuromuscular coculture within the same compartment.
(A) Cocultures of RSMNs with WT HL SC-derived myotubes transduced with AAV8-CMV-eGFP. Boxed regions are enlarged on the right to highlight innervated and non-innervated AChR clusters. Scale bars: 50 μm, 10 μm (enlarged images). (B) Cocultures of RSMNs with G93A HL SC-derived myotubes transduced with AAV8-CMV-eGFP. (C) Cocultures of RSMNs with G93A HL SC-derived myotubes transduced with AAV8-CMV-Cxcl12-IRES-eGFP. (D) Cocultures of RSMNs with G93A EOM SC-derived myotubes transduced with AAV8-CMV-eGFP. Boxed regions are enlarged on the right to highlight innervated AChR clusters located on the same individual G93A EOM-SC-derived myotube.
Tables
Key resources table
| Reagent type (species) or resource | Designation | Source or reference | Identifiers | Additional information |
|---|---|---|---|---|
| Strain, strain background (Mus musculus) | B6SJLF1/J | Jackson Laboratory | Stock # 100012 | WT mice Both male and female Age up to 4 months |
| Strain, strain background (Mus musculus) | B6SJL-Tg (SOD1*G93A) | Jackson Laboratory | Stock # 002726 | G93A mice Both male and female Age up to 4 months |
| Cell line (Mus musculus) | Primary cultured mouse satellite cells | This paper | FACS-isolated from skeletal muscles dissected from WT or G93A mice, including both male and female. | |
| Cell line (Rattus norvegicus) | Primary cultured rat spinal motor neurons (RSCMNs) | iXCells | SKU # 10RA-033 | Isolated from D16 rat embryo spinal cord; Negative for mycoplasma, bacteria, yeast, and fungi. |
| Chemical compound, drug | Sodium butyrate | SAFC | Product # ARK2161 | 2% in drinking water for animal feeding; 0.5 mM in culture medium for cell treatment. |
| Transfected construct | AAV8-CMV-eGFP | Vector Biolabs | Item Code 7777 | Adeno-associated virus to transfect and express eGFP. |
| Transfected construct (Mus musculus) | AAV8-CMV-mCXCL12-IRES-eGFP | Vector Biolabs | Item Code 7000 | Adeno-associated virus to transfect and express mouse CXCL12 and eGFP. |
| Peptide, recombinant protein | Collagenase II | Worthington | Cat # LS004176 | Final concentration 0.26% |
| Peptide, recombinant protein | Dispase II | Sigma Aldrich | Cat # D46931G | Final concentration 0.24% |
| Peptide, recombinant protein | Hyaluronidase | Worthington | Cat # LS002592 | Final concentration 0.16% |
| Peptide, recombinant protein | DNase I | Worthington | Cat # LS002139 | Final concentration 0.04% |
| Antibody | Anti-mouse Vcam1-PE (Rat monoclonal IgG2a) | BioLegend | Clone 429 (MVCAM.A) Cat # 105713 | 600 ng/106 cells for FACS isolation |
| Antibody | Anti-mouse CD31-APC (Rat monoclonal IgG2a) | BioLegend | Clone 390 Cat #102409 | 400 ng/106 cells for FACS isolation |
| Antibody | Anti-mouse CD45-APC (Rat monoclonal IgG2b) | BioLegend | Clone 30-F11 Cat # 103111 | 400 ng/106 cells for FACS isolation |
| Antibody | Anti-mouse Sca-1-APC (Rat monoclonal IgG2a) | BioLegend | Clone D7 Cat # 108111 | 200 ng/106 cells for FACS isolation |
| Antibody | Anti-chicken Pax7 (Mouse monoclonal IgG1) | Santa Cruz Biotechnology | Cat # sc-81648 | IF (1:100) |
| Antibody | Anti-mouse MyoD (Mouse monoclonal IgG2b) | Santa Cruz Biotechnology | Cat # sc-377460 | IF (1:100) |
| Antibody | Anti-mouse Ki-67 (Rabbit monoclonal IgG) | Cell Signaling Technology | Cat # 12202 S | IF (1:300) |
| Antibody | Anti-chicken MHC (Mouse monoclonal IgG2b) | Developmental Studies Hybridoma Bank | Cat # MF20 | IF (1:200) |
| Antibody | Anti-rat NF-M (Mouse monoclonal IgG1) | Developmental Studies Hybridoma Bank | Cat # 2H3 | IF (1:300) |
| Antibody | Anti-GFP (Mouse monoclonal IgG2a) | Novus | Clone 4B10B2 Cat # NBP2-22111AF488 | IF (1:250) |
| Antibody | Anti-rat Synaptophysin (Rabbit polyclonal IgG) | Thermo Fisher Scientific | PA11043 | IF (1:400) |
| Antibody | Anti-human Cxcl12 (Mouse monoclonal IgG1) | R&D systems | Clone 79018 Cat # MAB350 | IF (1:200) |
| Other | AF 488 conjugated α-Bungarotoxin | Thermo Fisher Scientific | Cat # B13422 | IF (1:1000) |
| Other | DAPI in water | Biotium | Cat # 40043 | IF (1:8000) |
| Other | Methyl green 0.1% aqueous solution | Alfa Aesar | Cat # 42747 | Diluted 1:500 to stain dead cells for FACS analysis |
| Sequence-based reagent | qPCR primers for mouse Actn3 | Sigma Aldrich | Fwd: AACAGCAGCGGAAAACCTTCA Rev: GGCTTTATTGACATTGGCGATTT | |
| Sequence-based reagent | qPCR primers for mouse Cxcl12 | Sigma Aldrich | Fwd: TGCATCAGTGACGGTAAACCA Rev: TTCTTCAGCCGTGCAACAATC | |
| Sequence-based reagent | qPCR primers for mouse Gapdh | Sigma Aldrich | Fwd: AGGTCGGTGTGAACGGATTTG Rev: TGTAGACCATGTAGTTGAGGTCA | |
| Sequence-based reagent | qPCR primers for mouse Hmga2 | Sigma Aldrich | Fwd: GAGCCCTCTCCTAAGAGACCC Rev: TTGGCCGTTTTTCTCCAATGG | |
| Sequence-based reagent | qPCR primers for mouse Notch3 | Sigma Aldrich | Fwd: GGTAGTCACTGTGAACACGAGG Rev: CAACTGTCACCAGCATAGCCAG | |
| Sequence-based reagent | qPCR primers for mouse Scn5a | Sigma Aldrich | Fwd: ATGGCAAACTTCCTGTTACCTC Rev: CCACGGGCTTGTTTTTCAGC |
Additional files
Download links
A two-part list of links to download the article, or parts of the article, in various formats.
Downloads (link to download the article as PDF)
Open citations (links to open the citations from this article in various online reference manager services)
Cite this article (links to download the citations from this article in formats compatible with various reference manager tools)
Distinct transcriptomic profile of satellite cells contributes to preservation of neuromuscular junctions in extraocular muscles of ALS mice
eLife 12:RP92644.
https://doi.org/10.7554/eLife.92644.4


