Inhibition of miR-199b-5p reduces pathological alterations in osteoarthritis by potentially targeting Fzd6 and Gcnt2
- Acupuncture and Tuina College, Chengdu University of Traditional Chinese Medicine, China
- Chongqing Hospital of Traditional Chinese Medicine, China
- Department of Orthopedic Surgery, Brigham and Women's Hospital, Harvard Medical School, United States
- Harvard Stem Cell Institute, Harvard University, United States
- Departments of Neurosurgery, Brigham and Women’s Hospital, Harvard Medical School, United States
- Key Laboratory of Acupuncture for Senile Disease (Chengdu University of TCM), Ministry of Education, China
Figures
Figure 1 with 1 supplement
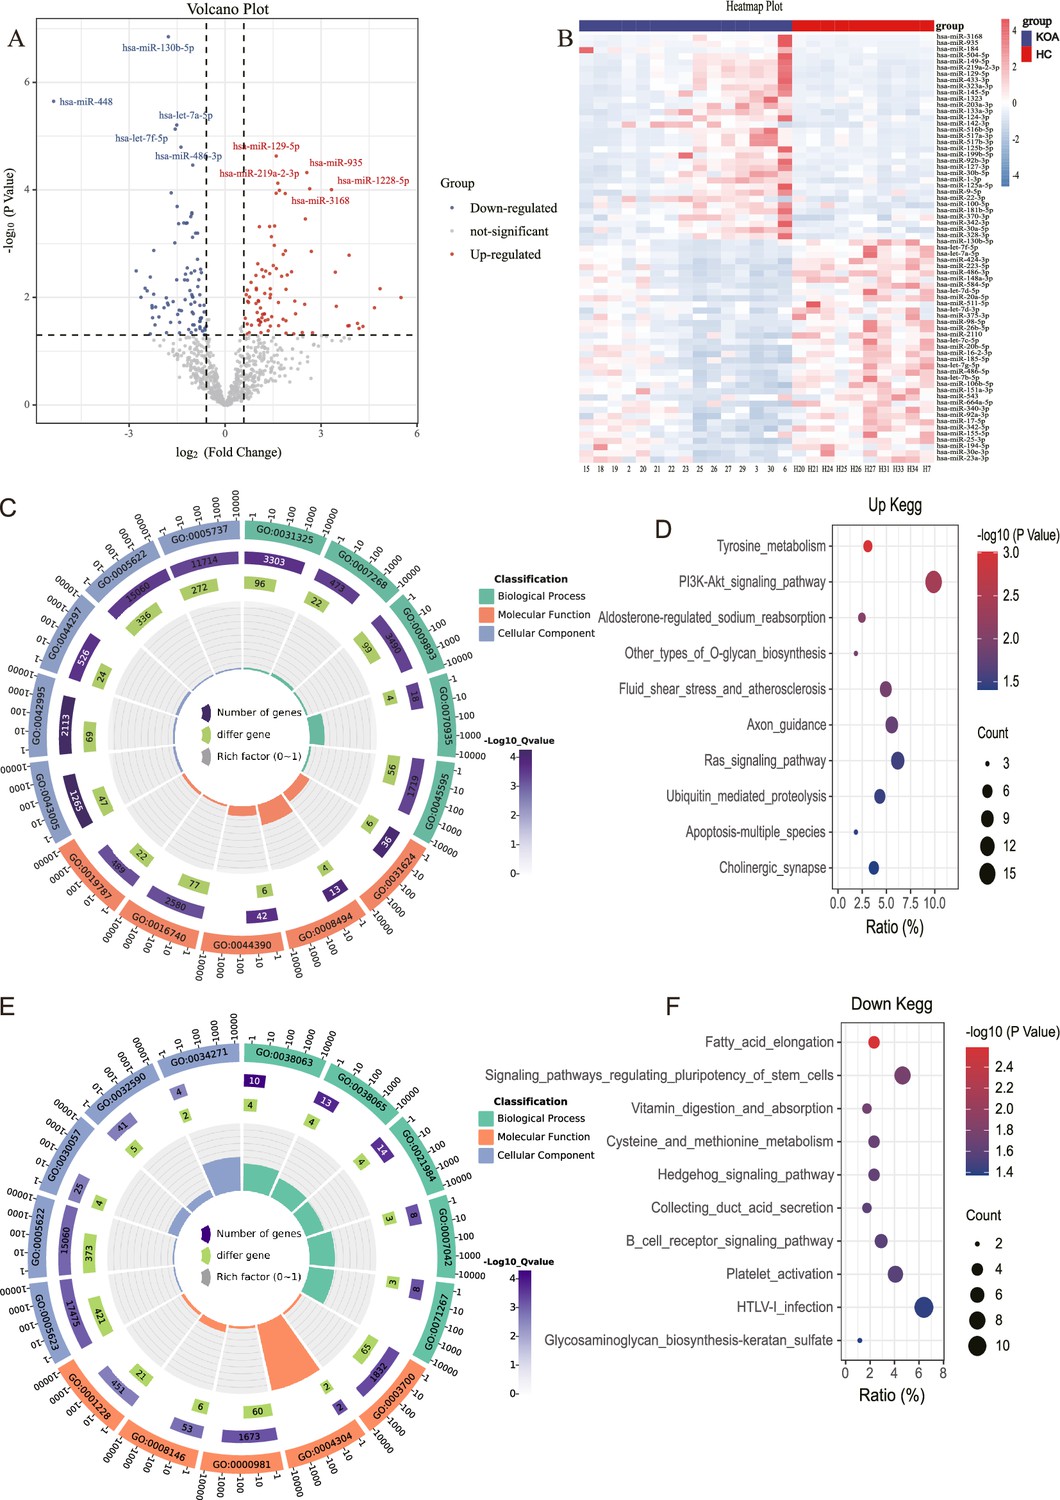
MicroRNA (miRNA) expression in knee osteoarthritis (KOA) patients.
(A, B) Volcano plot and heatmap showing differential miRNAs between KOA and healthy groups (healthy, n=10; KOA, n=15, |log2 Fold Change|≥0.585, p<0.05). (C) GO enrichment analyses of upregulated genes.(GO:0031325 positive regulation of cellular metabolic process; GO:0007268 chemical synaptic transmission; GO:0009893 positive regulation of metabolic process; GO:0070935 3'-UTR-mediated mRNA stabilization; GO:0045595 regulation of cell differentiation; GO:0043005 neuron projection; GO:0042995 cell projection; GO:0044297 cell body; GO:0005622 intracellular; GO:0005737 cytoplasm; GO:0031624 ubiquitin-conjugating enzyme binding; GO:0008494 translation activator activity; GO:0044390 ubiquitin-like protein conjugating enzyme binding; GO:0016740 transferase activity; GO:0019787 ubiquitin-like protein transferase activity) (D) Kyoto Encyclopedia of Genes and Genomes (KEGG) enrichment analyses of upregulated genes. (E) Gene Ontology (GO) enrichment analyses of downregulated genes. (GO:0038063 collagen-activated tyrosine kinase receptor signaling pathway; GO:0038065 collagen-activated signaling pathway; GO:0021984 adenohypophysis development; GO:0007042 lysosomal lumen acidification; GO:0071267 L-methionine salvage; GO:0005623 cell; GO:0005622 intracellular; GO:0030057 desmosome; GO:0032590 dendrite membrane; GO:0034271 phosphatidylinositol 3-kinase complex, class III, type I; GO:0003700 DNA binding transcription factor activity; GO:0004304 estrone sulfotransferase activity; GO:0000981 RNA polymerase II transcription factor activity, sequence-specific DNA binding; GO:0008146 sulfotransferase activity; GO:0001228 transcriptional activator activity, RNA polymerase II transcription regulatory region sequence-specific DNA binding) (F) KEGG enrichment analyses of downregulated genes.
Figure 1—figure supplement 1

Identification of exosome.
(A) Transmission electron microscope scanning of isolated exosomes from the serum of participants. Scale bars, 500 nm (left), 200 nm (middle), 100 nm (right). (B) The Nano sight particle analysis of isolated exosomes from the serum of participants. (C) The western blot analysis of symbolic surface markers of isolated exosomes from the serum of participants.
-
Figure 1—figure supplement 1—source data 1
Original file of western blot in Figure 1—figure supplement 1.
- https://cdn.elifesciences.org/articles/92645/elife-92645-fig1-figsupp1-data1-v1.pdf
-
Figure 1—figure supplement 1—source data 2
Labelled file of western blot in Figure 1—figure supplement 1.
- https://cdn.elifesciences.org/articles/92645/elife-92645-fig1-figsupp1-data2-v1.pdf
Figure 2 with 1 supplement
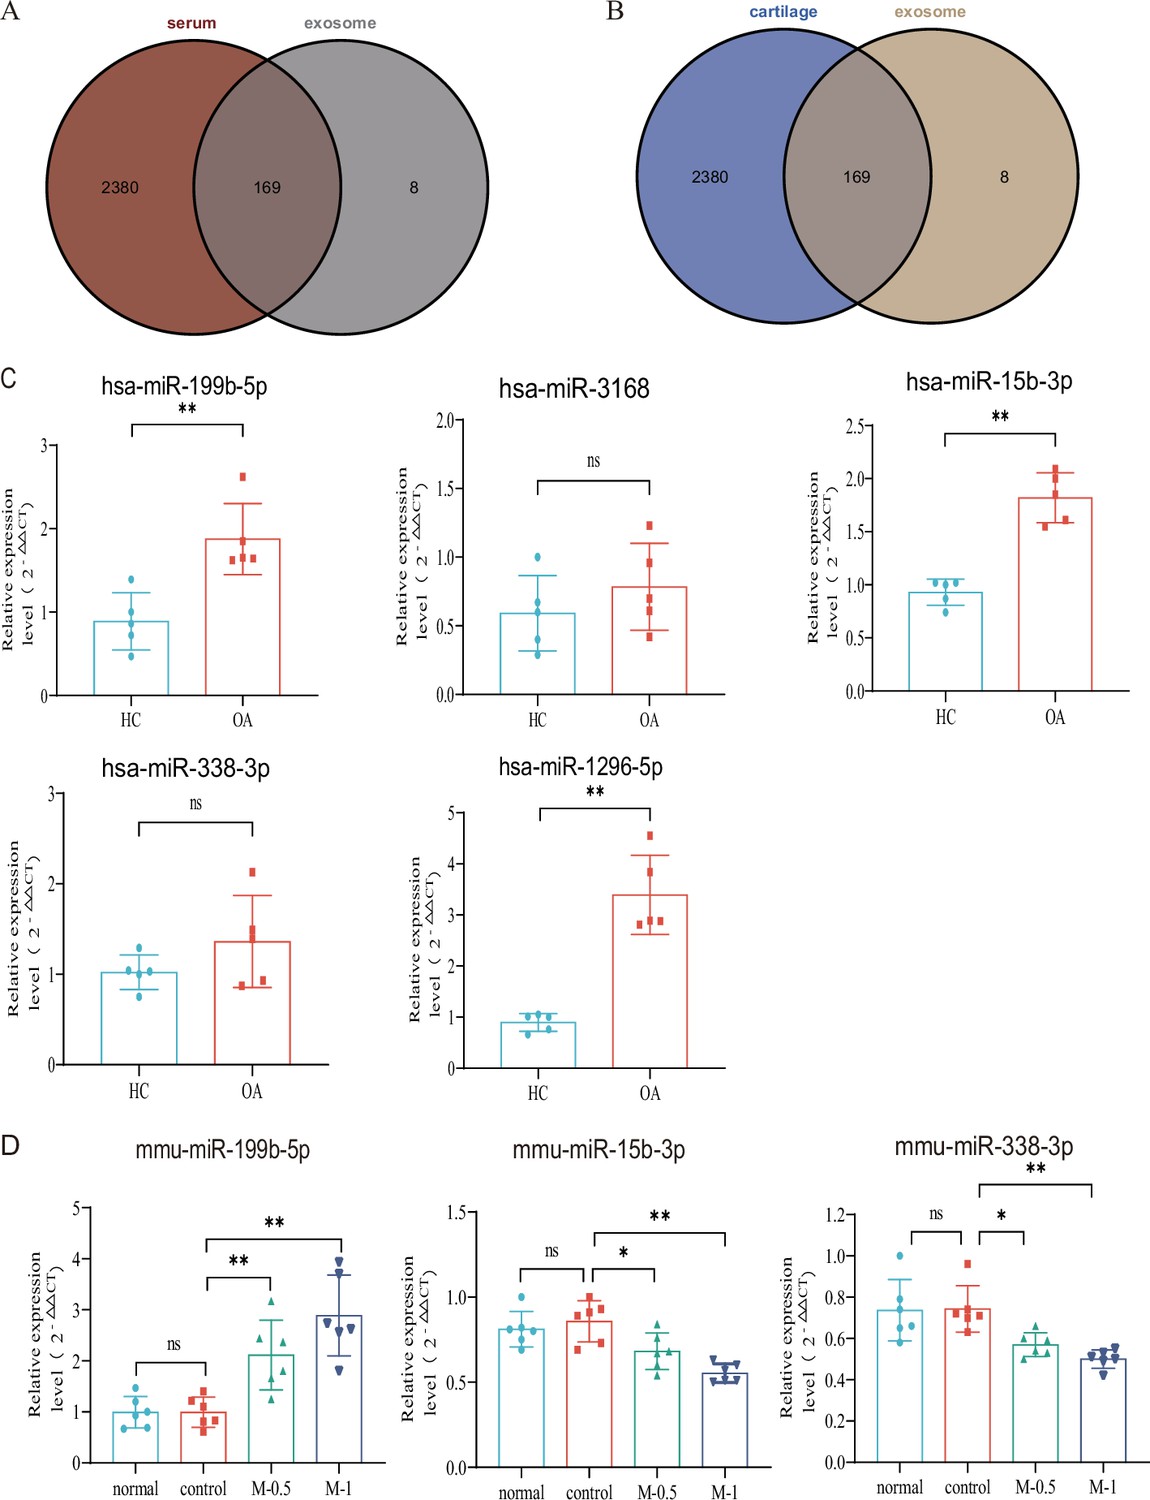
Verification with GEO data and microRNA (miRNA) screening.
(A, B) Venn plot showing GEO dataset and our result. (C) RT-qPCR in clinical samples to verify the expression (HC, n=5, KOA, n=5). (D) RT-qPCR results of mouse joint samples (n=6). M-0.5, 10 µL of 0.5 mg/mL; M-1, 10 µL of 1 mg/mL. Data are shown as means ± SD. *p<0.05, **p<0.01.
-
Figure 2—source data 1
Original data of RT-qPCR in Figure 2C and D.
- https://cdn.elifesciences.org/articles/92645/elife-92645-fig2-data1-v1.xlsx
Figure 2—figure supplement 1
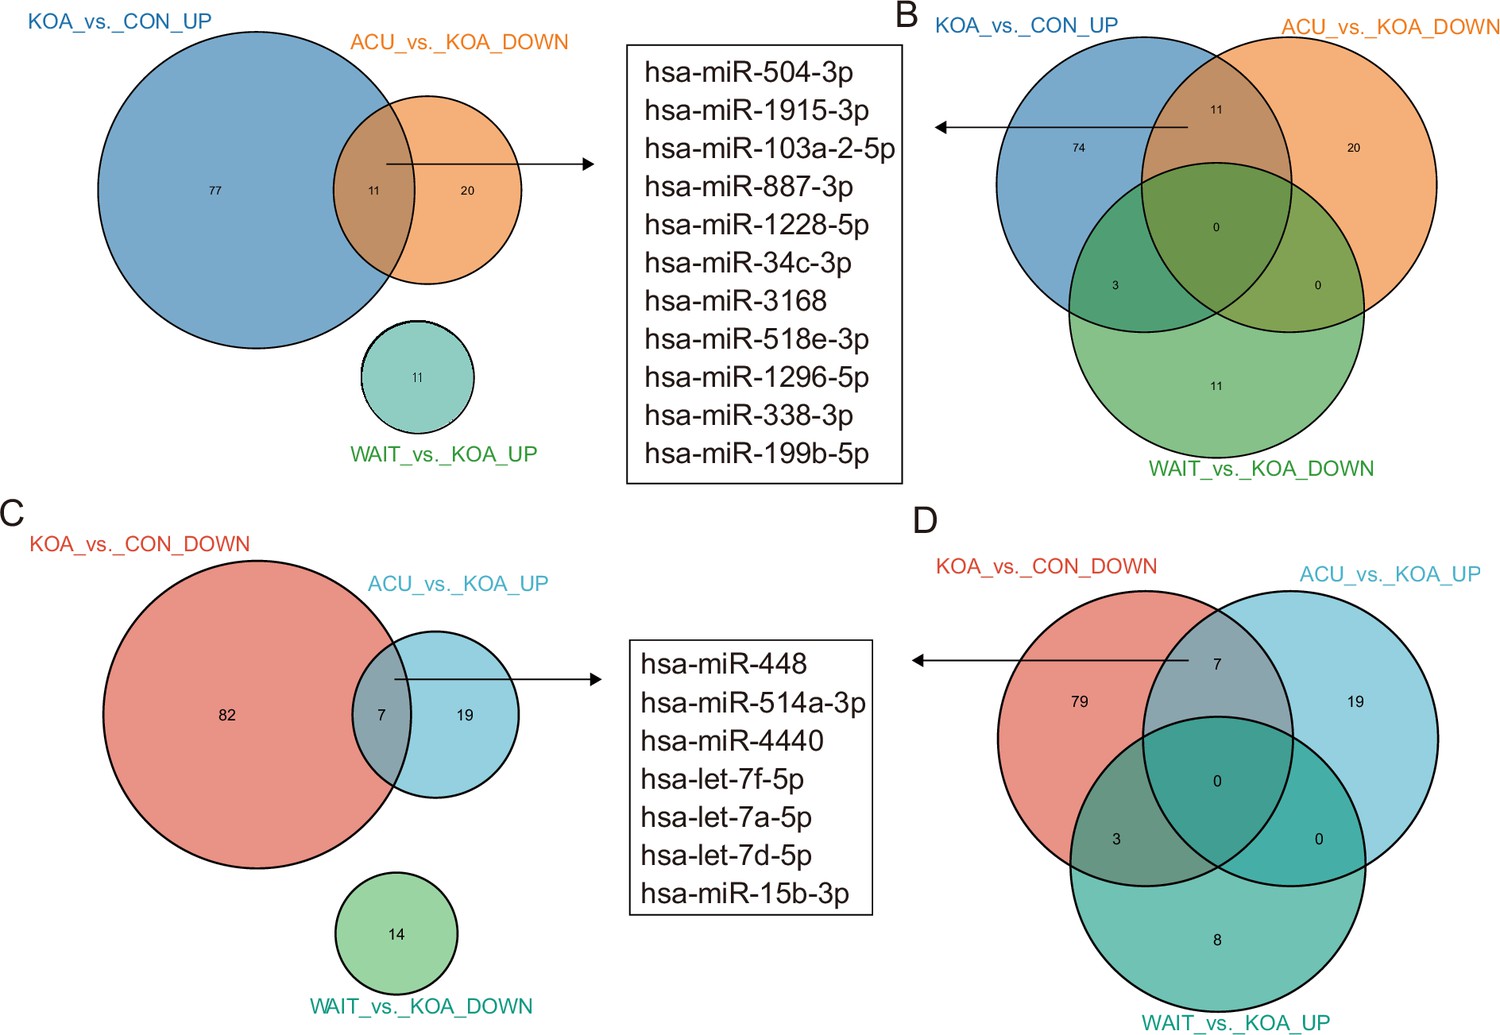
Venn diagram showing differentially expressed microRNAs (miRNAs) in the osteoarthritis (OA) group compared with healthy patients and patients who recovered after acupuncture treatment.
Figure 3 with 2 supplements
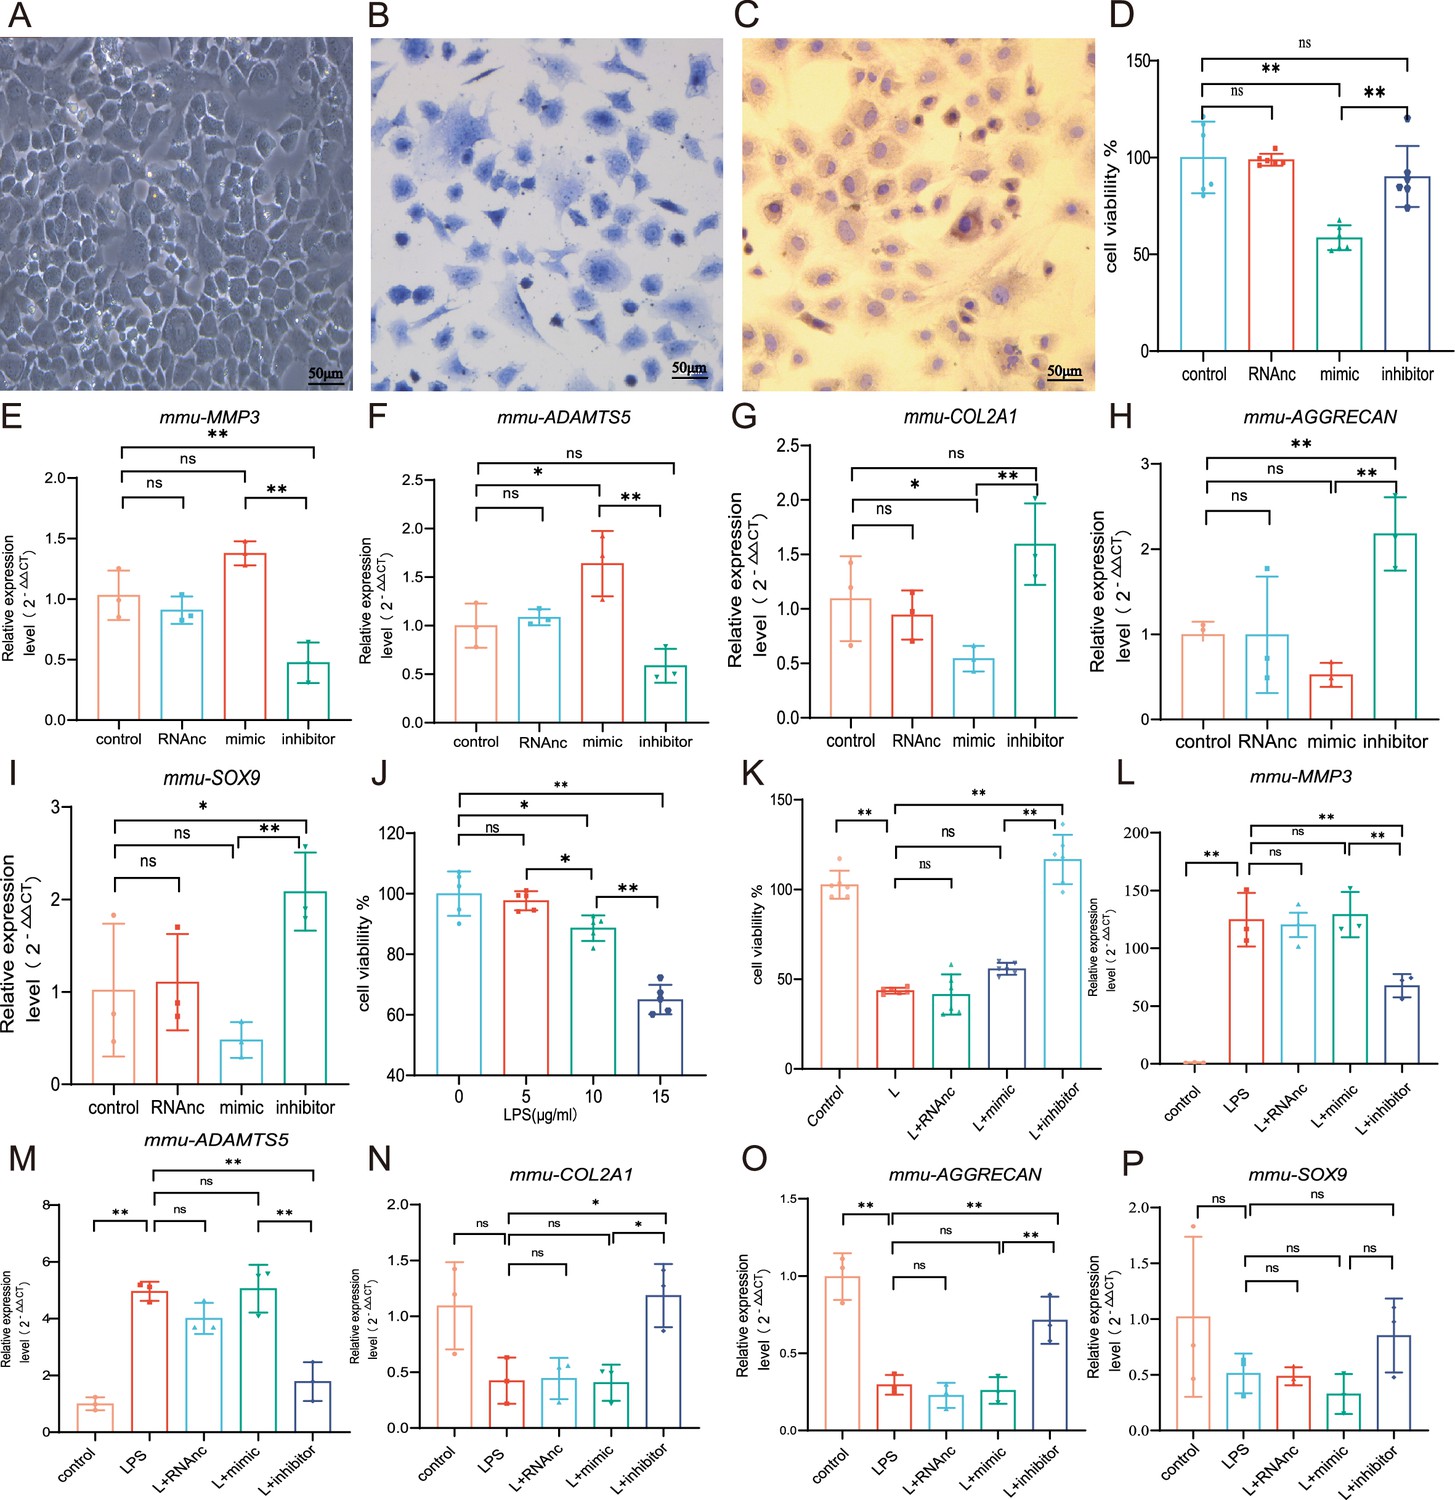
Chondrocyte proliferation and marker expression changes after miR-199b-5p mimic or inhibitor treatment.
(A) Second-generation primary mouse chondrocytes. (B) Toluene blue staining. (C) Type II collagen immunoassay. Scale bars, 50 μm. (D) CCK-8 assay for cell viability (n=6). (E, F) RT-qPCR detection of MMP-3 and ADAMTS5 mRNA expression (n=3). (G–I) RT-qPCR detection of COL-2A1, AGGRECAN, and SOX9 mRNA expression (n=3). (J) CCK-8 cell viability assay after different doses of LPS induction (n=5). (K) CCK-8 cell viability assay after virus infection (n=6). (L, M) RT-qPCR detection of MMP-3 and ADAMTS5 mRNA expression (n=3). (N–P) RT-qPCR detection of COL2A1, AGGRECAN, and SOX9 mRNA expression (n=3). Data are shown as mean ± SD. *p<0.05, **p<0.01.
-
Figure 3—source data 1
Original data of RT-qPCR in Figure 3D–P.
- https://cdn.elifesciences.org/articles/92645/elife-92645-fig3-data1-v1.xlsx
Figure 3—figure supplement 1
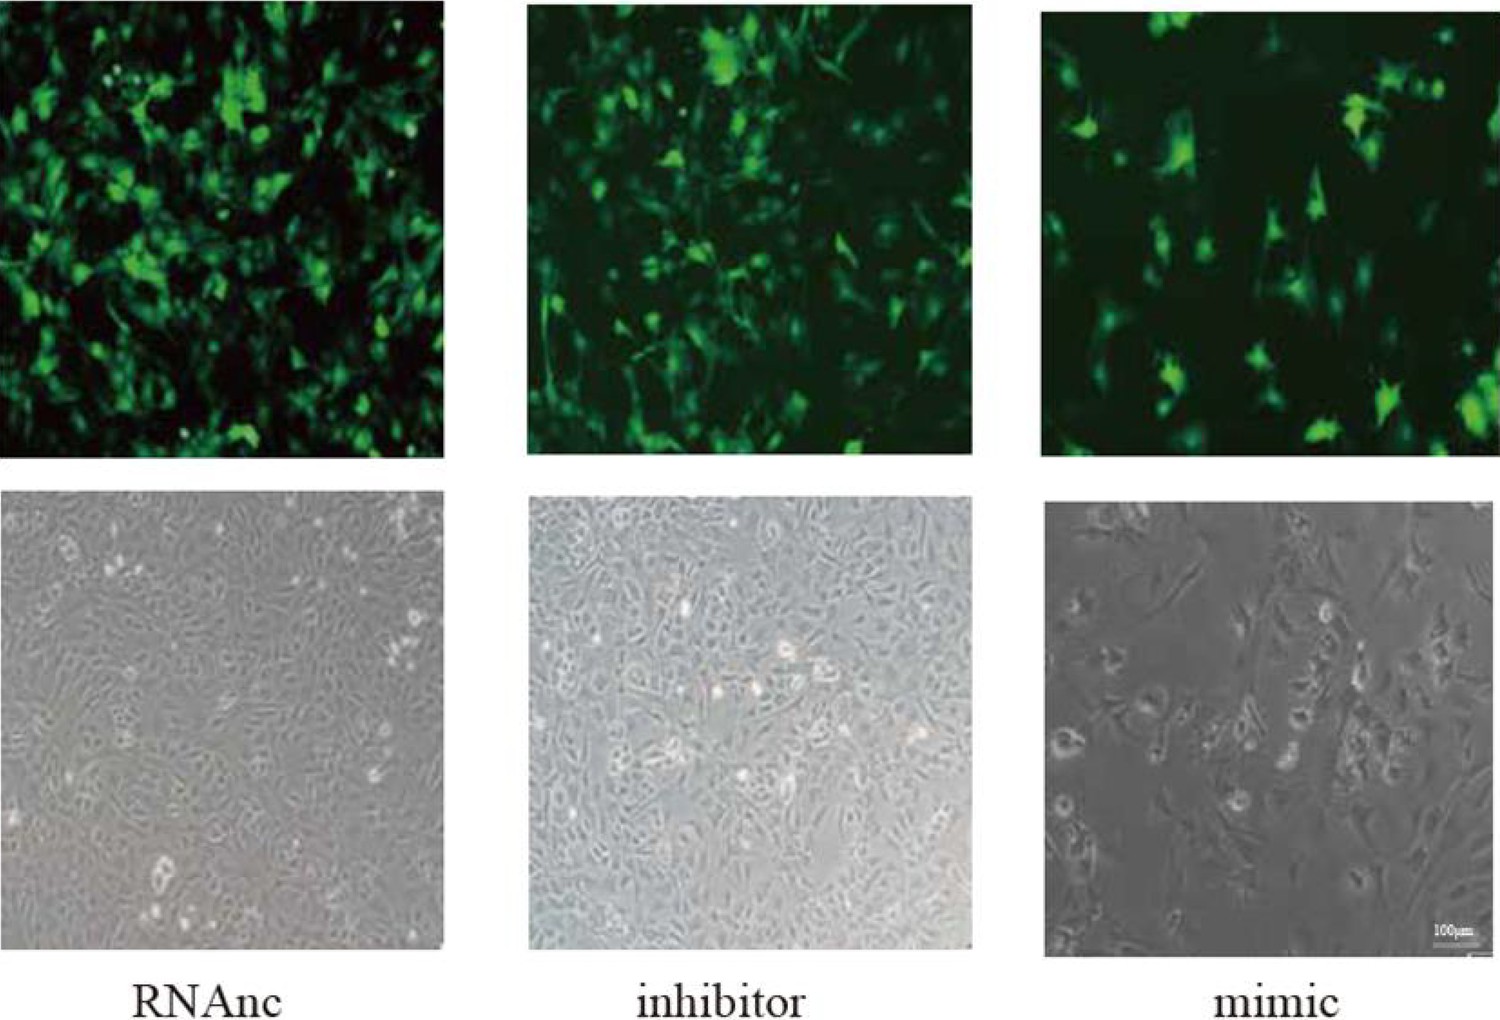
Fluorescence of adenovirus-infected chondrocytes.
Scale bar, 100 μm.
Figure 3—figure supplement 2

Primary mice chondrocytes we cultured (P1) and the secondary generation cells (P2) we used in the following experiment.
Scale bar, 100 μm (left), 50 μm (right).
Figure 4 with 1 supplement
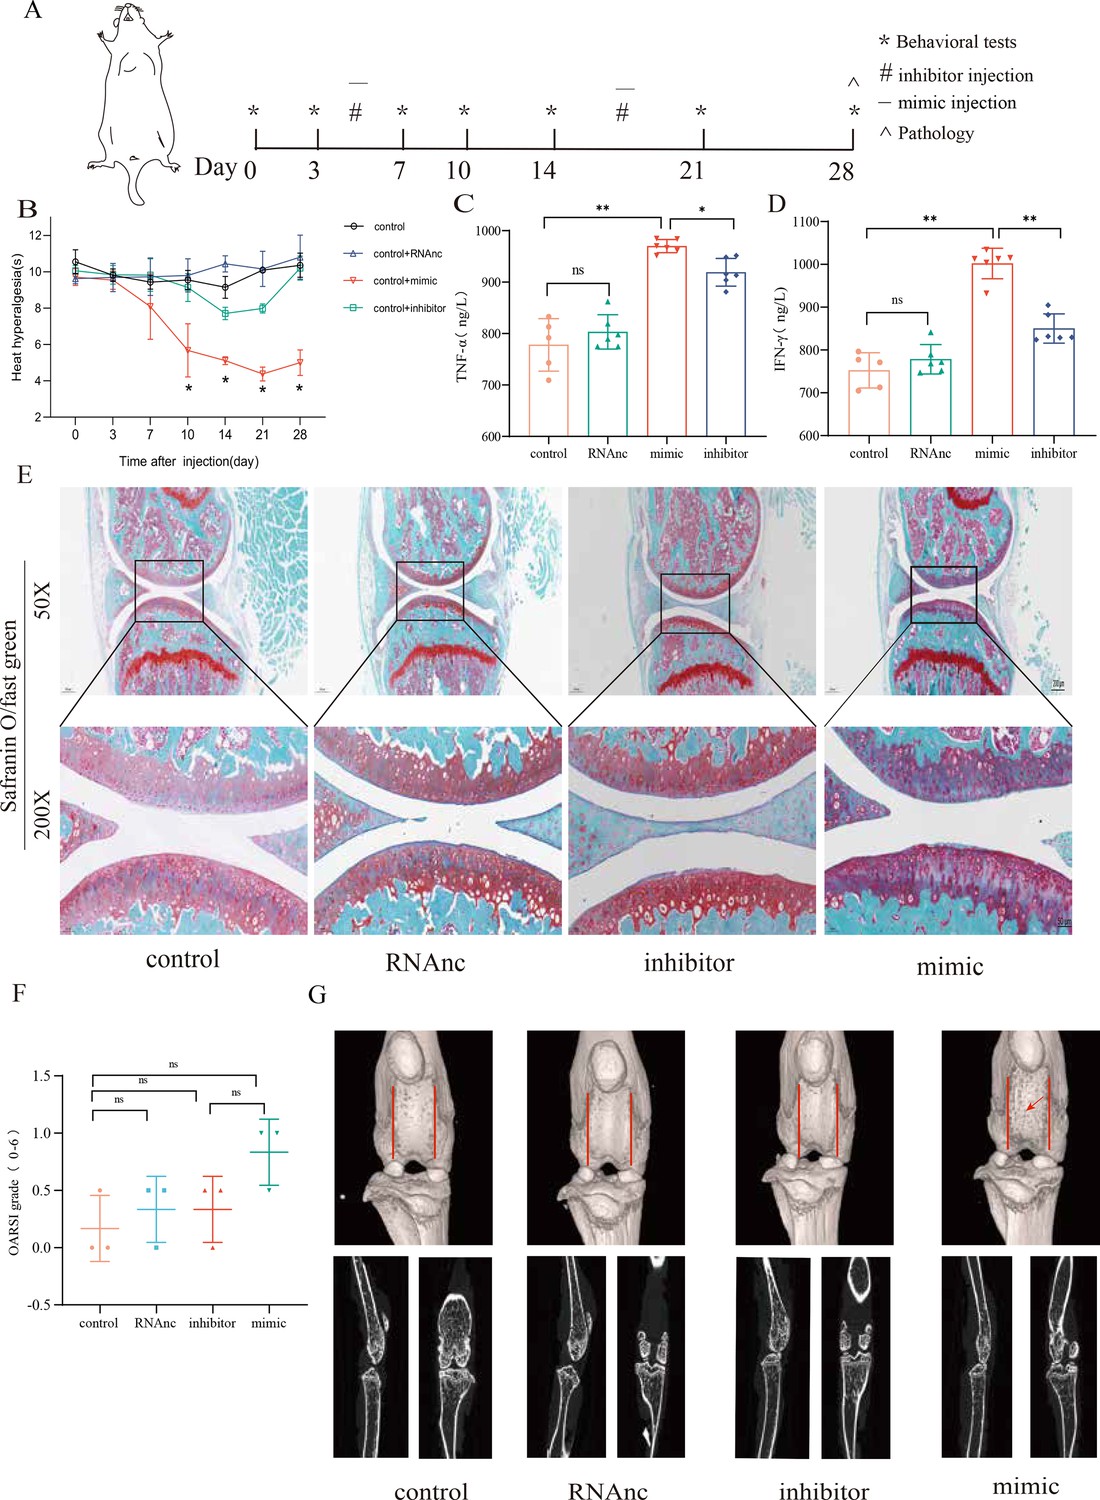
Injection of adenovirus expressing miR-199b-5p mimic results in inflammation and pain threshold sensitivity in mice.
(A) Animal experiment schematic. (B) Behavioral detection of animal thermal pain threshold. (C, D) Detection of serum levels of IFN-γ and TNF-α in controls by ELISA. (E, F) Safranin-fast green staining and semiquantitative scoring of articular cartilage. Scale bar = 200 μm (top), 50 μm (bottom). (G) 3D reconstruction and 2D images of joints from μCT scans. Data are shown as mean ± SD. *p<0.05, **p<0.01, n=6.
-
Figure 4—source data 1
Thermal pain of the original data in Figure 4B; ELISA of the original data in Figure 4C and D; OARSI scores of the original data in Figure 4F.
- https://cdn.elifesciences.org/articles/92645/elife-92645-fig4-data1-v1.xlsx
Figure 4—figure supplement 1
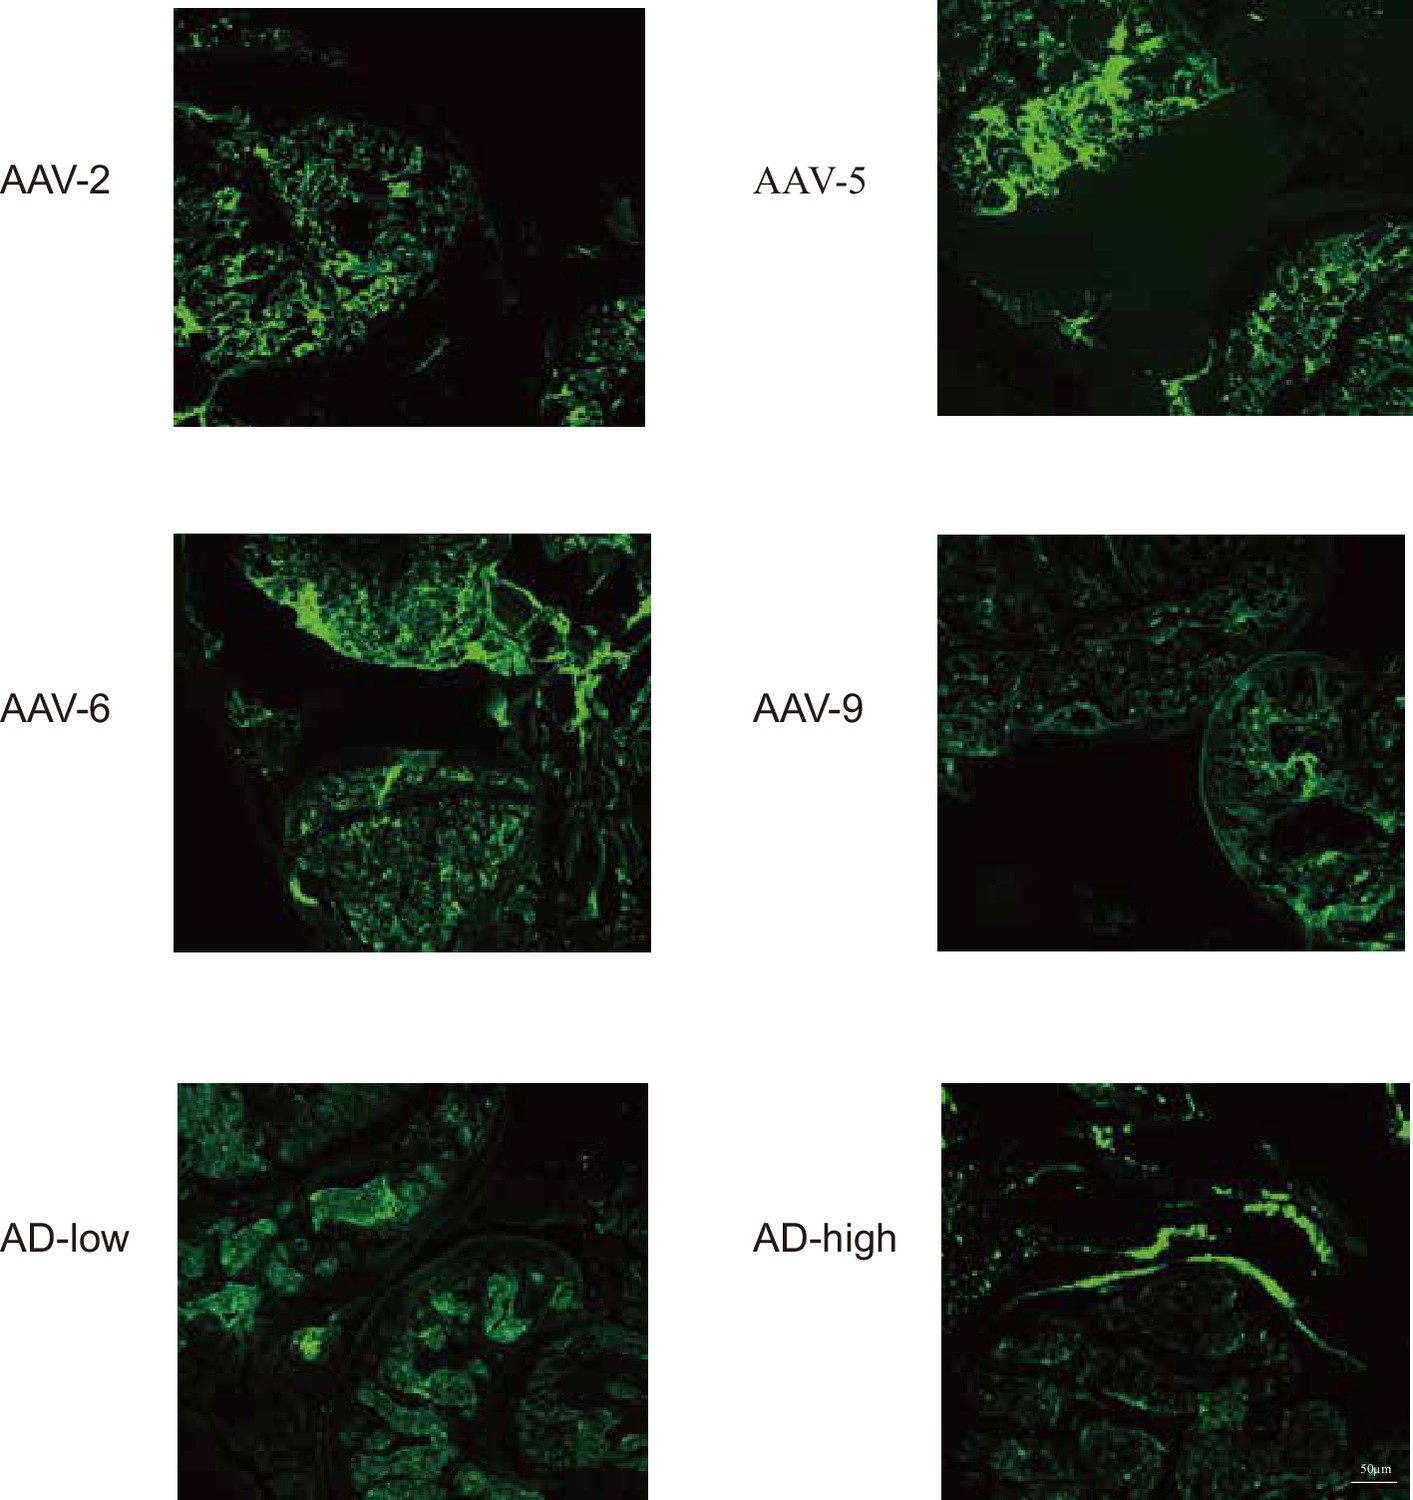
Expression of adenovirus in mouse knee joint.
Scale bar, 50 μm.
Figure 5 with 1 supplement
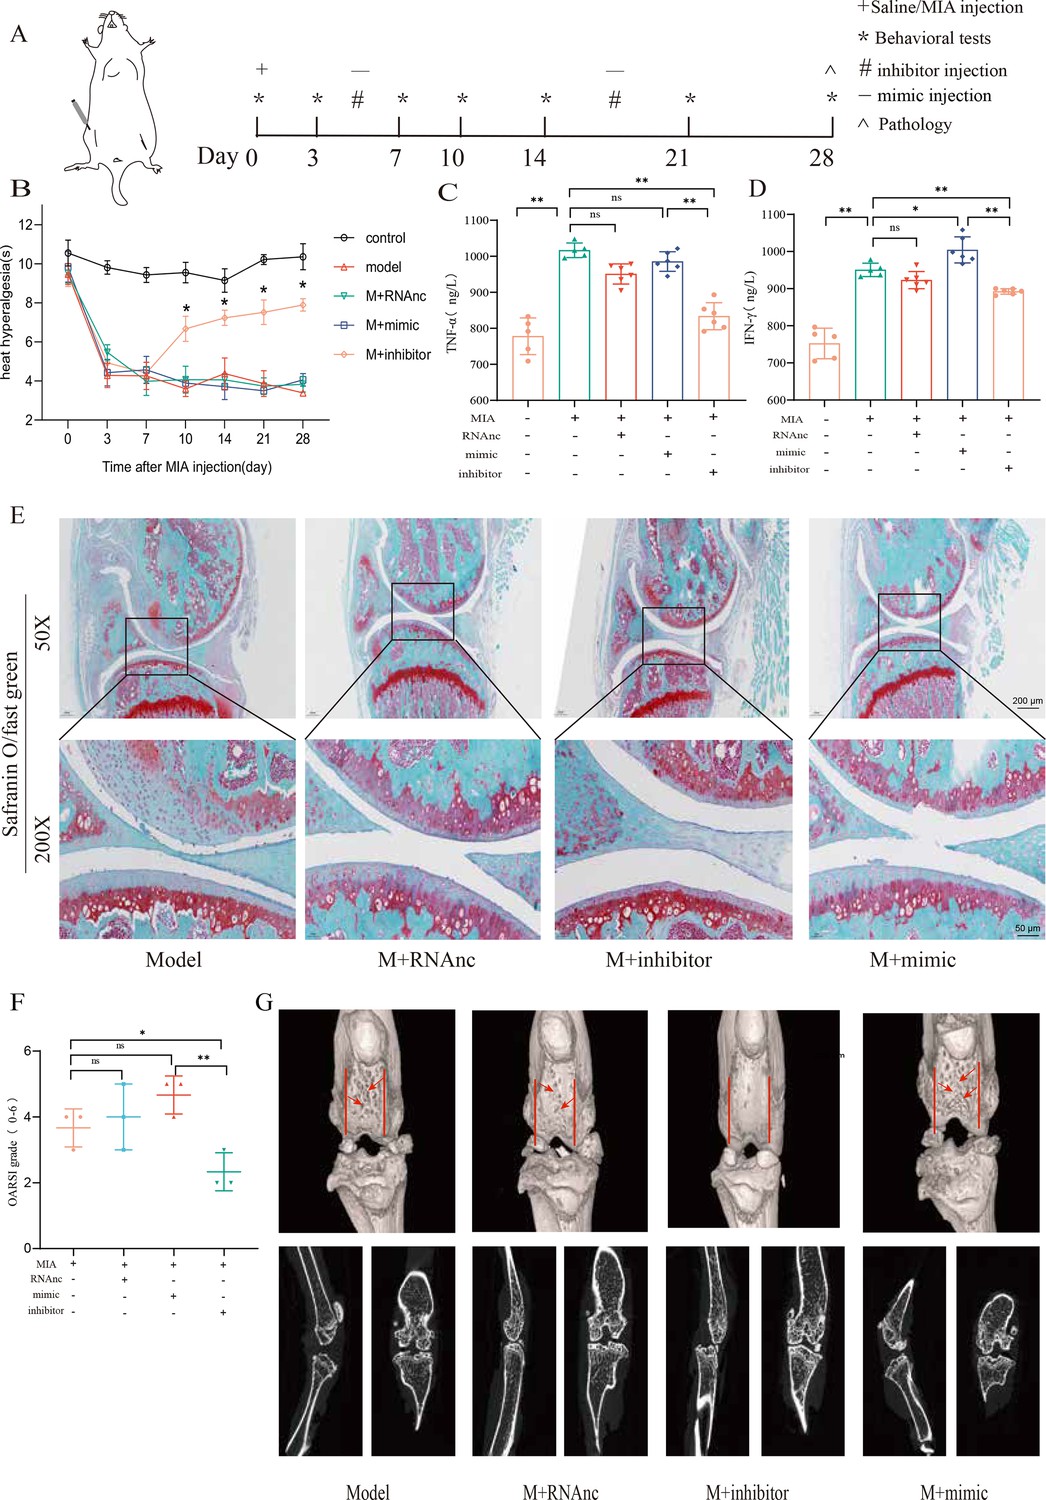
Injection of adenovirus expressing miR-199b-5p inhibitor partly recovered pathological changes in knee osteoarthritis (KOA) mice.
(A) Animal experiment schematic. (B) Behavioral detection of animal thermal pain threshold. (C, D) Detection of serum levels of IFN-γ and TNF-α in controls by ELISA. (E, F) Safranin-fast green staining and semiquantitative scoring of articular cartilage. Scale bar = 200 μm (top), 50 μm (bottom) (G) 3D reconstruction and 2D images of joints from μCT scans. Data are shown as mean ± SD. *p<0.05, **p<0.01, n=6.
-
Figure 5—source data 1
Thermal pain of the original data in Figure 5B; ELISA of the original data in Figure 5C and D; OARSI scores of the original data in Figure 5F.
- https://cdn.elifesciences.org/articles/92645/elife-92645-fig5-data1-v1.xlsx
Figure 5—figure supplement 1
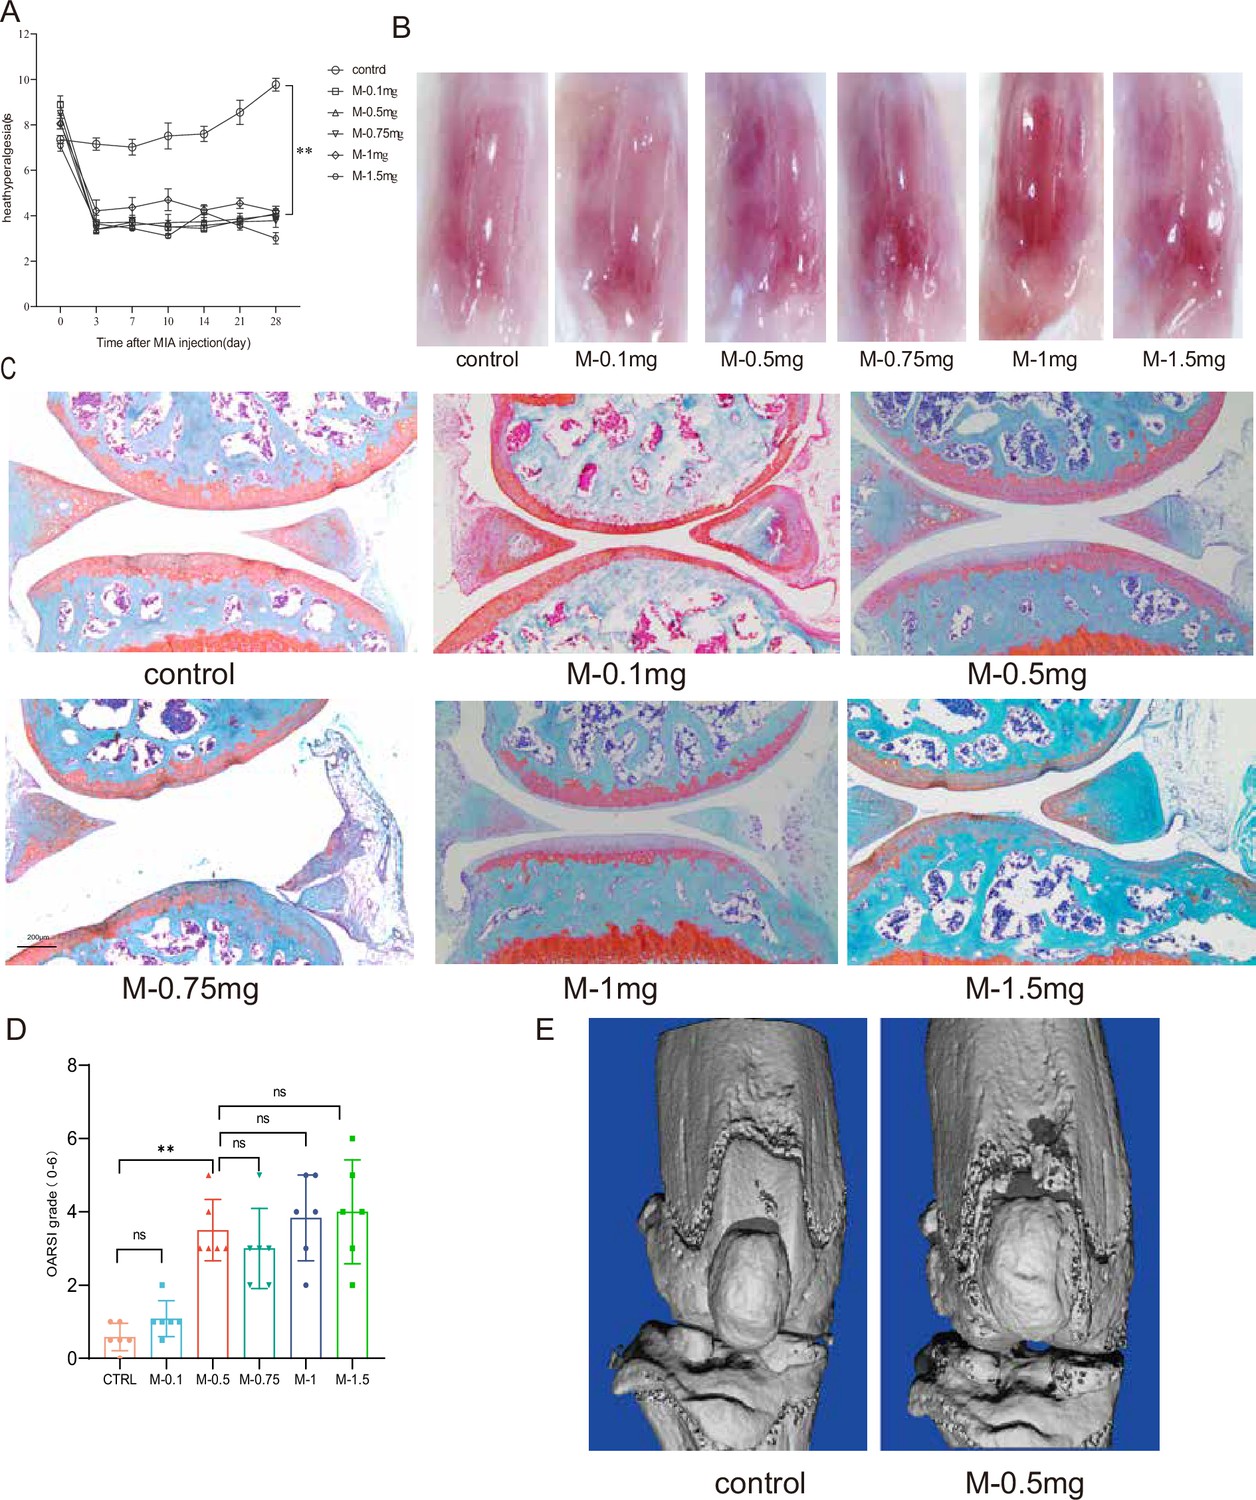
Establishment of knee osteoarthritis (KOA) model in mice by injection of MIA.
(A) Behavioral detection of animal thermal pain threshold. (B) Microscopic observation of the surface of the mouse knee joint. (C, D) Safranin-fast green staining and semiquantitative scoring of articular cartilage. Scale bar, 200 μm. (E) 3D reconstruction images of joints from μCT scans. *p<0.05, **p<0.01, n=6.
-
Figure 5—figure supplement 1—source data 1
Thermal pain of the original data in Figure 5—figure supplement 1A; OARSI scores of the original data in Figure 5—figure supplement 1D.
- https://cdn.elifesciences.org/articles/92645/elife-92645-fig5-figsupp1-data1-v1.xlsx
Figure 6 with 1 supplement
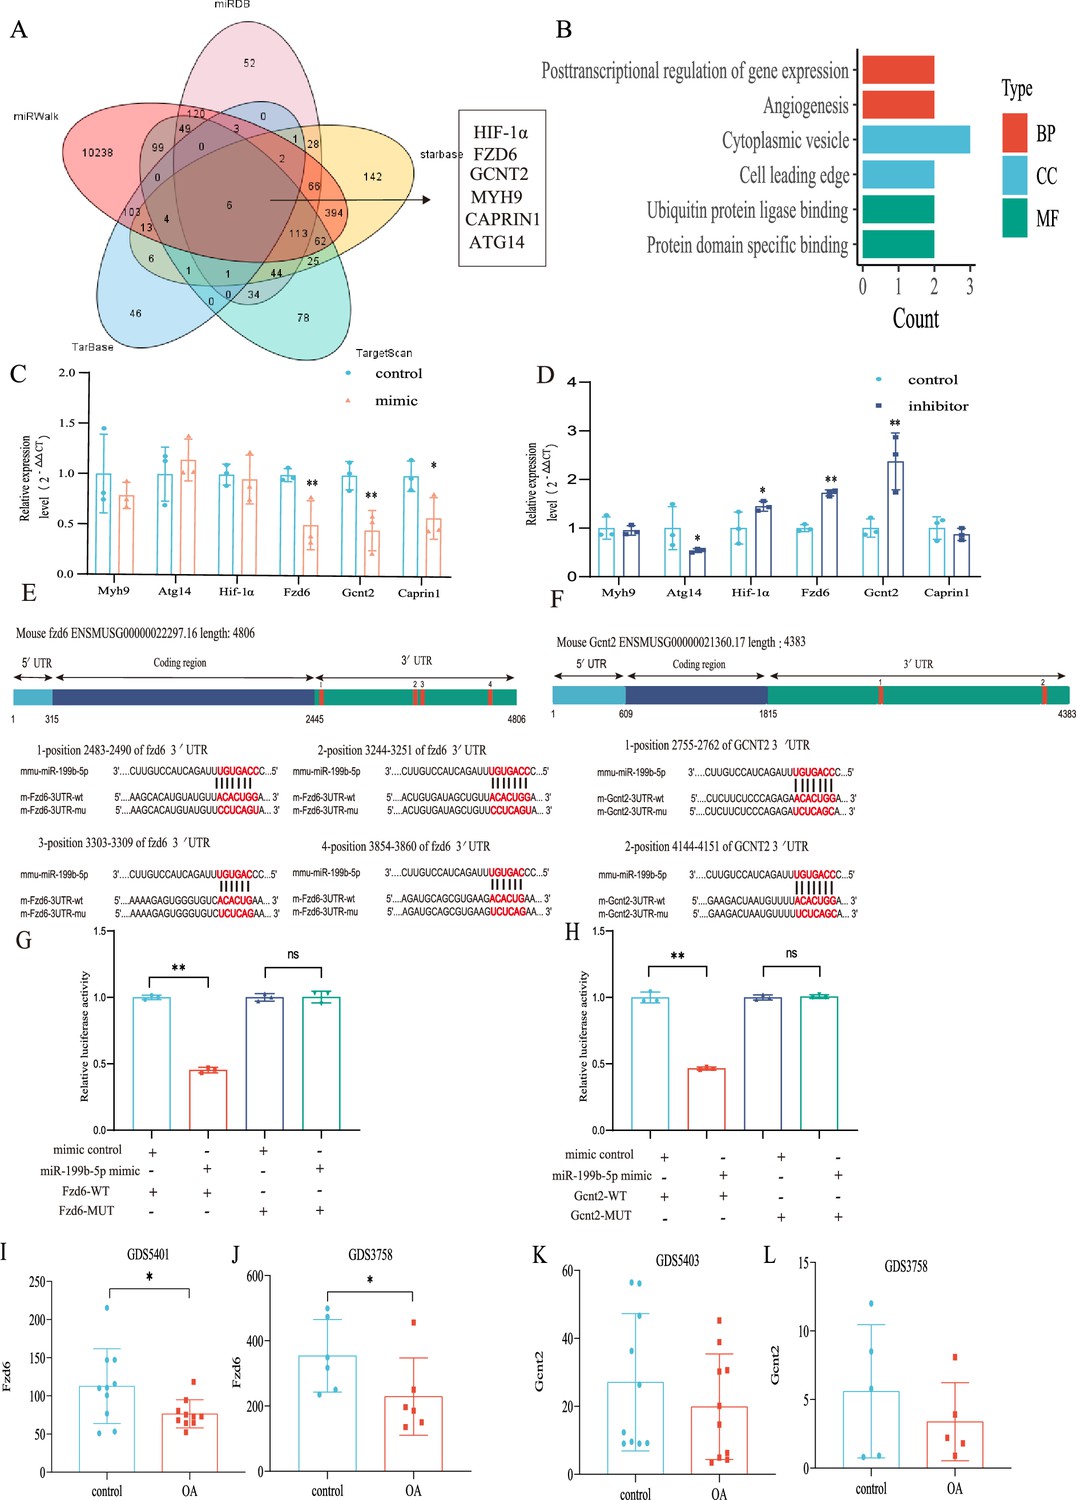
Validation of the miR-199b-5p target gene.
(A) Prediction of target genes of miR-199b-5p using search sites. (B) Target gene gene ontology (GO) analysis. (C, D) Detection of the expression of target genes under different conditions (n=3). (E, F) We use targetscan to predict the binding site of miR-199b-5p and target genes. (G, H) Validation by luciferase reporter gene assay (n=3). Data are show as mean ± SD.*p<0.05, **p<0.01, n=6. (I–L) The expression of Fzd6 and Gcnt2 in the synovial membrane and chondrocytes of GEO Profiles Knee OA (KOA).
-
Figure 6—source data 1
Original data of RT-qPCR in Figure 6C and D; Original data of luciferase assay in Figure 6G and H; Original data of GDS in Figure 6I–L.
- https://cdn.elifesciences.org/articles/92645/elife-92645-fig6-data1-v1.xlsx
-
Figure 6—source data 2
We predicted the potential binding sites of miRNA-199b-5p in the 3'-untranslated regions (UTRs) of two target genes, Fzd6 and Gcnt2, in both human and mouse.
- https://cdn.elifesciences.org/articles/92645/elife-92645-fig6-data2-v1.docx
Figure 6—figure supplement 1
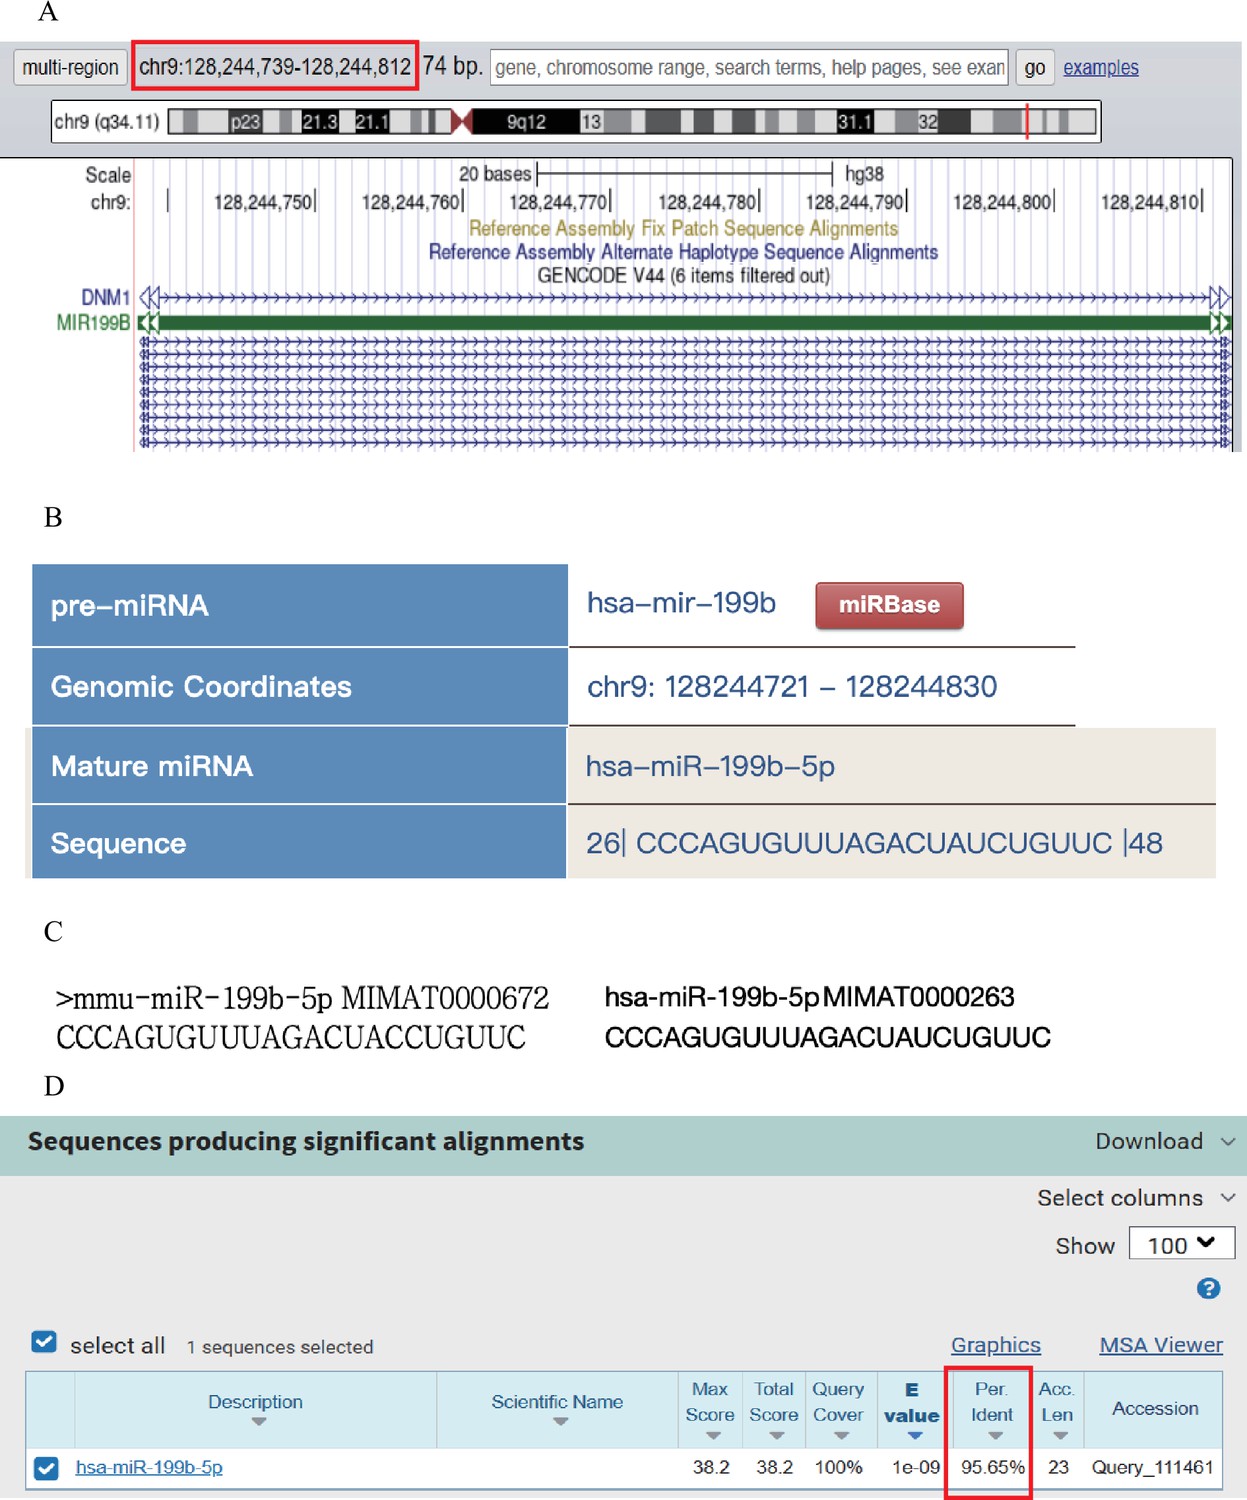
Comparative analysis of sequence conservatism between human and mouse.
(A) By using the sequence information of mmu_miRNA-199b-5p, we located the position of its human homologous sequence in the UCSC database. (B) Based on the positional information and the source gene, we further aligned this position with the closest miRNA in miRbase. (C) We compared the sequences of hsa_miR-199b-5p and mmu_miR-199b-5p. (D) Conservation analysis was performed to compare the sequence conservation of miR-199b-5p.
Figure 7

miR-199b-5p exerts its effects on in vitro cells and in vivo mice by potentially targeting Fzd6 and Gcnt2.
Author response image 1

Venn diagram showing differentially expressed miRNAs in the OA group compared with healthy patients and patients who recovered after acupuncture treatment.
Author response image 2

Comparative analysis of sequence conservatism between human and mouse.
(A) The position of its human homologous sequence in the UCSC database. (B) Position of the closest miRNA in miRbase. (C) Sequences of hsa_miR-199b-5p and mmu_miR-199b-5p. (D) Sequence conservation of miR-199b-5p.
Author response image 3

Primary mice chondrocytes we cultured (P1) and the secondary generation cells (P2) we used in the following experiment.
Author response image 4

Venn diagram showing differentially expressed miRNAs in the OA group compared with healthy patients and patients who recovered after acupuncture treatment.
Author response image 5

Primary mice chondrocytes we cultured (P1) and the secondary generation cells (P2) we used in the following experiment.
Additional files
-
Supplementary file 1
Supplement table 1: Primers list; Supplement table 2: Basic information of participants.
- https://cdn.elifesciences.org/articles/92645/elife-92645-supp1-v1.docx
-
Source data 1
Original data of Basic information for recruiting patients is in Supplementary file 1, Supplement table 2.
- https://cdn.elifesciences.org/articles/92645/elife-92645-data1-v1.xlsx
-
MDAR checklist
- https://cdn.elifesciences.org/articles/92645/elife-92645-mdarchecklist1-v1.docx
Download links
A two-part list of links to download the article, or parts of the article, in various formats.
Downloads (link to download the article as PDF)
Open citations (links to open the citations from this article in various online reference manager services)
Cite this article (links to download the citations from this article in formats compatible with various reference manager tools)
Inhibition of miR-199b-5p reduces pathological alterations in osteoarthritis by potentially targeting Fzd6 and Gcnt2
eLife 12:RP92645.
https://doi.org/10.7554/eLife.92645.3


