Relationship between circulating FSH levels and body composition and bone health in patients with prostate cancer who undergo androgen deprivation therapy: The BLADE study
- Medical Oncology Unit, ASST Spedali Civili, Department of Medical and Surgical Specialties, Radiological Sciences and Public Health, University of Brescia, Italy
- Division of Urology, Department of Translational Medicine, University of Eastern Piedmont, Maggiore Della Carità Hospital, Italy
- Urology Unit, ASST Spedali Civili, Department of Medical and Surgical Specialties, Radiological Sciences and Public Health, University of Brescia, Italy
- Radiation Oncology Unit, ASST Spedali Civili, Department of Medical and Surgical Specialties, Radiological Sciences and Public Health, University of Brescia, Italy
- Tecnologie Avanzate S.r.l, Italy
- Radiology Unit, ASST Spedali Civili, Department of Medical and Surgical Specialties, Radiological Sciences and Public Health, University of Brescia, Italy
- Division of Biotechnology, Department of Molecular and Translational Medicine (DMTM), University of Brescia, Italy
- Urology Unit, AOUI Verona, Department of Surgery, Dentistry, Pediatrics and Gynecology, University of Verona, Italy
- Department of Biomedical Sciences, Humanitas University, Pieve Emanuele-Milan, Italy
- Endocrinology, Diabetology and Medical Andrology Unit, Metabolic Bone Diseases and Osteoporosis Section, IRCCS Humanitas Research Hospital,, Italy
Figures
Figure 1 with 1 supplement
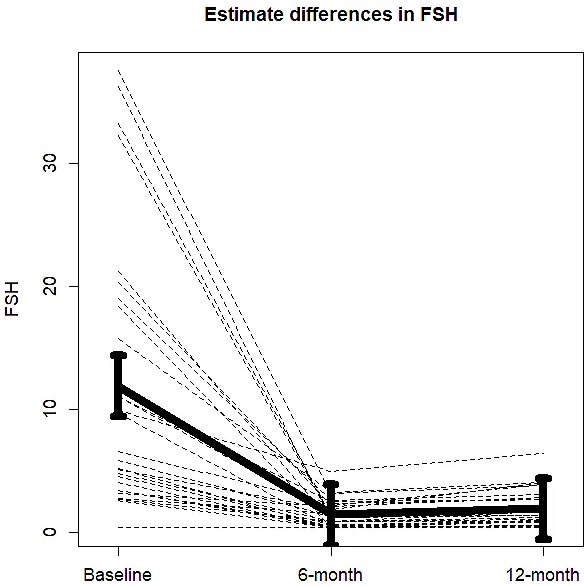
Changes in mean follicle-stimulating hormone (FSH) serum levels from baseline to 6 and 12 months of degarelix treatment.
-
Figure 1—source data 1
Data are from BLADE study database.
- https://cdn.elifesciences.org/articles/92655/elife-92655-fig1-data1-v1.xls
Figure 1—figure supplement 1
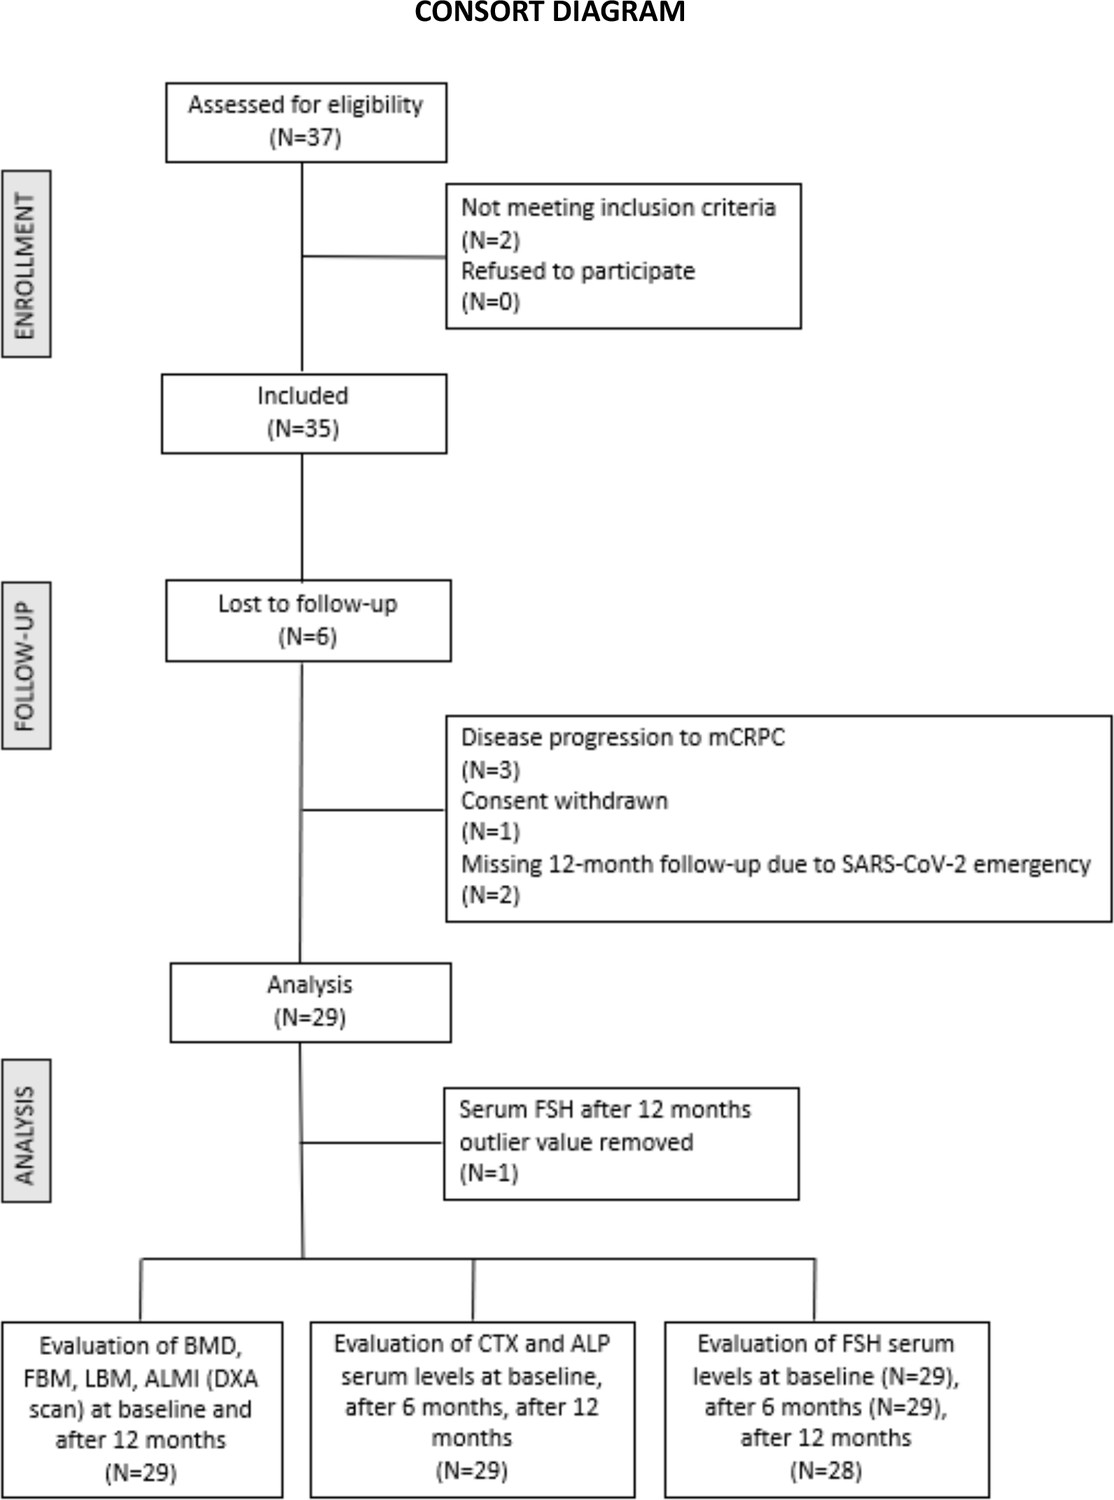
Consort diagram.
Figure 2
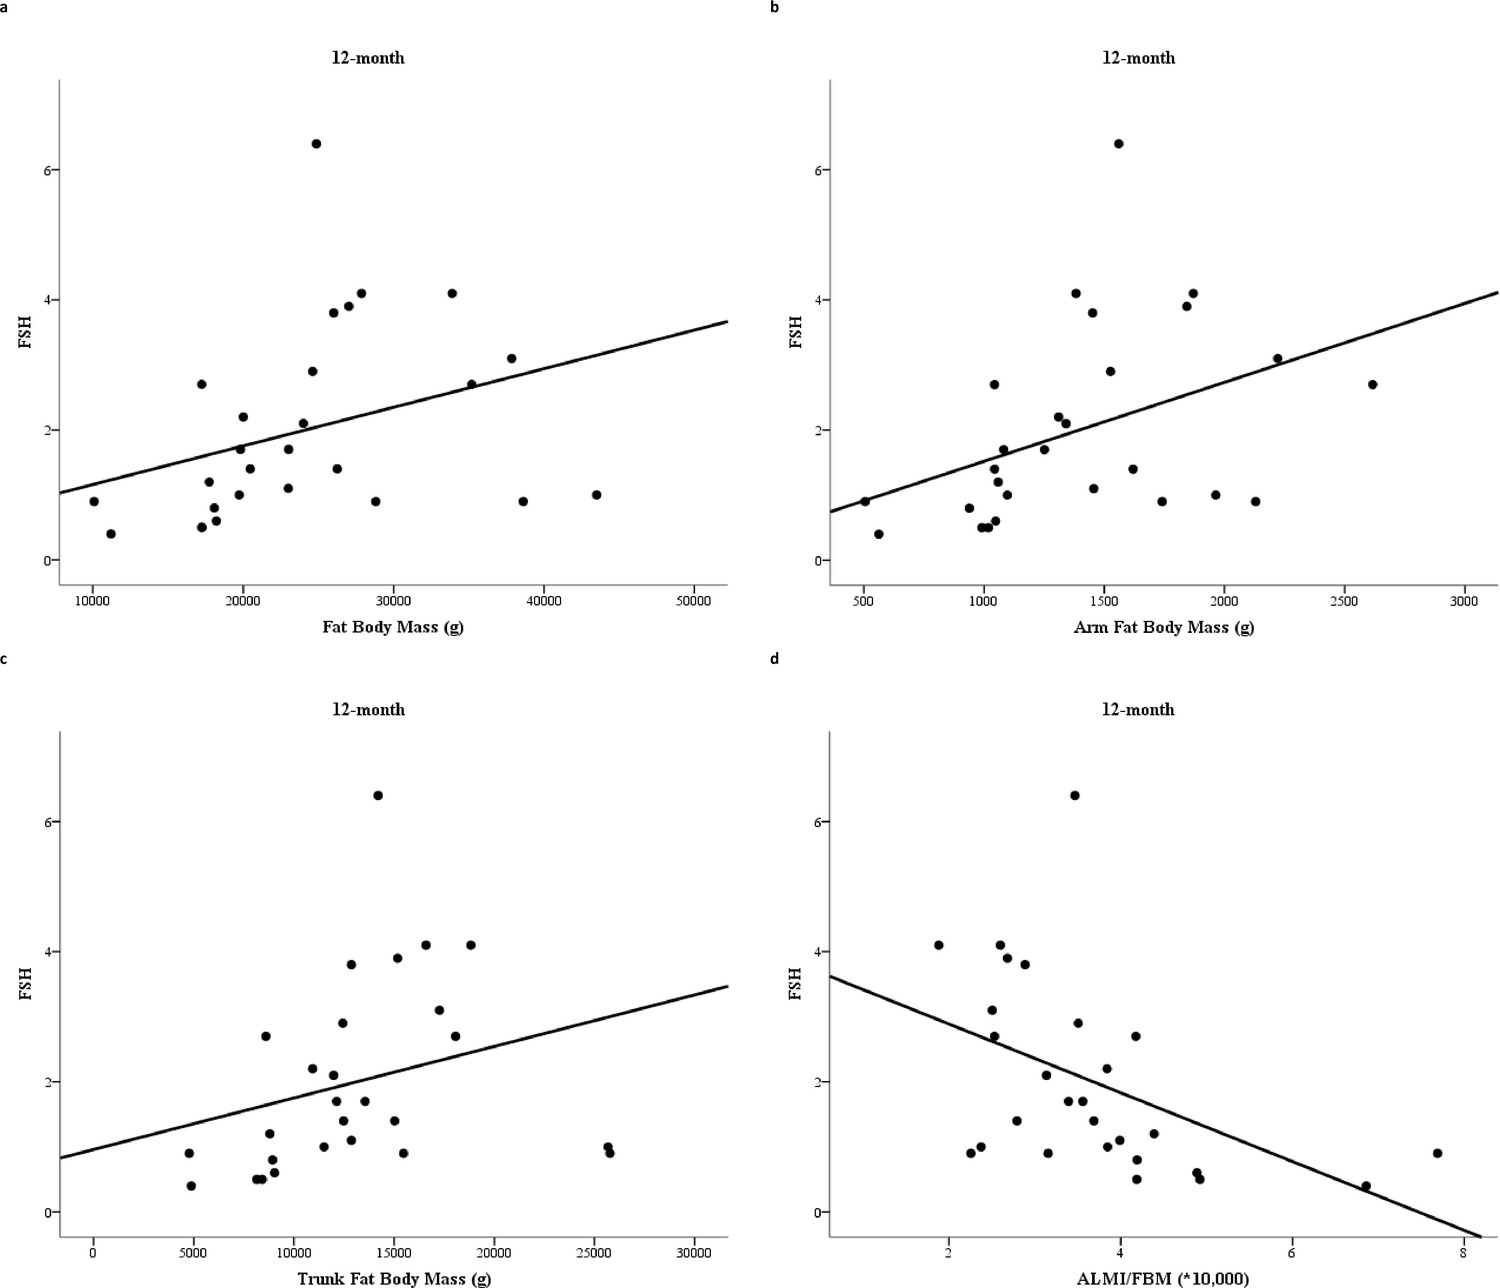
Relationship between follicle-stimulating hormone (FSH) serum levels and fat body mass (FBM) (a), arm FBM (b), trunk FBM (c), and appendicular lean mass index (ALMI)/FBM ratio (d) after 12 months degarelix treatment.
R = Spearman correlation coefficient; p = p-value.
Tables
Table 1
Baseline relationships between FSH serum levels and BMD, bone turnover markers, and body composition parameters.
| FSH | ||
|---|---|---|
| Correlation coefficient | p | |
| TOT BMD | 0.240 | 0.218 |
| BMD LEFT HIP | 0.229 | 0.240 |
| BMD L2–L4 | 0.148 | 0.453 |
| CTX | −0.115 | 0.560 |
| BONE ALP | 0.001 | 0.997 |
| TOT fat (g) | 0.274 | 0.158 |
| Arm fat (g) | 0.363 | 0.058 |
| Leg fat (g) | 0.330 | 0.087 |
| Head fat (g) | 0.228 | 0.244 |
| Trunk fat (g) | 0.249 | 0.202 |
| TOT lean (g) | 0.216 | 0.270 |
| Arm lean (g) | 0.166 | 0.400 |
| Leg lean (g) | 0.197 | 0.315 |
| Head lean (g) | 0.250 | 0.199 |
| Trunk lean (g) | 0.190 | 0.333 |
| ALMI (appendicular lean/Ht2) | 0.269 | 0.167 |
| ALMI/FBM | −0.184 | 0.349 |
| Android/gynoid ratio | −0.024 | 0.902 |
-
Data are Spearman R.
-
FSH: follicle-stimulating hormone; TOT: total; BMD: bone mineral density; CTX: C-terminal telopeptide of type I collagen; ALP: alkaline phosphatase; ALMI: appendicular lean mass index; Ht2: height squared; FBM: fat body mass.
Table 2
Relationships between FSH serum levels and BMD, bone turnover markers, and body composition parameters after 12 months degarelix treatment.
| FSH at 6 months | FSH at 12 months | |||
|---|---|---|---|---|
| Correlation coefficient | p | Correlation coefficient | p | |
| TOT BMD | −0.039 | 0.843 | −0.107 | 0.595 |
| BMD L2–L4 | 0.102 | 0.604 | −0.040 | 0.844 |
| BMD LEFT HIP | 0.030 | 0.881 | −0.044 | 0.829 |
| CTX | 0.051 | 0.796 | 0.055 | 0.785 |
| BONE ALP | 0.174 | 0.376 | 0.227 | 0.256 |
| TOT fat (g) | 0.490 | 0.008 | 0.518 | 0.006 |
| Arm fat (g) | 0.532 | 0.004 | 0.541 | 0.004 |
| Leg fat (g) | 0.454 | 0.015 | 0.328 | 0.089 |
| Head fat (g) | 0.187 | 0.341 | 0.093 | 0.644 |
| Trunk fat (g) | 0.483 | 0.009 | 0.452 | 0.018 |
| TOT lean (g) | 0.029 | 0.885 | −0.036 | 0.859 |
| Arm lean (g) | 0.041 | 0.837 | 0.028 | 0.889 |
| Leg lean (g) | −0.176 | 0.371 | −0.285 | 0.149 |
| Head lean (g) | 0.086 | 0.663 | −0.006 | 0.977 |
| Trunk lean (g) | 0.161 | 0.414 | 0.021 | 0.916 |
| ALMI (appendicular lean/Ht2) | −0.229 | 0.241 | −0.265 | 0.181 |
| ALMI/FBM | −0.581 | 0.001* | −0.604 | 0.001* |
| Android/gynoid ratio | 0.142 | 0.472 | 0.231 | 0.246 |
-
Data are Spearman R.
-
Bold values are those attaining statistical significance.
-
*
Still significant after Bonferroni correction.
-
FSH: follicle-stimulating hormone; TOT: total; BMD: bone mineral density; CTX: C-terminal telopeptide of type I collagen; ALP: alkaline phosphatase; ALMI: appendicular lean mass index; Ht2: height squared; FBM: fat body mass.
Additional files
-
Supplementary file 1
Clinical and demographical data of enrolled patients at baseline.
- https://cdn.elifesciences.org/articles/92655/elife-92655-supp1-v1.docx
-
MDAR checklist
- https://cdn.elifesciences.org/articles/92655/elife-92655-mdarchecklist1-v1.pdf
-
Reporting standard 1
STROBE statement for prospective study.
- https://cdn.elifesciences.org/articles/92655/elife-92655-repstand1-v1.pdf
Download links
A two-part list of links to download the article, or parts of the article, in various formats.
Downloads (link to download the article as PDF)
Open citations (links to open the citations from this article in various online reference manager services)
Cite this article (links to download the citations from this article in formats compatible with various reference manager tools)
Relationship between circulating FSH levels and body composition and bone health in patients with prostate cancer who undergo androgen deprivation therapy: The BLADE study
eLife 13:e92655.
https://doi.org/10.7554/eLife.92655


