A novel imaging method (FIM-ID) reveals that myofibrillogenesis plays a major role in the mechanically induced growth of skeletal muscle
- School of Veterinary Medicine and the Department of Comparative Biosciences, University of Wisconsin-Madison, United States
- Department of Anatomy and Embryology, Faculty of Veterinary Medicine, Sohag University, Egypt
- School of Kinesiology, Auburn University, United States
Figures
Figure 1 with 1 supplement
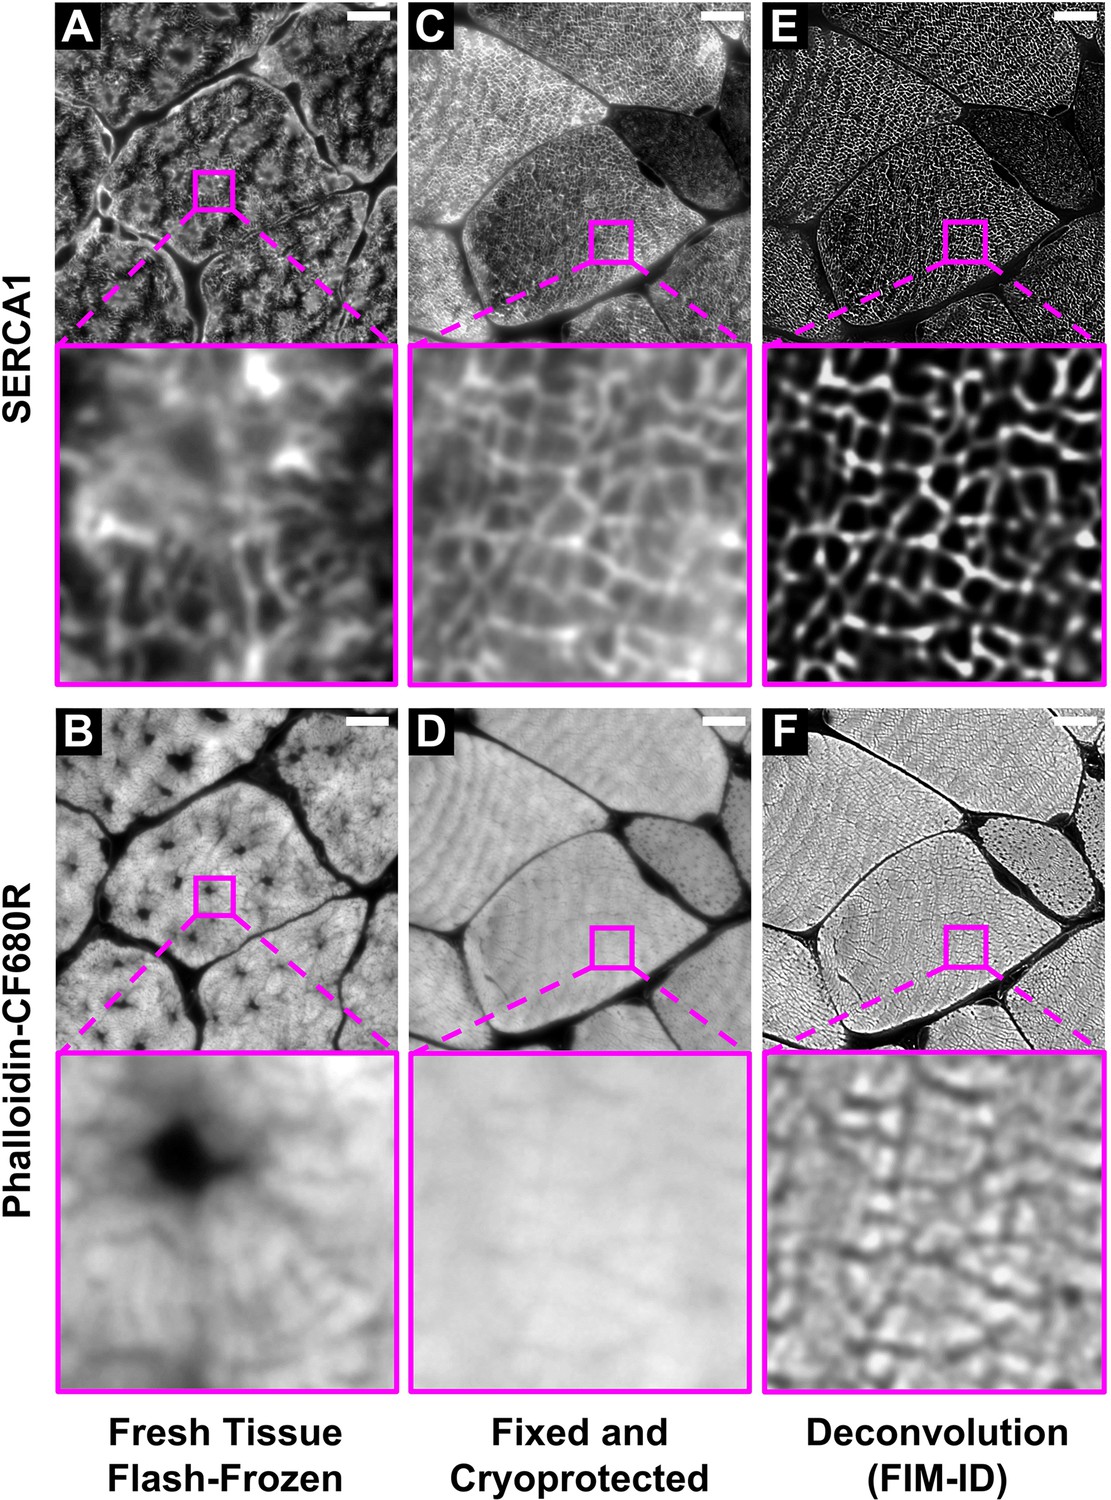
Optimization of the fixation, cryoprotection, and sectioning conditions for fluorescence imaging of myofibrils with image deconvolution (FIM-ID).
Plantaris muscles from mice were collected and either (A–B) immediately flash-frozen and sectioned at –20°C, or (C–D) subjected to optimized fixation, cryoprotection, and sectioning conditions. Cross-sections of the muscles were stained with phalloidin-CF680R to identify F-actin and SERCA1 was immunolabeled with Alexa 594 to identify the periphery of the myofibrils. Images of SERCA1 (top) and F-actin (bottom) were captured from identical regions with a widefield fluorescence microscope. (E–F) The images in C–D were subjected to deconvolution. Scale bars = 10 μm.
Figure 1—figure supplement 1
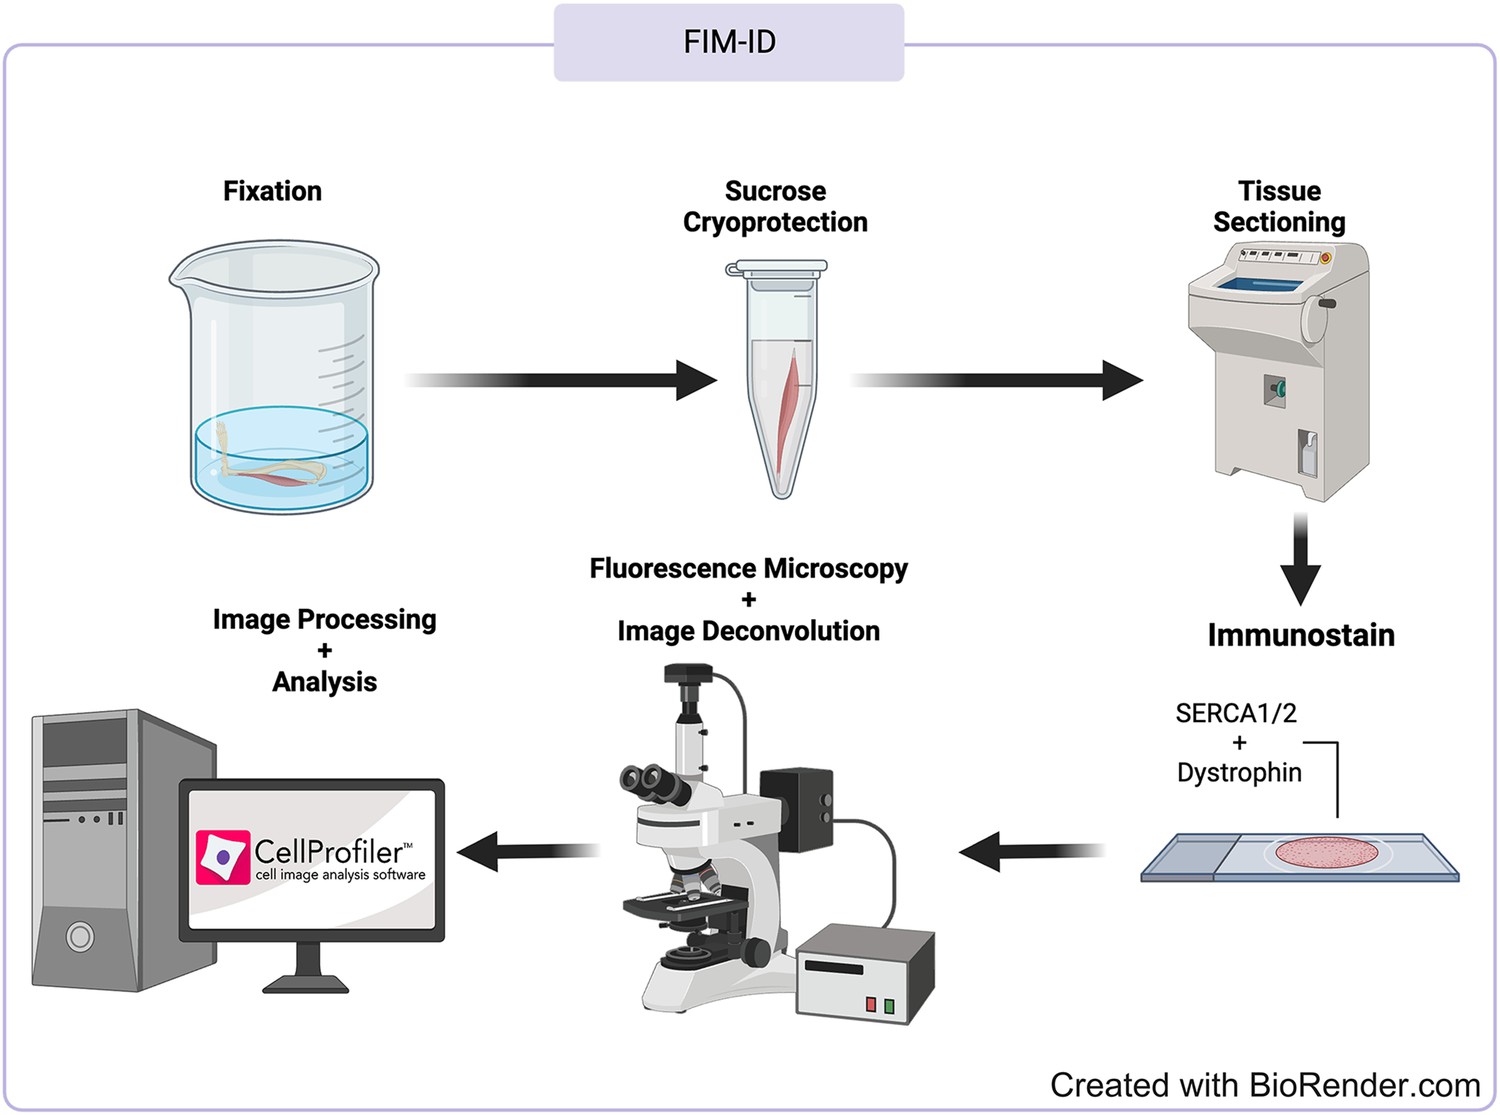
Overview of the fluorescence imaging of myofibrils with image deconvolution (FIM-ID) workflow.
© 2024, BioRender Inc. Figure 1—figure supplement 1 was created using BioRender, and is published under a CC B-NC-ND license. Further reproductions must adhere to the terms of this license.
Figure 2
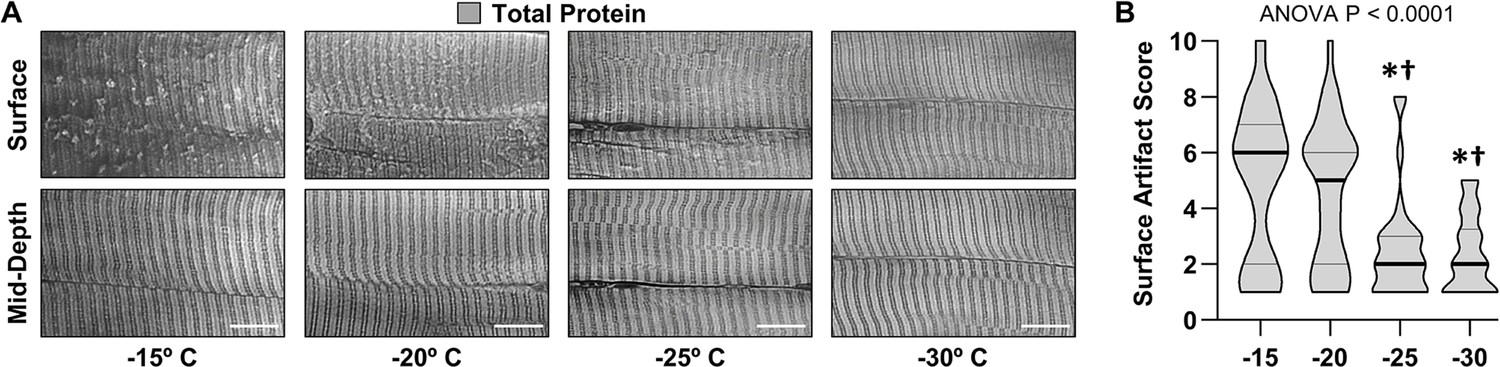
The effect of sectioning temperature on surface artifacts.
An EDL muscle from a mouse was fixed with 4% paraformaldehyde, cryoprotected with 45% sucrose, and longitudinally sectioned at −15, –20, –25, or –30°C. The sections were stained for total protein and then five randomly selected regions of interest (ROIs) were imaged. Each fiber within the ROIs was scored for the presence of artifacts on the surface (a score of 1 indicates no artifacts and a score of 10 indicates extensive distortions). (A) Representative images from the surface and mid-depth of the sections. (B) Violin plot of the surface scores for the fibers at each of the different sectioning temperatures. Thick bars represent the median and thin bars represent the quartiles, n=28–39 fibers/group. Data was analyzed with one-way ANOVA. Significantly different from, * –15°C, † –20°C. Scale bars = 10 μm. Data used to generate B is provided in Figure 2—source data 1.
-
Figure 2—source data 1
Source data used to generate Figure 2B.
- https://cdn.elifesciences.org/articles/92674/elife-92674-fig2-data1-v1.xlsx
Figure 3
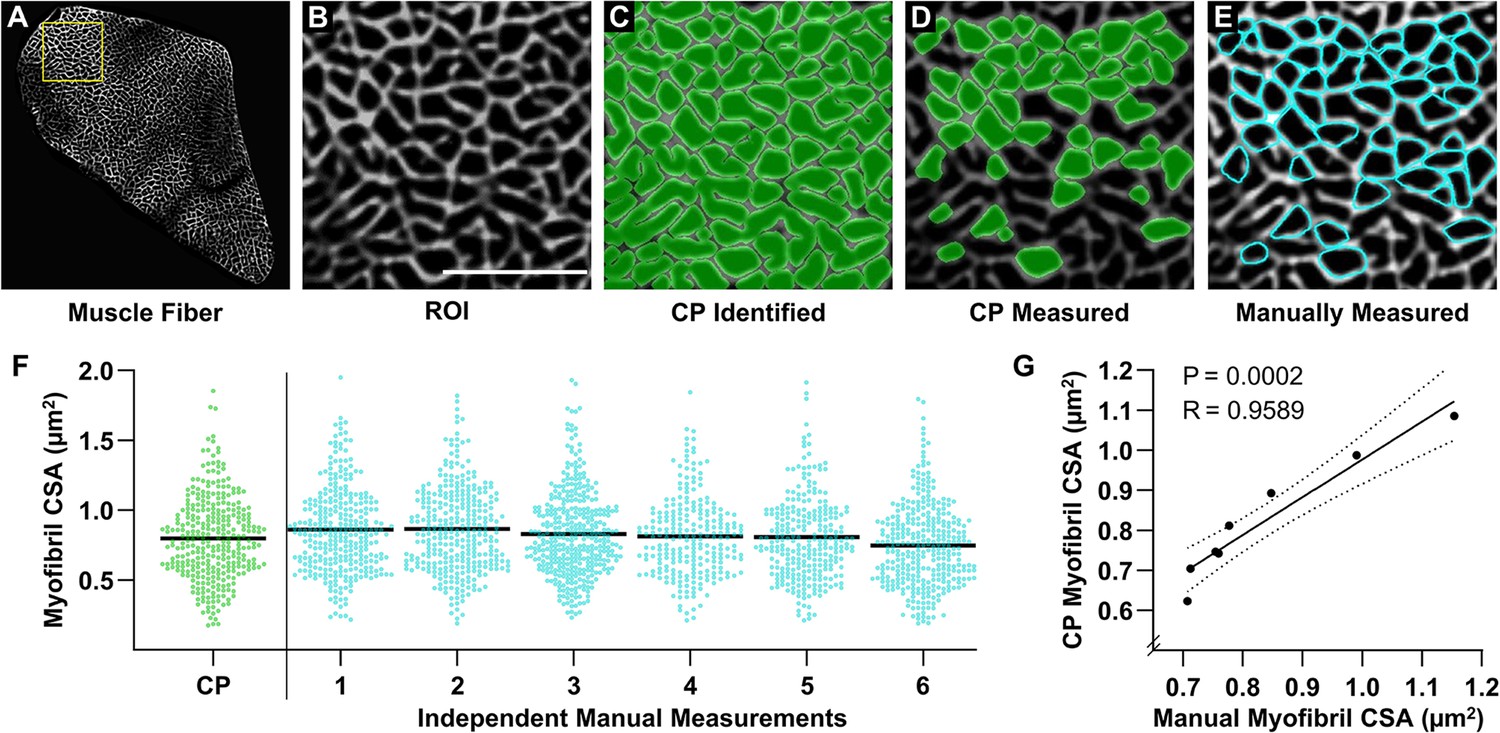
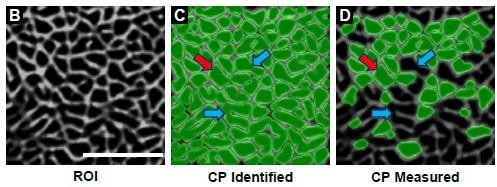
Validation of an automated pipeline for measuring myofibril size with fluorescence imaging of myofibrils with image deconvolution (FIM-ID).
A cross-section from a mouse plantaris muscle was subjected to FIM-ID, and then eight regions of interest (ROIs) from a fiber (A) were subjected to automated and manual measurements of myofibril size. (B) Representation of an ROI from the fiber in A, scale bar = 5 μm. (C) Example of how the automated CellProfiler (CP) pipeline identifies the myofibrils (green). (D) Illustration of the myofibrils in CP that met the morphological criteria for subsequent measurements of cross-sectional area (CSA). (E) Example of the same ROI in B–D that was manually assessed for myofibrils that met the morphological criteria for subsequent measurements of CSA (cyan). (F) Scatter plot of the CSA of all myofibrils that were automatically measured by CP, or manually measured by independent investigators (n=6 investigators). The black bars represent the mean for each group. (G) For each ROI, the mean myofibril CSA as determined by CP was compared with the mean myofibril CSA from all of the manual measurements. The solid line represents the best fit from linear regression, the dashed lines represent the 95% confidence intervals, R indicates Pearson’s correlation coefficient, and p indicates the likelihood that the relationship is significantly different from zero. Data used to generate F–G is provided in Figure 3—source data 1.
-
Figure 3—source data 1
Source data used to generate Figure 3F–G.
- https://cdn.elifesciences.org/articles/92674/elife-92674-fig3-data1-v1.xlsx
Figure 4 with 3 supplements
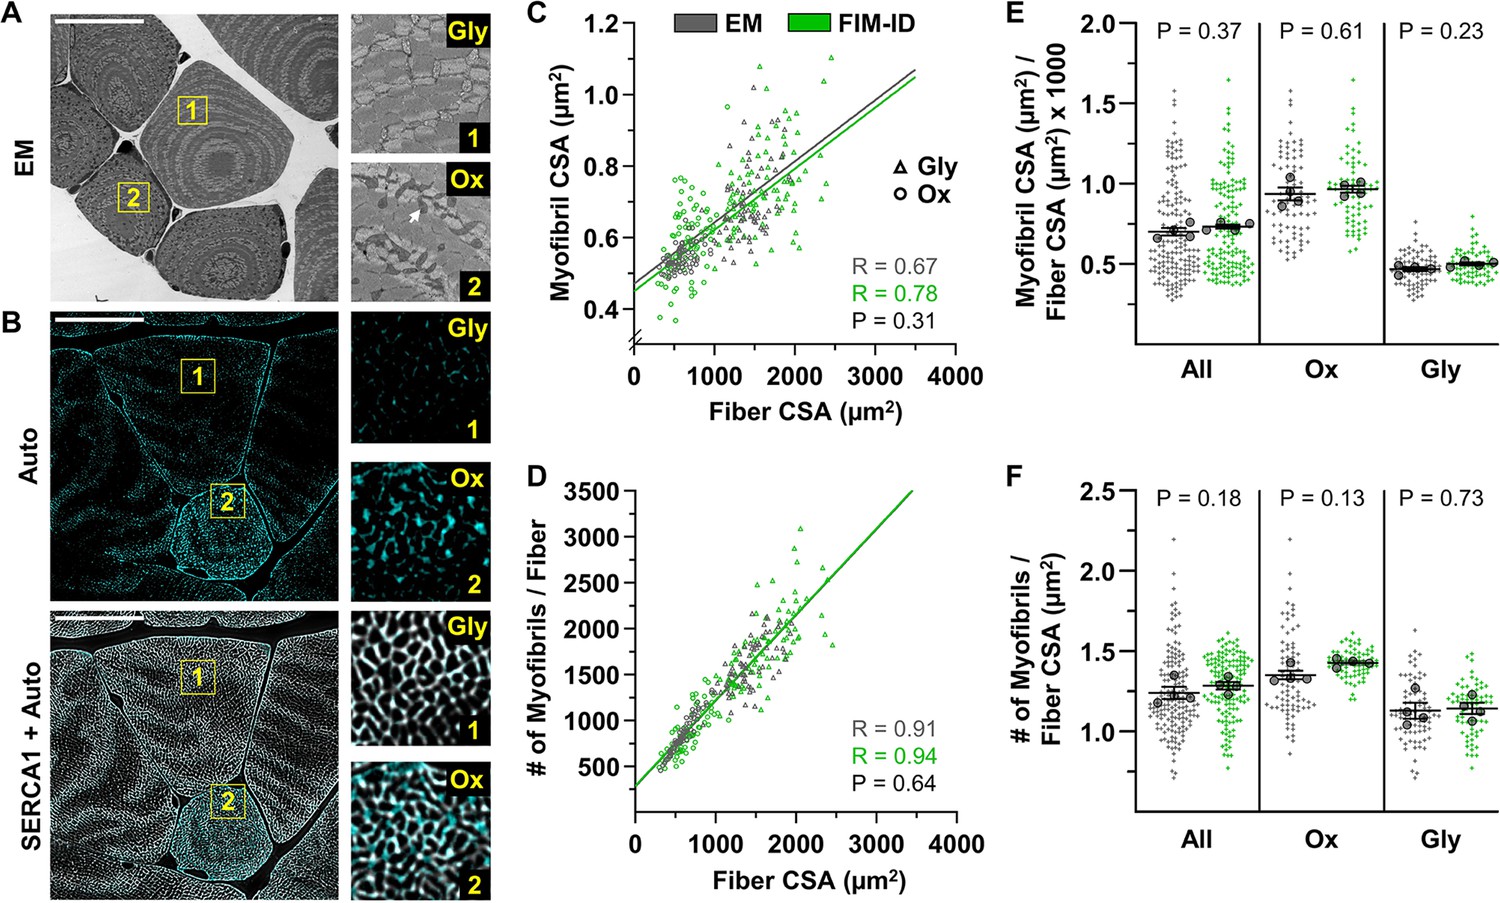
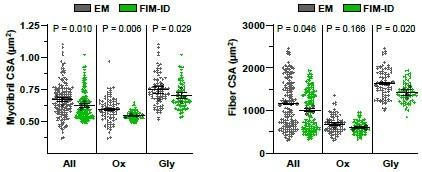
Automated measurements of myofibril size and number with fluorescence imaging of myofibrils with image deconvolution (FIM-ID) versus manual measurements with electron microscopy (EM).
For each mouse, one plantaris muscle was (A) processed for imaging with EM, and the contralateral plantaris was (B) processed for FIM-ID, n=4 mice, scale bars = 25 μm. In the EM images, glycolytic (Gly) fibers and oxidative (Ox) fibers were distinguished by the presence of extensive intermyofibrillar mitochondria (arrow). In FIM-ID, the autofluorescence signal (Auto) was used to distinguish the Gly vs. Ox fibers. The ‘Auto’ signal was also merged with the signal from SERCA1 to provide a comprehensive decoration of the periphery of the myofibrils. (C–D) Scatter plots that illustrate the relationships between (C) myofibril cross-sectional area (CSA) vs. fiber CSA, and (D) the number of myofibrils per fiber vs. fiber CSA. The automated measurements from the FIM-ID samples are shown in green and the manual measurements from the EM samples are shown in gray. Individual values are presented as triangles for the Gly fibers and circles for the Ox fibers, n=144–160 fibers/condition (36–40 fibers/muscle). The solid lines represent the best fit from linear regression for each condition, R indicates Pearson’s correlation coefficient, and p indicates the likelihood of a significant difference between the automated FIM-ID and the manual EM measurements. (E–F) The data in C–D was used to compare ratios of (E) the myofibril CSA to fiber CSA, and (F) the myofibril number to fiber CSA. The data is provided for all of the analyzed fibers and also separated according to fiber type. The large dots indicate the mean for each muscle. The data in C and D were analyzed with extra-sums-of-squares F-tests and the data in E and F were analyzed with paired t-tests or a Wilcoxon-matched paired t-test when the test for normality failed (i.e. the EM measurements of Ox fibers in F). Data used to generate C–F is provided in Figure 4—source data 1.
-
Figure 4—source data 1
Source data used to generate Figure 4C–F.
- https://cdn.elifesciences.org/articles/92674/elife-92674-fig4-data1-v1.xlsx
Figure 4—figure supplement 1
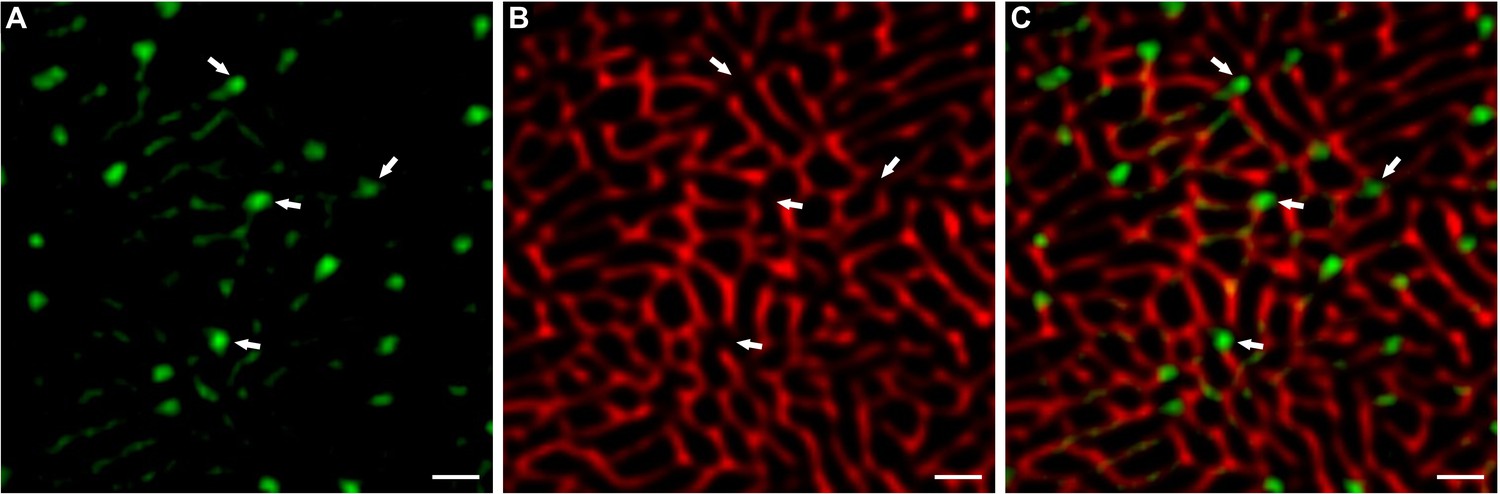
Punctate sites of autofluorescence align with gaps in the signal for SERCA1.
Representative images from a plantaris muscles that was processed for fluorescence imaging of myofibrils with image deconvolution (FIM-ID) as described in Figure 4. The representative images are from an oxidative (Ox) fiber. The signal for autofluorescence is shown in (A) and the signal for SERCA1 is shown in (B), scale bars = 1 μm. The merge of these signals (C) reveals that the intense autofluorescent puncta which are frequently observed in Ox fibers are positioned at points in which there is a gap in the signal for SERCA1.
Figure 4—figure supplement 2
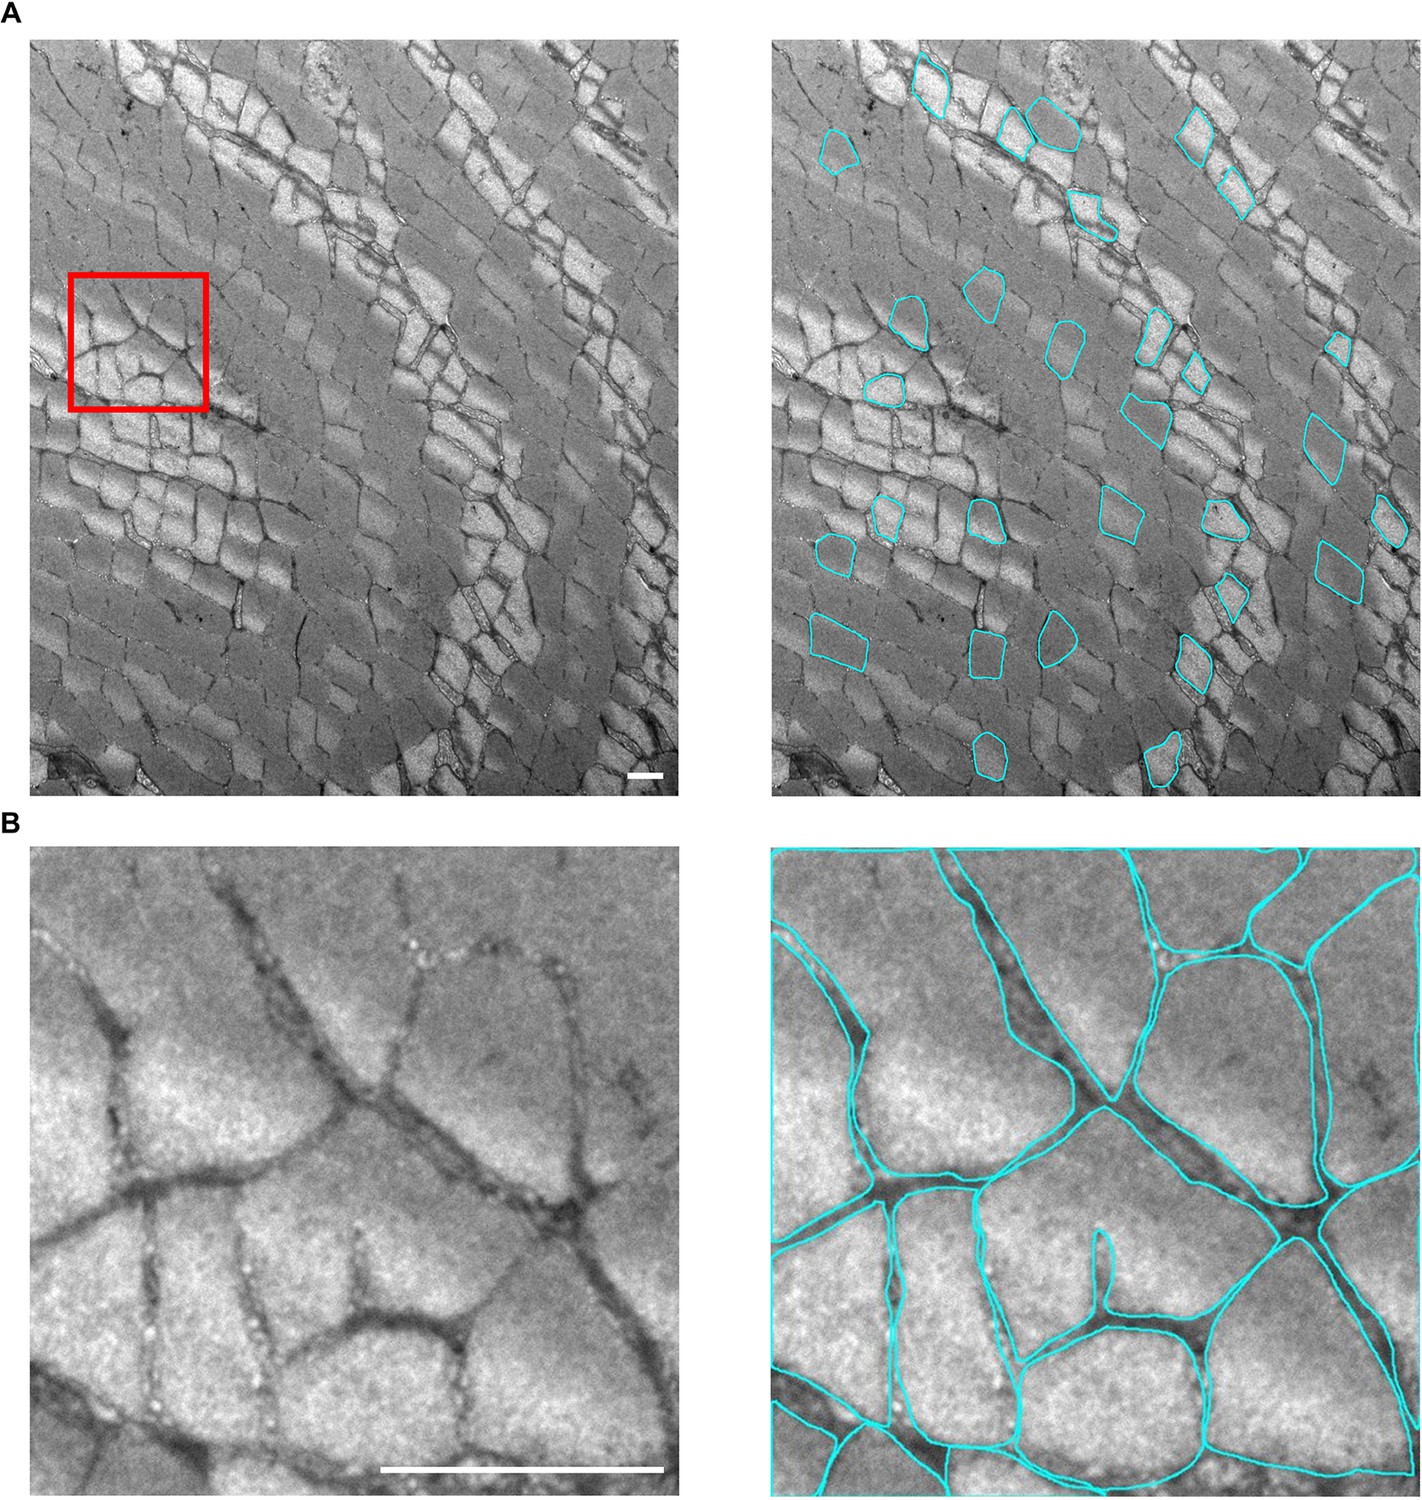
Manual tracing of myofibrils from images acquired using electron microscopy.
(A) Representative images show the manual tracing (cyan) of 30 randomly selected myofibrils for measurements of the average myofibril cross-sectional area (CSA). (B) Myofibrils within the red-boxed region of interest (ROI) were manually traced to obtain the CSA occupied by myofibrils within the ROI. The percentage of the fiber CSA occupied by myofibrils was calculated by dividing the CSA occupied by myofibrils within the ROI by the total area of the ROI and then multiplying by the fiber CSA. The number of myofibrils for the fiber was calculated by dividing the percentage of the fiber CSA occupied by myofibrils by the average myofibril CSA for that fiber (scale bars = 1 µm).
Figure 4—figure supplement 3
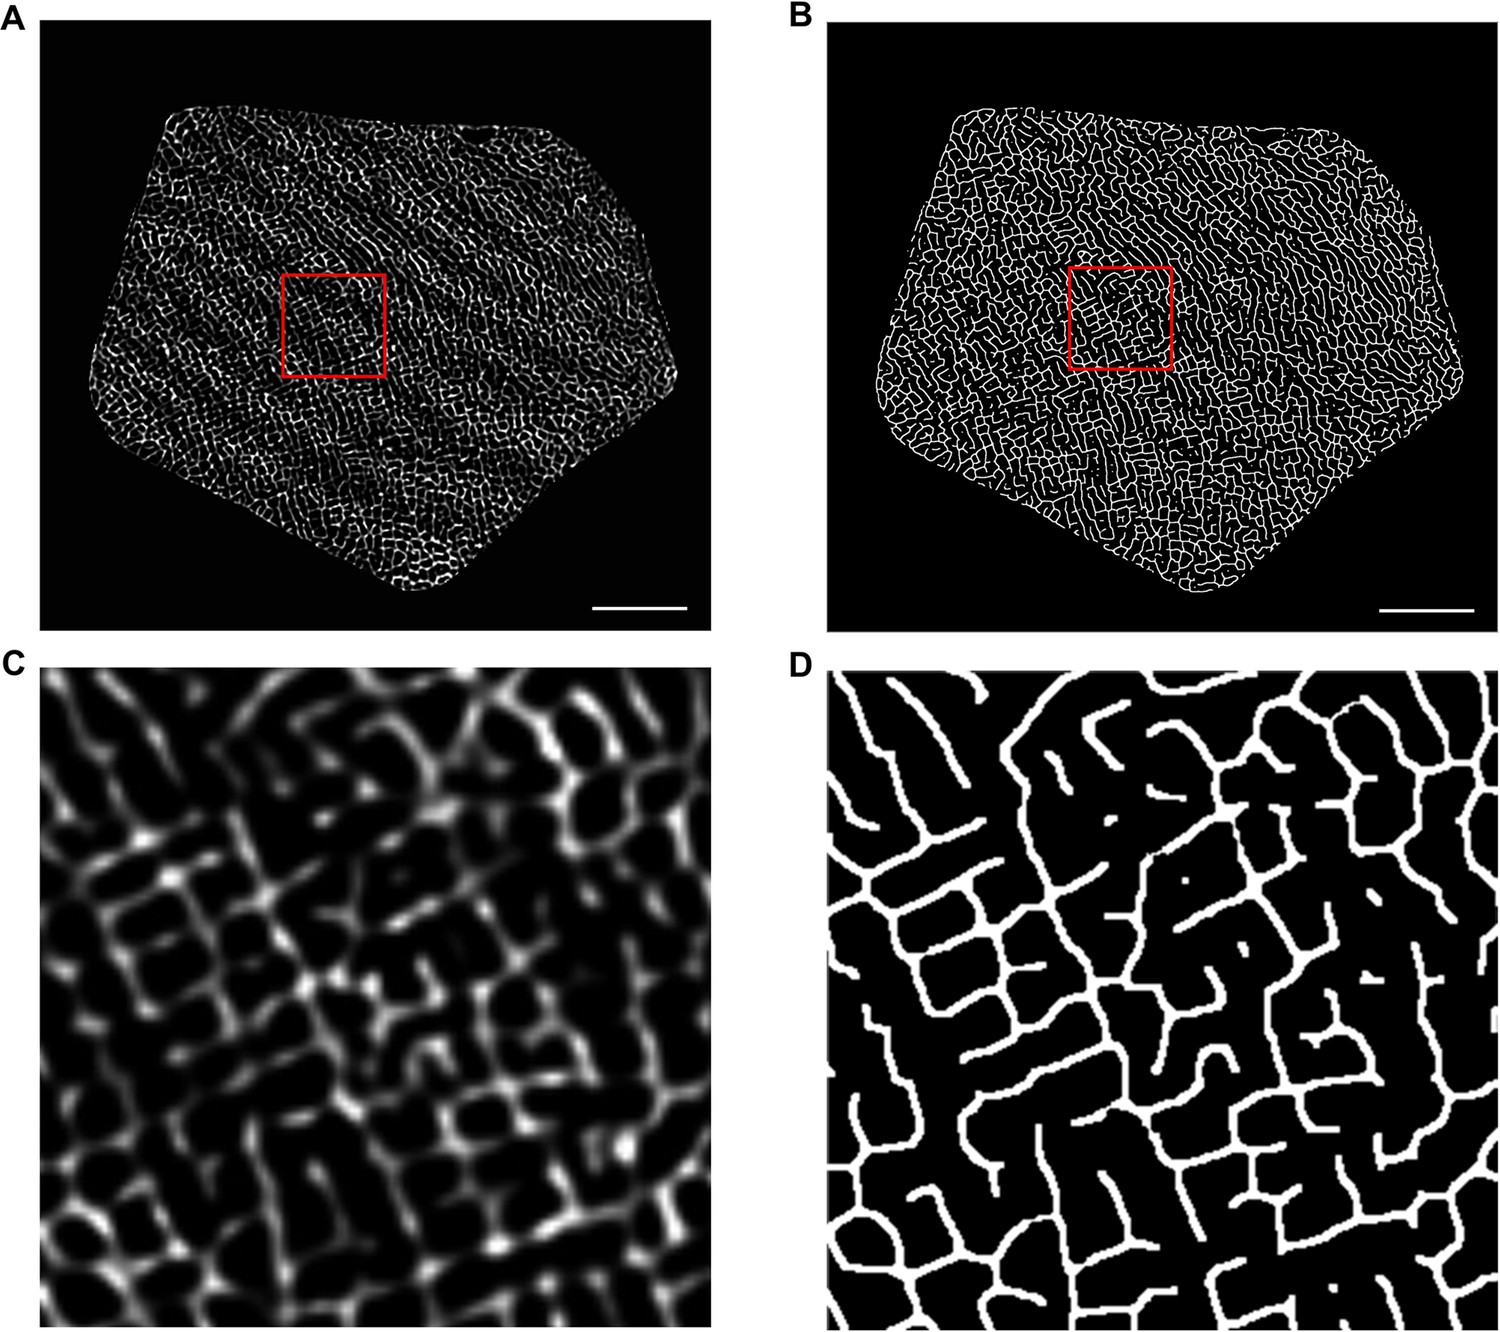
Using CellProfiler to determine the area occupied by the intermyofibrillar components.
(A) A representative image of an isolated muscle fiber before processing in CellProfiler. (B) Binary version of the image from A that was created by the custom ‘Intermyofibrillar Area’ CellProfiler pipeline. The area occupied by the intermyofibrillar components is calculated from the area that is occupied by the white pixels in the binary image. (C–D) Zoomed-in images of the red-boxed regions in A and B. Scale bars = 10 μm.
Figure 5 with 1 supplement
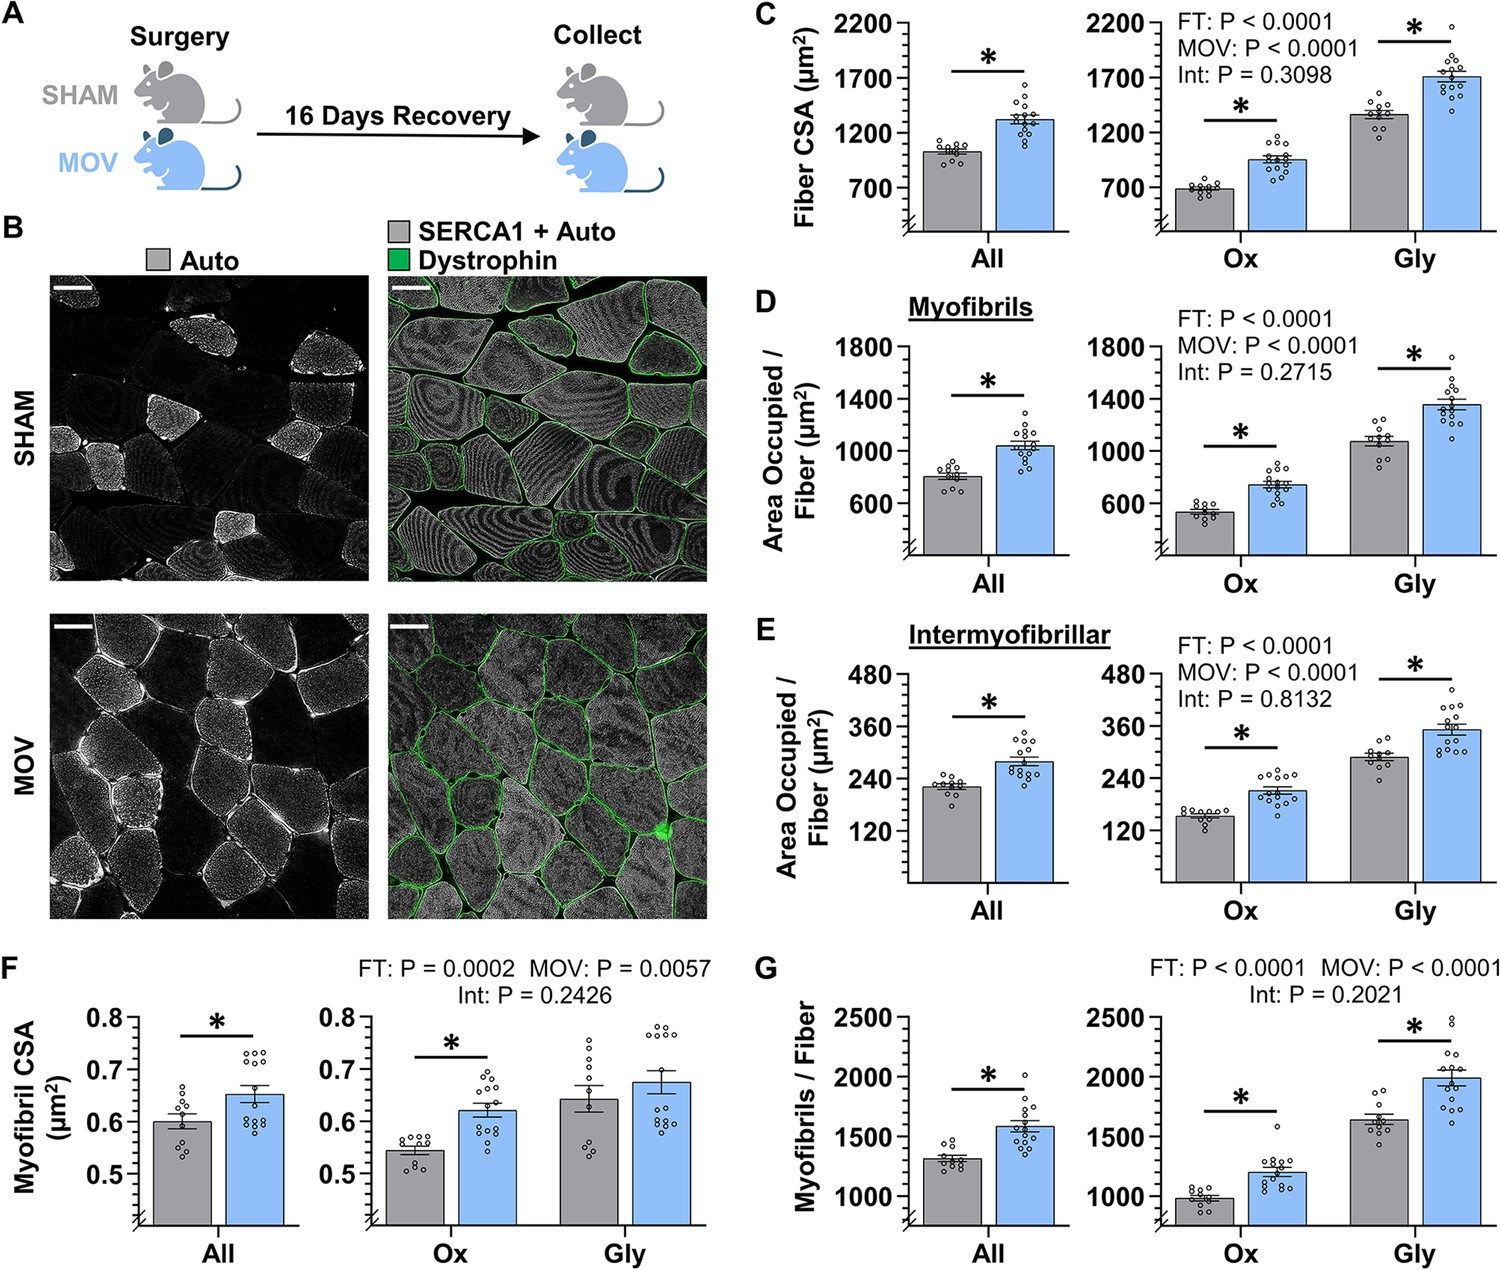
The radial growth of fibers that occurs in response to chronic mechanical overload (MOV) is largely mediated by myofibrillogenesis.
(A) The plantaris muscles of mice were subjected to a chronic MOV or sham surgery, allowed to recover for 16 days, and then mid-belly cross-sections were subjected to fluorescence imaging of myofibrils with image deconvolution (FIM-ID). (B) Immunolabeling for dystrophin was used to identify the periphery of muscle fibers, autofluorescence (Auto) was used to distinguish glycolytic (Gly) fibers from highly oxidative (Ox) fibers, and the signal from SERCA1 plus Auto was merged and used to identify the periphery of the myofibrils, scale bars = 25 μm. (C–G) Graphs contain the results from all of the fibers that were analyzed, as well as the same data after it was separated according to fiber type. (C) Fiber cross-sectional area (CSA), (D) the area per fiber occupied by myofibrils, (E) the area per fiber occupied by intermyofibrillar components, (F) myofibril CSA, and (G) the number of myofibrils per fiber. The data are presented as the mean ± SEM, n=11–15 muscles/group (All = 24–54 fibers/muscle, Ox and Gly = 10–24 fibers/muscle, Gly = 10–24 fibers/muscle, and an average of 356±17 myofibrils/fiber). Student’s t-tests were used to analyze the data in the ‘All’ graphs and two-way ANOVA was used to analyze the data in the fiber-type graphs. Insets show the p values for the main effects of MOV, fiber type (FT), and the interaction (Int). * Significant effect of MOV, p<0.05. Graphic illustration in A was created with BioRender.com. Data used to generate C–G is provided in Figure 5—source data 1.
© 2024, BioRender Inc. Figure 5 was created using BioRender, and is published under a CC B-NC-ND license. Further reproductions must adhere to the terms of this license.
-
Figure 5—source data 1
Source data used to generate Figure 5C–G and Figure 5—figure supplement 1.
- https://cdn.elifesciences.org/articles/92674/elife-92674-fig5-data1-v1.xlsx
Figure 5—figure supplement 1
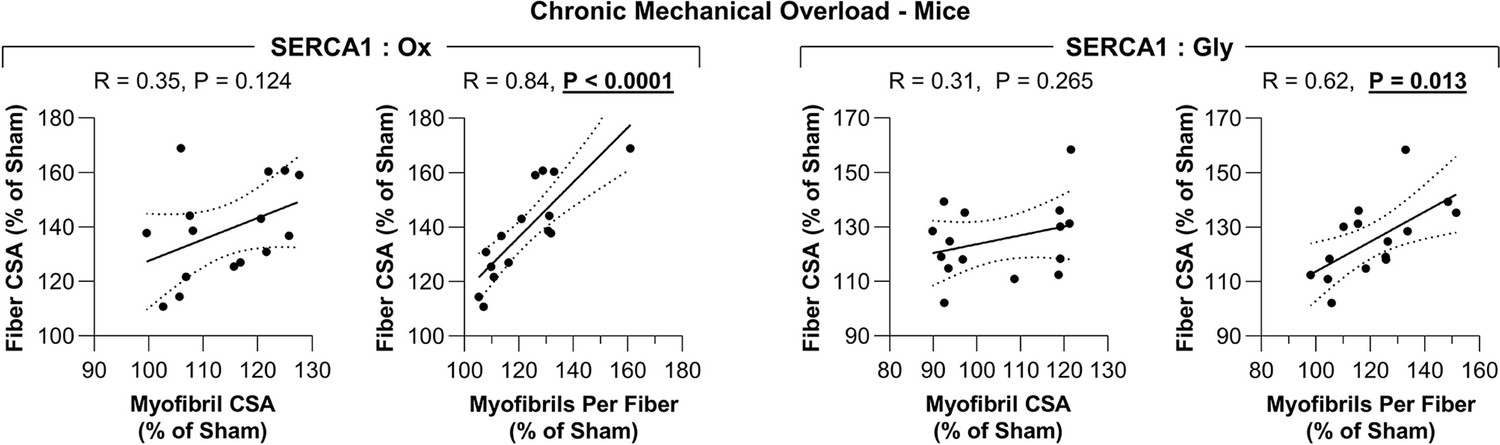
The radial growth of fibers that occurs in response to an increase in mechanical loading is correlated with the induction of myofibrillogenesis.
The plantaris muscles of mice were subjected to a chronic mechanical overload (MOV) or sham surgery and then collected after 16 days of recovery. Each sample was subjected to fluorescence imaging of myofibrils with image deconvolution (FIM-ID) and then individual fiber types were analyzed for the mean fiber cross-sectional area (CSA), mean myofibril CSA, and the mean number of myofibril per fiber as reported in Figure 5. Data for the mouse MOV samples were expressed relative to the mean of the sham samples (% of Sham). The resulting data were used to create scatter plots that illustrate the relationship between the changes in fiber CSA and myofibril CSA for each sample, or the relationship between the changes in fiber CSA and the number of myofibrils per fiber (i.e. myofibrillogenesis) for each sample. Solid lines represent the best fit from linear regression, the dashed lines represent the 95% confidence intervals, R indicates Pearson’s correlation coefficient, and p indicates the likelihood that the relationship is significantly different from zero. Data used to generate Figure 5—figure supplement 1 is provided in Figure 5—source data 1.
Figure 6 with 1 supplement
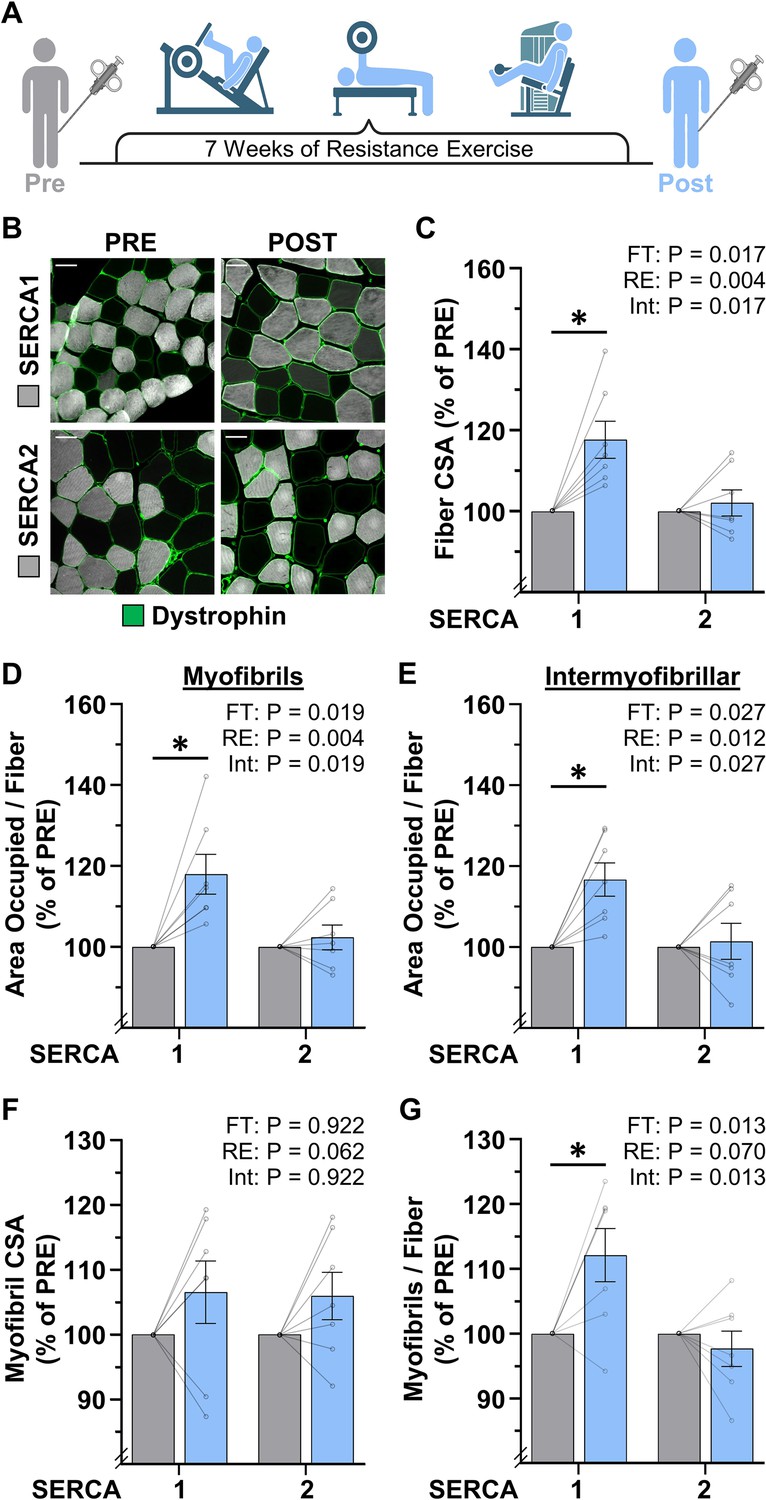
The radial growth of fibers that occurs in response to resistance exercise (RE) is largely mediated by myofibrillogenesis.
(A) Biopsies of the vastus lateralis were collected before (PRE) and after (POST) participants performed 7 weeks of progressive RE. (B) Cross-sections were immunolabeled for dystrophin (to identify the periphery of muscle fibers), SERCA1 (to identify the periphery of the myofibrils in Type II fibers), or SERCA2 (to identify the periphery of the myofibrils in Type I fibers), and subjected to fluorescence imaging of myofibrils with image deconvolution (FIM-ID), scale bars = 50 μm. (C–G) Graphs contain the values for each subject expressed relative to their PRE sample. (C) Fiber cross-sectional area (CSA), (D) the area per fiber occupied by myofibrils, (E) the area per fiber occupied by intermyofibrillar components, (F) myofibril CSA, and (G) the number of myofibrils per fiber. The data are presented as the mean ± SEM, n=7 participants (SERCA1 15–33 fibers/participant, SERCA2 8–38 fibers/participant, and an average of 1101±60 myofibrils/fiber). Significance was determined by repeated measures two-way ANOVA. Insets show the p values for the main effects of RE, fiber type (FT), and the interaction (Int). * Significant effect of RE, p<0.05. Graphic illustration in A was created with BioRender.com. Data used to generate C–G is provided in Figure 6—source data 1.
© 2024, BioRender Inc. Figure 6 was created using BioRender, and is published under a CC B-NC-ND license. Further reproductions must adhere to the terms of this license.
-
Figure 6—source data 1
Source data used to generate Figure 6C–G and Figure 6—figure supplement 1.
- https://cdn.elifesciences.org/articles/92674/elife-92674-fig6-data1-v1.xlsx
Figure 6—figure supplement 1
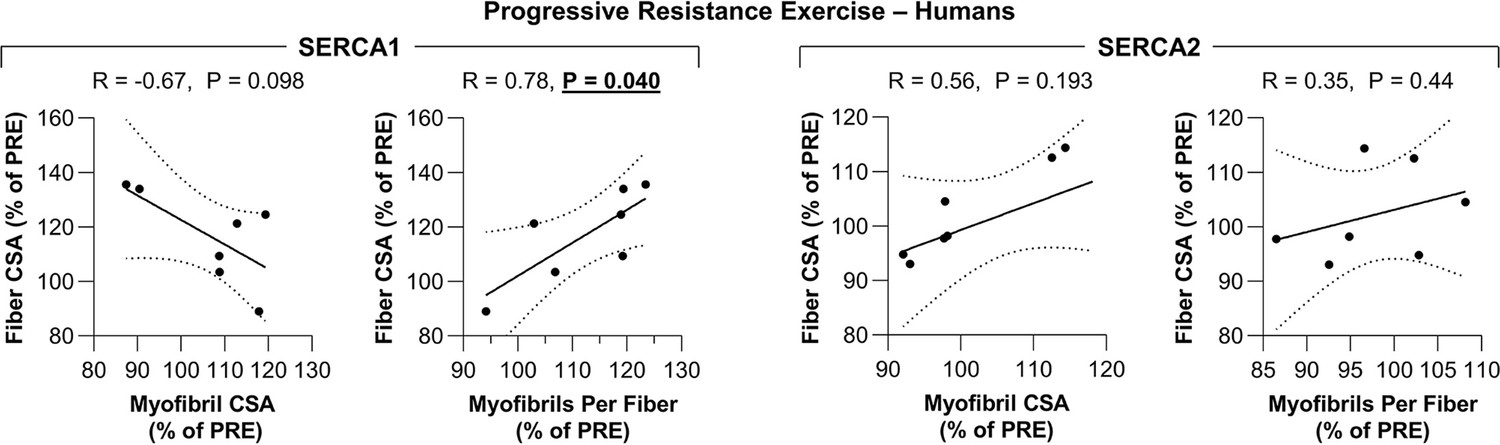
The radial growth of fibers that occurs in response to an increase in mechanical loading is correlated with the induction of myofibrillogenesis.
Biopsies of the vastus lateralis muscle were collected before (PRE) and after (POST) human participants performed 7 weeks of progressive resistance exercise. Each sample was subjected to fluorescence imaging of myofibrils with image deconvolution (FIM-ID) and then individual fiber types were analyzed for the mean fiber cross-sectional area (CSA), mean myofibril CSA, and the mean number of myofibril per fiber as reported in Figure 6. Data for each human POST sample was expressed relative to its respective PRE sample (% of PRE). The resulting data were used to create scatter plots that illustrate the relationship between the changes in fiber CSA and myofibril CSA for each sample, or the relationship between the changes in fiber CSA and the number of myofibrils per fiber (i.e. myofibrillogenesis) for each sample. Solid lines represent the best fit from linear regression, the dashed lines represent the 95% confidence intervals, R indicates Pearson’s correlation coefficient, and p indicates the likelihood that the relationship is significantly different from zero. Data used to generate Figure 6—figure supplement 1 is provided in Figure 6—source data 1.
Author response image 1
Author response image 2
Additional files
-
Source code 1
CellProfiler pipelines, instructions, and sample images.
- https://cdn.elifesciences.org/articles/92674/elife-92674-code1-v1.zip
-
MDAR checklist
- https://cdn.elifesciences.org/articles/92674/elife-92674-mdarchecklist1-v1.pdf
Download links
A two-part list of links to download the article, or parts of the article, in various formats.
Downloads (link to download the article as PDF)
Open citations (links to open the citations from this article in various online reference manager services)
Cite this article (links to download the citations from this article in formats compatible with various reference manager tools)
A novel imaging method (FIM-ID) reveals that myofibrillogenesis plays a major role in the mechanically induced growth of skeletal muscle
eLife 12:RP92674.
https://doi.org/10.7554/eLife.92674.3


