FMNL2 regulates actin for endoplasmic reticulum and mitochondria distribution in oocyte meiosis
- College of Animal Science and Technology, Nanjing Agricultural University, China
- College of Veterinary Medicine, Northwest A&F University, China
- Fertility Preservation Lab, Reproductive Medicine Center, Guangdong Second Provincial General Hospital, China
Figures
Figure 1 with 1 supplement
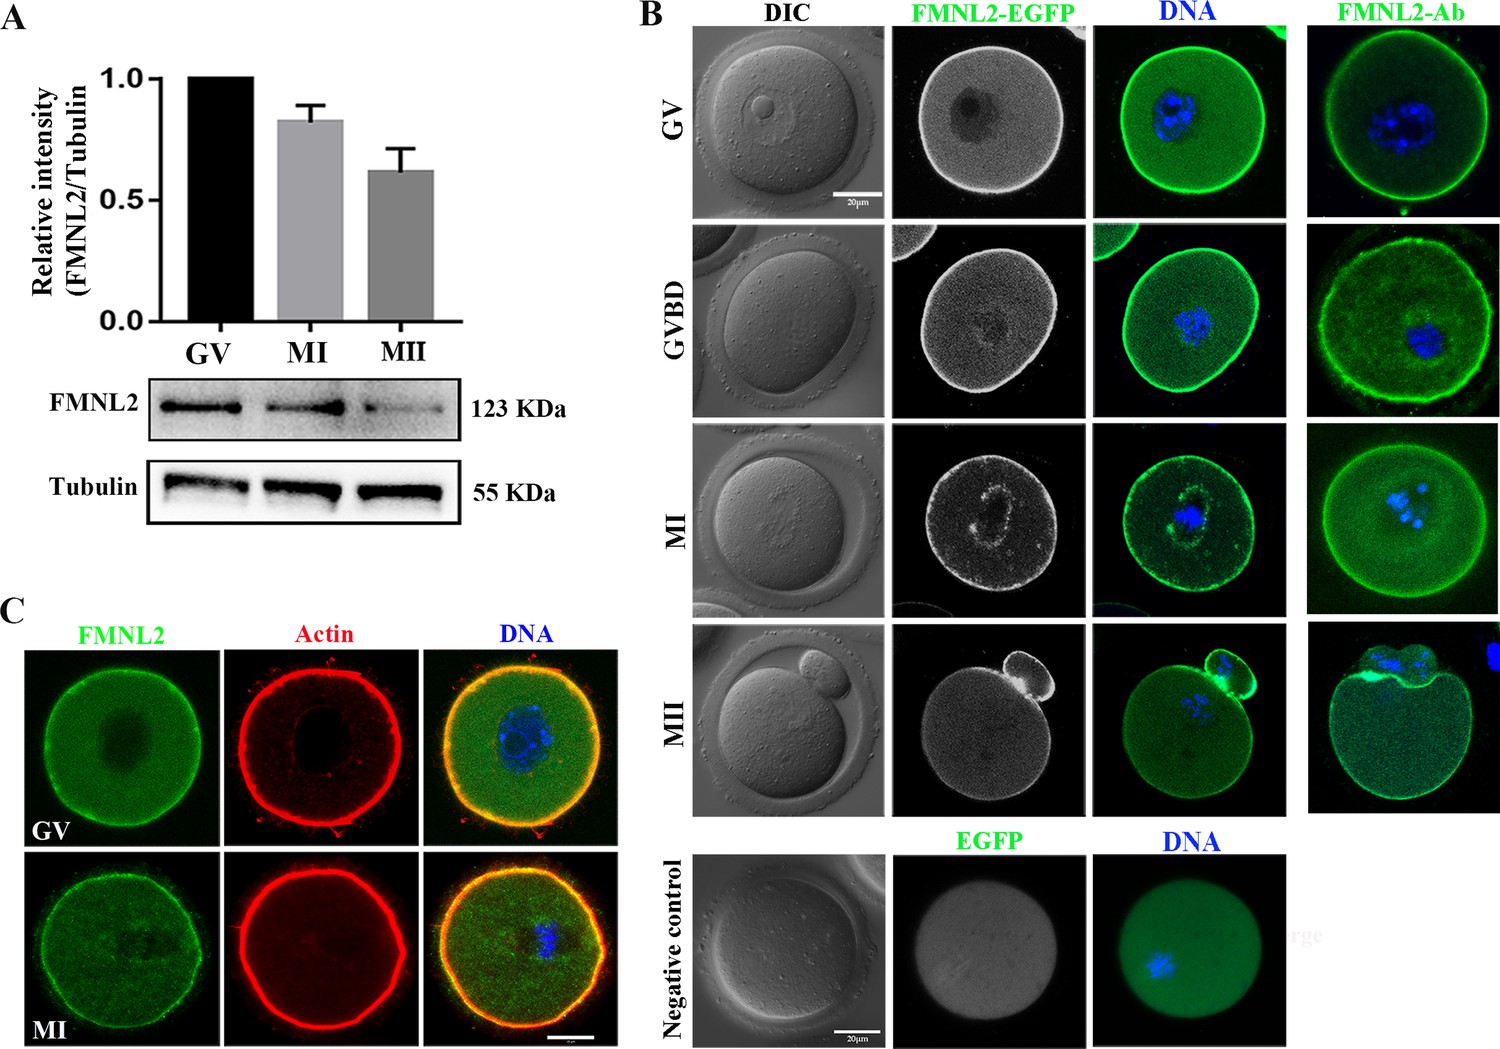
Expression and subcellular localization of FMNL2 during mouse oocyte meiosis.
(A) Western blotting results of FMNL2 protein expression at different stages. FMNL2 expressed at the germinal vesicle (GV), metaphase I (MI), and metaphase II (MII) stages. (B) Subcellular localization of FMNL2-EGFP and FMNL2 antibody during mouse oocyte meiosis. FMNL2 was enriched at the cortex (GV, germinal vesicle breakdown [GVBD], MI, and MII stage) and spindle periphery (MI stage). Green, FMNL2-EGFP; blue, DNA. Negative control: green, EGFP; blue, DNA. Bar = 20 μm. (C) Co-staining of oocytes for FMNL2 and actin. FMNL2 and actin both localization in cortex. Green, FMNL2-antibody; red, actin; blue, DNA. Bar = 20 μm.
-
Figure 1—source data 1
The original files of the full raw unedited blots in Figure 1.
- https://cdn.elifesciences.org/articles/92732/elife-92732-fig1-data1-v1.zip
-
Figure 1—source data 2
The figure with the uncropped blots with the labeled bands.
- https://cdn.elifesciences.org/articles/92732/elife-92732-fig1-data2-v1.zip
Figure 1—figure supplement 1
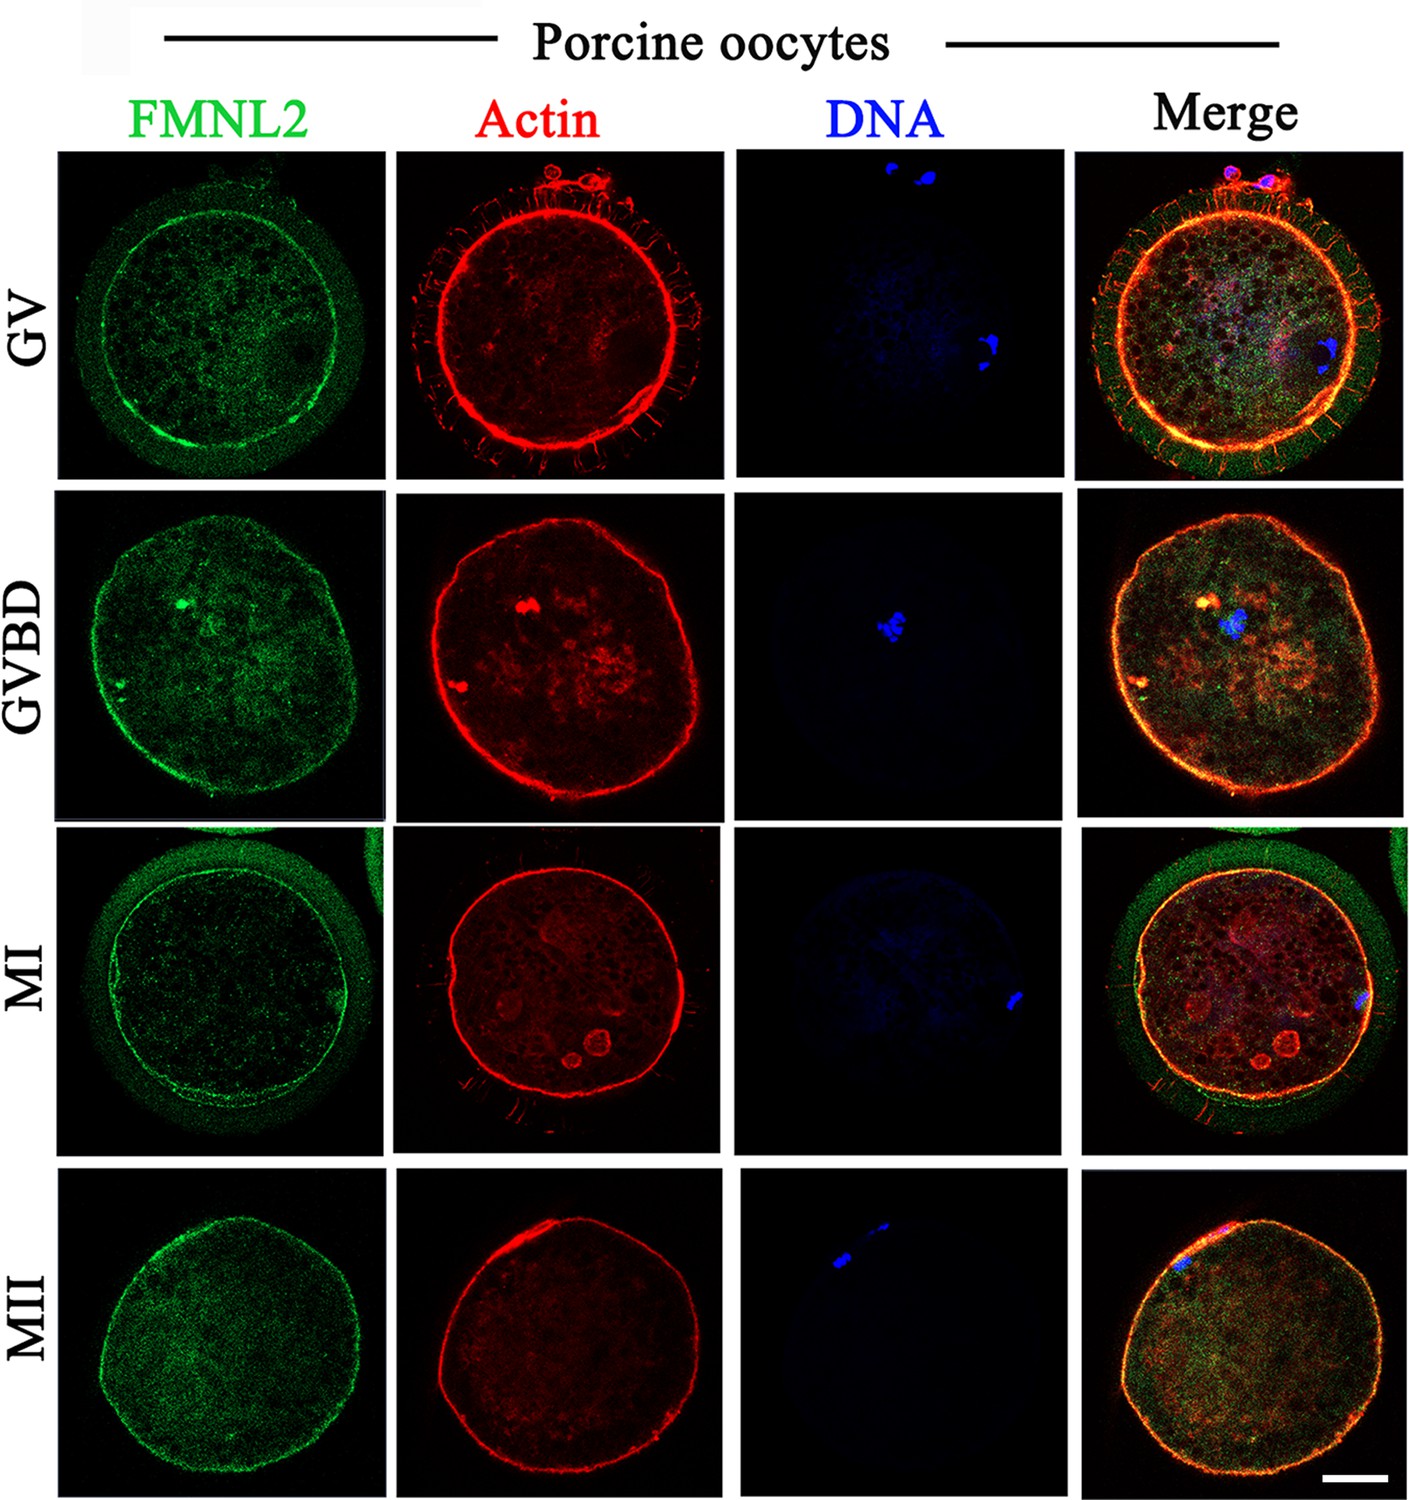
Localization of FMNL2 in the different stages of porcine oocyte maturation.
FMNL2 colocalized with actin in porcine oocytes. Green, FMNL2; red, actin; blue, DNA. Bar = 20 μm.
Figure 2
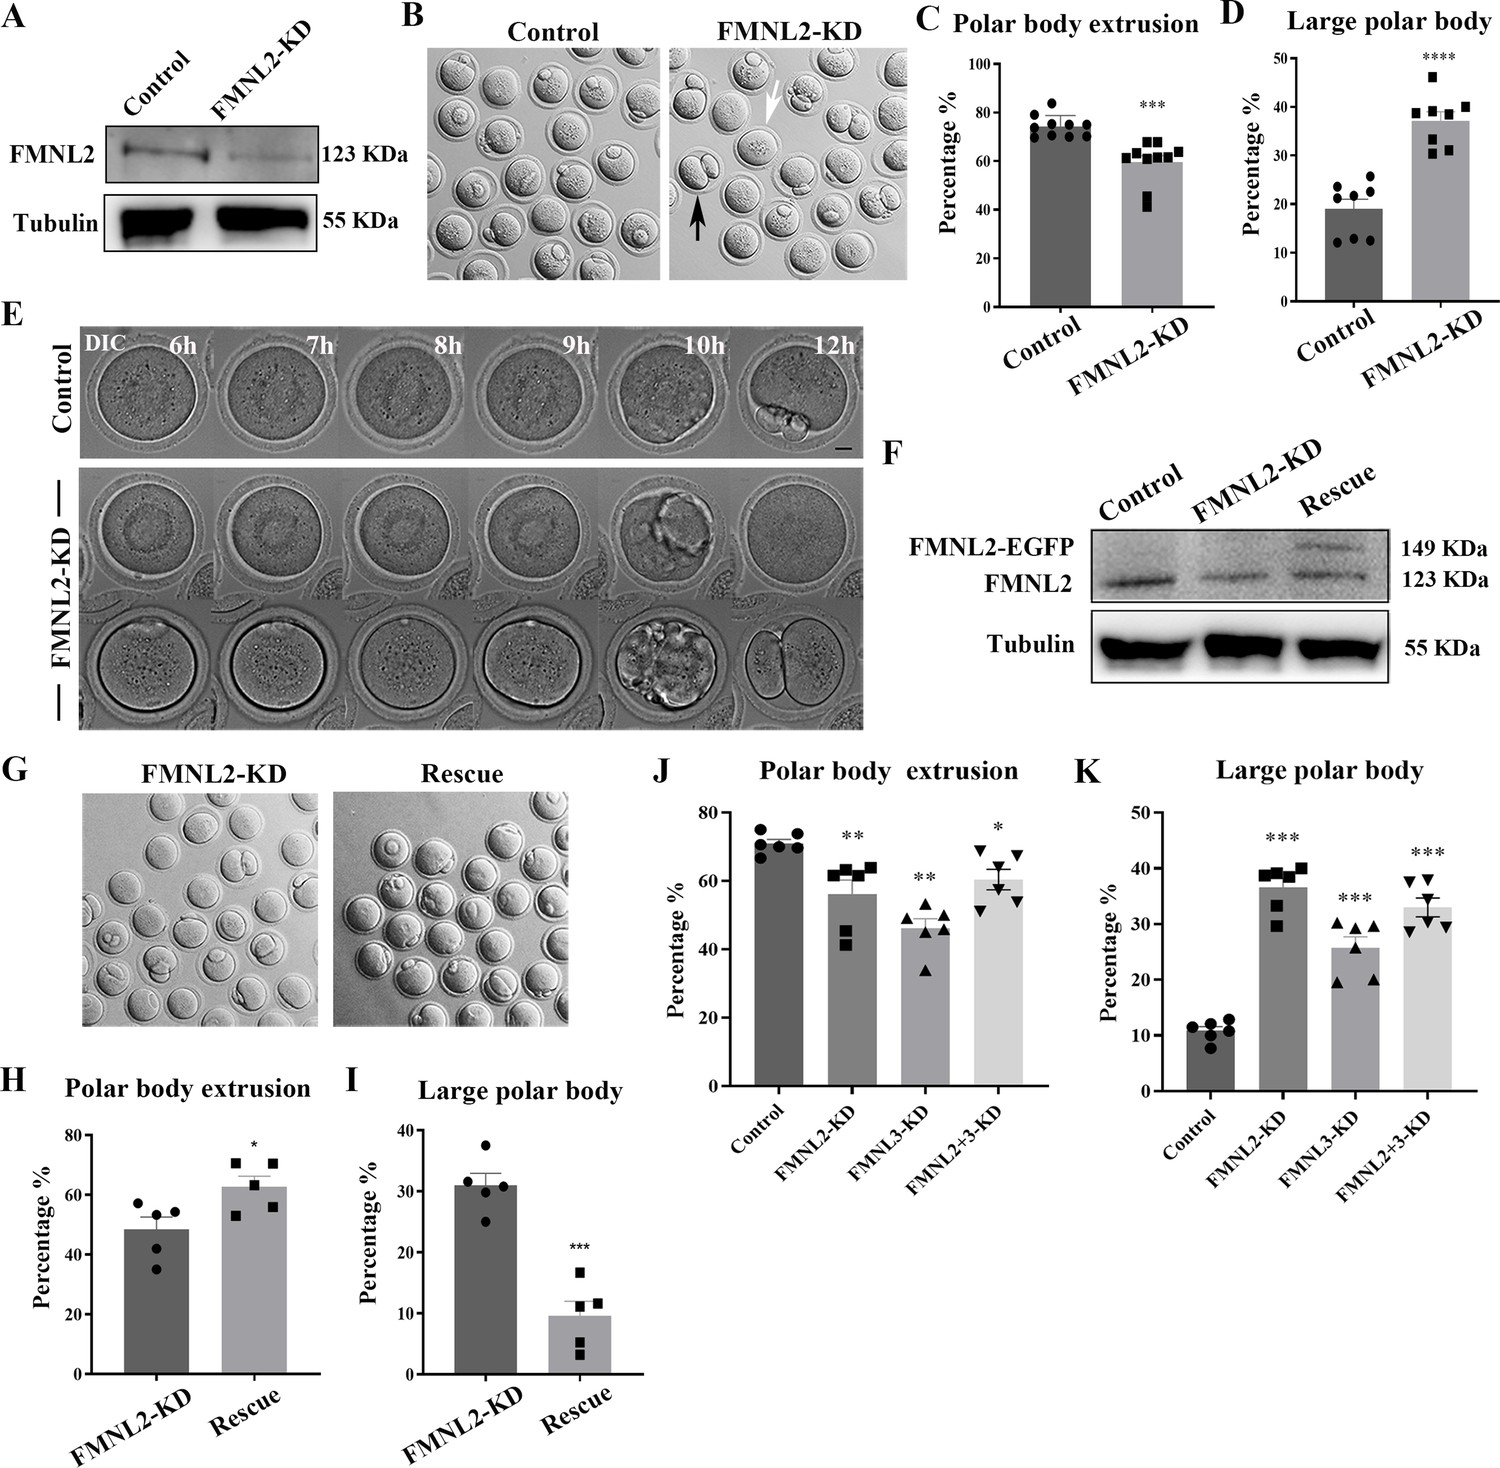
Knockdown of FMNL2 affects first polar body extrusion and asymmetric division.
(A) Western blot analysis for FMNL2 expression in the FMNL2-KD group and control group. Relative intensity of FMNL2 and tubulin was assessed by densitometry. (B) Brightfield images of control oocytes and FMNL2-KD oocytes after 12 hr culture. FMNL2-KD caused large polar bodies (black arrows) and some oocytes failed to extrude the polar bodies (white arrows). (C) Rate of polar body extrusion after 12 hr culture of the control group and FMNL2-KD group. Control (n = 439), FMNL2‐KD (n = 398) . (D) Rate of large polar body extrusion after 12 hr culture in the control group and FMNL2-KD group. Control (n = 311), FMNL2‐KD (n = 257). (E) Time-lapse microscopy showed that polar body extrusion failed after FMNL2-KD. Bar = 10 μm. (F) Western blot analysis for FMNL2 expression in the control group, FMNL2-KD group, and rescue group. Relative intensity of FMNL2 and tubulin was assessed by densitometry. (G) Brightfield images of FMNL2-KD oocytes and rescue oocytes after 12 hr culture. (H) Rate of polar body extrusion after 12 hr culture of the FMNL2-KD group and rescue group.FMNL2‐KD (n = 355), Rescue (n = 377). (I) Rate of large polar body extrusion after 12 hr culture in the FMNL2-KD group and rescue group. FMNL2‐KD (n = 193), Rescue (n = 203). (J) Rate of polar body extrusion after 12 hr culture of the control group, FMNL2-KD group,FMNL3-KD group and FMNL2 + 3-KD group. Control (n = 261), FMNL2‐KD (n = 203 ), FMNL3‐KD (n = 184), FMNL2+3‐KD (n = 198). (K) Rate of large polar body extrusion after 12 hr culture in the control group, FMNL2-KD group,FMNL3-KD group and FMNL2 + 3-KD group. Control (n = 172), FMNL2‐KD (n = 178), FMNL3‐KD (n = 136), FMNL2+3‐KD (n = 118). The error bars are representing the mean ± SEM. The P‐values were calculated using Student's t‐test. *p < 0.05, **p < 0.01, ***p < 0.001, ****p < 0.0001.
-
Figure 2—source data 1
The original files of the full raw unedited blots in Figure 2.
- https://cdn.elifesciences.org/articles/92732/elife-92732-fig2-data1-v1.zip
-
Figure 2—source data 2
The figure with the uncropped blots with the labeled bands.
- https://cdn.elifesciences.org/articles/92732/elife-92732-fig2-data2-v1.zip
Figure 3 with 1 supplement
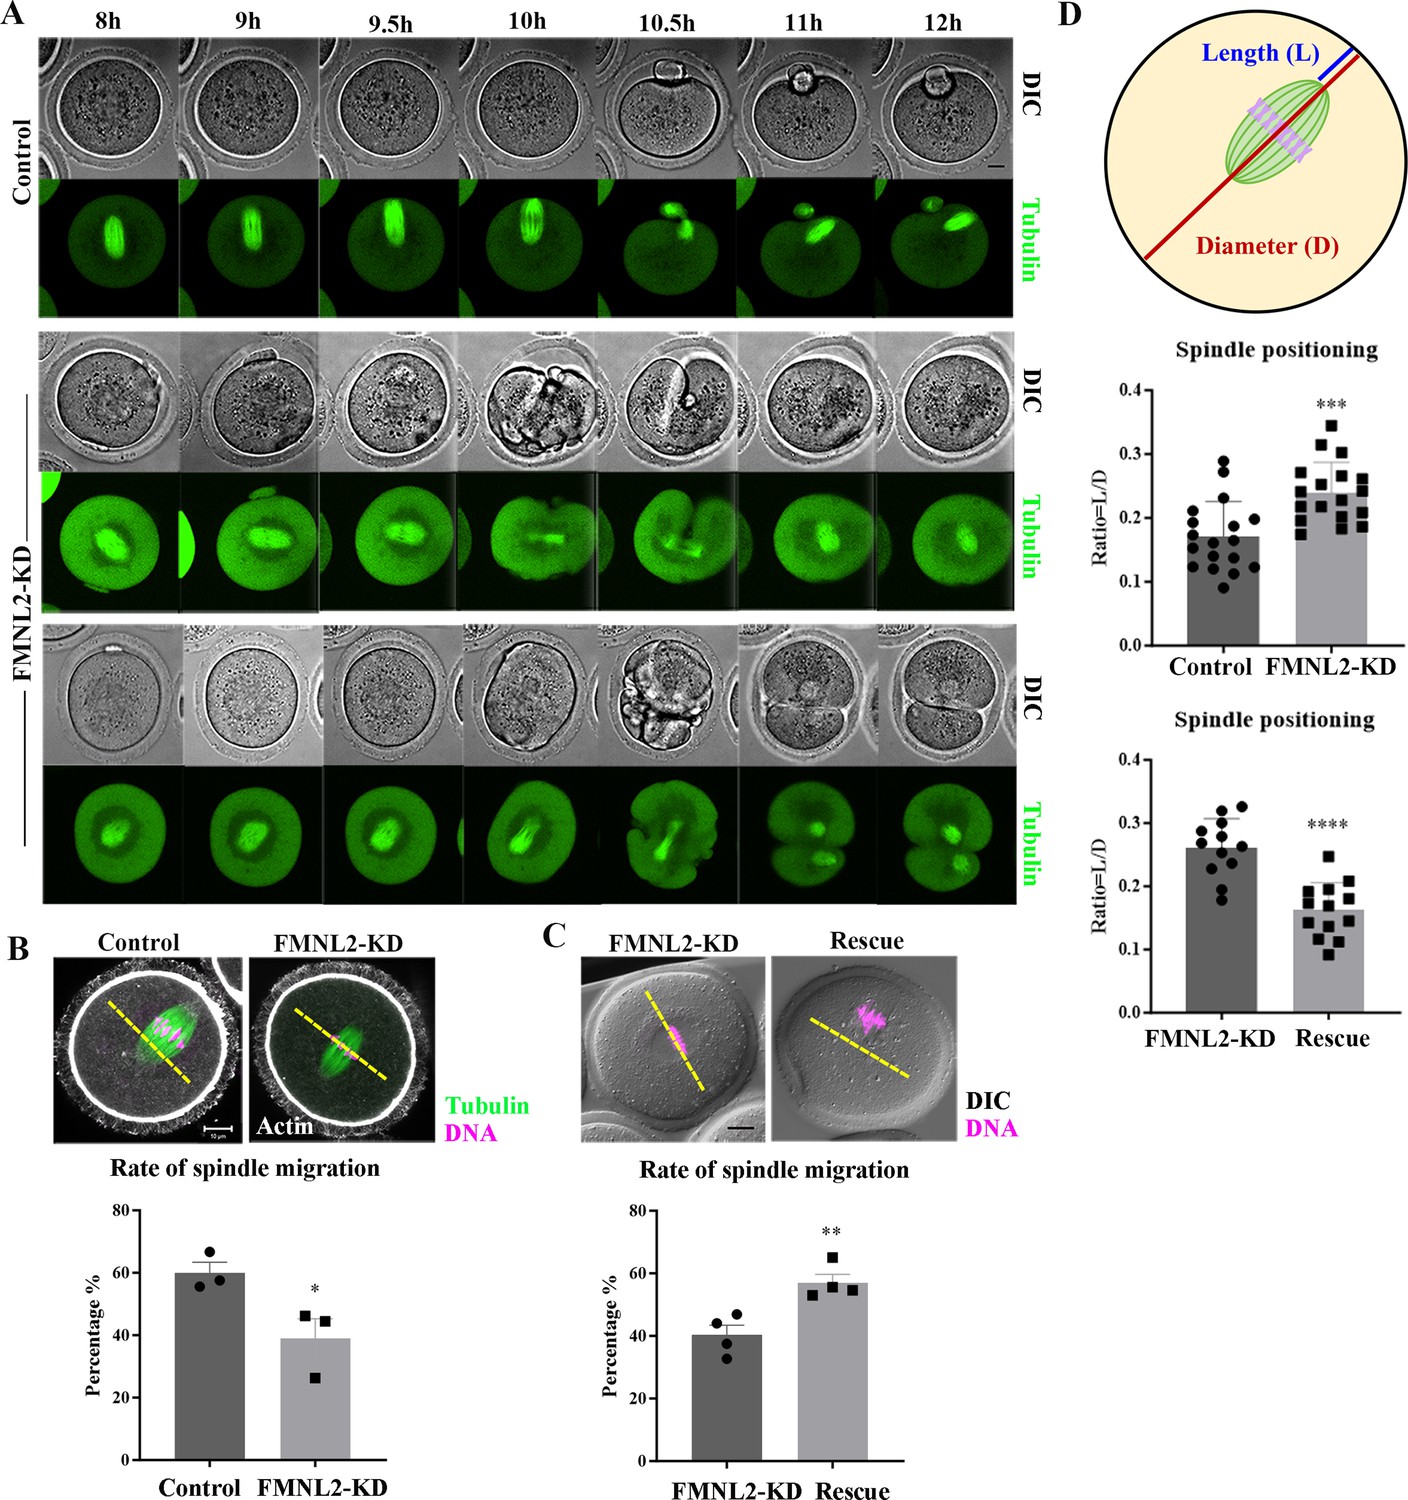
Knockdown of FMNL2 disrupts spindle localization during mouse oocyte meiosis.
(A) Time-lapse microscopy showed that spindle migration failed after FMNL2-KD. Green, tubulin-EGFP. Bar = 10 μm. (B) Representative images and the proportion of spindle migration after 9.5 hr of culture in the control group and FMNL2-KD oocyte group. White, actin; green, tubulin; magenta, DNA. Bar = 10 μm. Control (n = 78), FMNL2‐KD (n = 64 ). (C) Representative images and the proportion of spindle migration after 9.5 hr of culture in the FMNL2-KD group and rescue oocyte group. Magenta, DNA. Bar = 10 μm. FMNL2‐KD (n = 81), Rescue (n = 57). (D) Quantitative analysis of the extent of spindle migration. Control (n = 18), FMNL2‐KD (n = 18); FMNL2‐KD (n = 12), Rescue (n = 13). The error bars are representing the mean ± SEM. The P‐values were calculated using Student's t‐test. *p < 0.05, **p < 0.01. ***p < 0.001, ****p < 0.0001.
Figure 3—figure supplement 1
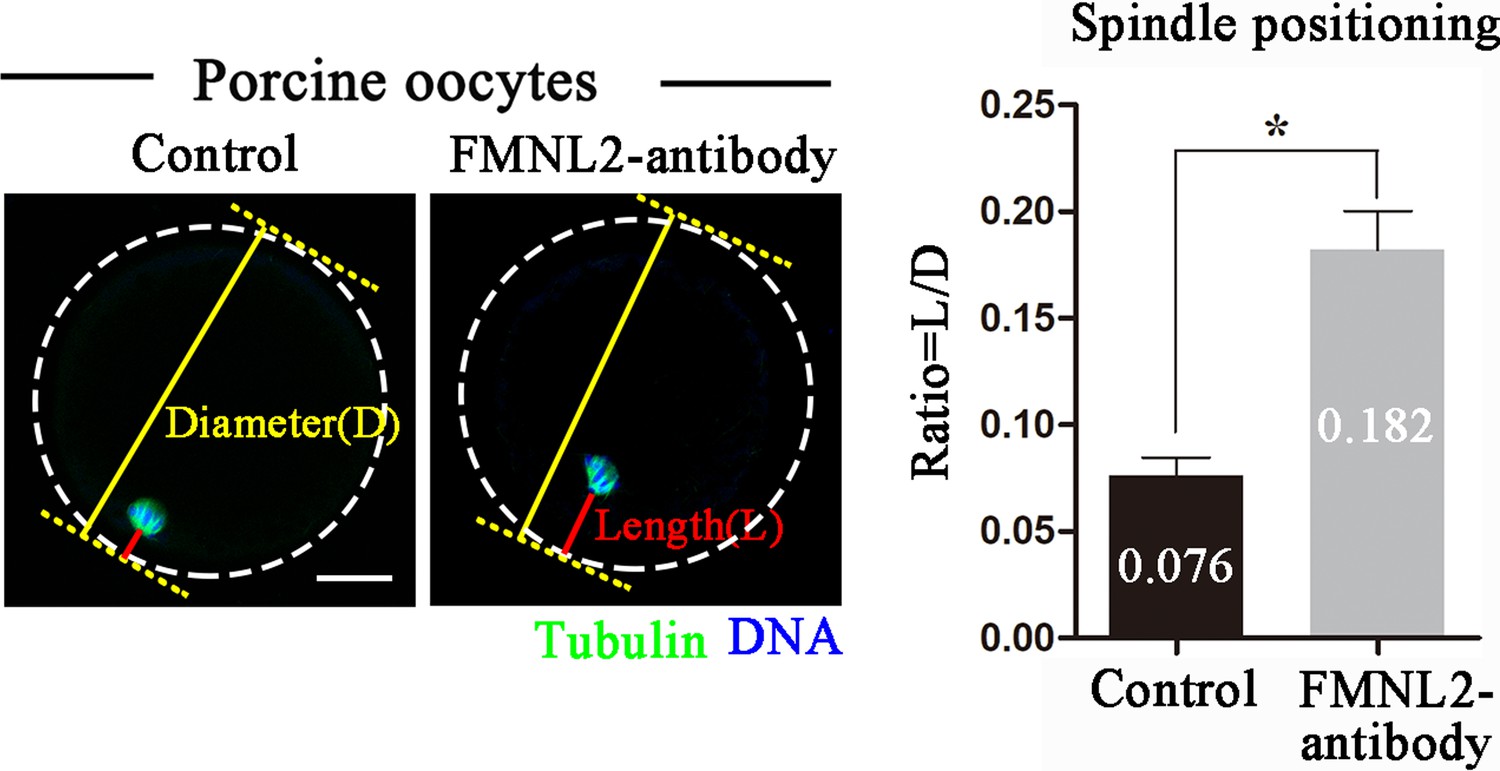
The spindle positioning after FMNL2 antibody injection in porcine oocytes.
We defined oocyte diameter as D, and the length of spindle to the cortex as L. The ratio of L/D increased significantly in FMNL2 antibody injection group. Green, tubulin; blue, DNA. Bar = 20 μm. The error bars are representing the mean ± SEM. The P‐values were calculated using Student's t‐test. *p < 0.05.
Figure 4 with 1 supplement
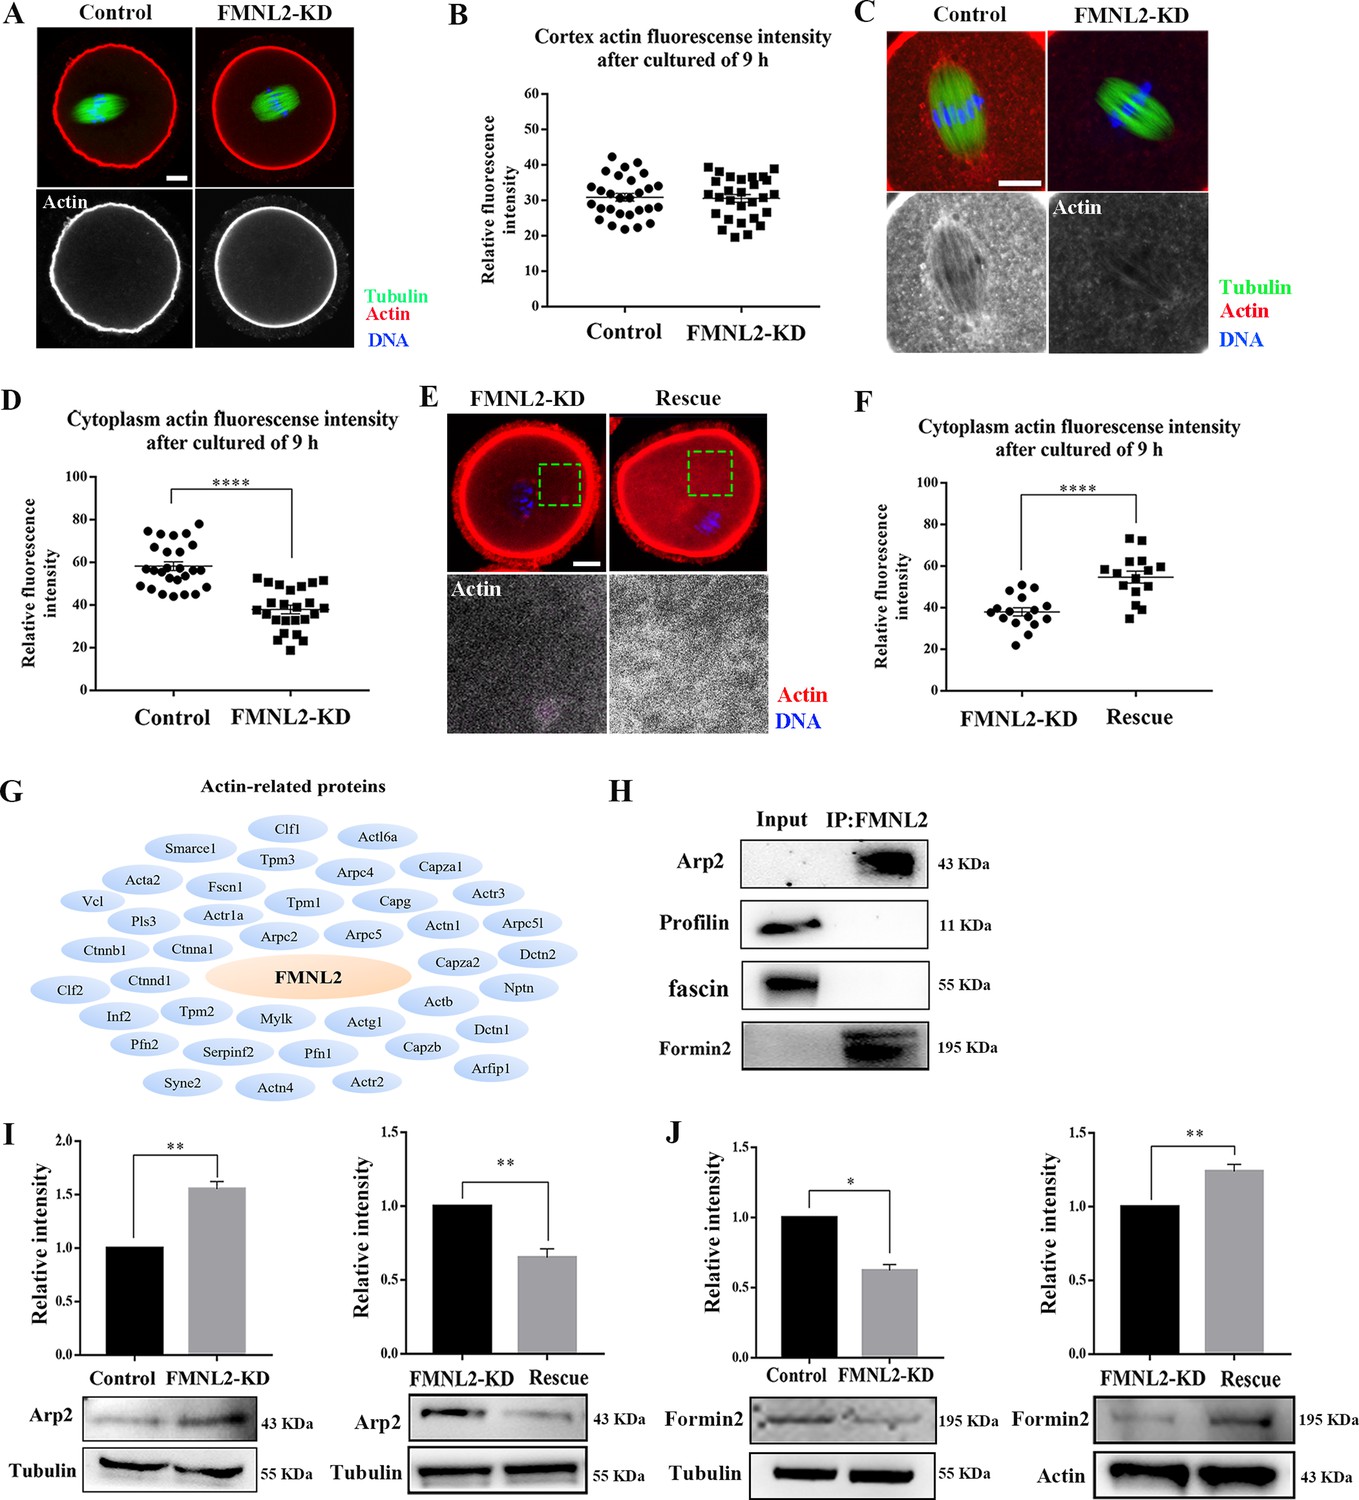
Knockdown of FMNL2 disrupts actin assembly during mouse oocyte meiosis.
(A, B) Representative images of actin distribution at the oocyte cortex and the fluorescent intensities in the control group and FMNL2-KD group (p > 0.1). White, actin; green, tubulin; blue, DNA. Bar = 10 μm. Control (n = 28), FMNL2‐KD (n = 28). (C, D) Representative images of actin distribution in the oocyte cytoplasm and the fluorescent intensities in the control group and FMNL2-KD group. White, actin; green, tubulin; blue, DNA. Bar = 10 μm. Control (n = 26), FMNL2‐KD (n = 24). (E, F) Representative images of actin distribution in the oocyte cytoplasm and the fluorescent intensities in the FMNL2-KD group and rescue group. White, actin; blue, DNA. Bar = 10 μm. FMNL2‐KD (n = 16), Rescue (n = 15). (G) Mass spectrometry results showed that FMNL2 was related to many actin-related proteins. (H) Co-IP results showed that FMNL2 was correlated with Arp and Formin2 but not with Profiling and Fascin. (I) Arp2 protein expression significantly increased in the FMNL2-KD oocytes compared with the control oocytes. Arp2 protein expression significantly decreased in the rescue oocytes compared with the FMNL2-KD oocytes. (J) Formin2 protein expression significantly decreased in the FMNL2-KD oocytes compared with the control oocytes. Formin2 protein expression significantly increased in the rescue oocytes compared with the FMNL2-KD oocytes. The error bars are representing the mean ± SEM. The P‐values were calculated using Student's t‐test. *p < 0.05, **p < 0.01, ****p < 0.0001.
-
Figure 4—source data 1
The original files of the full raw unedited blots in Figure 4.
- https://cdn.elifesciences.org/articles/92732/elife-92732-fig4-data1-v1.zip
-
Figure 4—source data 2
The figure with the uncropped blots with the labeled bands.
- https://cdn.elifesciences.org/articles/92732/elife-92732-fig4-data2-v1.zip
-
Figure 4—source data 3
The original file of mass spectrometry for the protein summary.
- https://cdn.elifesciences.org/articles/92732/elife-92732-fig4-data3-v1.zip
Figure 4—figure supplement 1
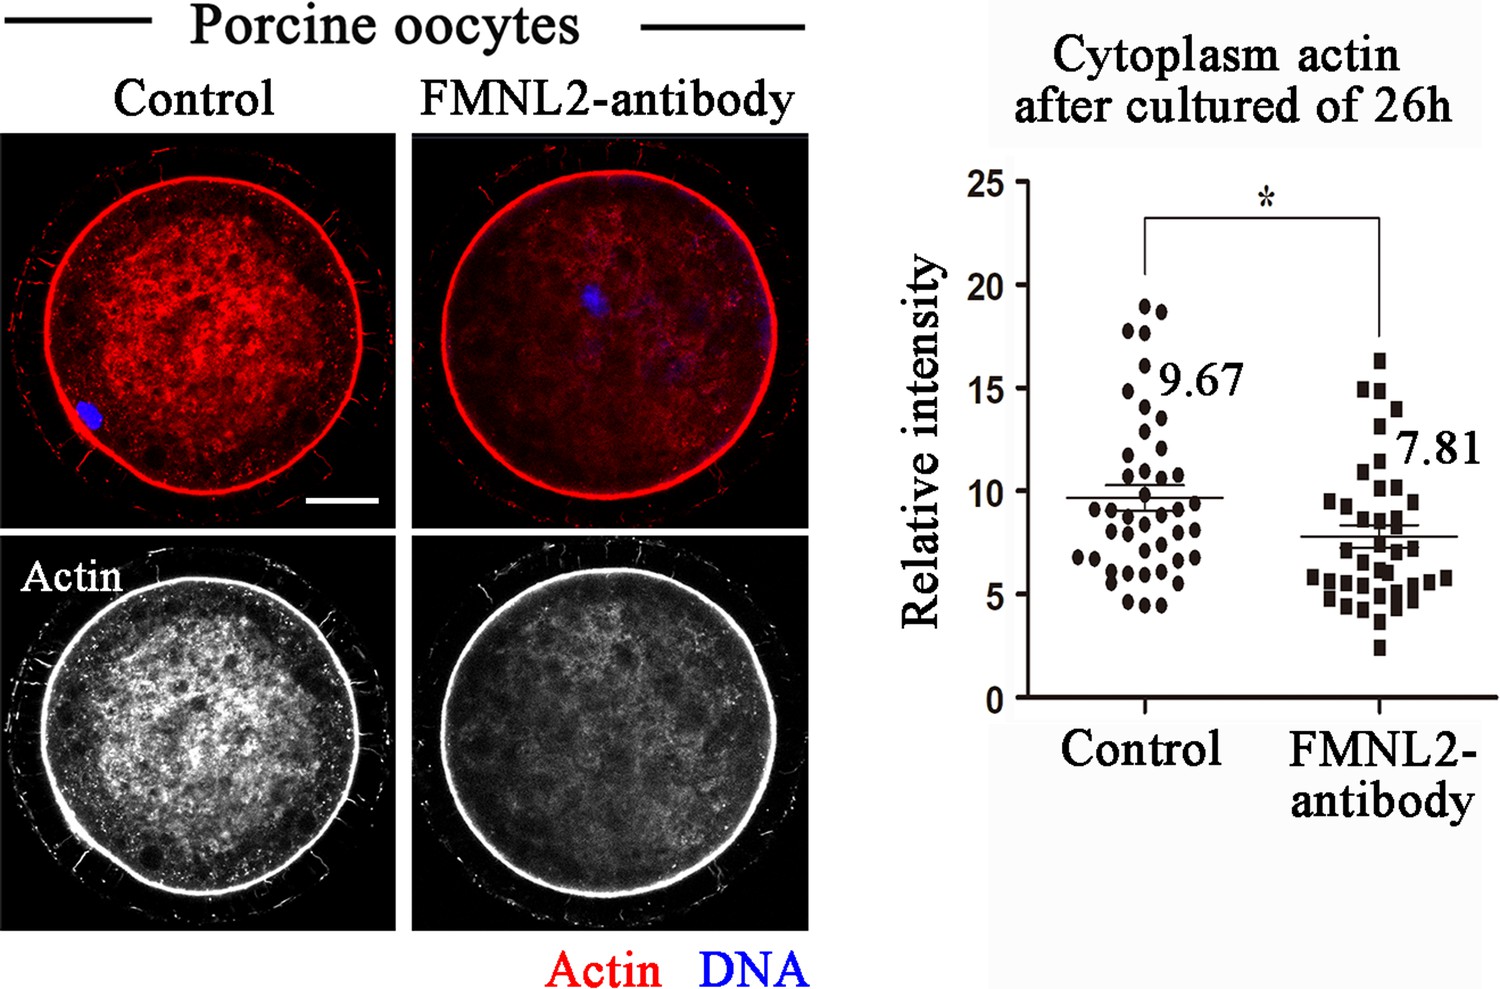
The actin intensity in the cytoplasm of porcine oocytes.
The intensity of cytoplasmic actin decreased after FMNL2 antibody injection.Red, actin; blue, DNA. Bar = 20 μm. Control (n = 42), FMNL2‐antibody (n = 40). The error bars are representing the mean ± SEM. The P‐values were calculated using Student's t‐test. *p < 0.05.
Figure 5 with 1 supplement
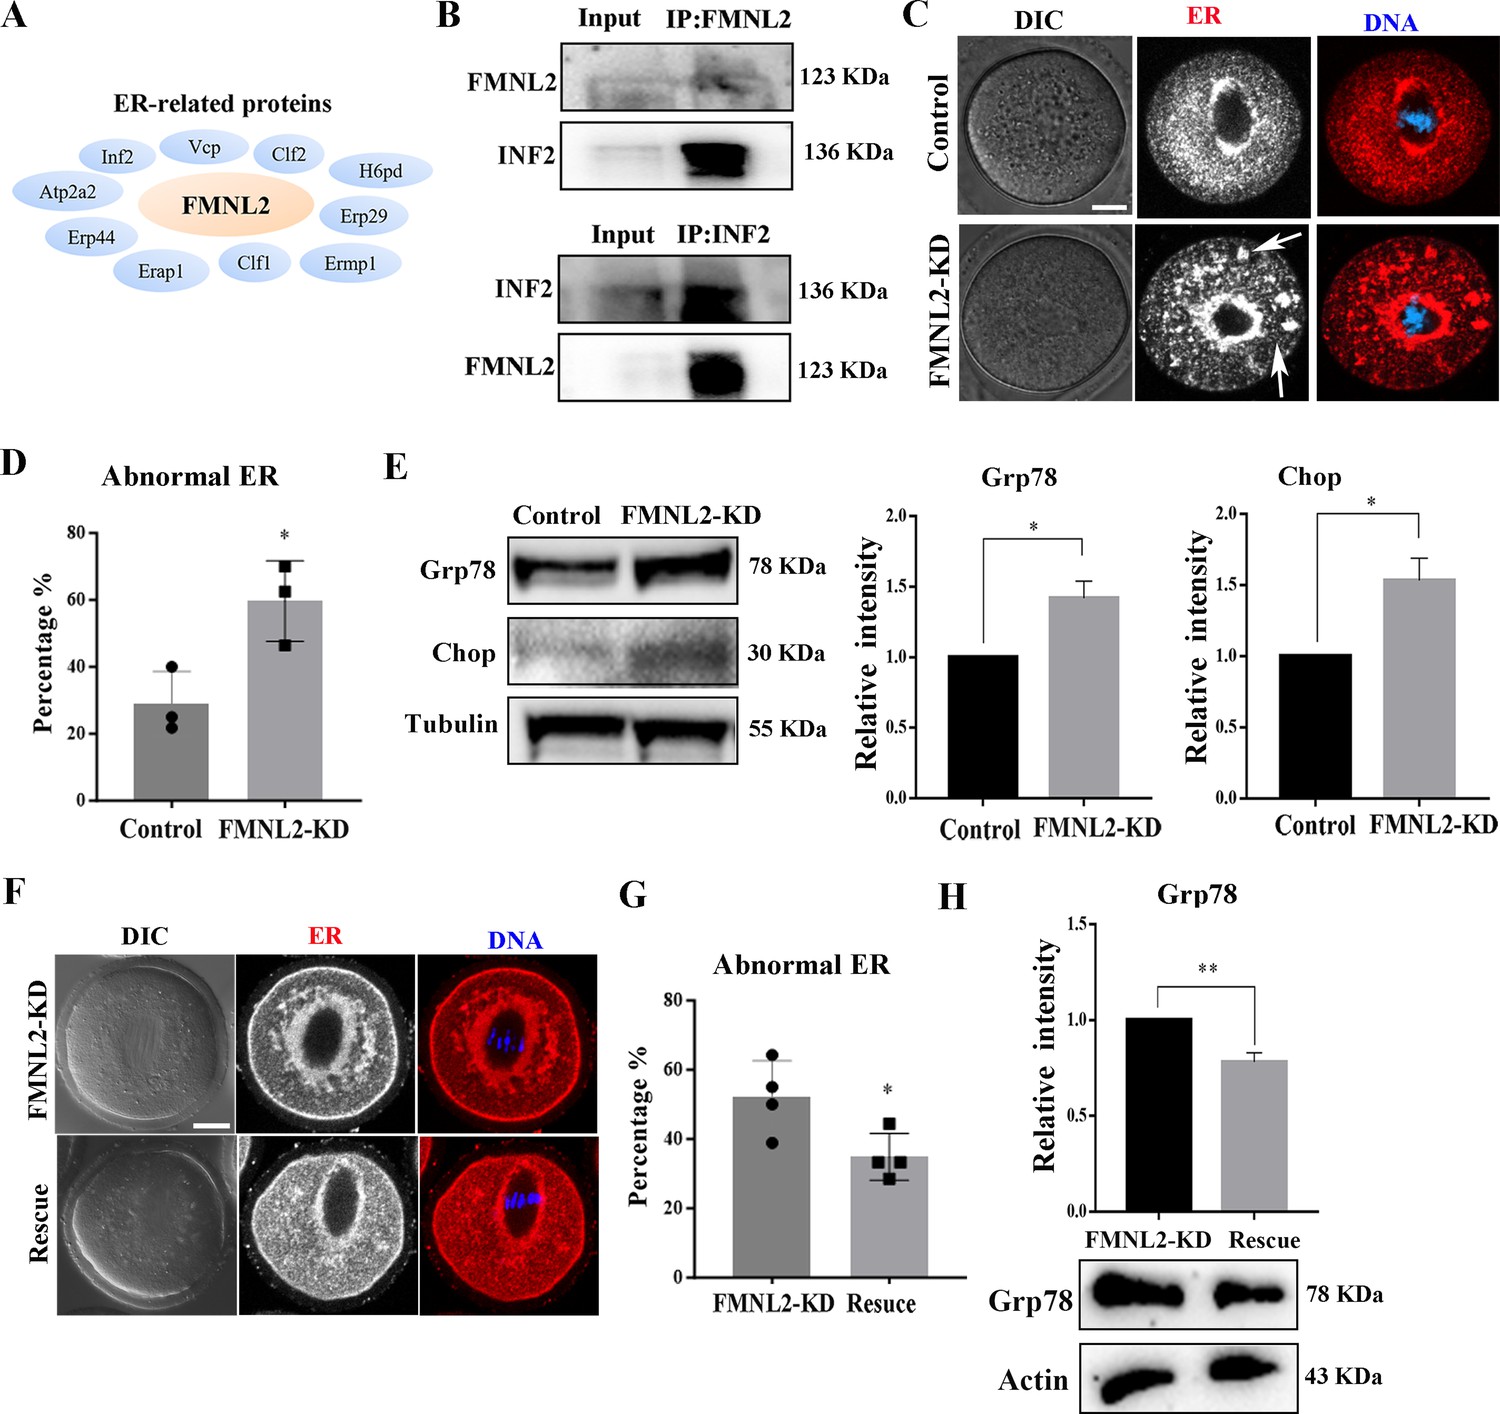
FMNL2 regulates endoplasmic reticulum (ER) distribution during mouse oocytes maturation.
(A) Mass spectrometry results showed that FMNL2 was associated with ER-related proteins. (B) Co-IP results showed that FMNL2 was correlated with INF2. (C) Representative images of ER distribution in the oocyte cytoplasm in the control group and FMNL2-KD group. In FMNL2-KD oocytes, ER agglomerated in cytoplasm (white arrow). Red, ER; blue, DNA. Bar = 20 μm. (D) Abnormal distribution of ER significantly increased in the FMNL2-KD oocytes compared with the control oocytes. Control (n = 27), FMNL2‐KD (n = 28). (E) Grp78 and Chop protein expression significantly increased in the FMNL2-KD oocytes compared with the control oocytes. The band intensity analysis also confirmed this finding. (F) Representative images of ER distribution in the oocyte cytoplasm in the FMNL2-KD group and rescue group. Red, ER; blue, DNA. Bar = 20 μm. (G) Abnormal distribution of ER significantly decreased in the rescue oocytes compared with the FMNL2-KD oocytes. FMNL2‐KD (n = 70), Rescue (n = 78). (H) Grp78 protein expression significantly decreased in the rescue oocytes compared with the FMNL2-KD oocytes. The error bars are representing the mean ± SEM. The P‐values were calculated using Student's t‐test. *p < 0.05, **p < 0.01.
-
Figure 5—source data 1
The original files of the full raw unedited blots in Figure 5.
- https://cdn.elifesciences.org/articles/92732/elife-92732-fig5-data1-v1.zip
-
Figure 5—source data 2
The figure with the uncropped blots with the labeled bands.
- https://cdn.elifesciences.org/articles/92732/elife-92732-fig5-data2-v1.zip
Figure 5—figure supplement 1
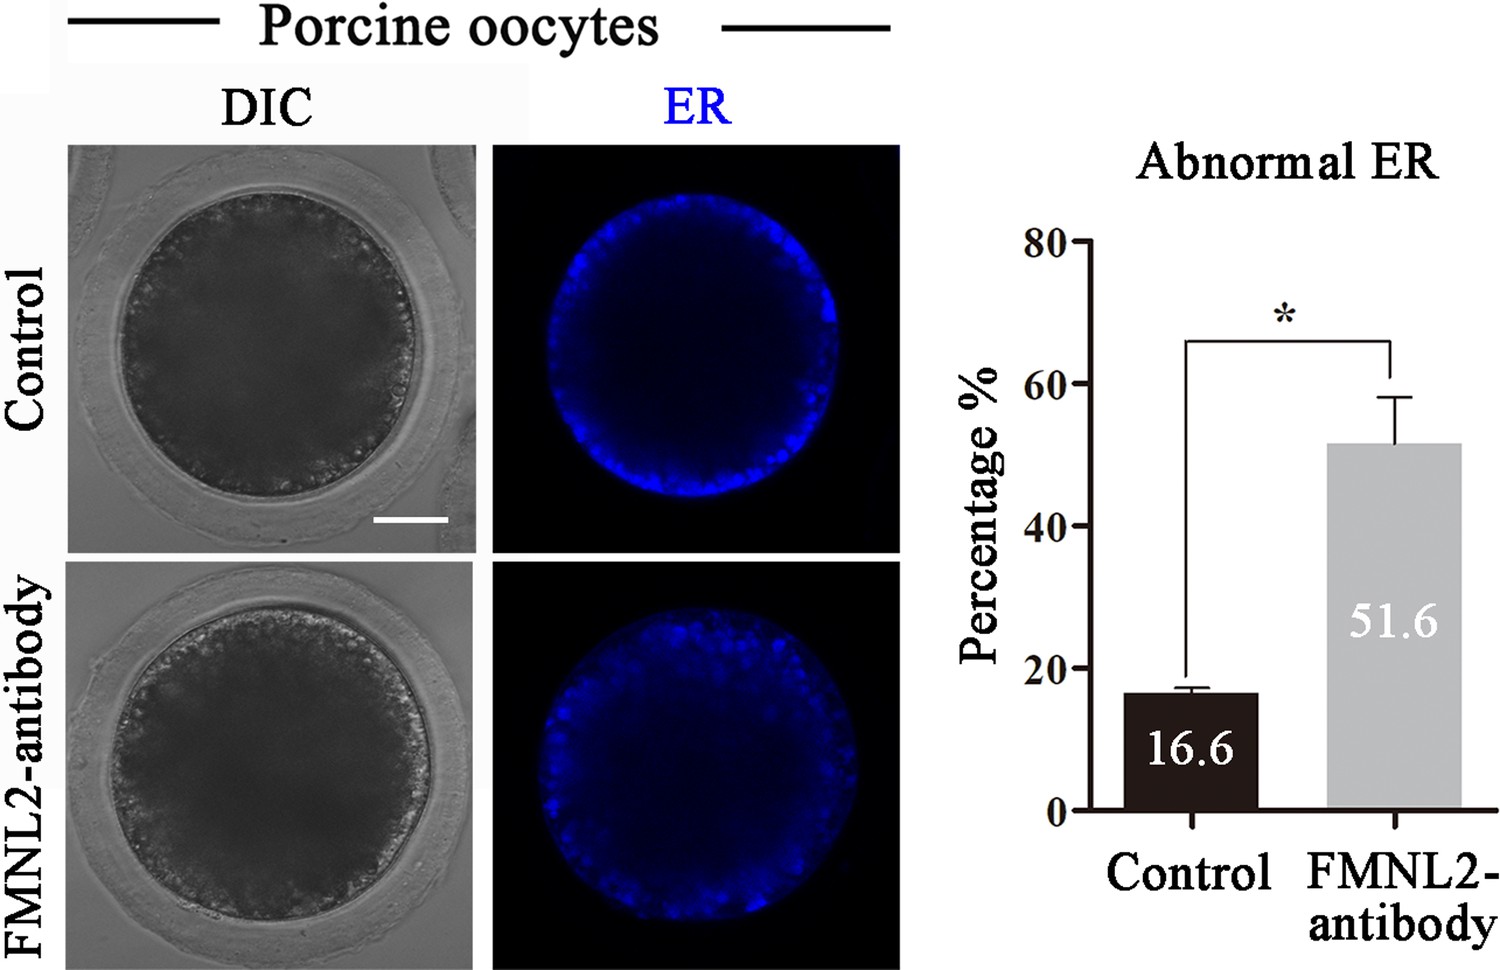
The endoplasmic reticulum (ER) distribution in porcine oocytes.
The rate of abnormal ER increased after FMNL2 antibody injection. Blue, ER. Bar = 20 μm. The error bars are representing the mean ± SEM. The P‐values were calculated using Student's t‐test. *p < 0.05.
Figure 6 with 1 supplement
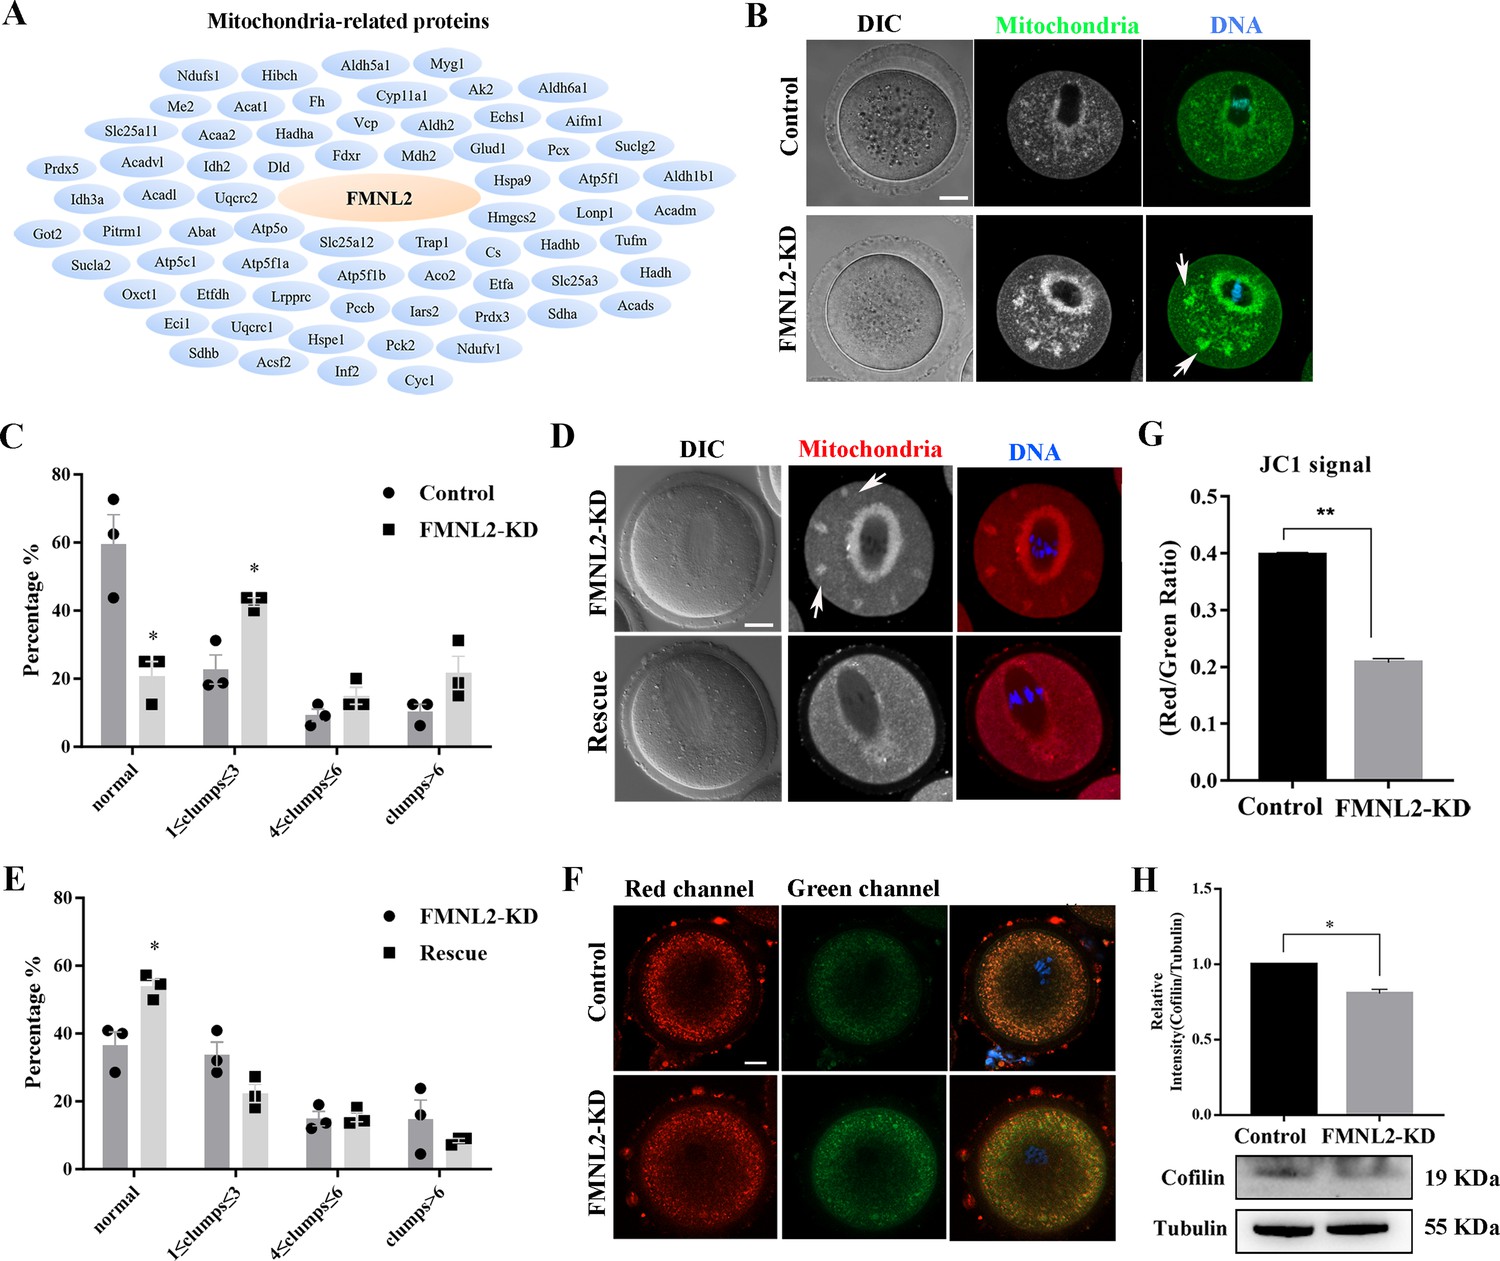
FMNL2 regulates mitochondrial distribution during mouse oocytes maturation.
(A) Mass spectrometry results showed that FMNL2 was related to many mitochondria-related proteins. (B) Representative images of mitochondrial distribution in the oocyte cytoplasm in the control group and FMNL2-KD group. In FMNL2-KD oocytes, mitochondrial agglomerated in cytoplasm (white arrow). Green, Mito;blue,DNA. Bar = 20 μm. (C) Abnormal distribution of mitochondrial significantly increased in the FMNL2-KD oocytes compared with the control oocytes. Control (n = 31), FMNL2‐KD (n = 32). (D) Representative images of mitochondrial distribution in the oocyte cytoplasm in the FMNL2-KD group and rescue group. In FMNL2-KD oocytes, mitochondrial agglomerated in cytoplasm (white arrow). Red, Mito; blue, DNA. Bar = 20 μm. (E) Abnormal distribution of mitochondrial significantly decreased in the rescue oocytes compared with the FMNL2-KD oocytes. FMNL2‐KD (n = 53), Rescue (n = 79). (F) The typical picture for JC1 green channel and red channel after FMNL2-KD. (G) The JC1 signal (red/green ratio) after FMNL2-KD compare with the control group, the JC-1 red/green fluorescence ratio was significantly reduced in FMNL2-KD groups. blue,DNA. Bar = 20 µm. (H) Cofilin protein expression significantly decreased in the FMNL2-KD oocytes compared with the control oocytes. The band intensity analysis also confirmed this finding. The error bars are representing the mean ± SEM. The P‐values were calculated using Student's t‐test. *p < 0.05, **p < 0.01.
-
Figure 6—source data 1
The original files of the full raw unedited blots in Figure 6.
- https://cdn.elifesciences.org/articles/92732/elife-92732-fig6-data1-v1.zip
-
Figure 6—source data 2
The figure with the uncropped blots with the labeled bands.
- https://cdn.elifesciences.org/articles/92732/elife-92732-fig6-data2-v1.zip
Figure 6—figure supplement 1

The mitochondria distribution in porcine oocytes.
The rate of abnormal mitochondria increased after FMNL2 antibody injection.Green, mitochondria. Bar = 20 μm. The error bars are representing the mean ± SEM. The P‐values were calculated using Student's t‐test. *p < 0.05.
Figure 7
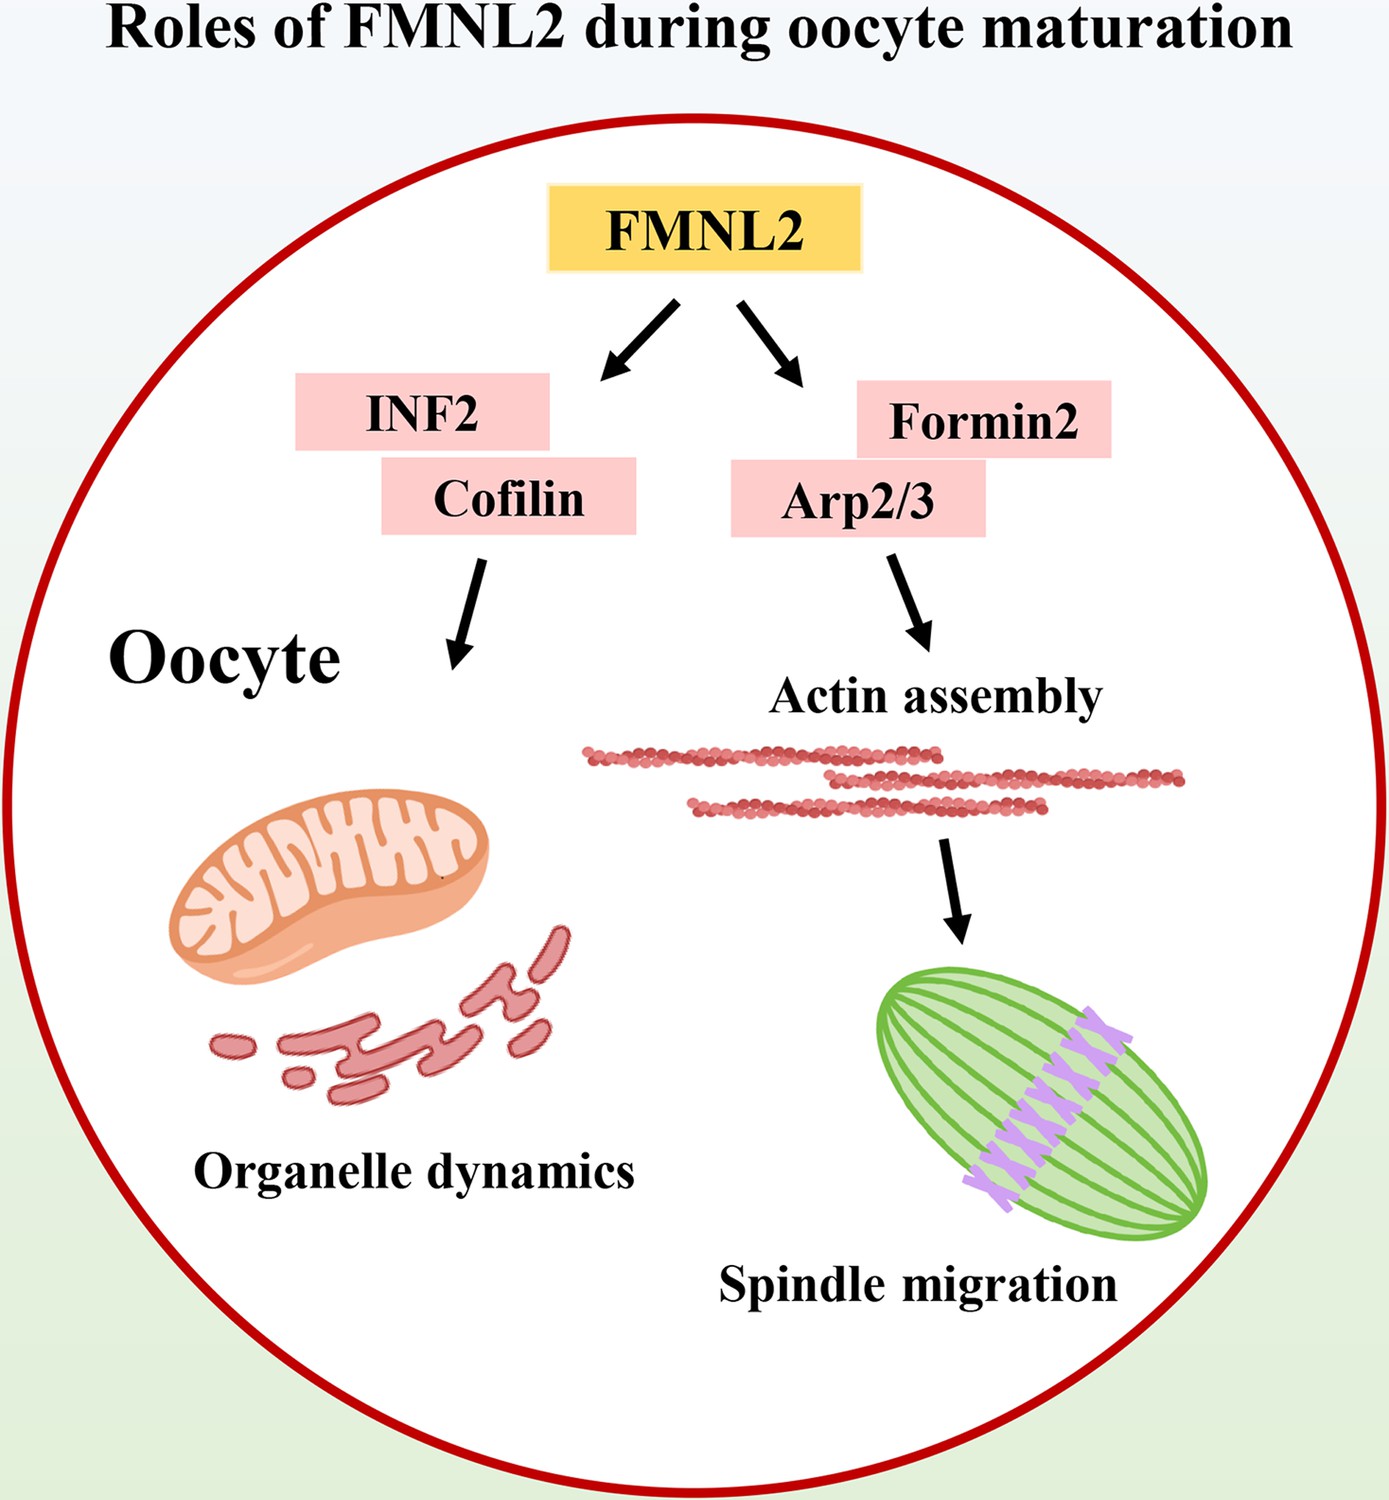
Diagram of the roles of FMNL2 during oocyte maturation.
FMNL2 associates with Formin2 and Arp2/3 complex for actin assembly, which further regulates spindle migration and INF2/Cofilin-related organelle dynamics during mouse and porcine oocyte maturation.
Additional files
Download links
A two-part list of links to download the article, or parts of the article, in various formats.
Downloads (link to download the article as PDF)
Open citations (links to open the citations from this article in various online reference manager services)
Cite this article (links to download the citations from this article in formats compatible with various reference manager tools)
FMNL2 regulates actin for endoplasmic reticulum and mitochondria distribution in oocyte meiosis
eLife 12:RP92732.
https://doi.org/10.7554/eLife.92732.3


