Identification of novel human microcephaly-linked protein Mtss2 that mediates cortical progenitor cell division and corticogenesis through Nedd9-RhoA
- Aix Marseille Univ, INSERM, INMED, France
- Neuroscience Center, HiLIFE, University of Helsinki, Finland
- Helsinki Institute of Life Science, HiLIFE, Finland
- Faculty of Biological and Environmental Sciences, University of Helsinki, Finland
- Aix Marseille Univ, Inserm, MMG, France
- Institute of Biotechnology, HiLIFE, University of Helsinki, Finland
- Department of Clinical Genetics, Erasmus MC, University Medical Center Rotterdam, Netherlands
Figures
Figure 1 with 2 supplements
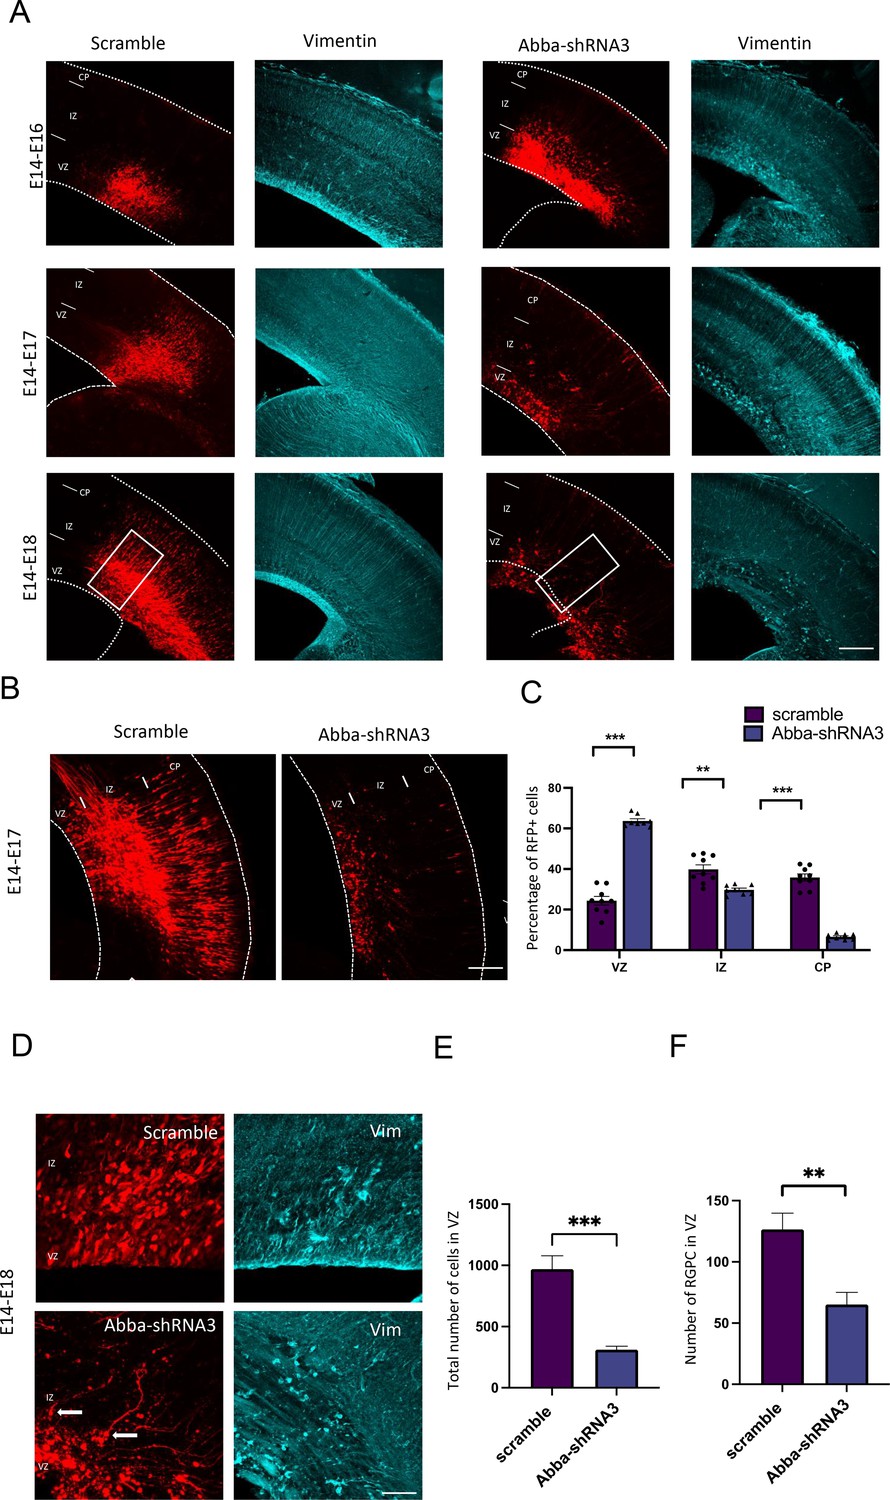
In utero knockdown of Mtss2 expression is linked to radial glial disruption and alters neuronal migration.
(A) Representative coronal sections of E16–18 mice brains electroporated at E14 with either scramble or Mtss2-shRNA3 and immunostained for vimentin (in blue). In Mtss2-shRNA3 brain sections, vimentin staining revealed a marked disruption of radial glial apical fibers. (B) Representative neocortical coronal sections showing migration of transfected cells 3 days after electroporation at E14 with either scramble or Mtss2-shRNA. (C) Quantification of red fluorescent protein (RFP)-positive cell distribution in the cortex at E17 (VZ/SVZ: scramble 24.33 ± 2.13%, Mtss2-shRNA3 63.71 ± 1.03%; IZ: scramble 39.80 ± 2.22%, Mtss2-shRNA3 29.71 ± 0.85%; CP: scramble 35.86 ± 1.73%; Mtss2-shRNA3 6.58 ± 0.53%; n=9 scramble and 8 Mtss2-shRNA3; VZ/SVZ: p=<0.0001: IZ: p=0.0002; CP: p=<0.0001) showing a significant increase of Mtss2 knockdown cells in SVZ/lower IZ. (D) Higher magnifications of regions indicated by a square in . (E) Total number of RFP-positive cells in mouse neocortex at E17 (scramble 969.2 ± 109.0%; Mtss2-shRNA3 311.3 ± 28.61%; n=9 scramble and 8 Mtss2-shRNA3) showing a striking reduction of RFP-positive cells in Mtss2 knockdown electroporated brains. Error bars represent mean ± s.d. **p<0.002, ***p<0.001. (F) Quantification of radial glial progenitor cells at the VZ (scramble 126.50 ± 13.36%, Mtss2-shRNA3 65.14 ± 9.91%). Mean ± s.d. VZ: ventricular zone, SVZ: subventricular zone, IZ: intermediate zone, CP: cortical plate. Error bars represent mean ± s.d. **p<0.002. Scale bars: 100 μm (A,B), 50 μm (D).
Figure 1—figure supplement 1

Alteration of Mtss2 expression by RNAi.
(A) Schematic diagram showing the position of small-hairpin RNAs targeting the coding sequence (CDShp) and the 3′UTR of Mtss2 mRNA. (B) Knockdown of endogenous Mtss2 mRNA expression in rat C6 glioma cells was measured by quantitative PCR (qPCR) 72 hr after transfection with CDShp or 3UTRhp. We observed a reduction of Mtss2 mRNA expression by 70% with Mtss2-shRNA3 compared with corresponding ineffective shRNAs (Mtss2-shRNA1 and Mtss2-shRNA2) or the control scramble. Rpl13a was used for normalization. (C) Western blot analysis revealed that Mtss2 protein levels, 72 hr after transfection, were much lower in cells transfected with Mtss2-shRNA3 compared with those transfected with scramble and with non-transfected (control) cells. α-Tubulin was used for normalization. (D) We observed a reduction of Mtss2 expression in Rat C6 glioma cells, 72 hr after transfection with Mtss2-shRNA3 compared with cells transfected with scramble. Error bars represent mean ± s.d. **p<0.02, ***p<0.001. Scale bars: 20 µm (D).
Figure 1—figure supplement 2

Distribution and directionality of radial glial progenitor (RGP).
(A) Representative picture of the distribution of red fluorescent protein (RFP)-expressing cells at E17 and corresponding cortical layer markers Cux1 and Ctip2. (B) Quantification of dispersion of vimentin staining similar to that in Figure 1 in different conditions (scramble, 14.27 ± 6% and Mtss2-shRNA3 40.8±19, n=20; p=0.0078). Scale bars represent 100 μm in (A).
Figure 2 with 1 supplement
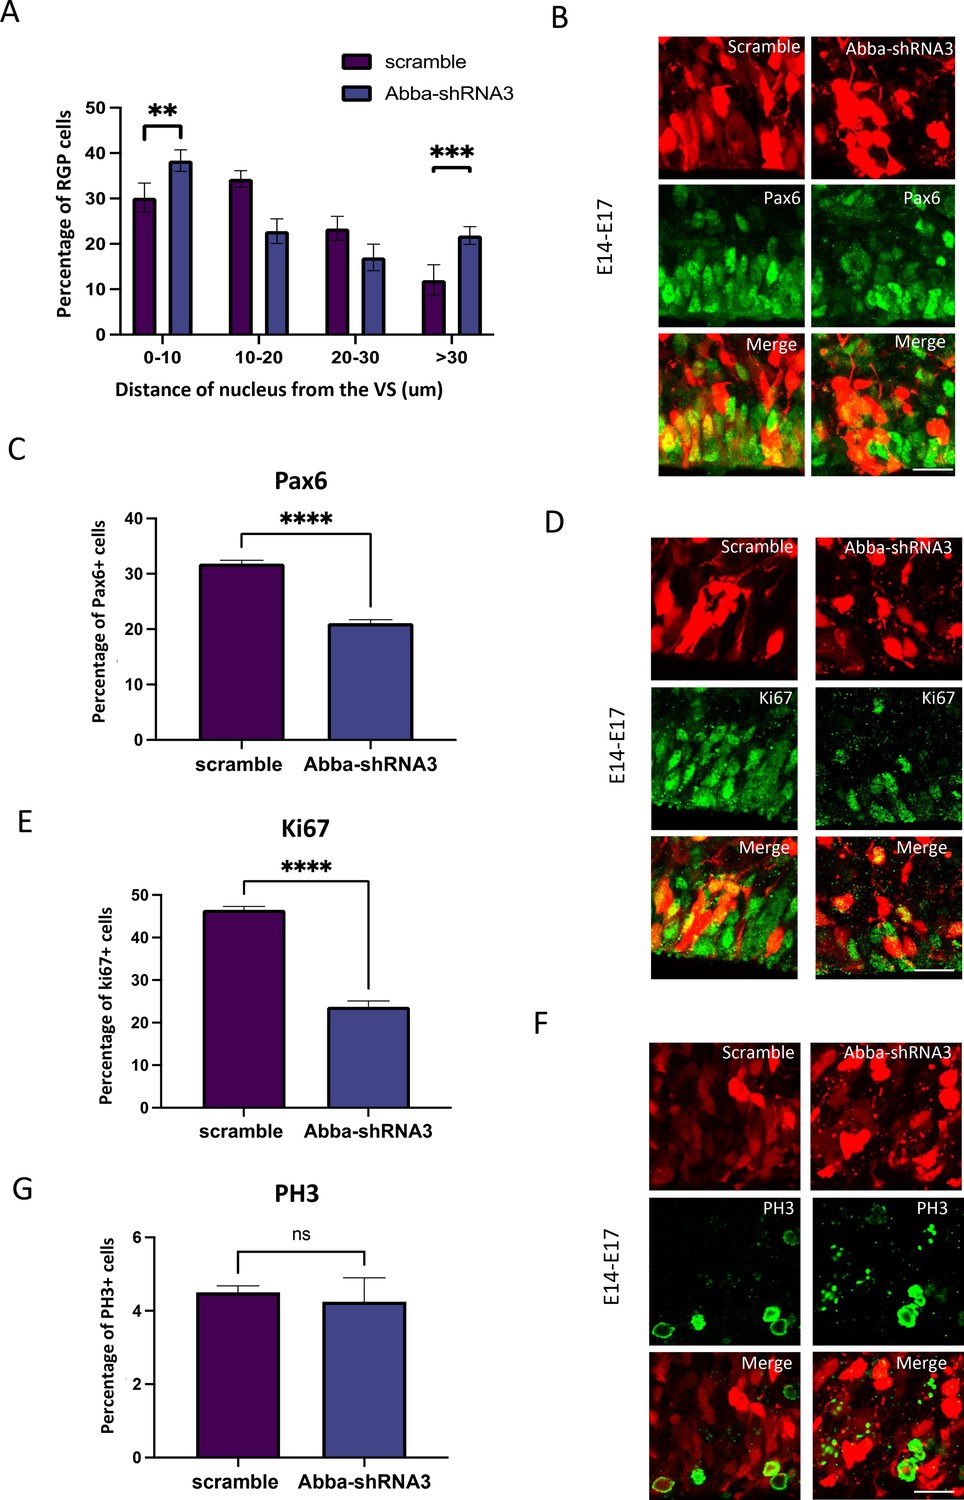
Mtss2 downregulation-induced inhibition of basal nuclear migration in radial glial progenitor (RGP) cells blocks cell cycle progression.
(A) Quantification of the nuclear distance from the ventricular surface (VS) for RGP cells after electroporation of scrambled or Mtss2-shRNA3. Nuclear distribution of red fluorescent protein (RFP) RGP cells was significantly altered after electroporation of Mtss2-shRNA3 (0–10: scramble, 30.20 ± 1.21%; Mtss2-shRNA3, 38.34 ± 0.89%; 10–20: scramble, 34.35±0.69%; Mtss2-shRNA3, 22.80 ± 1.03%; 20–30: scramble, 23.42 ± 1.00%; Mtss2-shRNA3, 17.00 ± 1.10%; >30: scramble, 12.04 ± 1.27%; Mtss2-shRNA3, 21.85 ± 0.74%; 0–10: p=0.000156; 10–20: p=<0.000001; 20–30: p=0.001030; >30: p=0.000023). (B–C) E14 mice brains were subjected to in utero electroporation with either scramble or Mtss2-shRNA3. Brains were then fixed at E17 and stained with the RGP cell marker Pax6. We observe an important decrease of Pax6 RGP cells expressing Mtss2-shRNA3 (scramble, 31.87 ± 0.57%; Mtss2-shRNA3, 21.08 ± 0.63%; n=8 scramble; 5 Mtss2-shRNA3). (D–G) E14 mice brains were subjected to in utero electroporation with either scramble or Mtss2-shRNA3. Brains were then fixed at E17 and stained with the cell cycle marker Ki67 (D) and phospho-histone 3 (PH3) (F). We observe a striking decrease in the percent of cycling (E: Ki67; scramble, 46.54 ± 0.79%, n=7; Mtss2-shRNA3, 23.71 ± 1.37%, n=5 Mtss2-shRNA3) and but not in mitotic (G:PH3; scramble, 4.50 ± 0.17%; Mtss2-shRNA3, 4.25 ± 0.65%) cells with low expression of Mtss2. . Error bars represent mean ± s.d. **p<0.002, ***p<0.001. Scale bar represents 20 μm.
Figure 2—figure supplement 1

Flow cytometry analysis of C6 cells.
(A) Cells expressing Mtss2-shRNA3 show accumulation in S-phase and recovery after additional expression of Mtss2-FL (G1: scramble 45.2±1.4%, Mtss2-shRNA3 37.4±1.0%, Mtss2-shRNA3+Mtss2-FL 42.8±1.3%; S: scramble 34.3±2.8%, Mtss2-shRNA3 48.2±2.7%, Mtss2-shRNA3+Mtss2-FL 38.9±3.4; G2: scramble 17.1±2.1%, Mtss2-shRNA3 14.4±2.7%, Mtss2-shRNA3+Mtss2-FL 15.9±1.9%; n=10). Error bars represent mean ± s.d. **p<0.002, ***p<0.001. (B) Quantification of the distance of RGPC nuclei from the ventricular surface (VS) at E17 (0–10: scramble 30.19 ± 3.2%, Mtss2-shRNA3 40.61 ± 2.7%, MTSS2-FL 37.81 ± 1.6%, MTSS2-R671W 50.40 ± 4.9%, Nedd9-shRNA 46.13 ± 2.4%; 10–20: scramble 34.34 ± 1.8%, Mtss2-shRNA3 21.55 ± 2.4%, MTSS2-FL 31.19 ± 2.3%, MTSS2-R671W 25.76 ± 4.8%, Nedd9-shRNA28.58 ± 5.8%; 20–30: scramble 23.41 ± 2.6%, Mtss2-shRNA3 16.34 ± 2.3%, MTSS2-FL 20.40 ± 3.2%, MTSS2-R671W 16.11 ± 5.1%, Nedd9-shRNA18.39 ± 4.8%; >30: scramble 12.03 ± 3.3%, Mtss2-shRNA3 21.49 ± 2.1%, MTSS2-FL 10.58 ± 3.2%, MTSS2-R671W 7.70 ± 3.4%, Nedd9-shRNA 6.88 ± 2.7%; n=7 scramble and Mtss2-shRNA3, n=6 Nedd9-shRNA and MTSS2-R671W, n=5 MTSS2-FL). (C) Quantification of the number of RGPC in the ventricular zone (VZ) at E17 (scramble 126.5±37.8, Mtss2-shRNA3 48.28±20.9, MTSS2-FL 58±25.7, MTSS2-R671W 35.16±16.7, Nedd9-shRNA 82.66±18.4).
Figure 3 with 3 supplements

Mtss2 downregulation blocks cytokinesis.
(A) Cellular distribution of Mtss2 in C6 cells during cell division. Upper panel shows two example immunofluorescent microscopy images of Mtss2 (red). Left-most figure shows the projection images at the cross line of the image. Mid and lower panels show the distribution of Mtss2 at different cell division stages in relation to β-tubulin (green) aggregation. (B) Immunofluorescence microscopy images from C6 cells 72 hr after transfection with Mtss2-shRNA3 show an absence of Mtss2 expression at cytokinesis. (C) Brain slices prepared from in utero electroporated animals with either Mtss2-shRNA or scramble were cultured at E17 and subjected to live imaging for a duration of 15–20 hr. The length of the time lapse was adjusted as necessary to capture significant events during interkinetic nuclear migration (INM). In the case of the scramble group, a radial glial progenitor (RGP) cell underwent a single mitotic event at the ventricular surface of the brain slice, observed at time points 1:50 and 2:20. At time point 3:00, two cells can be observed (indicated by arrows), along with the presence of basal fibers (indicated by arrowheads). Conversely, in the Mtss2 knockdown group, the nucleus of the RGP (indicated by an arrow) initially underwent apical interkinetic nuclear migration (INM) and subsequently divided at 8:30. Remarkably, the resulting daughter cells remained at the ventricular surface for at least 7 hr, suggesting that the absence of Mtss2 hinders cells from exiting the mitotic state. (D) Mtss2-shRNA3-expressing cells show an increase in cytokinesis (scramble 0.8285±0.1161%, n=12; Mtss2-shRNA3 2.078±0.2682%, n=12). (E) Quantification of the total number of red fluorescent protein (RFP)-positive cells in the neocortex illustrating the impact of cytokinesis block on cell survival. We observed a lower total number of cells 4 days after transfection with Mtss2-shRNA3 compared with control scramble (scramble 380.3±48.16%; n=12, Mtss2-shRNA3 155.8±22.32%; p=<0.0001; n=12). Error bars represent mean ± s.d. *p<0.03, **p<0.002, ***p<0.001. Scale bars: 20 μm.
Figure 3—figure supplement 1

Quantification of Anillin expression changes during 15 hr live-imaging recordings.
(A) shows a representative image Z-stack projection of a single time point. (B) Graph showing the results from tracking of number of Anillin-expressing cells at each time point during 15 hr recording was quantified under different conditions (scramble, 100.2 ± 15% and Mtss2-shRNA3 152.6 ± 22, n=20; p=0.036).
Figure 3—video 1
Symmetric division.
Related to Figure 3C, top panel. E14 mouse embryonic brain was electroporated with vectors expressing Mtss2 short hairpin RNA (shRNA) and red fluorescent protein (RFP). Brain was sectioned at E17 and imaged every 15 min. Nucleus of radial glial progenitor (RGP) cell apically migrated to the ventricular surface and underwent symmetric division.
Figure 3—video 2
Absence of division in Mtss2-depleted progenitor cells.
Related to Figure 3C, bottom panel. E14 mouse embryonic brain was electroporated with vectors expressing Mtss2 short hairpin RNA (shRNA) and red fluorescent protein (RFP). Brain was sectioned at E17 and imaged every 15 min. Nucleus of radial glial progenitor (RGP) cell apically migrated to the apical surface and remains blocked at the ventricular surface for hours without being able to enter mitosis.
Figure 4 with 1 supplement
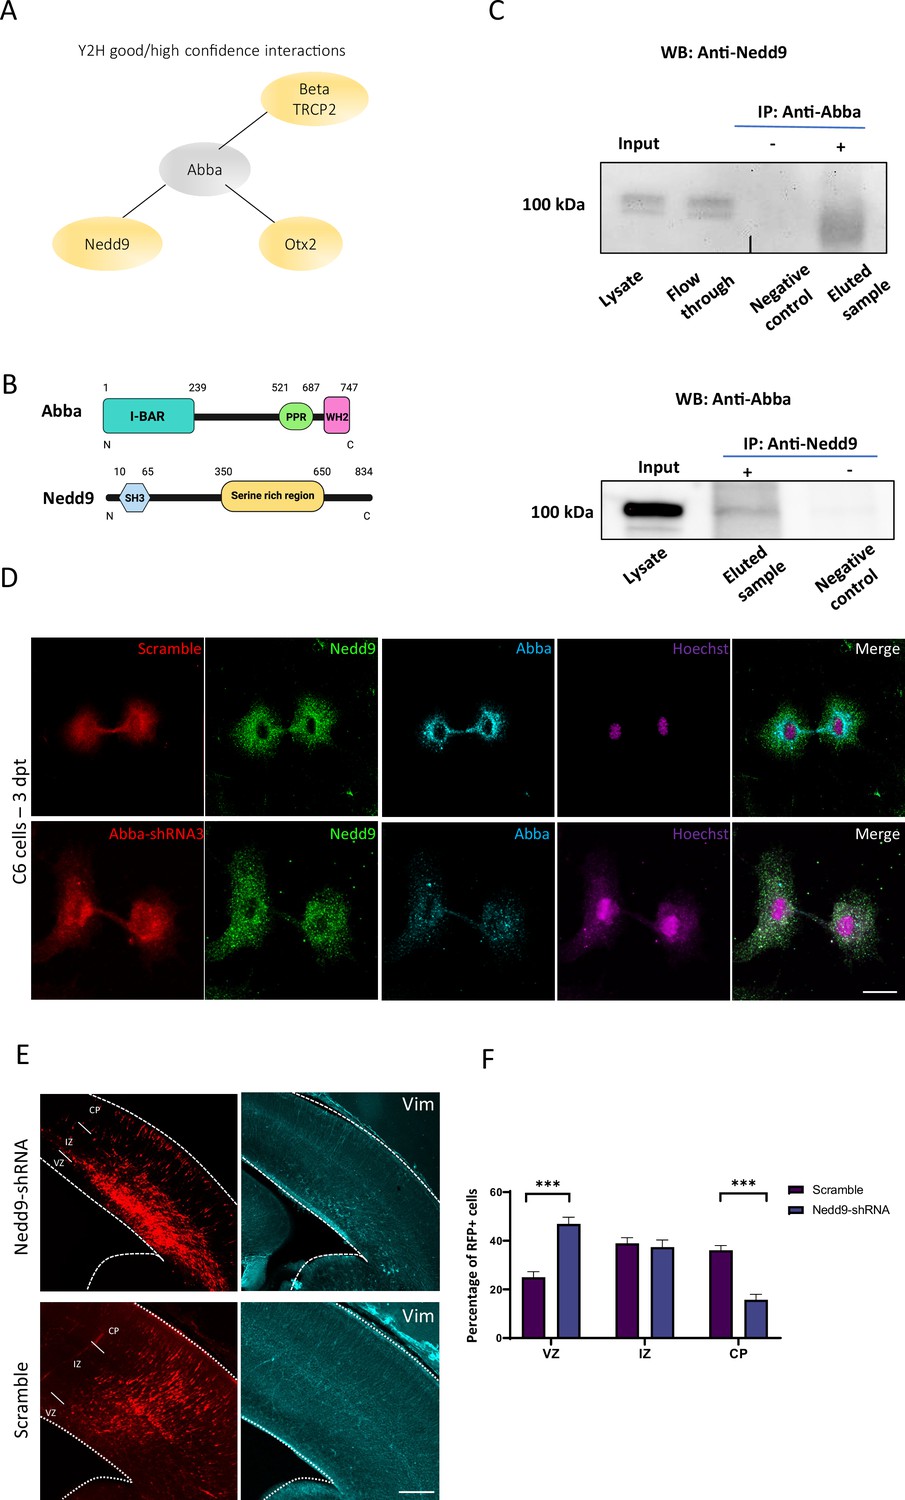
Role of Mtss2-Nedd9 complex in radial glial progenitor (RGP) cells division.
(A) Good and high confidence interactions detected in yeast two-hybrid screen performed in mouse brain embryo library using full-length mouse Mtss2 as a bait. (B) Schematic representation of the Mtss2 and Nedd9 proteins. (C) E18 cortical homogenates were subjected to a direct pull-down assay with endogenous Mtss2 and Nedd9. Nedd9 co-immunoprecipitated with Mtss2, but not in control pull-downs showing the specificity of the interaction. (D) Immunocytochemistry on C6 cells 72 hr after transfection with Mtss2-shRNA3 shows that lack of Mtss2 did not decrease Nedd9 expression (green) but rather its localization at the cleavage furrow/cytokinetic bridge stage. Scale bars: 20 μm. (E) Representative coronal sections of E17 mice brains transfected at E14 with Nedd9-shRNA and immunostained for vimentin (in blue). Vimentin staining revealed a marked disruption of radial glial apical fibers. (F) Quantification of red fluorescent protein (RFP)-positive cell distribution in the cortex at E17 (ventricular zone/subventricular zone [VZ/SVZ]: scramble 25 ± 2.30%, Nedd9-shRNA 46.92 ± 2.78%; IZ: scramble 38.94 ± 2.32%, Nedd9-shRNA 37.37 ± 2.96%; CP: scramble 36.06 ± 1.95%; Nedd9-shRNA 15.71 ± 2.25%; n=8 scramble and 7 Nedd9-shRNA; VZ/SVZ: p=<0.0001: IZ: p=0.0002; CP: p=<0.0001) showing a significant increase of Nedd9 knockdown cells in SVZ/lower IZ. Scale bars: 100 μm (E), 50 μm (D).
-
Figure 4—source data 1
Western blot source data.
- https://cdn.elifesciences.org/articles/92748/elife-92748-fig4-data1-v1.pdf
-
Figure 4—source data 2
Nedd9 WB source data.
- https://cdn.elifesciences.org/articles/92748/elife-92748-fig4-data2-v1.zip
-
Figure 4—source data 3
Abba WB source data.
- https://cdn.elifesciences.org/articles/92748/elife-92748-fig4-data3-v1.zip
Figure 4—figure supplement 1

Nedd9 shRNA efficiency test in C6 cells and effect on phospho-histone 3 (PH3) positive cell in vivo.
(A) Quantification of Nedd9 mRNA expression in C6 cell after 72 hr transfection with four different shRNA constructs. Sh3 shows most efficiently decreased Nedd9 expression. (B) Scramble and Nedd9-shRNA electroporated brains were stained with the late G2/M phase marker PH3. (C) The percentage of PH3-positive nuclei located at the ventricular surface (VS) did not increase in radial glial progenitor (RGP) cells expressing Nedd9-shRNA (scramble, 4.50 ± 0.18%, n=9; Nedd9-shRNA: 5.07 ± 0.35%, n=6, p=0.1135). (D) C6 cell homogenates were subjected to a direct pull-down assay. Nedd9 co-immunoprecipitated with endogenous Mtss2, indicating the specificity of the interaction. Error bars represent mean ± s.d. **p<0.002, ***p<0.001. VZ: ventricular zone, IZ: intermediate zone, CP: cortical plate. Scale bars: 20 μm (D).
-
Figure 4—figure supplement 1—source data 1
Abba WB source data.
- https://cdn.elifesciences.org/articles/92748/elife-92748-fig4-figsupp1-data1-v1.zip
Figure 5
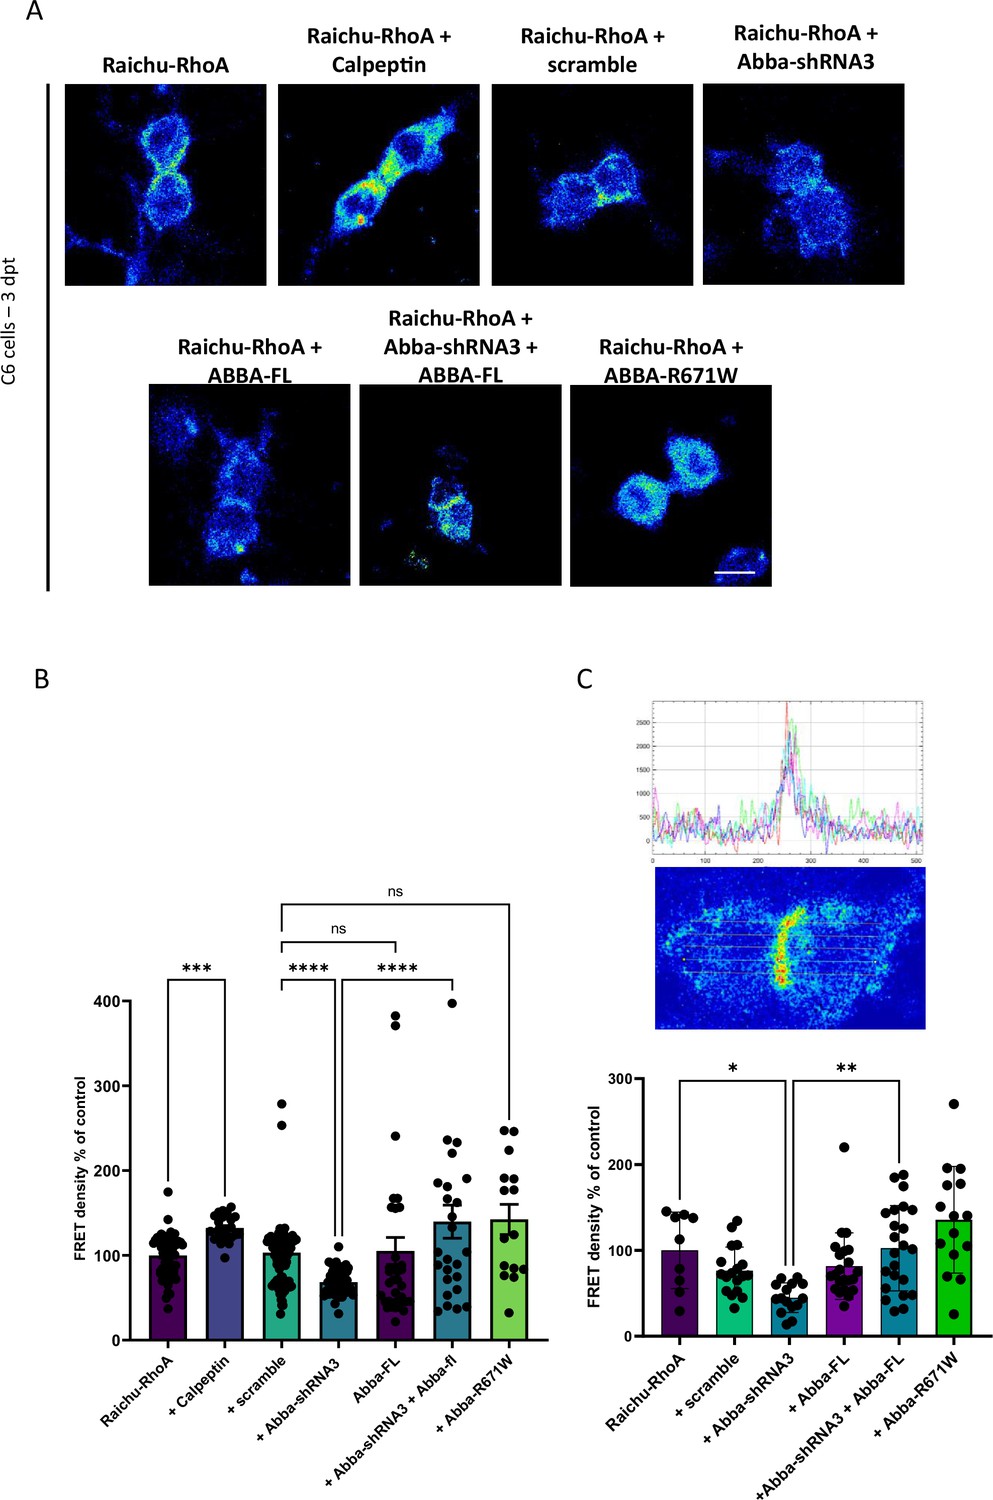
Mtss2 downregulation decreases RhoA activity.
(A) Confocal images were captured of C6 cells 72 hr post-transfection with the Raichu-RhoA vector for monitoring RhoA activity. Six experimental groups were examined: transfected with scramble control, Mtss2-shRNA3, Mtss2-fl, rescue of Mtss2-shRNA3 with Mtss2-fl, and expression of the mutant Mtss2-R671W, in addition to testing the sensitivity of the assay to RhoA activation by calpeptin. (B) Quantification of FRET density (Raichu-RhoA activity) showed a decrease in Raichu-RhoA activity in C6 cells transfected with Mtss2-shRNA3 as compared to transfected with the scramble (scramble, 103.1.03±5.3; n=102, Mtss2-shRNA3: 68.5±2.3; n=46; p<0.0001, Mtss2-shRNA+MTSS2-FL: 139.8±19.6 n=26, Mtss2-FL: 105.2±16.0; n=37, Mtss2-R671W: 142±17.9; n=15). (C) Quantification of the Raichu-RhoA activity in the furrow region shows similar effects. Upper panels show FRET image of a dividing cell and corresponding quantification of FRET intensity across the cell. Lower panel shows the normalized FRET intensity at the furrow (scramble, 76.3±27.6; n=18, Mtss2-shRNA3: 44.8±17.2; n=15, Mtss2-shRNA+MTSS2-FL: 102,5±49.7 n=23, Mtss2-FL: 81.6±38.7,0; n=22; p<0.0001, Mtss2-R671W: 135.7±62.4; n=15). Error bars represent mean ± s.d. **p<0.002, ***p<0.001. Scale bar: 25 μm (A), 50 μm (C).
Figure 6 with 1 supplement
Effect of MTSS2 R671W human mutation on neuronal migration and mitosis.
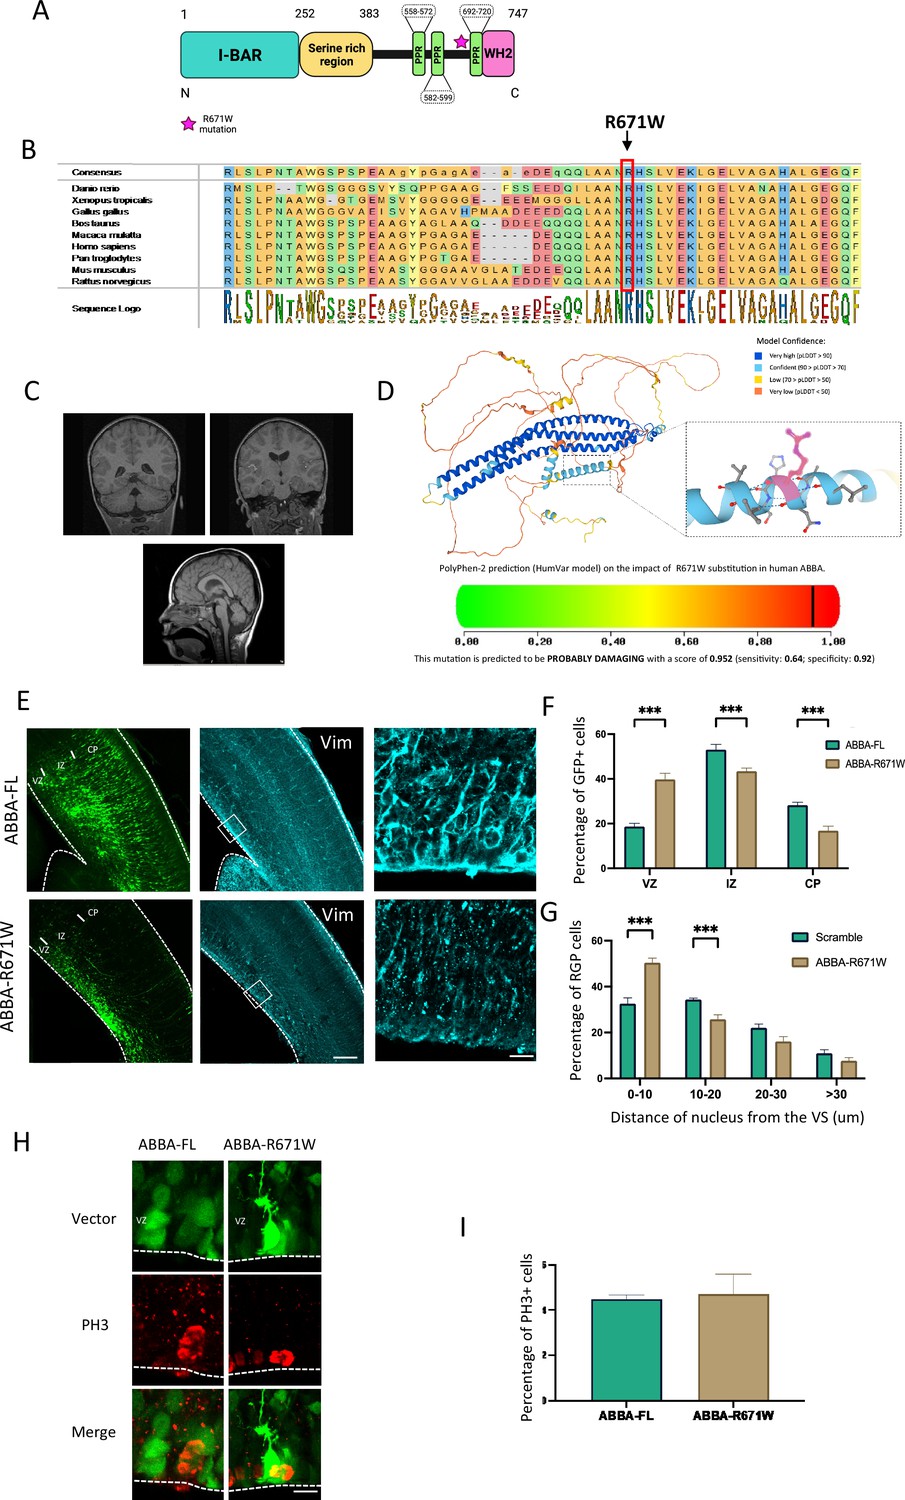
(A) MTSS2 is composed of an N-terminal Bin-Amphiphysin-Rvs (BAR) domain, a serine-rich region, three proline-rich motifs, and a C-terminal Wasp Homology-2 domain (WH2) domain. (B) Evolutionary conservation analysis revealed that the Arg671 site is conserved from zebrafish to humans. (C) Representative brain imaging features of one patient carrying MTSS2 R671W variant. (D) 3D structure of MTSS2 denoting the position of arginine 571. Lower panel shows the high probability of disruption of the α-helix conformation by an arginine to tryptophan mutation. (E) Coronal sections of E17 mice brains electroporated at E14 with cDNAs encoding the human wild-type, MTSS2-FL, or the human mutant form of MTSS2, MTSS2-R671W. Expression of MTSS2-R671W results in a defect in neuronal migration as indicated by the accumulation of neurons in the SVZ/lower IZ, as well as a disorganization of the radial glial cell fibers using vimentin staining. (F) Quantification of cell distribution in the cortex at E17 (VZ/SVZ: MTSS2-FL 18.67 ± 1.44%, MTSS2-R671W 39.77 ± 2.73%; IZ: MTSS2-FL 53.07 ± 2.37%, MTSS2-R671W 43.40 ± 1.40%; CP: MTSS2-FL 28.25 ± 1.25%, MTSS2-R671W 16.8 ± 2.03%; n=6) showing a significant increase of mutant cells in SVZ/lower IZ. (G) Quantification of the distance of radial glial progenitor (RGP) nuclei from the ventricular surface (VS) at E17 (0–10: MTSS2-FL 32.56 ± 2.58%, MTSS2-R671W 50.04 ± 2.04%; 10–20: MTSS2-FL 34.37±0.59%, MTSS2-R671W 25.76 ± 1.97%; 20–30: MTSS2-FL 22.08 ± 1.59%, MTSS2-R671W 16.12 ± 2.12%; >30: MTSS2-FL 10.99 ± 1.52%, MTSS2-R671W 7.71 ± 1.38%; n=8 MTSS2-FL and n=6 MTSS2-R671W), revealing accumulation at this site for the mutant, but not wild-type MTSS2 (VZ/SVZ: p=0.000001: IZ: p=0.0014; CP: p=0.0003; 0–10: p=0.0002; 10–20: p=0.0005; 20–30: p=0.040; >30: p=0.150); mean ± s.d. (H) Brains were fixed at E17 and stained with the mitotic marker phospho-histone 3 (PH3). (I) The percentage of PH3-positive nuclei located at the ventricular surface (VS) did not differ in RGP cells expressing MTSS2-R671W (MTSS2-FL, 4.50 ± 0.17%, n=9; MTSS2-R671W, 4.71 ± 0.88%, n=5, p=0.761). Error bars represent mean ± s.d. **p<0.01, ***p<0.001. VZ: ventricular zone, SVZ: subventricular zone, IZ: intermediate zone, CP: cortical plate. Scale bars: 100 μm, 50 μm (E), 20 μm (H).
Figure 6—figure supplement 1

Impact of suppression and overexpression of MTSS2 on migrating neurons.
The figure illustrates the variation in the length and total number of processes in cortical neurons electroporated with either Mtss2-ShRNA3 or MTSS2-FL and MTSS2 mutant (upper panel). Lower panel: staining with Mtss2 antibody. IZ: intermediate zone, CP: cortical plate. Scale bars: 20 μm.
Additional files
-
Supplementary file 1
Yeast two-hybrid (Y2H) screening results.
- https://cdn.elifesciences.org/articles/92748/elife-92748-supp1-v1.pdf
-
Supplementary file 2
Summary of clinical and imaging phenotypes associated with mutations in MTSS2.
- https://cdn.elifesciences.org/articles/92748/elife-92748-supp2-v1.pdf
-
MDAR checklist
- https://cdn.elifesciences.org/articles/92748/elife-92748-mdarchecklist1-v1.pdf
Download links
A two-part list of links to download the article, or parts of the article, in various formats.
Downloads (link to download the article as PDF)
Open citations (links to open the citations from this article in various online reference manager services)
Cite this article (links to download the citations from this article in formats compatible with various reference manager tools)
Identification of novel human microcephaly-linked protein Mtss2 that mediates cortical progenitor cell division and corticogenesis through Nedd9-RhoA
eLife 13:RP92748.
https://doi.org/10.7554/eLife.92748.4


