Human promoter directionality is determined by transcriptional initiation and the opposing activities of INTS11 and CDK9
- The Living Systems Institute, University of Exeter, United Kingdom
Figures
Figure 1 with 1 supplement
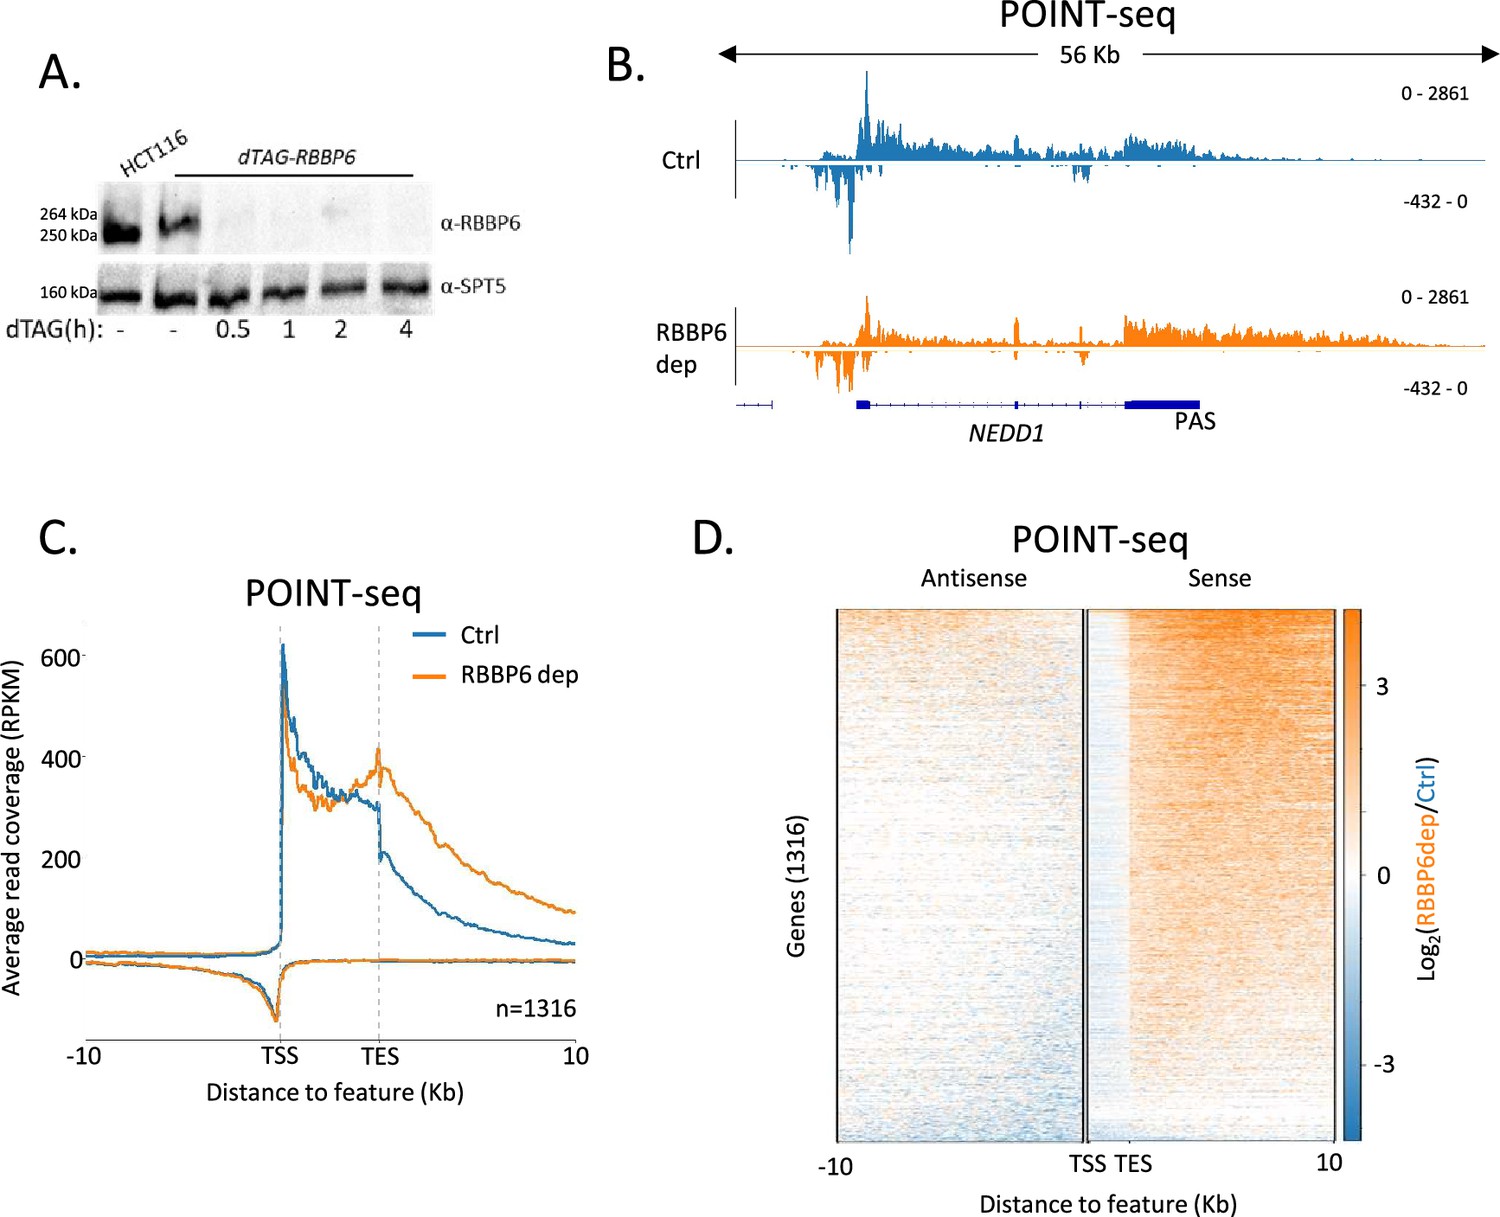
RBBP6 loss disrupts polyadenylation signal (PAS)-dependent termination of sense transcription.
(A) Western blot demonstrating the depletion of dTAG-RBBP6 over a time course of dTAGv-1 addition. SPT5 serves as a loading control. (B) Genome browser track of NEDD1 in POINT-seq data from dTAG-RBBP6 cells treated (RBBP6 dep) or not (Ctrl) with dTAGv-1 (2 hr). RBBP6 depletion induces a transcriptional termination defect in the protein-coding direction (downstream of the indicated PAS) but not the upstream antisense direction. The y-axis shows Reads Per Kilobase per Million mapped reads (RPKM). (C) Metaplot of POINT-seq data from dTAG-RBBP6 cells treated (RBBP6 dep) or not (Ctrl) (2 hr) with dTAGv-1. This shows 1316 protein-coding genes selected as separated from any expressed transcription unit by ≥10 kb. Signals above and below the x-axis are sense and antisense reads, respectively. The y-axis scale is RPKM. TSS = transcription start site; TES = transcription end site (and marks the PAS position). Coverage is shown over a region between 10 kb upstream of the TSS to 10 kb downstream of the TES. This is an average of two biological replicates. (D) Heatmap representation of the data in (C), which displays signal as a log2 fold change (log2FC) in RBBP6 depleted vs. un-depleted (Ctrl) conditions. This is an average of two biological replicates.
-
Figure 1—source data 1
Original unannotated and uncropped images of the western blots used for Figure 1A.
- https://cdn.elifesciences.org/articles/92764/elife-92764-fig1-data1-v1.pdf
-
Figure 1—source data 2
Original uncropped images of the western blots used for Figure 1A with relevant bands labelled and highlighted.
- https://cdn.elifesciences.org/articles/92764/elife-92764-fig1-data2-v1.pdf
Figure 1—figure supplement 1
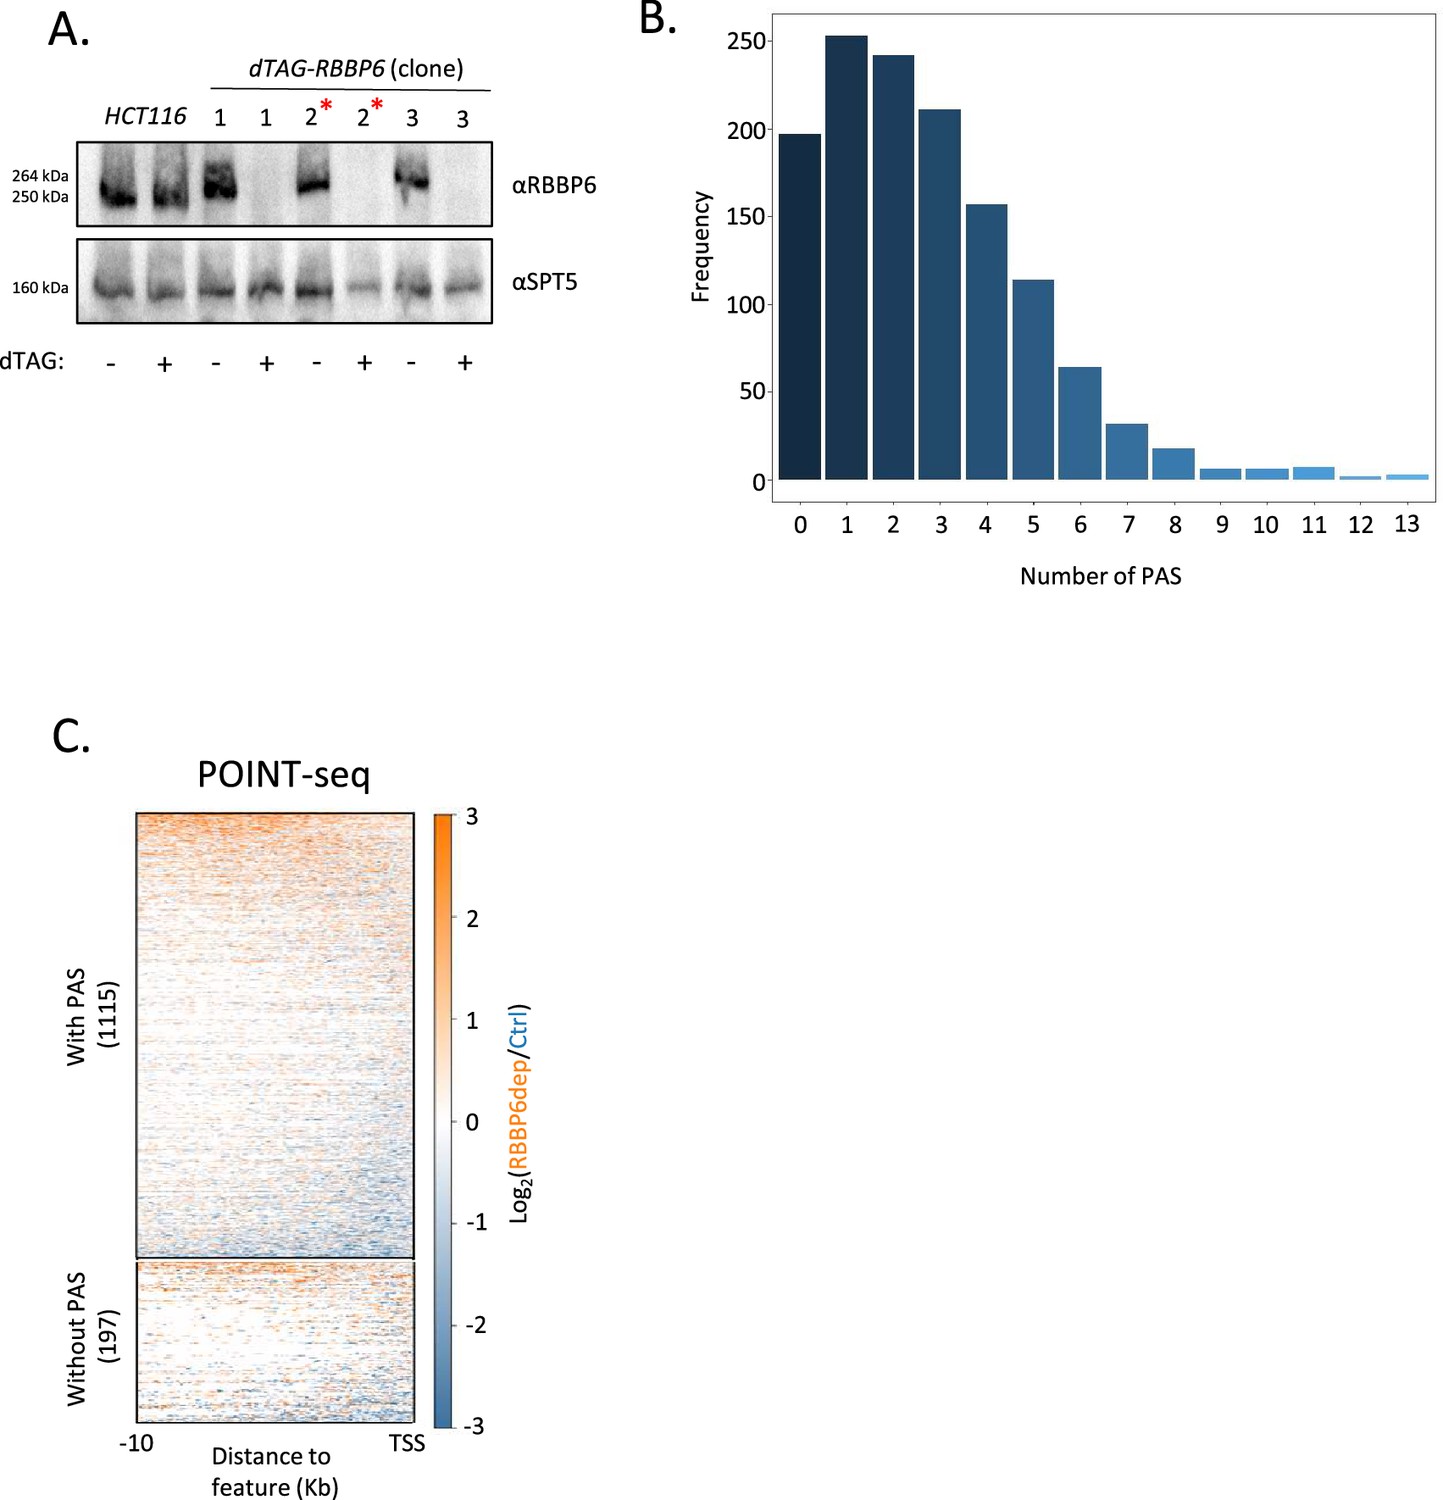
RBBP6 loss has limited effects on upstream antisense transcription.
(A) Western blot showing three separate dTAG-RBBP6 HCT116 cell clones. In each case, homozygous tagging is demonstrated by the size shift vs. endogenous RBBP6 (HCT116 lane). Tagged RBBP6 is completely depleted by 2hr treatment with dTAGv-1 whereas endogenous RBBP6 is unaffected. SPT5 serves as a loading control. Clone number 2 (red asterisk) was selected for the experiments in Figure 1. (B) Graph plotting the number of AAUAAA sequences in antisense transcripts derived from a 3 kb window upstream of transcription start sites (TSSs). Y-axis is the number of transcripts, and the x-axis shows the AAUAAA count per transcript. (C) Heatmap of control or RBBP6-depleted POINT-seq showing the RBBP6 effect (Log2 RBBP6dep/Ctrl) on antisense transcripts without an AAUAAA (without polyadenylation signal [PAS]) or those that contain at least one AAUAAA (with PAS). Most are unaffected by RBBP6 loss. The region 10 kb upstream and antisense of annotated TSSs is shown.
-
Figure 1—figure supplement 1—source data 1
Original unannotated and uncropped images of the western blots used for Figure 1—figure supplement 1A.
- https://cdn.elifesciences.org/articles/92764/elife-92764-fig1-figsupp1-data1-v1.pdf
-
Figure 1—figure supplement 1—source data 2
Original uncropped images of the western blots used for Figure 1—figure supplement 1A with relevant bands labelled and highlighted.
- https://cdn.elifesciences.org/articles/92764/elife-92764-fig1-figsupp1-data2-v1.pdf
Figure 2 with 1 supplement
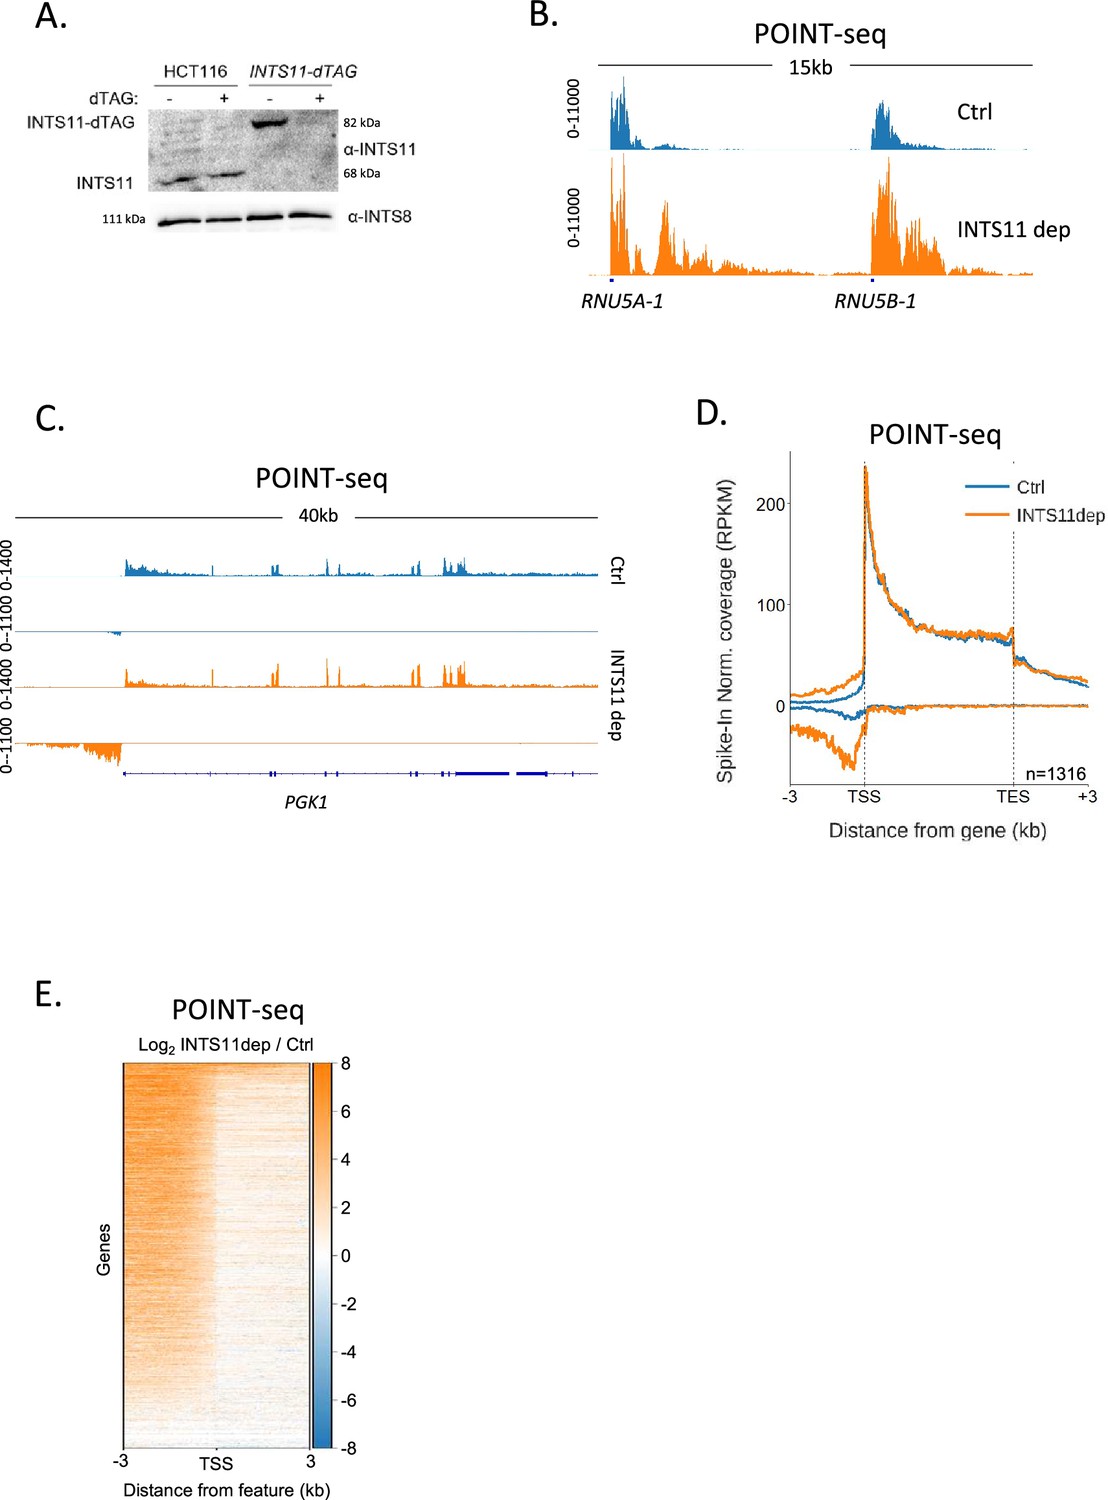
INTS11 loss disrupts the termination of antisense transcription.
(A) Western blot demonstrating homozygous tagging of INTS11 with dTAG and the depletion of INTS11-dTAG after 1.5 hr treatment with dTAGv-1. INTS8 serves as a loading control. (B) Genome browser track showing POINT-seq signal over RNU5A-1 and RNU5B-1 in INTS11-dTAG cells treated (INTS11 dep) or not (Ctrl) with dTAGv-1 (1.5 hr). Note that INTS11 depletion increases the nascent transcription signal at both loci. Y-axis shows RPKM following spike-in normalisation. (C) Genome browser track showing POINT-seq signal over PGK1 and its upstream antisense region in INTS11-dTAG cells treated (INTS11 dep) or not (Ctrl) with dTAGv-1 (1.5 hr). Y-axis shows RPKM following spike-in normalisation. (D) Metaplot of POINT-seq data from INTS11-dTAG cells treated (INTS11 dep) or not (Ctrl) with dTAGv-1 (1.5 hr). This shows the same 1316 genes used in Figure 1C. Signals above and below the x-axis are sense and antisense reads, respectively. Y-axis shows RPKM following spike-in normalisation. Coverage is shown over a region between 3 kb upstream of the transcription start site (TSS) and 3 kb downstream of the TES. This is an average of three biological replicates. (E) Heatmap representation of the data in (D), which displays signal as a log2 fold change (log2FC) in INTS11 depleted vs. undepleted (Ctrl) conditions over a region 3 kb upstream and downstream of annotated TSSs. These POINT-seq experiments are an average of three biological replicates.
-
Figure 2—source data 1
Original unannotated and uncropped images of the western blots used for Figure 2A.
- https://cdn.elifesciences.org/articles/92764/elife-92764-fig2-data1-v1.pdf
-
Figure 2—source data 2
Original uncropped images of the western blots used for Figure 2A with relevant bands labelled and highlighted.
- https://cdn.elifesciences.org/articles/92764/elife-92764-fig2-data2-v1.pdf
Figure 2—figure supplement 1
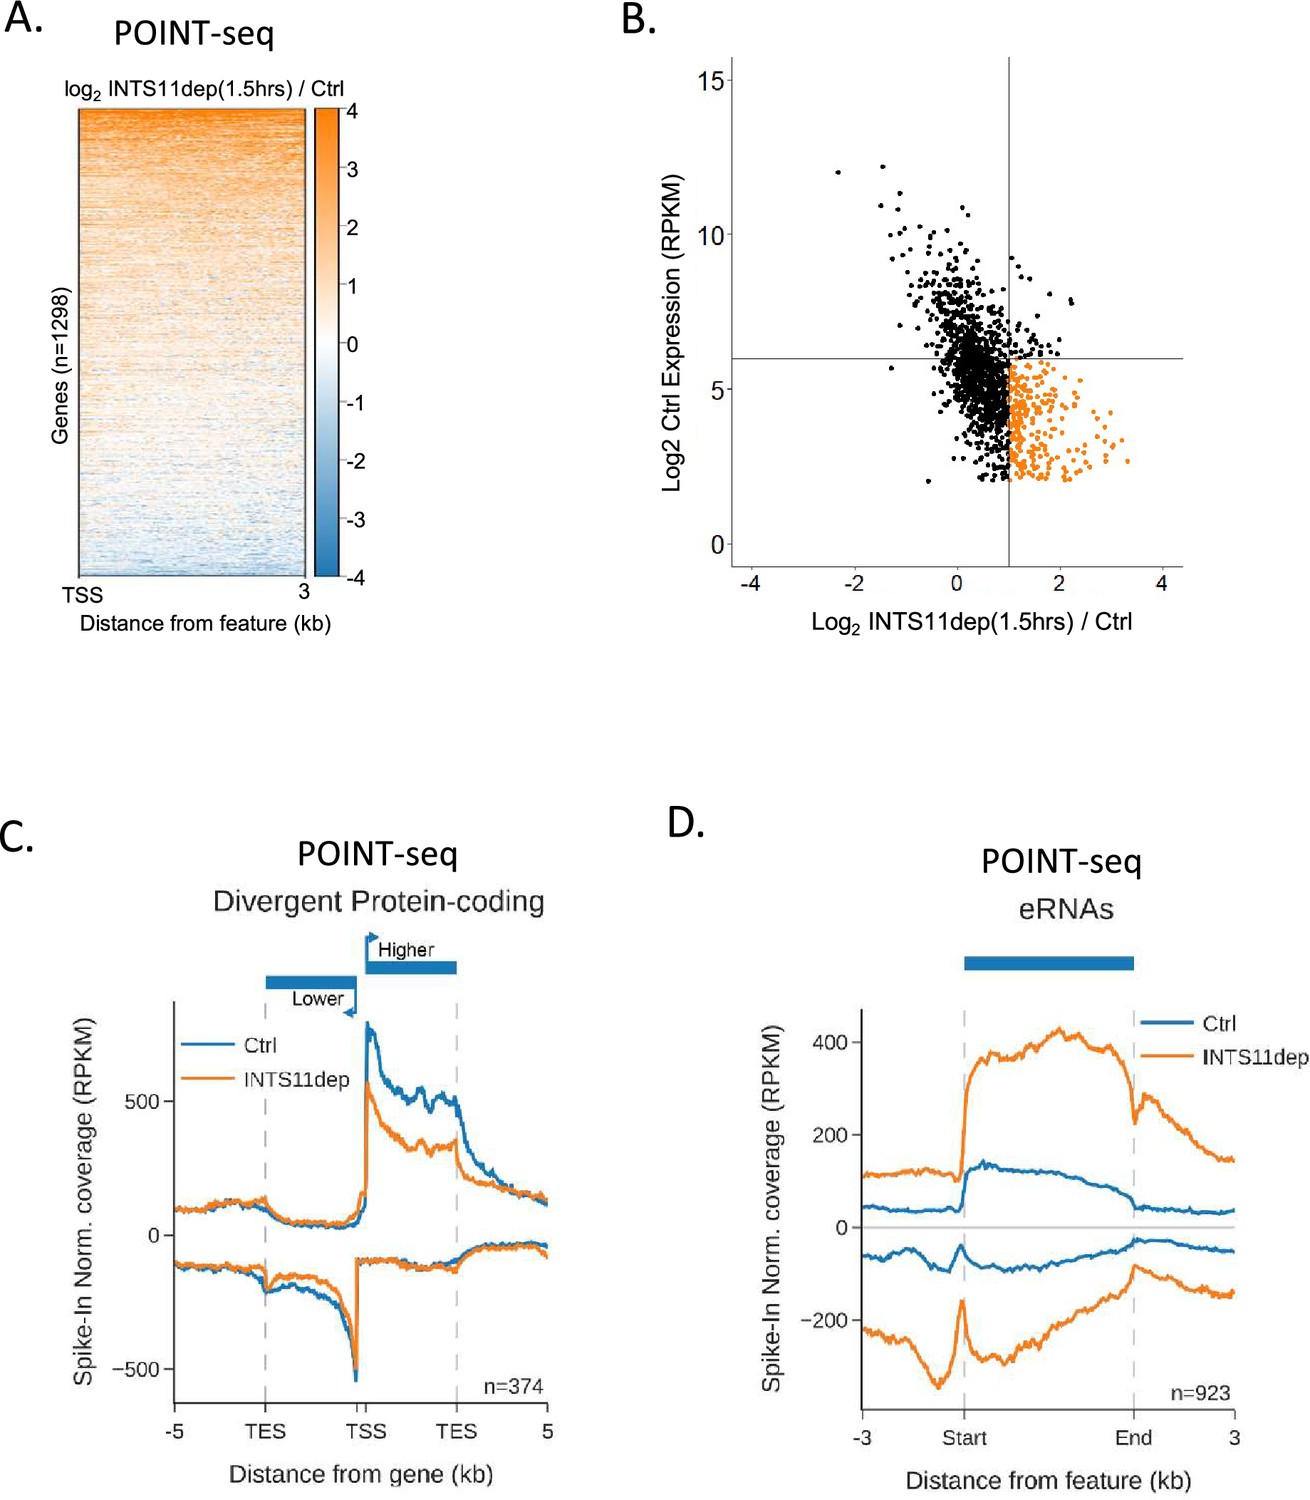
INTS11 loss increases the transcription of lowly expressed RNAs and eRNAs.
(A) Heatmap analysis of the 1316 gene set used in Figure 1C but focused on the effect of INTS11 loss on promoter-proximal transcription of the sense direction as assayed by POINT-seq (plot shows the first 3 kb). Note the lower scale (Log2FC INTS11dep/Ctrl) vs. Figure 2E used because of the smaller effect sizes vs. those for antisense transcription from the same gene set. (B) Comparison of INTS11-dependent changes in promoter-proximal protein-coding transcription with the expression level of each gene using the 1316 gene set as Figure 1C. X-axis shows Log2FC in levels (INTS11 dep/Ctrl) and y-axis shows expression level. Note that genes with the largest increase in promoter-proximal signal following INTS11 loss are low expressed (coloured orange). Data derived from POINT-seq following treatment or not with dTAGv-1 (1.5 hr). (C) Metaplot of POINT-seq data from INTS11-dTAG cells treated (INTS11 dep) or not (Ctrl) with dTAGv-1 (1.5 hr). These are protein-coding genes arranged head-to-head. Signals above and below the x-axis are sense and antisense reads, respectively. For sense and antisense genes, the region between the transcription start site (TSS) and 5 kb downstream of the TES is shown. Y-axis shows RPKM following spike-in normalisation. Signals from the higher expressed gene in the pair are above zero on the x-axis and those deriving from the lower expressed gene in the pair are below zero on the x-axis. (D) Metaplot of POINT-seq data from INTS11-dTAG cells treated (INTS11 dep) or not (Ctrl) with dTAGv-1 (1.5 hr) showing RNAs derived from enhancer clusters, which generally initiate transcription bidirectionally. Signals above and below the x-axis are sense and antisense reads, respectively. Coverage is shown from 3 kb upstream of the eRNA start and 3 kb downstream of their end. Y-axis shows RPKM following spike-in normalisation.
Figure 3 with 1 supplement
Transcription initiation is more efficient and focused in the sense direction compared to the antisense direction.
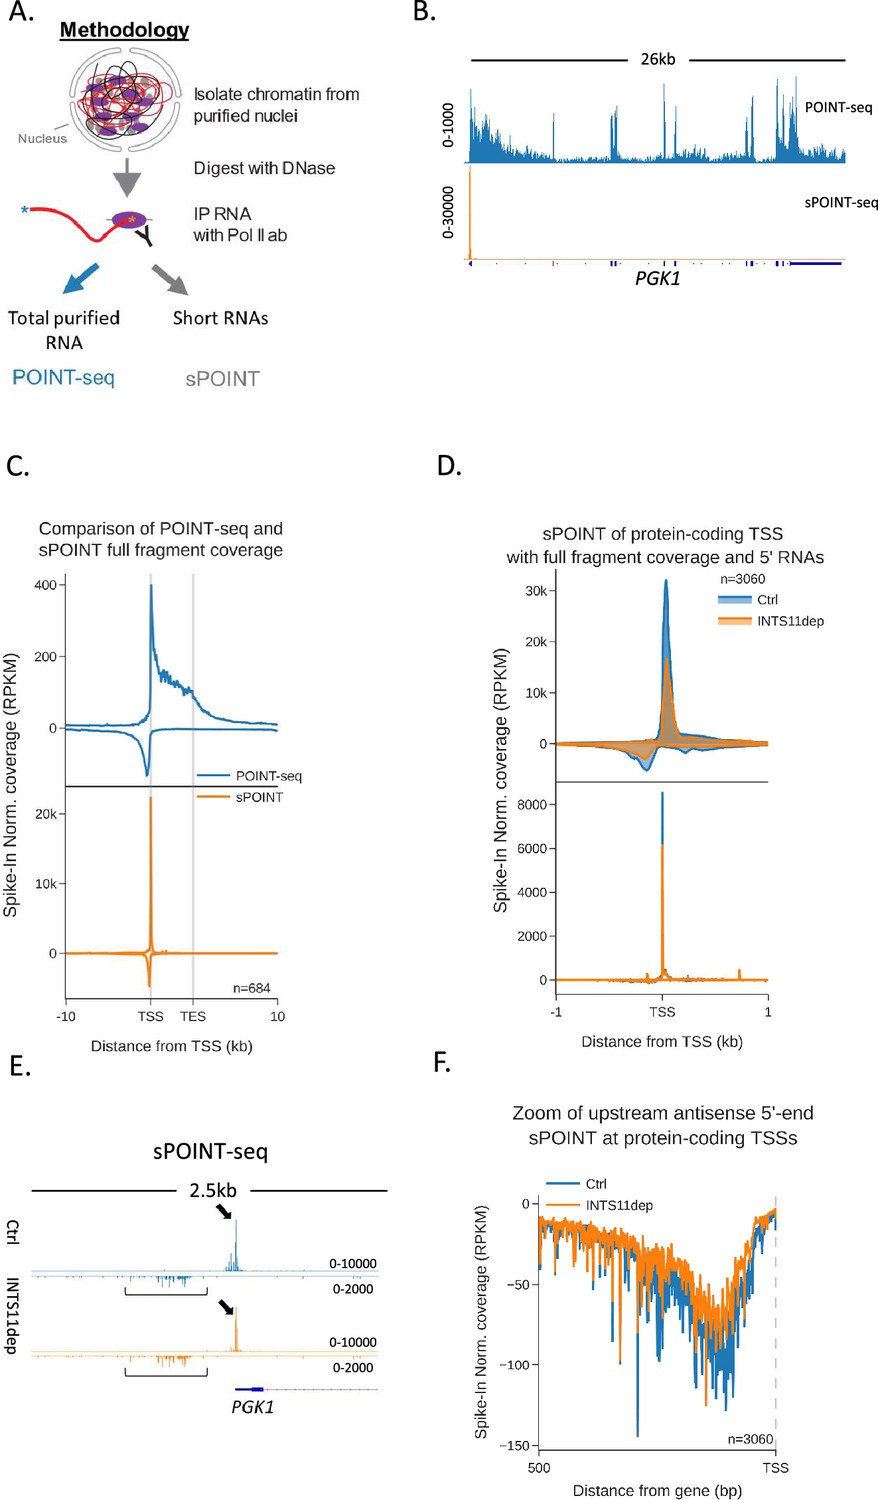
(A) Schematic of sPOINT-seq protocol. The POINT-seq protocol is followed, in which chromatin is isolated and engaged RNAPII is immunoprecipitated. Short transcripts are preferentially amplified during library preparation (see ‘Materials and methods’). (B) Genome browser view of POINT-seq (top trace) and sPOINT-seq (lower trace) coverage on PGK1. Y-axis units are RPKM. (C) Metaplot comparison of POINT-seq (top plot) and sPOINT-seq (lower plot) profiles across the 684 highest expressed protein-coding that are separated from expressed transcription units by ≥10 kb (top ~50%). Signals above and below the x-axis are sense and antisense reads, respectively. Coverage is shown over a region between 10 kb upstream of the transcription start site (TSS) and 10 kb downstream of the TES. Y-axis shows RPKM following spike-in normalisation. (D) Top metaplot shows full read coverage for sPOINT-seq performed in INTS11-dTAG cells treated (INTS11 dep) or not (Ctrl) with dTAGv-1 (1.5 hr) at the promoters of the top expressed 20% of protein-coding genes. The lower metaplot is the same data but only the 5′ end of each read is plotted. The y-axis signals are RPKM following spike-in normalisation. Coverage is shown over a region 1 kb upstream and downstream of the TSS. Two biological replicates of sPOINT were performed. (E) Genome browser track of PGK1 promoter region in sPOINT-seq performed in INTS11-dTAG cells treated (INTS11 dep) or not (Ctrl) with dTAGv-1 (1.5 hr). This showcases the focused sense TSS (black arrows) and the dispersed antisense reads (black brackets). Note the higher y-axis scale (RPKM) for sense vs. antisense. (F) Metaplot zoom of the antisense TSS signals deriving from the lower plot in (D). This makes clear the dispersed sites of initiation. The y-axis scale is RPKM following spike-in normalisation. Coverage is shown over 500 bp upstream and antisense of the annotated sense TSS. Two biological replicates of sPOINT were performed.
Figure 3—figure supplement 1
Sense transcription is more efficient and focused than antisense transcription.
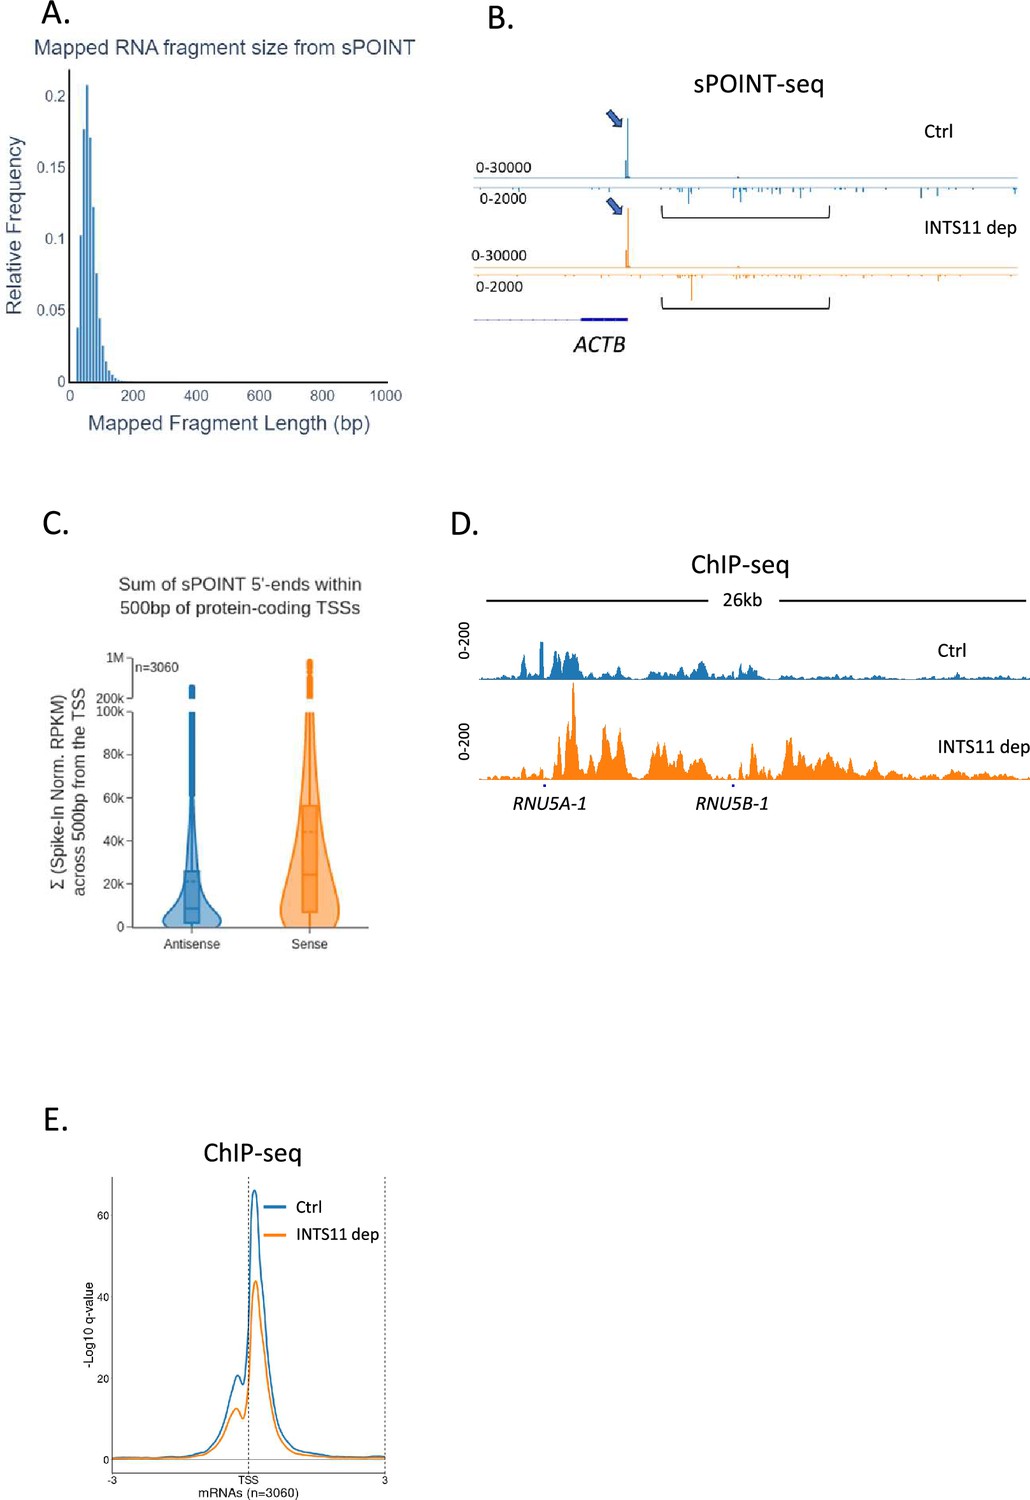
(A) Plot showing the size distribution of fragments mapped by sPOINT-seq. This demonstrates its selectivity toward transcripts <150 nts. (B) Genome browser track of ACTB promoter region in sPOINT-seq from INTS11-dTAG cells treated (INTS11 dep) or not (Ctrl) with dTAGv-1 (1.5 hr). This showcases the focused sense transcription start site (TSS) (blue arrows) and the dispersed antisense reads (black brackets). Note the different y-axis scales (RPKM) for sense vs. antisense. Approximately 1kb of the promoter region is shown. (C) Violin plot of the sum sPOINT 5′ end spike-in normalised RPKM signal within 500 bp of the protein-coding TSSs shown in Figure 3D (n = 3060). These samples are untreated with dTAGv-1 and so reflect the unperturbed levels of sense vs. antisense initiation/pausing. The higher read count in the sense direction suggests more initiation/pausing vs. the antisense direction. (D) Genome browser track of RNU5A-1 and RNU5B-1 in RNAPII ChIP-seq performed on INTS11-dTAG cells treated (INTS11 dep) or not (Ctrl) with dTAGv-1 (2 hr). INTS11 depletion causes RNAPII accumulation over both loci indicating a transcription defect. The y-axis scale is RPKM. (E) Metaplot of RNAPII occupancy of protein-coding TSS regions (±3 kb) using the same gene set employed for the sPOINT analysis in Figure 3 and derived from RNAPII ChIP-seq performed on INTS11-dTAG cells treated (INTS11 dep) or not (Ctrl) with dTAGv-1 (2 hr). The y-axis scale is log10 qvalue of peak pileup values normalised to spike in control. Two biological replicates of ChIP-seq were performed.
Figure 4 with 1 supplement
Sense transcription becomes INTS11-sensitive when CDK9 is inhibited.
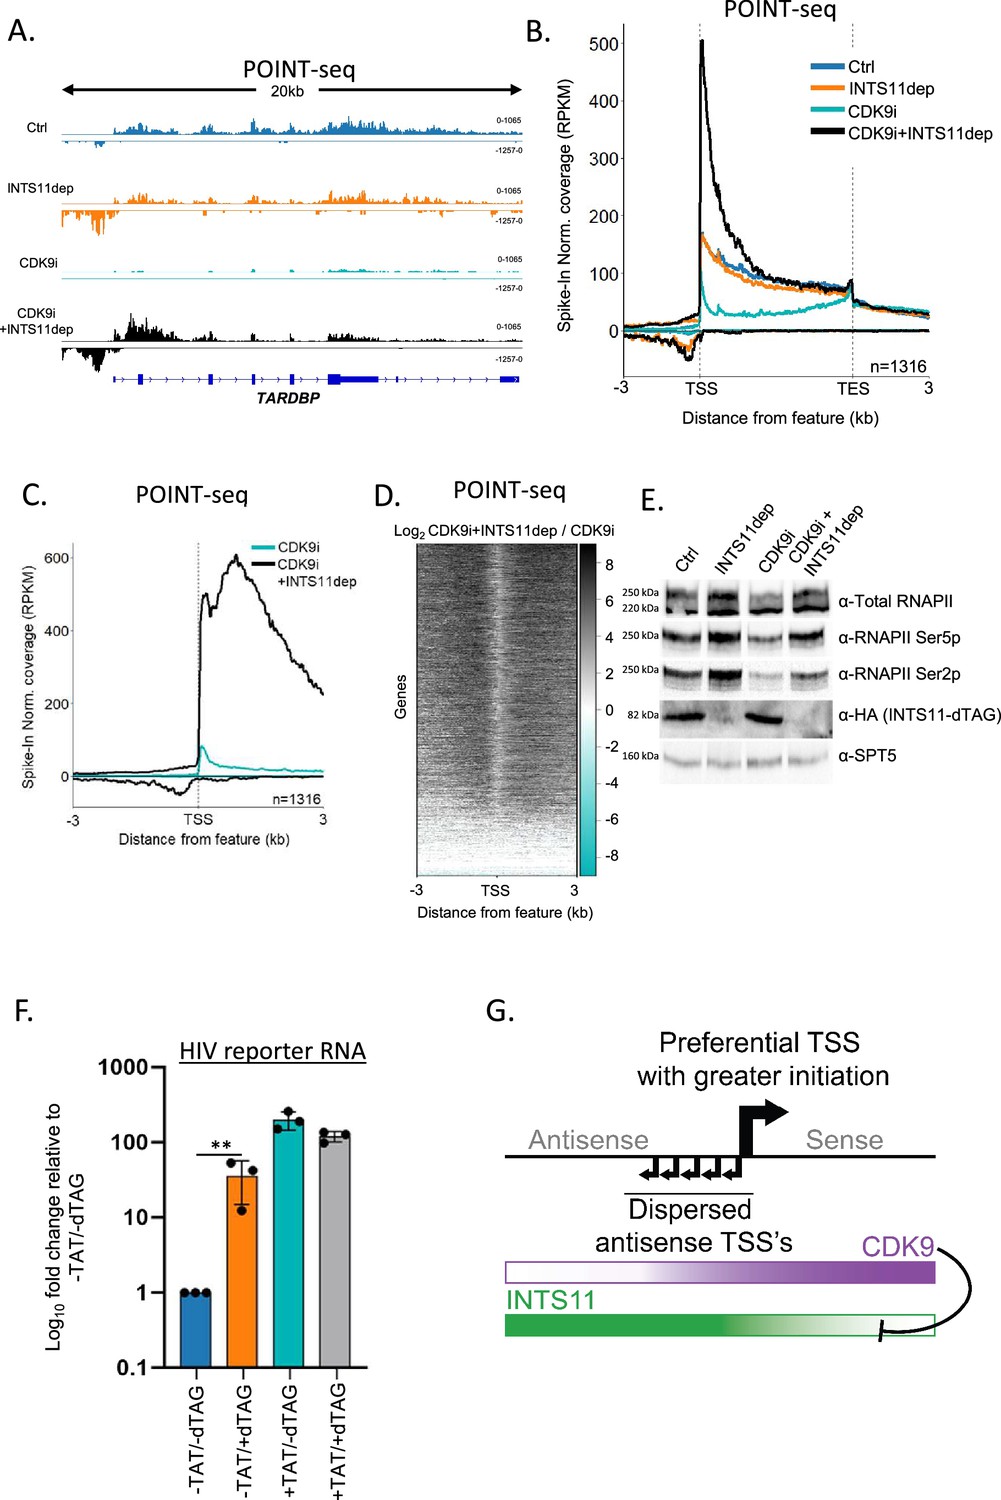
(A) Genome browser track of TARDBP in POINT-seq data derived from INTS11-dTAG cells either untreated (Ctrl), dTAG-treated (INTS11 dep), NVP-2-treated (CDK9i), or dTAG and NVP-2-treated (CDK9i+INTS11dep). Treatments were for 2.5 hr. Signals above and below the x-axis are sense and antisense reads, respectively. The y-axis scale shows RPKM following spike-in normalisation. (B) Metaplot of POINT-seq data derived from INTS11-dTAG cells either untreated (Ctrl), dTAG-treated (INTS11 dep), NVP-2-treated (CDK9i), or dTAG and NVP-2-treated (CDK9i+INTS11dep). Treatments were for 2.5 hr. This uses the same gene set as Figure 1C. Coverage is shown between 3 kb upstream of the transcription start site (TSS) and 3 kb downstream of the TES. y-axis units are RPKM following spike-in normalisation. This is an average of two biological replicates.(C) Metaplot of CDK9i and CDK9i+INTS11dep POINT-seq data but zoomed into the region 3 kb upstream and downstream of the TSS. This is an average of three biological replicates.(D) Heatmap representation of the data in (C), which displays signal as a log2 fold change (log2FC) in INTS11 depleted vs. un-depleted (Ctrl) conditions covering a region 3 kb upstream and downstream of the TSS. This is an average of three biological replicates. (E) Western blot for total RNAPII and RNAPII phosphorylated on Ser2/5 (Ser2/5p) in INTS11-dTAG cells treated or not with dTAGv-1 and/or NVP-2 (CDK9i). dTAG-mediated INTS11 depletion is shown in the anti-HA blot and SPT5 us used as a loading control. All treatments were for 2.5 hr. (F) qRT-PCR analysis of INTS11-dTAG cells transfected with the HIV reporter construct with or without TAT (±TAT) then depleted or not of INTS11 (±dTAG). Quantitation shows signals relative to those obtained in the presence of INTS11 and the absence of TAT after normalising to MALAT1 RNA levels. n = 3. Error bars show standard deviation. **p=0.01. Note that, in this experiment, INTS11 depletion was performed concurrently with transection (14 hr in total). (G) Model for promoter directionality depicting higher levels of focused transcriptional initiation in the sense direction together with opposing gradients of CDK9 and INTS11 activity that peak in sense and antisense directions, respectively.
-
Figure 4—source data 1
Original unannotated and uncropped images of the western blots used for Figure 4E.
- https://cdn.elifesciences.org/articles/92764/elife-92764-fig4-data1-v1.pdf
-
Figure 4—source data 2
Original uncropped images of the western blots used for Figure 4E with relevant bands labelled and highlighted.
- https://cdn.elifesciences.org/articles/92764/elife-92764-fig4-data2-v1.pdf
Figure 4—figure supplement 1
CDK activity influences the sensitivity of transcription to INTS11 loss.
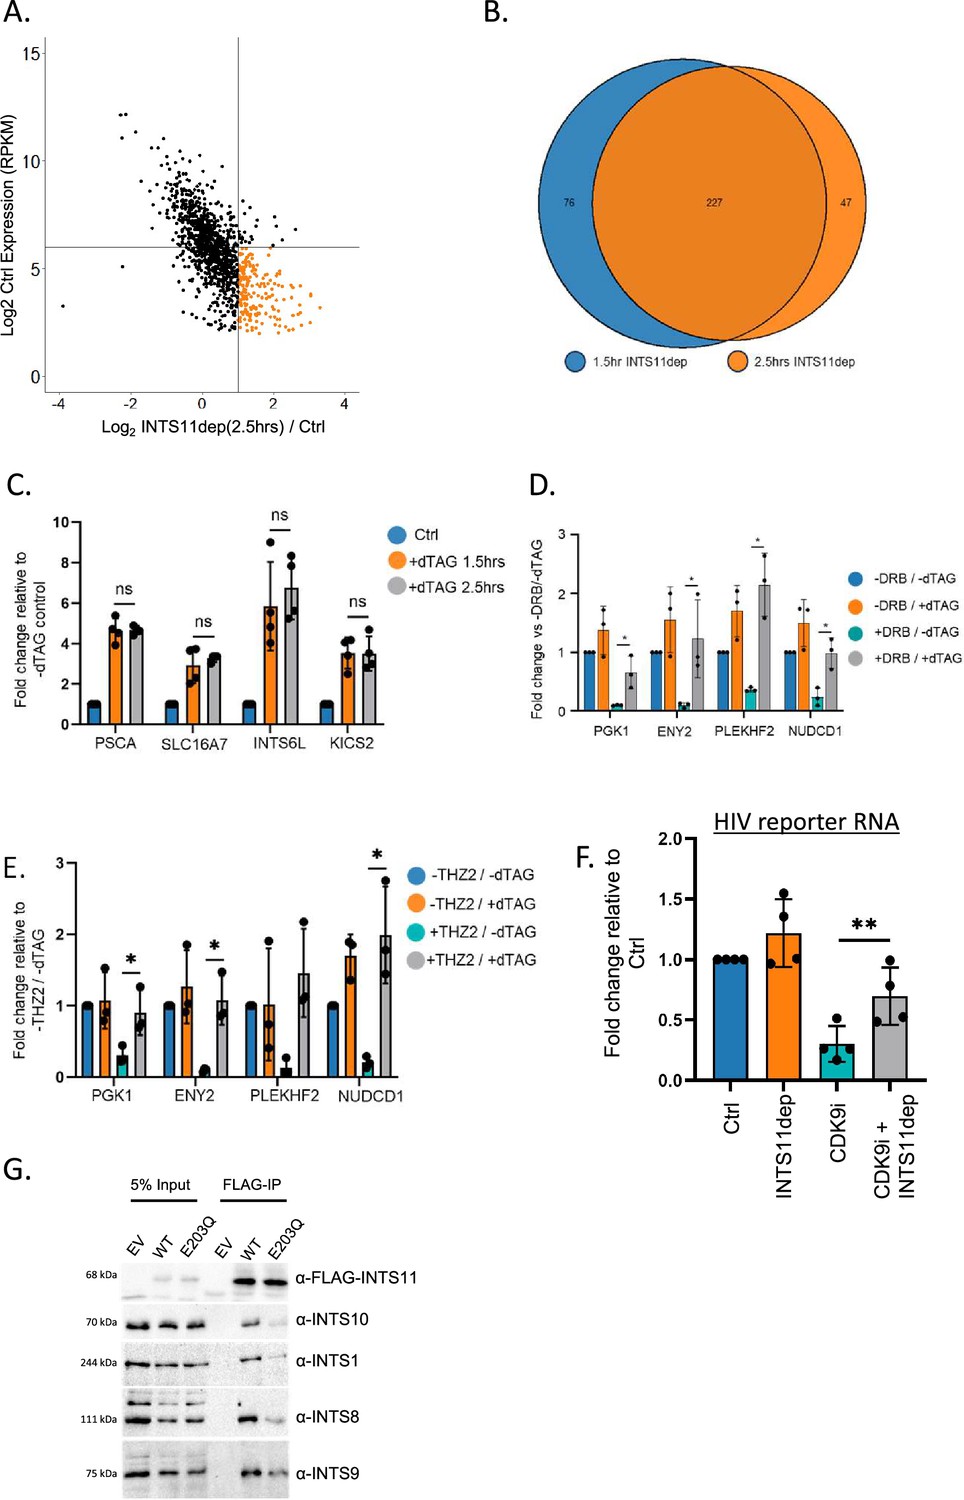
(A) Comparison of INTS11-dependent changes in promoter-proximal protein-coding transcription with the expression level of each gene. The gene set is equivalent to the analogous panel in Figure 2—figure supplement 1B. The x-axis shows Log2FC in levels (INTS11 dep/Ctrl) and the y-axis shows expression level. Note that genes with the largest increase in promoter-proximal signal following INTS11 loss are lowly expressed (coloured orange). Data derived from POINT-seq following treatment or not with dTAGv-1 (2.5 hr). (B) Venn diagram showing the number of protein-coding genes where promoter-proximal POINT-seq signal increases by ≥Log2FC of 1 after INTS11 loss after 1.5 hr or 2.5 hr dTAGv-1 treatment. A strong overlap is seen indicating reproducible effects at the two time points. (C) qRT-PCR analysis of PSCA, SLC16A7, INTS6L, and KICS2 pre-mRNAs isolated from total RNA deriving from INTS11-dTAG cells treated or not with dTAGv-1 for 1.5 hr or 2.5 hr. To enrich nascent transcripts, primers detect intronic RNA. Quantitation shows fold-change vs. spliced actin relative to untreated samples. Error bars show standard deviation. n = 4. n.s denotes not significant. (D) qRT-PCR analysis of PGK1, ENY2, PLEKHF2, and NUDCD1 pre-mRNAs isolated from total RNA deriving from INTS11-dTAG cells treated or not with dTAGv-1 and at the same time exposed or not to DRB (all 2.5 hr). To enrich nascent transcripts, primers detect intronic RNA. Quantitation shows fold change vs. spliced actin relative to samples untreated with dTAGv-1 or DRB. DRB treatment substantially reduces signal, which is restored when INTS11 is co-depleted. Error bars show standard deviation. n = 3, *p≤0.05. (E) As for (D) but following treatment with the CDK7 inhibitor, THZ1, and/or depletion of INTS11 with dTAGv-1 (all treatments 2.5 hr). Error bars show standard deviation. n = 3, *p≤0.05. (F) qRT-PCR analysis of chromatin-associated (nascent) RNA isolated from INTS11-dTAG cells transfected with the HIV reporter construct together with TAT then treated or not with INTS11 and/or NVP-2 (CDK9i). Quantitation shows signals relative to those obtained in untreated cells after normalising to MALAT1 RNA. n = 4. Error bars show standard deviation. **p≤0.01. (G) Flag immunoprecipitation performed in INTS11-dTAG cells transfected with flag-tagged wild-type or E203Q INTS11. The gel shows input and co-precipitated samples probed for components of different Integrator modules (tail module – INTS10; backbone module – INTS1; phosphatase module – INTS8 and cleavage module – INTS9). These components show reduced association with E203Q INTS11 vs. wild type.
-
Figure 4—figure supplement 1—source data 1
Original unannotated and uncropped images of the western blots used for Figure 4—figure supplement 1G.
- https://cdn.elifesciences.org/articles/92764/elife-92764-fig4-figsupp1-data1-v1.pdf
-
Figure 4—figure supplement 1—source data 2
Original uncropped images of the western blots used for Figure 4—figure supplement 1G with relevant bands labelled and highlighted.
- https://cdn.elifesciences.org/articles/92764/elife-92764-fig4-figsupp1-data2-v1.pdf
Author response image 1

Tables
Key resources table
| Reagent type (species) or resource | Designation | Source or reference | Identifiers | Additional information |
|---|---|---|---|---|
| Cell line (Drosophila melanogaster) | S2 | This paper | FLYB:FBtc0000181; RRID:CVCL_Z992 | Cell line maintained in N. Perrimon lab; FlyBase symbol: S2-DRSC |
| Cell line (D. melanogaster) | S2 | This paper | FLYB:FBtc0000181; RRID:CVCL_Z992 | Cell line maintained in N. Perrimon lab; FlyBase symbol: S2-DRSC |
| Cell line (Homo sapiens) | HCT116 | In-house | This paper | Figures 1 and 2 |
| Cell line (H. sapiens) | INTS11-dTAG | In-house | This paper | Figures 2—4 and associated figure supplements |
| Cell line (H. sapiens) | dTAG-RBBP6 | In-house | This paper | Figure 1 and Figure 1—figure supplement 1 |
| Antibody | INTS11 (rabbit polyclonal) | Abbexa | abx234340 | WB: 1:500 |
| Antibody | INTS10 (rabbit polyclonal) | Proteintech | Cat# 15271-1-AP; RRID:AB_2127260 | WB: 1:3000 |
| Antibody | INTS8 (rabbit polyclonal) | Proteintech | Cat# 18802-1-AP ; RRID:AB_10597250 | WB: 1:1000 |
| Antibody | INTS9 (rabbit polyclonal) | Proteintech | Cat# 11657-1-AP; RRID:AB_2127514 | WB: 1:1000 |
| Antibody | INTS1 (rabbit polyclonal) | Bethyl | Cat# A300-361A-T; RRID:AB_2632121 (now discontinued) | WB: 1:500 |
| Antibody | HA (rabbit monoclonal) | Cell Signalling | Cat# 3724; RRID:AB_1549585 | WB: 1:2000 |
| Antibody | RNAPII Ser2p (rat monoclonal) | Active Motif | Cat# 61084; RRID:AB_2687450 | WB: 1:2000 |
| Antibody | RNAPII Ser5p (rat monoclonal) | Millipore | Cat# 04-1572-I; RRID:AB_2801296 | WB: 1:2000 |
| Antibody | Total RNAPII (mouse monoclonal) | Hiroshi Kimura Lab | N/A | WB: 1:10,000 IP: 5–10 ug (Ab:Beads) |
| Antibody | SPT5 (mouse monoclonal) | Santa Cruz Biotech | Cat# sc-133217; RRID:AB_2196394 | WB: 1:1000 |
| Antibody | Flag (rabbit polyclonal) | Proteintech | Cat# 20543-1-AP; RRID:AB_11232216 | WB: 1:5000 |
| Antibody | Anti-rabbit (goat polyclonal) | Proteintech | Cat# SA00001-2; RRID:AB_2722564 | WB: 1:2000 |
| Antibody | Anti-mouse (goat polyclonal) | Proteintech | Cat# SA00001-1-A; RRID:AB_2890995 | WB: 1:2000 |
| Antibody | Anti-rat (goat polyclonal) | Thermo Fisher | Cat #A18865; RRID:AB_2535642 | WB: 1:2000 |
| Recombinant DNA reagent | px300 | Addgene | RRID: Addgene_42230 | |
| Recombinant DNA reagent | pCRIS-PITChv2-BSD-dTAG (BRD4) | Addgene | RRID:Addgene_91792 | |
| Recombinant DNA reagent | pCRIS-PITChv2-PURO-dTAG (BRD4) | Addgene | RRID:Addgene_91793 | |
| Transfected construct (HIV virus) | TAT | Adams et al., 1988 | ||
| Transfected construct (H. sapiens) | INTS11 WT and E203Q | Twist | This paper | Supplementary file 1 |
| Transfected construct (H. sapiens) | HIV reporter | In-house | This paper | Figure 4 and Figure 4—figure supplement 1 |
| Commercial assay or kit | Terminator 5-phosphate-dependent exonuclease | Lucigen | Cat# TER51020 | |
| Commercial assay or kit | SMARTer smRNA-seq kit for illumina | Takara | Cat# 635031 | |
| Commercial assay or kit | Dynabeads M280 sheep anti-mouse | Thermo Fisher | Cat# 11202D | |
| Commercial assay or kit | Anti-FLAG/DYKDDDDK magnetic beads | MilliporeSigma | Cat# M8823 | |
| Commercial assay or kit | SimpleChIP Plus Enzymatic Chromatin kit | Cell Signalling | Cat# 9005 | |
| Commercial assay or kit | NEBNext Ultra II DNA Library Prep Kit for Illumina | NEB | Cat# E7645S | |
| Commercial assay or kit | JetPRIME | PolyPlus | Cat# 114-01 | |
| Commercial assay or kit | NEBNext Ultra II Directional RNA Library Prep Kit for Illumina | NEB | Cat# E7765 | |
| Commercial assay or kit | Protoscript II reverse transcriptase | NEB | Cat# M0368 | |
| Commercial assay or kit | LUNA qPCR reagent | NEB | Cat# M3003 | |
| Commercial assay or kit | Ampure XP beads | Beckman Coulter | Cat# A63880 | |
| Other | Benzonase | Sigma | Cat# E1014-5KU | Used to digest cell extracts prior to co-immunoprecipitation (Figure 4—figure supplement 1G) |
| Chemical compound, drug | dTAGv-1 | Tocris | Cat# 2624313-15-9 | |
| Chemical compound, drug | NVP2 | Merck | Cat# SML3069-5MG | |
| Chemical compound, drug | THZ2 | Medchem Express | Cat# HY-12280 | |
| Chemical compound, drug | DRB | Merck | Cat# D1916 | |
| Chemical compound, drug | Trizol Reagent | Thermo Fisher | Cat# 15596026 | |
| Commercial assay or kit | Turbo DNAse kit | Thermo Fisher | Cat# AM2238 | |
| Software, algorithm | Bamtools | Barnett et al., 2011 | NA | NA |
| Software, algorithm | BEDtools | Quinlan and Hall, 2010 | NA | NA |
| Software, algorithm | Cutadapt | https://doi.org/10.14806/ej.17.1.200 | NA | NA |
| Software, algorithm | Deeptools | Ramírez et al., 2016 | NA | NA |
| Software, algorithm | FastQC | https://www.bioinformatics.babraham.ac.uk/projects/fastqc/ | NA | NA |
| Software, algorithm | Hisat2 | Kim et al., 2015 | NA | NA |
| Software, algorithm | IGV | Robinson et al., 2011 | NA | NA |
| Software, algorithm | MACS2 | Zhang et al., 2008 | NA | NA |
| Software, algorithm | MultiQC | Ewels et al., 2016 | NA | NA |
| Software, algorithm | R | https://cran.r-project.org/ | NA | NA |
| Software, algorithm | Rstudio | https://www.rstudio.com/ | NA | NA |
| Software, algorithm | SAMTools | Li et al., 2009 | NA | NA |
| Software, algorithm | Trim_galore! | https://github.com/FelixKrueger/TrimGalore/ (; Krueger et al., 2023;(RRID:SCR_011847) | NA | NA |
Additional files
-
Supplementary file 1
Oligonucleotide and other DNA sequences used in this study to engineer cell lines and for qRT-PCR.
- https://cdn.elifesciences.org/articles/92764/elife-92764-supp1-v1.xlsx
-
MDAR checklist
- https://cdn.elifesciences.org/articles/92764/elife-92764-mdarchecklist1-v1.docx
Download links
A two-part list of links to download the article, or parts of the article, in various formats.
Downloads (link to download the article as PDF)
Open citations (links to open the citations from this article in various online reference manager services)
Cite this article (links to download the citations from this article in formats compatible with various reference manager tools)
Human promoter directionality is determined by transcriptional initiation and the opposing activities of INTS11 and CDK9
eLife 13:RP92764.
https://doi.org/10.7554/eLife.92764.3


