Dopamine lesions alter the striatal encoding of single-limb gait
- Department of Neurobiology, University of California Los Angeles, United States
- Department of Bioengineering, University of California Los Angeles, United States
- Department of Neurology, University of California Los Angeles, United States
- California Nanosystems Institute, University of California Los Angeles, United States
Figures
Figure 1
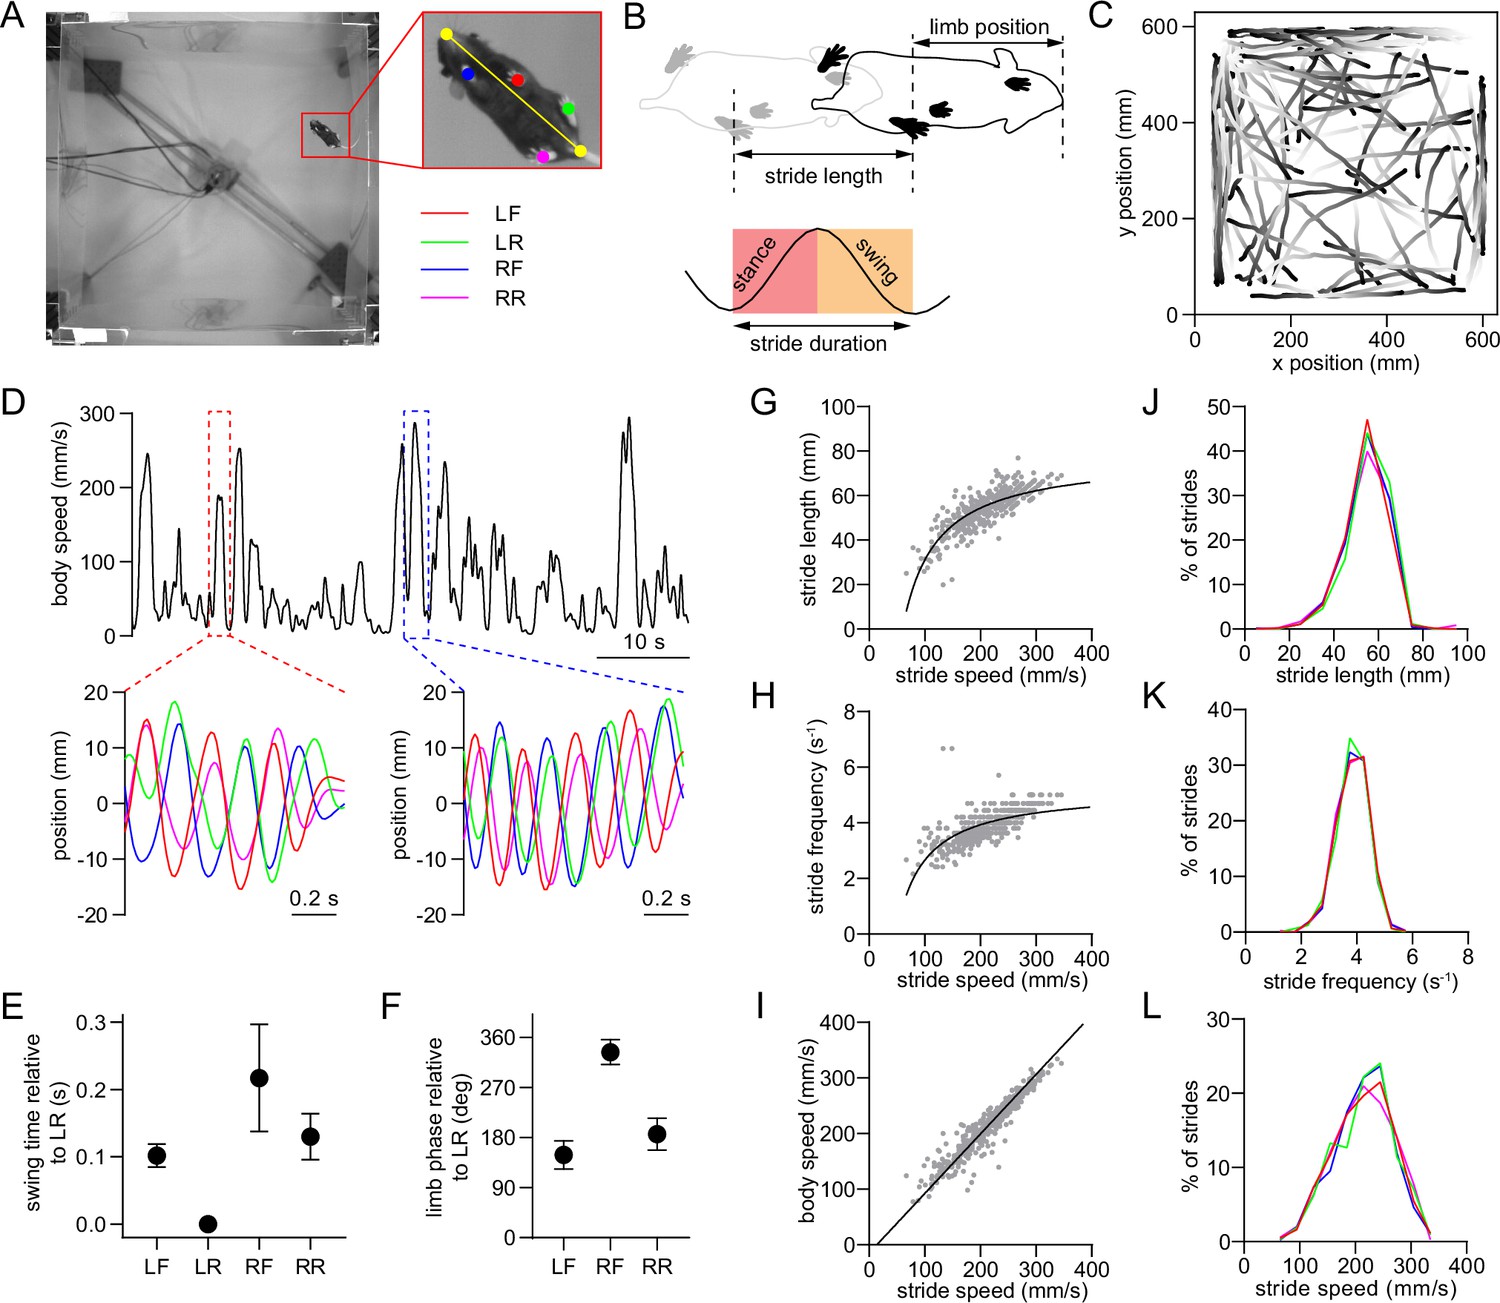
Single-limb gait measurements in freely behaving mice.
(A) Video frame showing the bottom-up view of a mouse walking in the 60 cm x 60 cm open field. The inset shows the six tracked body parts (four limbs plus the nose and base of the tail). The limbs are abbreviated as LF: left front, LR: left rear, RF: right front, RR: right rear. The yellow line represents the nose-tail axis. (B) Illustration of the gait cycle comprised of the stance and swing phase. Stride duration corresponds to the time needed to complete one stance/swing cycle, stride length is the distance spanned by the limb during this period, and stride speed is the ratio between these quantities. (C) Walking bout body trajectories from a recording session in a healthy mouse. Light color represents the start of movement. (D) Time course of body speed showing a low speed and high speed walking bout (red and blue dashed lines), and the motion of each limb during these walking bouts. Limbs are color-coded according to A. (E) Mean swing start time of each limb relative to LR, reflecting the lateral sequence gait pattern (LR→LF→RR→RF). Data represent mean ± SD of all strides from one recording session. (F) Mean limb phase angle relative to the LR limb, indicating the approximately anticorrelated phase relationship between front and rear limb movements on each side of the body. Data represent mean ± SD of all strides from one recording session. (G) LF limb stride length as a function of stride speed from one recording session. Gray dots represent individual strides. Black line represents the best polynomial fit. (H) Stride frequency (inverse of duration) as a function of stride speed. (I) Body speed as a function of stride speed. Black line represents the best linear fit (Pearson R=0.95). (J) Stride length distribution of the four limbs from one recording session. Limbs are color-coded according to A. (K) Stride frequency distribution of the four limbs from one recording session. (L) Stride speed distribution of the four limbs from one recording session. All data in this figure were collected from the same recording session.
Figure 2 with 1 supplement
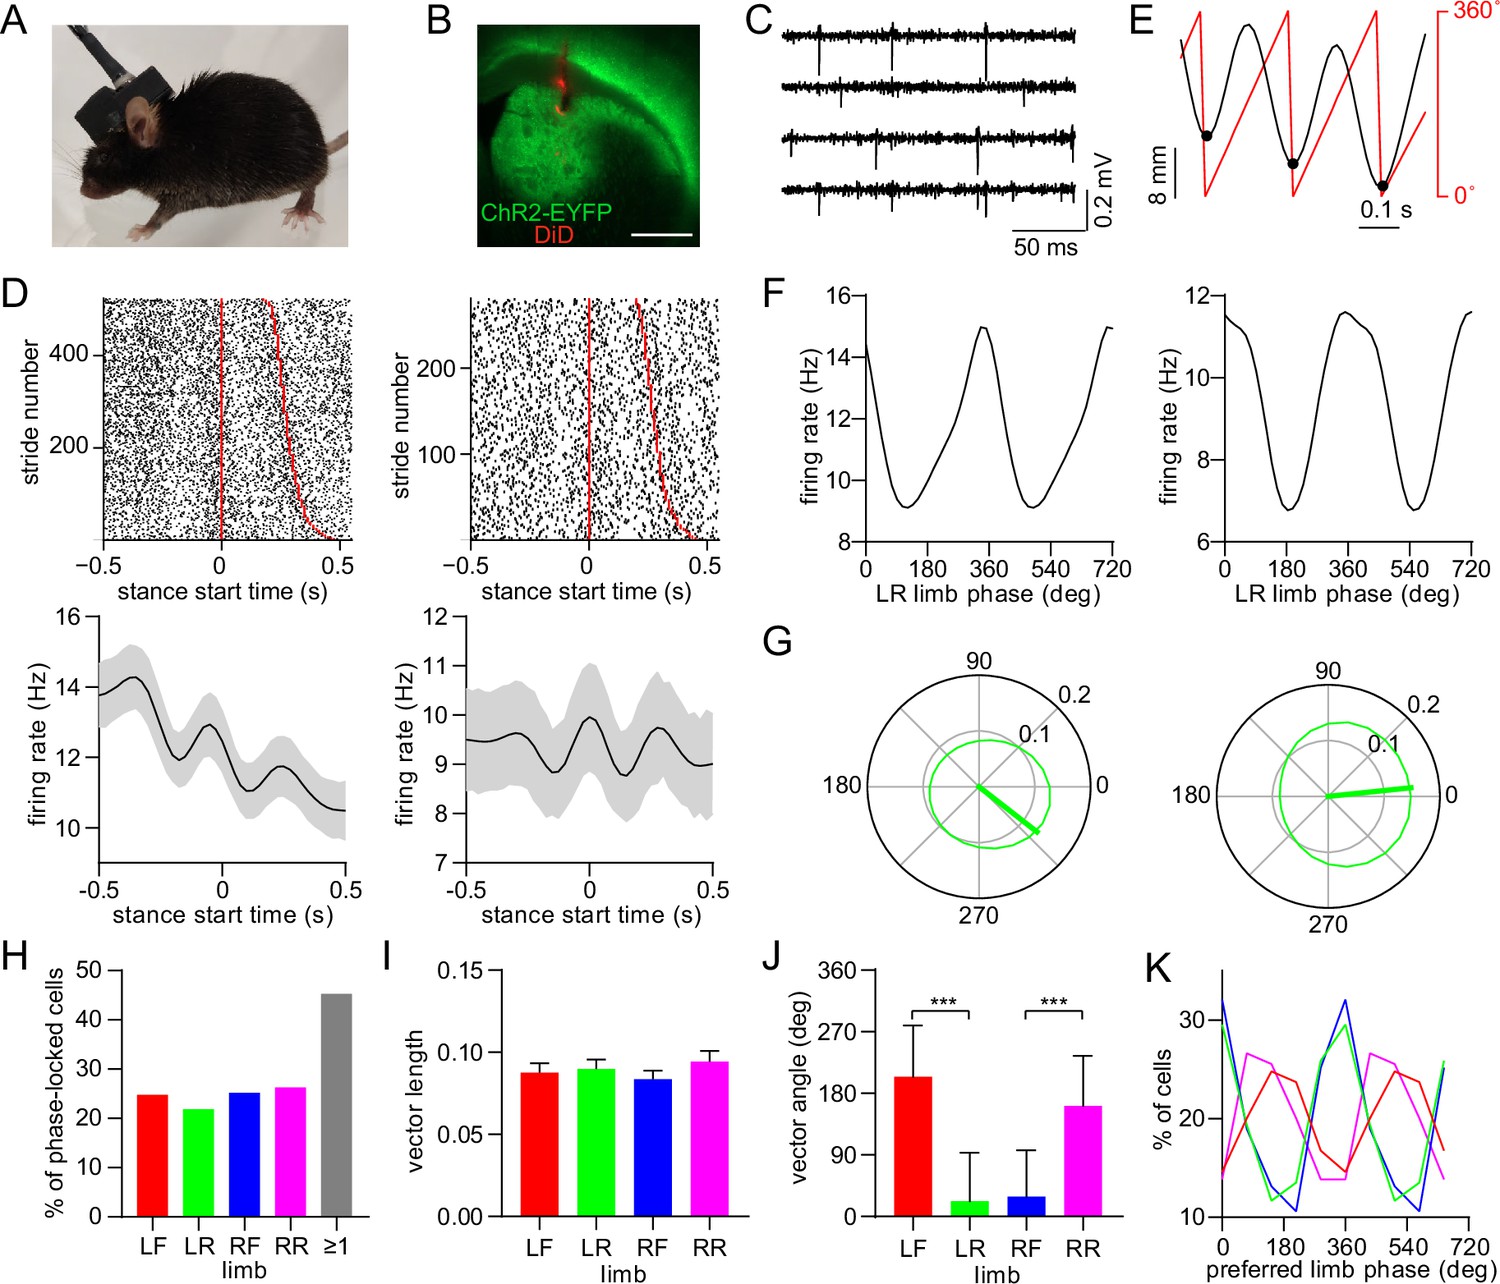
Dorsal striatal neurons are phase-locked to the gait cycle of individual limbs.
(A) Mouse implanted with an opto-microprobe and head cap housing a miniature electronic head stage. (B) Opto-microprobe track (red) in the dorsal striatum with virally mediated ChR2-EYFP (green) expression in a D1-Cre mouse. Scale bar: 0.5mm. (C) Filtered time traces from four electrodes showing striatal spiking activity. (D) Top: raster plot of two striatal neurons aligned to the start of the LR limb stance phase. The stride number is sorted by stride duration (represented by the red lines). Bottom: mean ± SEM firing rate of the same neurons. (E) Single limb position (black) and the corresponding phase angle (red). Black dots indicate the start of the stance phase (defined as 0⁰). (F) Average firing rate as a function of limb phase for the two neurons in D. The limb phase is plotted for two full gait cycles (0–720⁰) for visual clarity. (G) Normalized firing rate of the neurons in F in polar coordinates. The thick green line represents the mean vector (left cell: vector length = 0.13 and angle = 322⁰; right cell: vector length = 0.15 and angle = 6⁰) (H) Percentage of limb phase-locked striatal neurons (n=274 total cells pooled from 9 healthy mice). (I) No significant difference in mean spike-limb phase vector length between the four limbs (n=274 cells, one-way RM ANOVA, p=0.07). Data represent mean ± SEM. (J) Mean preferred limb phase angles are significant different between front and rear limb (angular permutation test adjusted for 6 comparisons, LF-LR: p<0.001; LF-RF: p<0.001; RF-RR: p<0.001; LR-RR: p<0.05). Data represent mean ± SD. (K) Distribution of preferred limb phase angles across the four limbs.
Figure 2—figure supplement 1
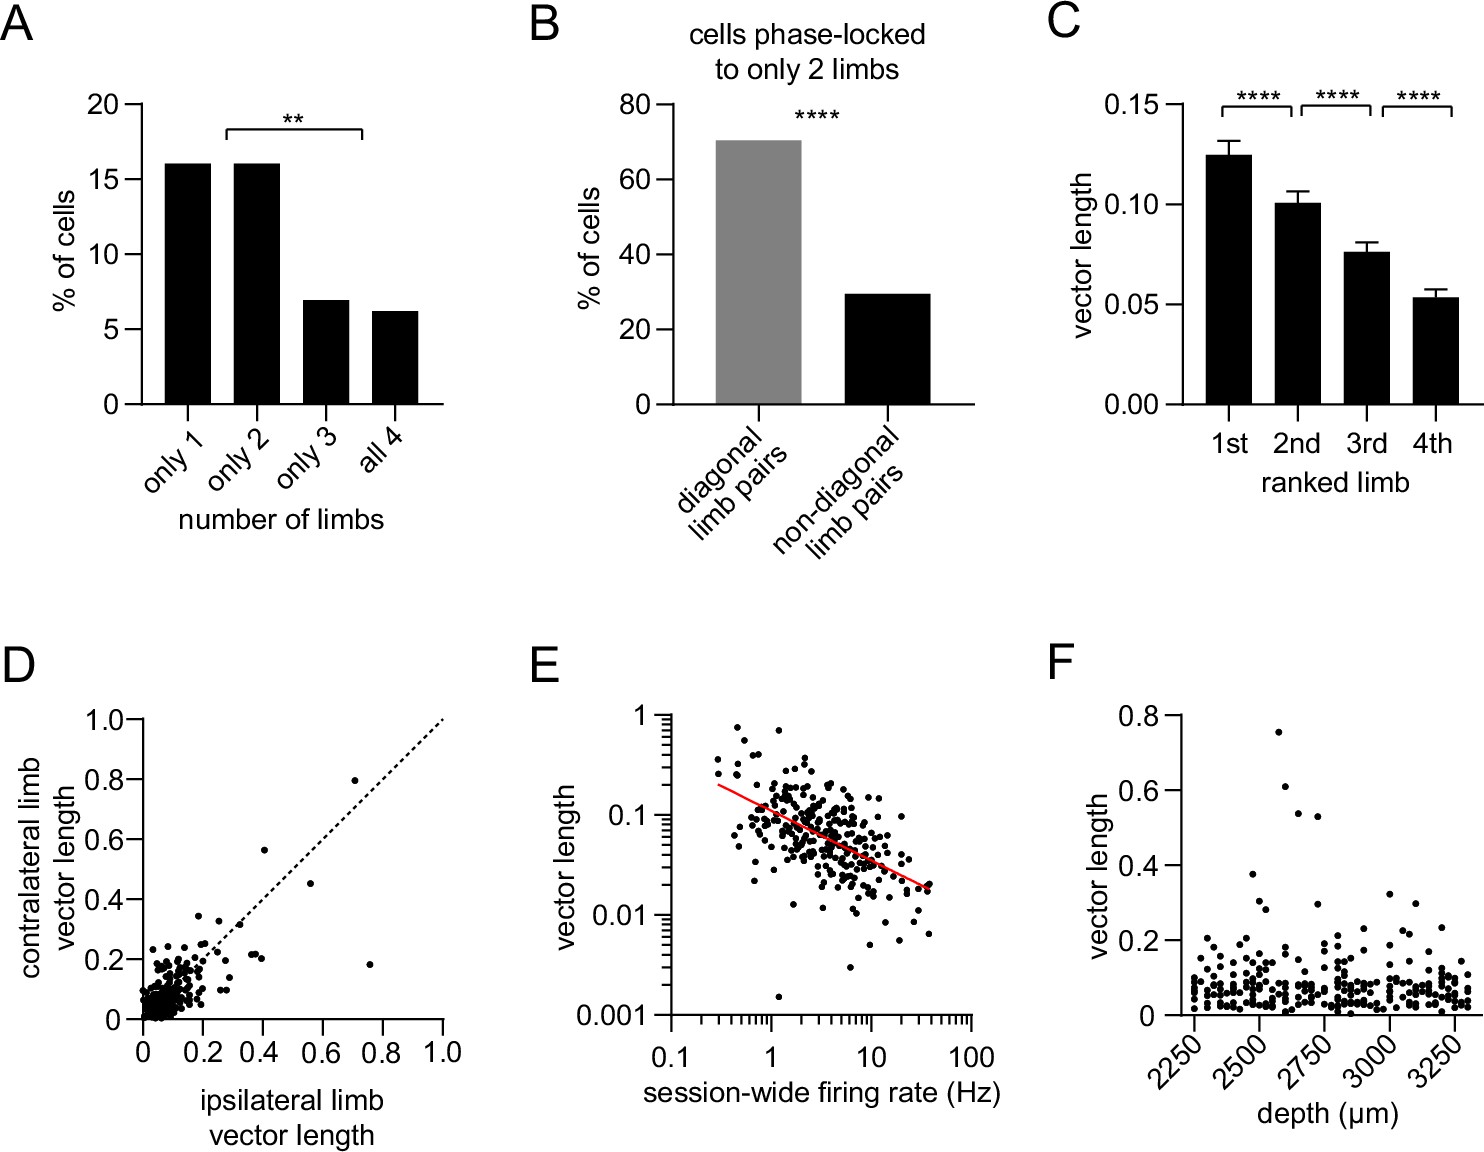
Single-limb phase locking strength in dorsal striatal neurons.
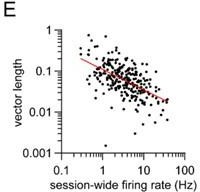
(A) Percentage of striatal neurons with significant phase-locking to only 1, only 2, only 3, or all 4 limbs (n=274 total cells pooled from 9 healthy mice, chi-square test adjusted for 6 comparisons, 1 vs 3 and 2 vs 3: p=0.003; 1 vs 4 and 2 vs 4: p=0.0009). (B) Among the neurons which were phase-locked to only 2 limbs (n=44 cells), a greater proportion of limb pairs were diagonal (chi-square test, p<0.0001). (C) Significant difference in spike-limb phase vector length when averaged by limb rank in order of highest to lowest vector length (n=274 cells, one-way RM ANOVA, p<0.0001). Data represent mean ± SEM. (D) The mean vector length of striatal neurons shows no preference for the contralateral (LF) or ipsilateral (RF) limb (paired t-test, p=0.3). Each dot represents one neuron. (E) Significant negative correlation between the vector length and session-wide firing rate per cell. Vector length is calculated from the LF limb (n=274 cells, Pearson r=–0.32, p<0.0001). Each dot represents one neuron. Red line represents the best linear fit, plotted on a logarithmic scale. (F) Mean vector length per cell as a function of the neuron’s estimated depth in the dorsal striatum relative to bregma (Pearson r=–0.08, p=0.22). Each dot represents one neuron.
Figure 3
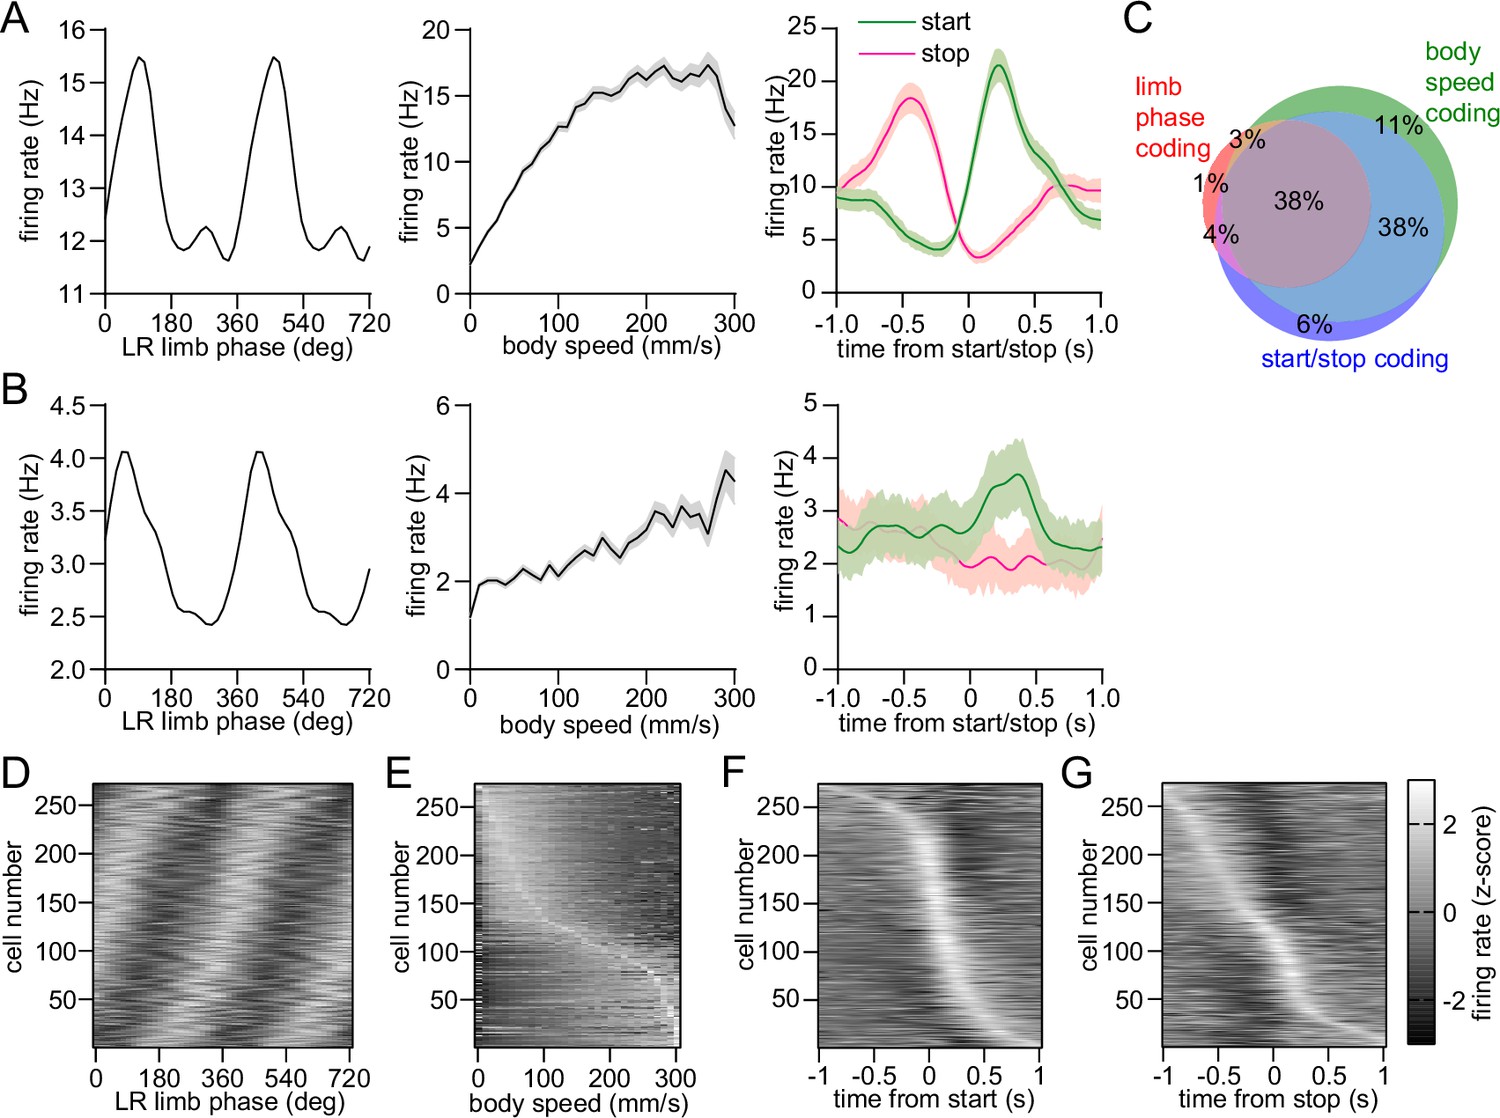
Mixed striatal encoding of single-limb and whole-body motion.
(A) Response of a neuron which significantly encodes LR limb phase (left), body speed (middle), and start/stop of body movements (right). (B) Response of a neuron which significantly encodes LR limb phase, body speed and the start of body movements, but not cessation of movements. Data in A and B are represented as mean ± SEM. (C) Venn diagram showing the percentage of striatal neurons with significant responses to limb phase (124 out of 274 cells pooled from 9 healthy mice, spike time jitter test, p<0.05 for at least one limb), body speed (245 out of 274 cells, Pearson correlation p<0.05) and start and/or stop of motion (232 out of 274 cells, paired t-test, p<0.05 for either start or stop). See Methods for further details. (D) Average firing rate (z-scored) as a function of LR limb phase for all striatal neurons (n=274). The cell number is ordered by the mean vector angle. The limb phase is plotted for two full gait cycles (0–720⁰) for visual clarity. (E) Average firing rate (z-scored) as a function of body speed for all striatal neurons. The cell number is ordered by the speed of highest firing. (F) Average firing rate (z-scored) aligned to the time of movement initiation. The cell number is ordered by the time of maximum firing. (G) Average firing rate (z-scored) aligned to the time of movement cessation. The cell number is ordered by the time of maximum firing.
Figure 4
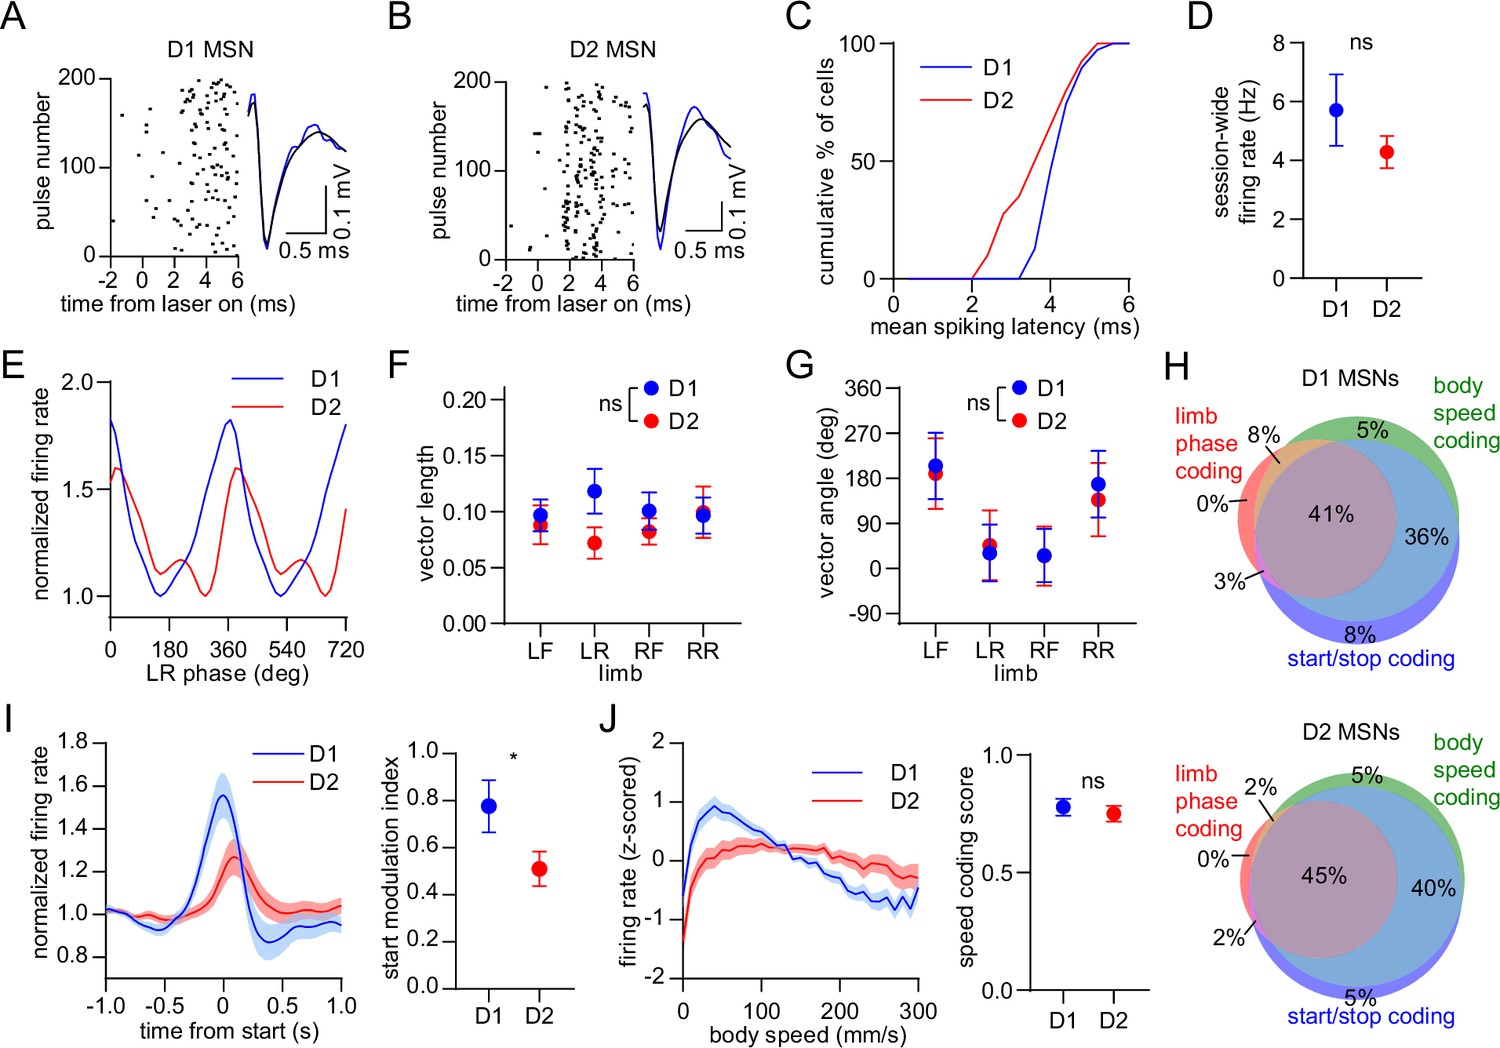
Balanced D1/D2 MSN activity during continuous walking but not movement initiation.
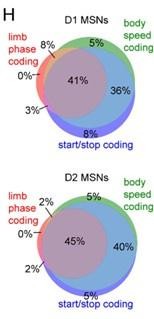
(A) Spike raster of an optogenetically identified D1 MSN from a D1-Cre mouse showing a rapid response to optical stimulation, and a similar spike waveform with (blue) and without (black) laser illumination. (B) Same as A but for an optogenetically identified D2 MSN from an A2a-Cre mouse. (C) Cumulative distribution of the latency to spiking during optical stimulation for all optogenetically tagged cells (n=39 D1 MSNs pooled from 3 mice and 40 D2 MSNs pooled from 6 mice). (D) No significant difference in the mean session-wide firing rate between D1 and D2 MSNs (n=39 D1 and 40 D2 MSNs, unpaired t-test, p=0.28). (E) Mean normalized firing rate as a function of LR limb phase for a D1 and D2 MSN. The activity of each cell is normalized to the minimum firing rate. The limb phase is plotted for two full gait cycles (0–720⁰) for visual clarity. (F) No significant difference in spike-limb phase vector length between D1 and D2 MSNs (n=39 D1 and 40 D2 MSNs, two-way ANOVA, F1,308 = 2.1, p=0.14). (G) No significant difference in mean vector angle between D1 and D2 MSNs (angular permutation test corrected for 4 multiple comparisons, p>0.99). (H) Venn diagrams showing the percentage of D1 and D2 MSNs with significant responses to limb phase of at least one limb, body speed, and start and/or stop of motion. (I) Left: normalized firing rate relative to the start of movement averaged across all D1 and D2 MSNs. Data are normalized to the mean firing rate in the pre-start baseline period. Right: The start modulation index (fractional change in firing in start period relative to pre-start) of D1 MSNs is significantly higher than D2 MSNs (n=39 D1 and 40 D2 MSNS, unpaired t-test, p=0.048). (J) Left: firing rate (z-scored) as a function of body speed averaged across all D1 and D2 MSNs. Right: No significant difference in speed coding score (absolute Pearson r of firing rate with respect to speed) between D1 and D2 MSNs (n=39 D1 and 40 D2 MSNs, unpaired t-test, p=0.57). Angular data are represented as mean ± SD. All the other data are represented as mean ± SEM.
Figure 5 with 1 supplement
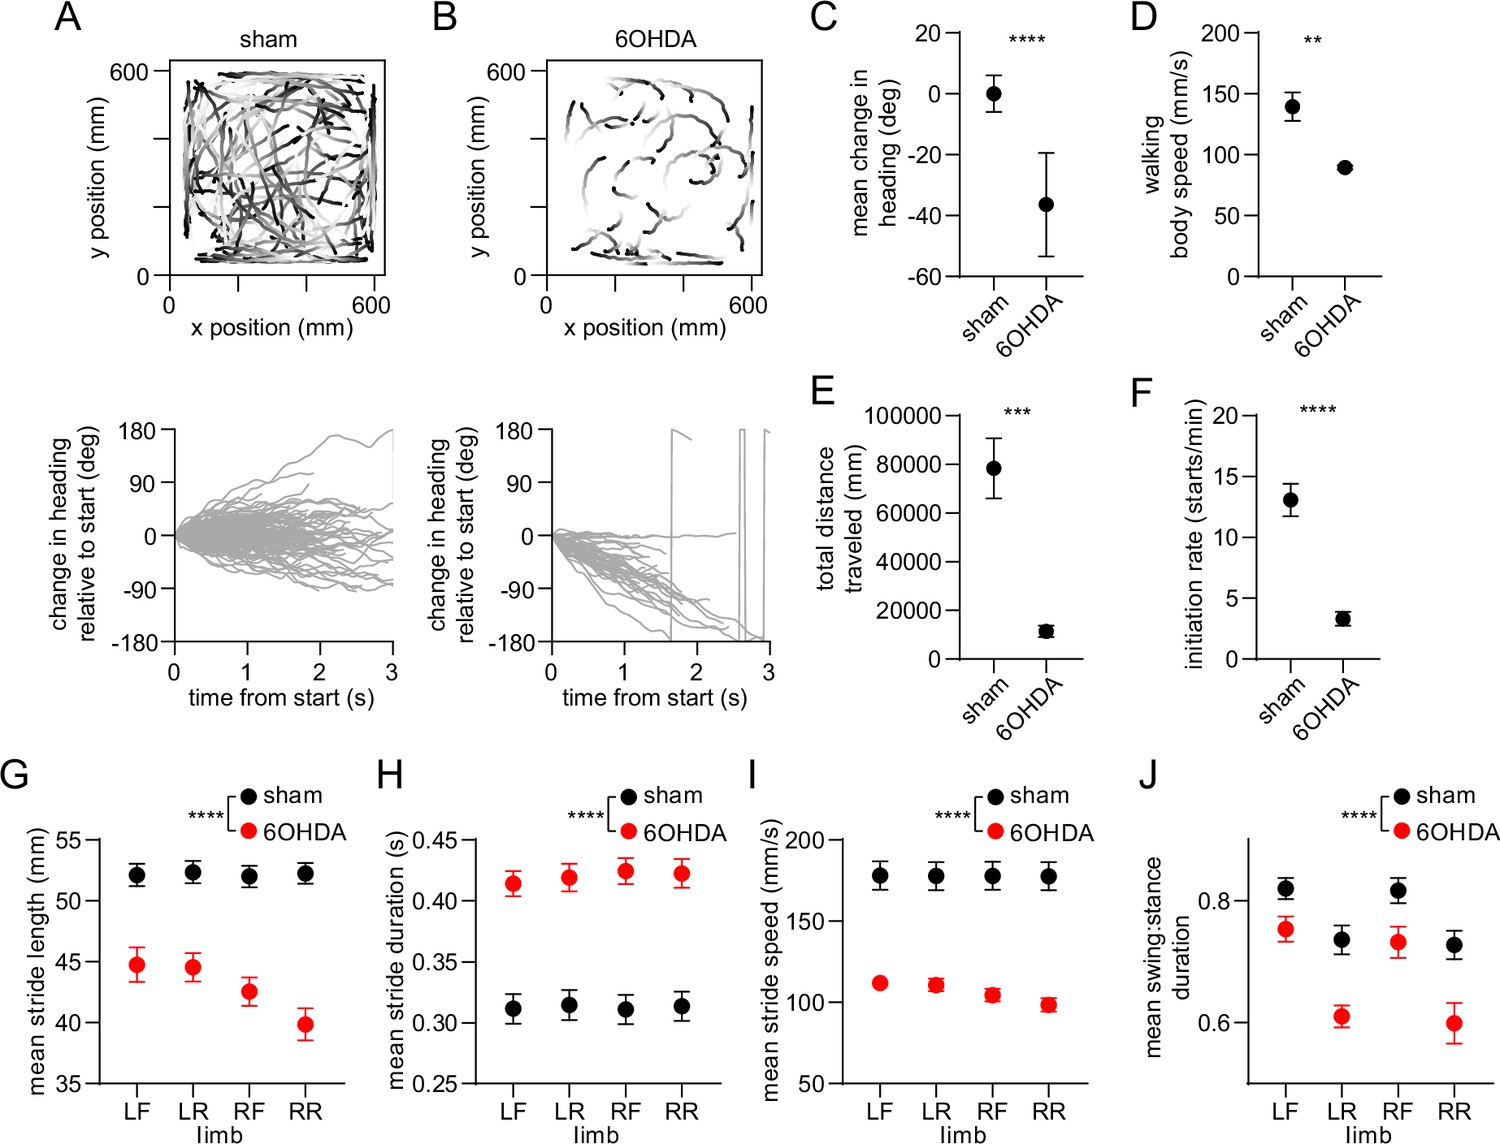
Whole-body and single-limb motor impairments in dopamine-lesioned mice.
(A) Top: Walking bout body trajectories from a sham-lesioned mouse. Light color represents the start of movement. Bottom: time course of the animal’s change in heading during each walking bout. Positive/negative heading indicates contra/ipsi-versive turning. (B) Same as A but for a 6OHDA-lesioned mouse. (C) Mean change in movement direction was altered in the 6OHDA group, with negative values indicating ipsiversive turning (n=10 6 OHDA and 14 sham-lesioned mice, angular permutation test, p<0.0001). (D) Mean body speed was reduced in the 6OHDA group (unpaired t-test, p=0.002). (E) Total distance covered by each animal in a recording session was reduced in the 6OHDA group (unpaired t-test, p=0.0002). (F) Rate of initiating movements was reduced in the 6OHDA group (unpaired t-test, p<0.0001). (G) Mean stride length was reduced in the 6OHDA group (n=10 6 OHDA and 14 sham-lesioned mice, two-way ANOVA, F1,88 = 151.4, p<0.0001). (H) Mean stride duration was increased in the 6OHDA group (two-way ANOVA, F1,88 = 157, p<0.0001). (I) Mean stride speed was reduced in the 6OHDA group (two-way ANOVA, F1,88 = 174, p<0.0001). (J) Mean ratio of the swing:stance phase duration was reduced in the 6OHDA group (two-way ANOVA, F1,88 = 38, p<0.0001). Angular data are represented as mean ± SD. All the other data are represented as mean ± SEM.
Figure 5—figure supplement 1
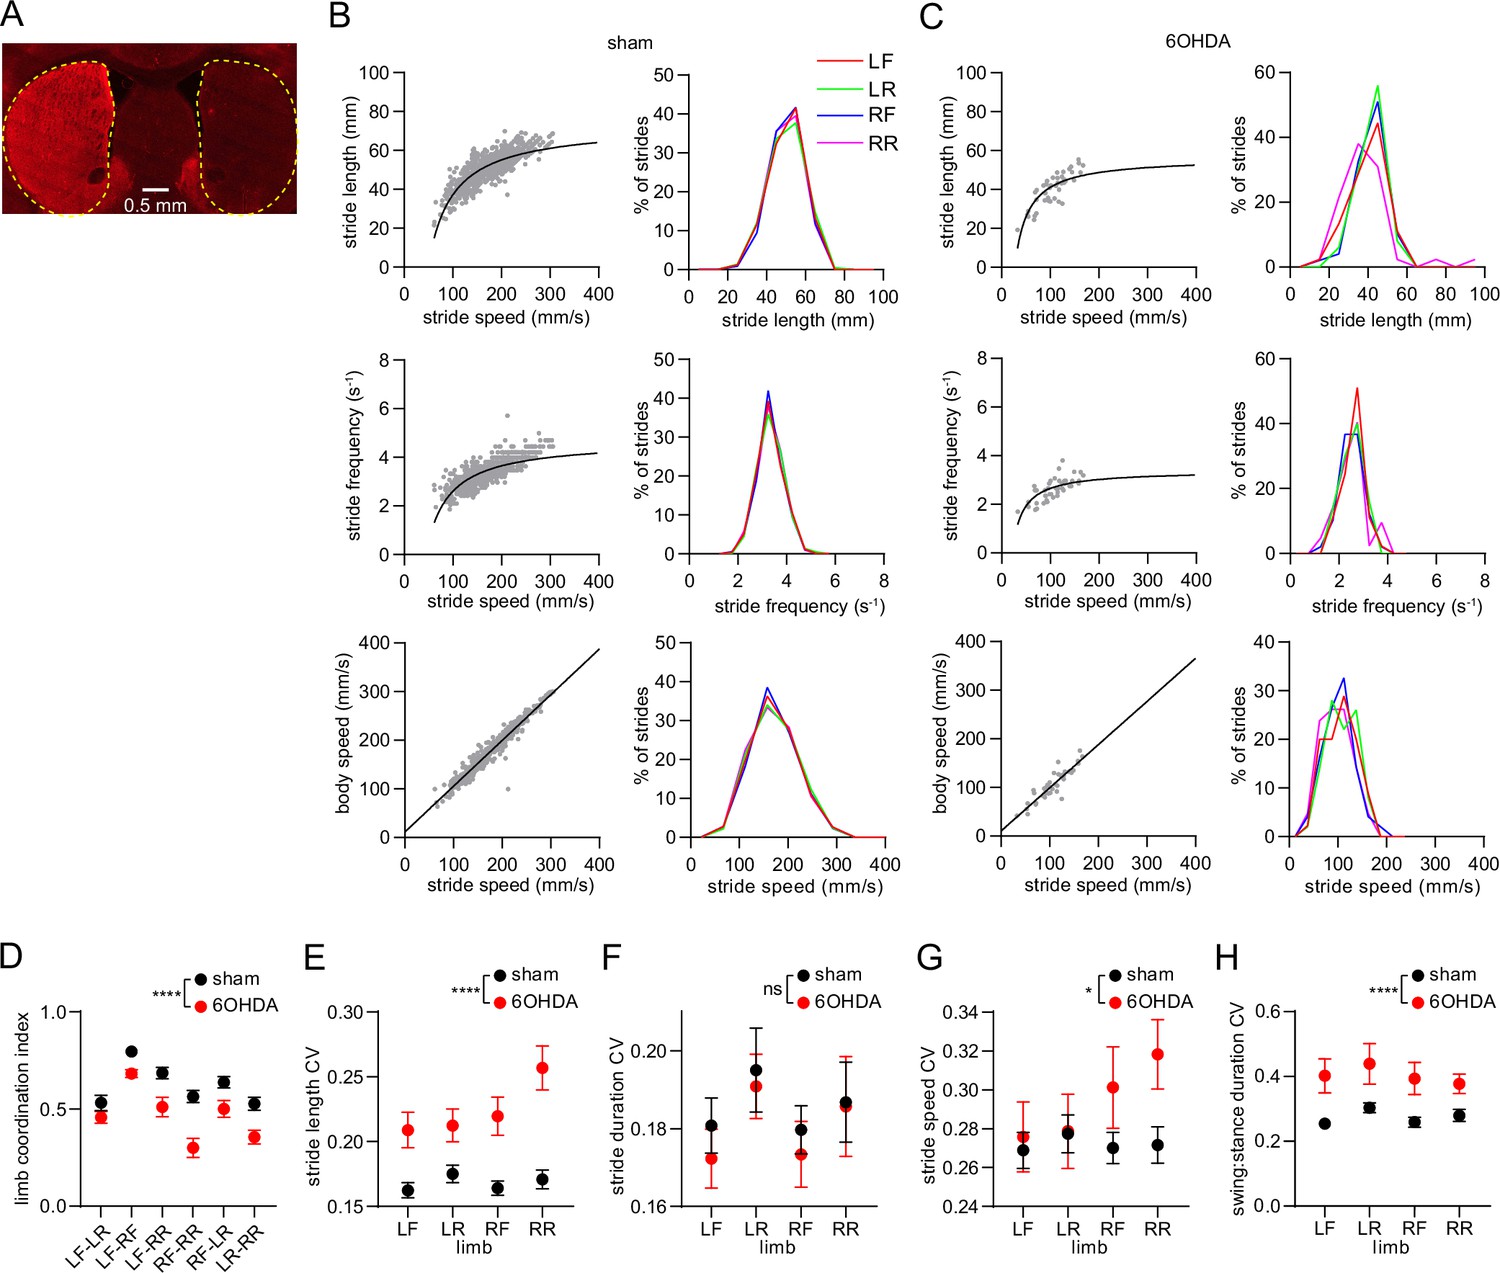
Limb coordination and gait variability are altered by dopamine lesions.
(A) Fluorescence image of a brain section from a 6OHDA-lesioned mouse, immunostained for tyrosine hydroxylase. Dashed yellow lines demarcate the striatum. Scale bar: 0.5 mm. (B) Limb stride parameters from one recording session in the sham group. Gray dots represent individual LF limb strides. Black lines represent the best polynomial or linear fit. (C) Limb stride parameters from one recording session in the 6OHDA group. (D) The coordination between different limb pairs is significantly reduced in the 6OHDA group (n=10 6 OHDA and 14 sham-lesioned mice, two-way ANOVA, F1,132 = 61, p<0.0001). (E) Mean coefficient of variation (CV) in stride length is significantly increased in the 6OHDA group (two-way ANOVA, F1,88 = 61, p<0.0001). (F) Mean CV in stride duration does not significantly change in 6OHDA lesioned mice (two-way ANOVA, F1,88 = 0.6, p=0.45). (G) Mean CV in stride speed is significantly increased in the 6OHDA group (two-way ANOVA, F1,88 = 5, p=0.03). (H) Mean CV in the stride swing:stance duration is significantly increased in the 6OHDA group (two-way ANOVA, F1,88 = 31, p<0.0001). All data are represented as mean ± SEM.
Figure 6 with 2 supplements
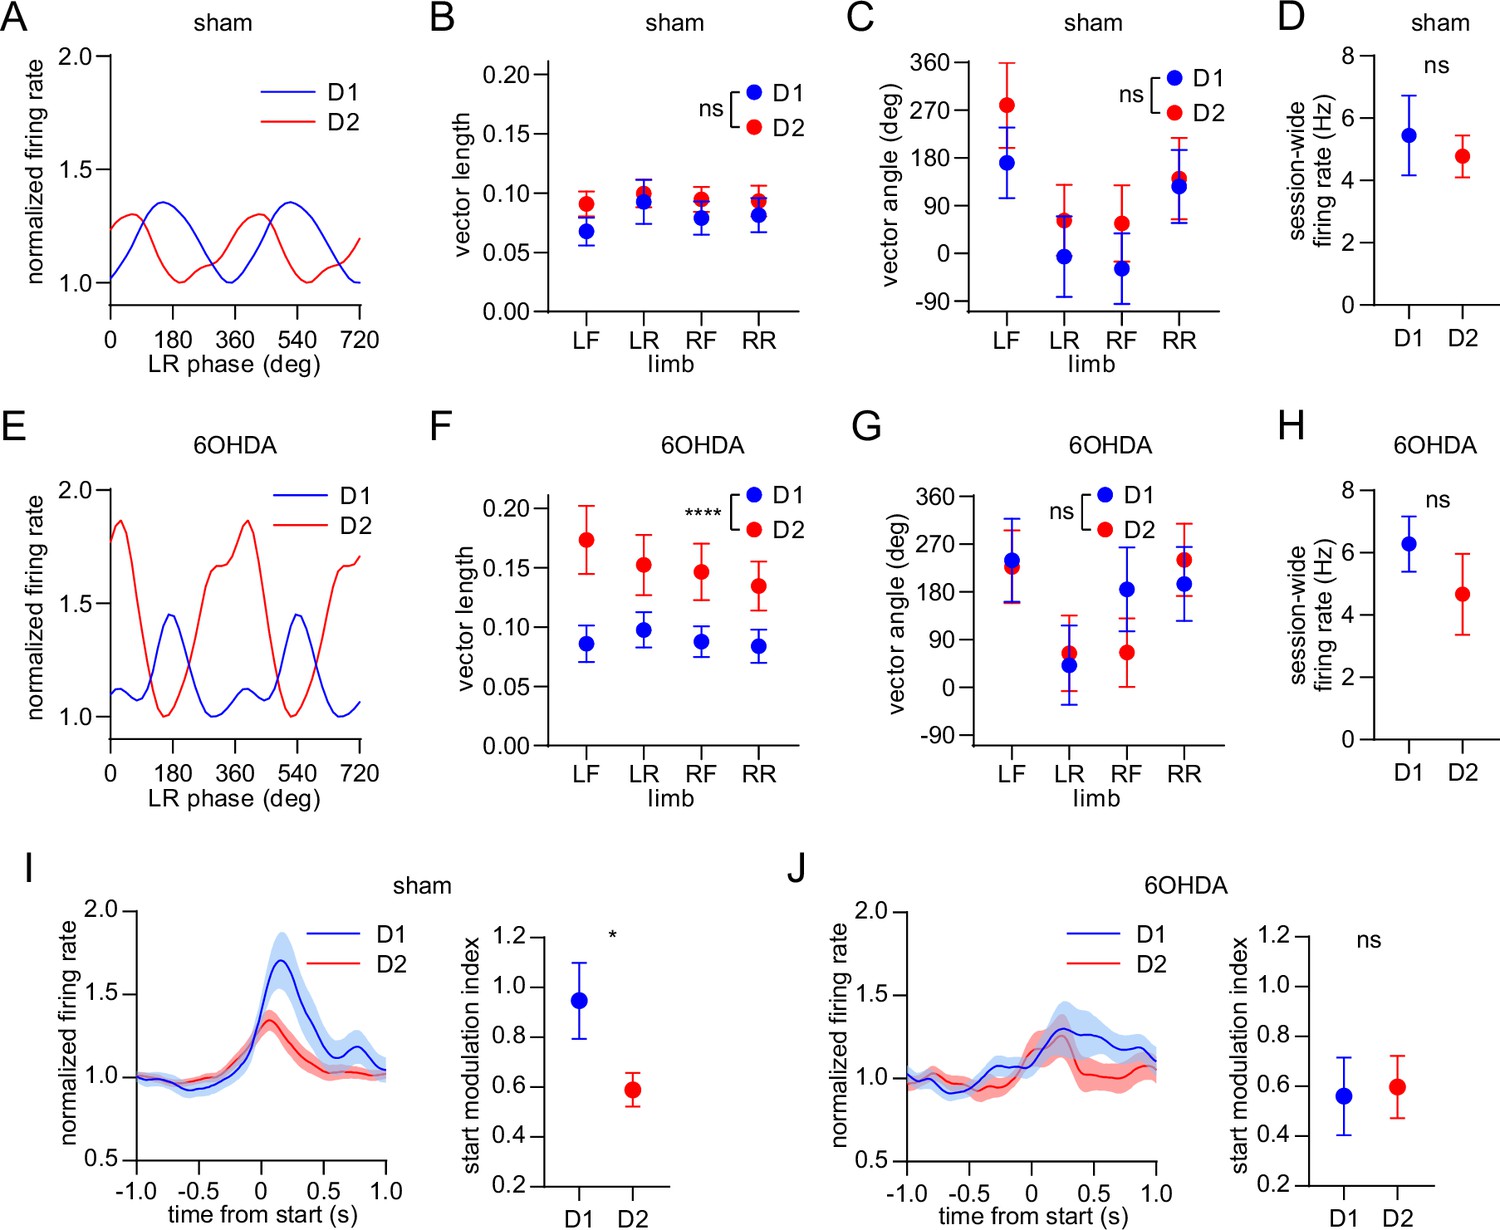
Dopamine lesions alter the relative level of D1/D2 MSN activity coupled to limb phase and movement initiation.
(A) Mean normalized firing rate as a function of LR limb phase for a D1 and D2 MSN from sham-lesioned mice. The activity of each cell is normalized to the minimum firing rate. The limb phase is plotted for two full gait cycles (0–720⁰) for visual clarity. (B) No significant difference in spike-limb phase vector length between D1 and D2 MSNs in the sham group (n=22 D1 MSNs pooled from 5 mice and 57 D2 MSNs pooled from 9 mice, two-way ANOVA, F1,308 = 1.95, p=0.16). (C) No significant difference in mean vector angle between D1 and D2 MSNs in the sham group (angular permutation test corrected for 4 multiple comparisons, p>0.5). (D) No significant difference in the mean session-wide firing rate between D1 and D2 MSNs in the sham group (n=22 D1 and 57 D2 MSNs, unpaired t-test, p=0.62). (E) Same as A but for cells recorded from 6OHDA-lesioned mice. (F) Significant difference in spike-limb phase vector length between D1 and D2 MSNs in the 6OHDA group (n=31 D1 MSNs pooled from 5 mice and 28 D2 MSNs pooled from 5 mice, two-way ANOVA, F1,228 = 20, p<0.0001). (G) No significant difference in mean vector angle between D1 and D2 MSNs in the sham group (angular permutation test corrected for 4 multiple comparisons, p>0.25). (H) No significant difference in the mean session-wide firing rate between D1 and D2 MSNs in the 6OHDA group (n=31 D1 and 28 D2 MSNs, unpaired t-test, p=0.30). (I) Left: normalized firing rate relative to the start of movement averaged across all D1 and D2 MSNs in the sham group. Data are normalized to the mean firing rate in a pre-start baseline period. Right: The start modulation index (fractional change in firing in start period relative to pre-start) of D1 MSNs is significantly higher than D2 MSNs (n=22 D1 and 57 D2 MSNs, unpaired t-test, p=0.016). (J) Left: normalized firing rate relative to the start of movement averaged across all D1 and D2 MSNs in the 6OHDA group. Data are normalized to the mean firing rate in a pre-start baseline period. Right: No significant difference in the start modulation index between D1 and D2 MSNs (n=31 D1 and 28 D2 MSNs, unpaired t-test, p=0.86). Angular data are represented as mean ± SD. All the other data are represented as mean ± SEM.
Figure 6—figure supplement 1
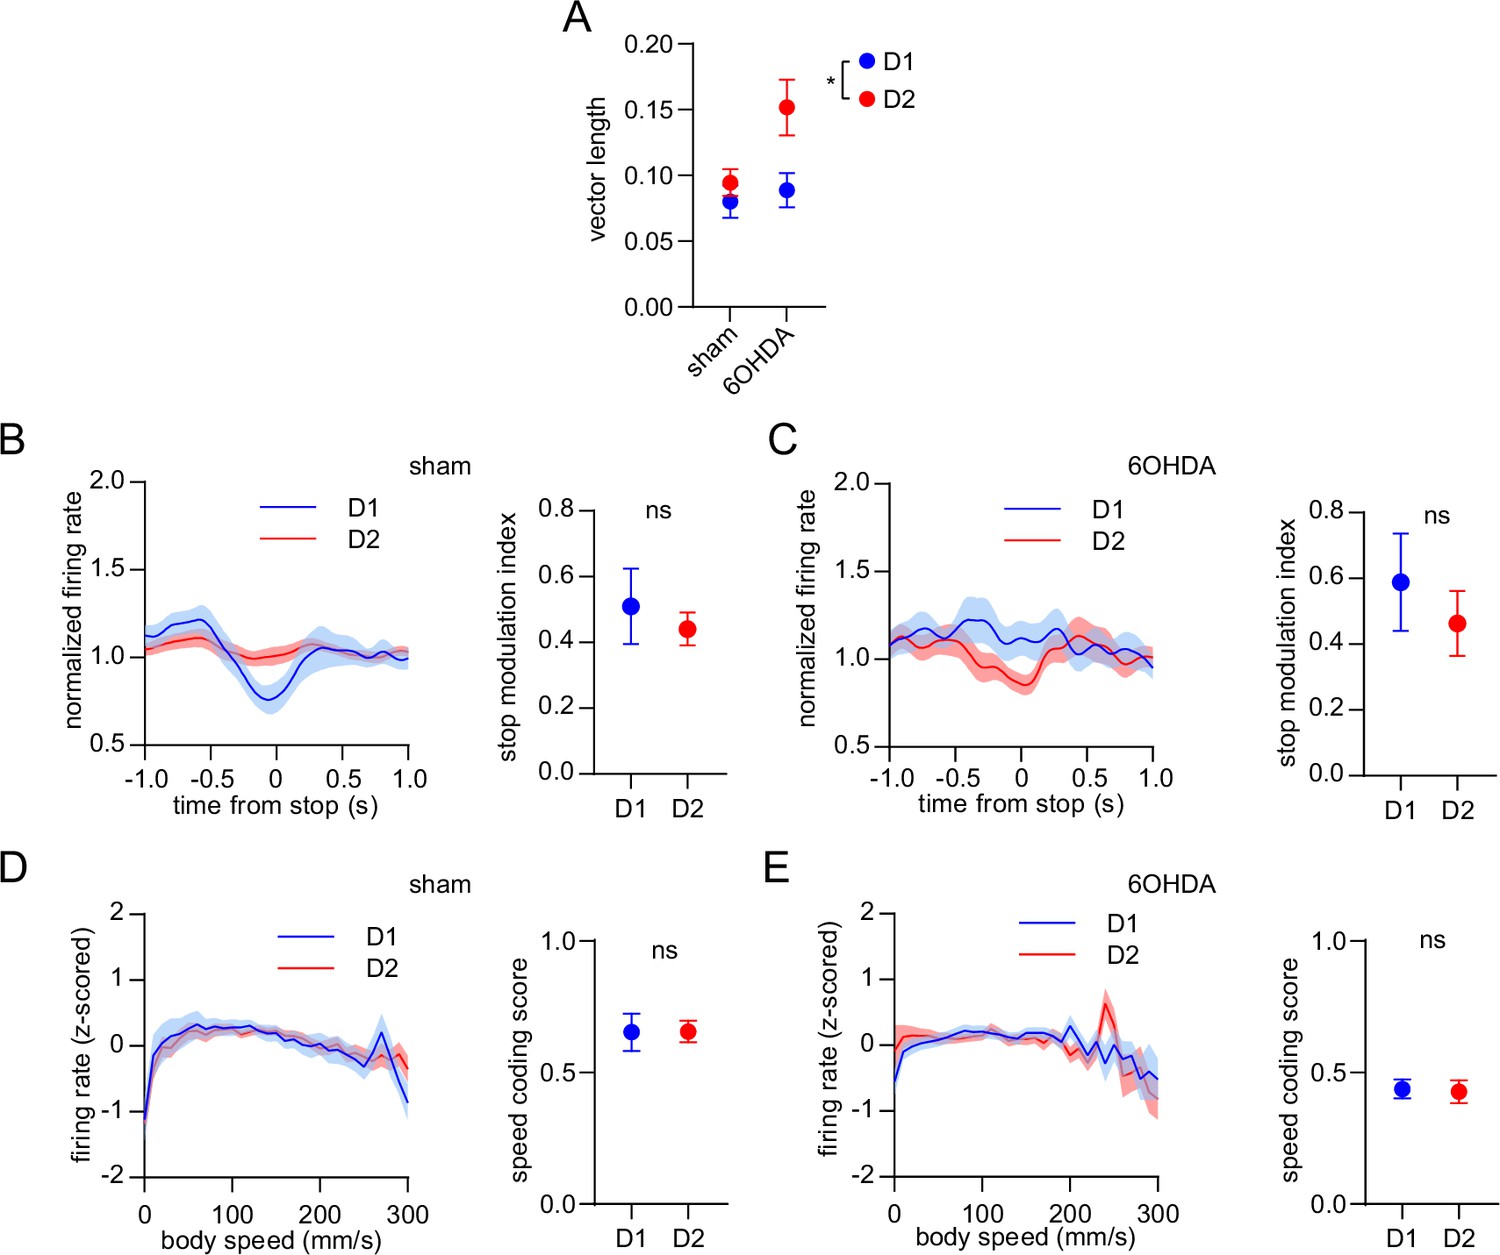
Dopamine lesions do not alter the balanced D1/D2 MSN encoding of movement cessation and body speed.
(A) Cell type (D1 or D2 MSN), group (sham or 6OHDA) and the interaction between them have a significant effect on the average vector length across the four limbs (n=22 D1 and 57 D2 MSNs in the sham group, 31 D1 and 28 D2 MSNs in the 6OHDA group, two-way ANOVA, cell type factor: F1,134 = 7, p=0.01, group factor: F1,134 = 5, p=0.03, interaction: F1,134 = 3, p=0.1). (B) Left: normalized firing rate relative to the cessation of movement averaged across all D1 and D2 MSNs in the sham group. Data are normalized to the mean firing rate in a pre-stop period. Right: No significant difference in the stop modulation index (fractional change in firing in stop period relative to pre-stop) between D1 and D2 MSNs (n=22 D1 and 57 D2 MSNs, unpaired t-test, p=0.52). (C) Left: normalized firing rate relative to the cessation of movement averaged across all D1 and D2 MSNs in the 6OHDA group. Data are normalized to the mean firing rate in a pre-stop period. Right: No significant difference in the stop modulation index between D1 and D2 MSNs (n=31 D1 and 28 D2 MSNs, unpaired t-test, p=0.5). (D) Left: firing rate (z-scored) as a function of body speed averaged across all D1 and D2 MSNs in the sham group. Right: No significant difference in speed coding score (absolute Pearson r of firing rate in relation to speed) between D1 and D2 MSNs (n=22 D1 and 57 D2 MSNs, unpaired t-test, p=0.97). (E) Left: firing rate (z-scored) as a function of body speed averaged across all D1 and D2 MSNs in the 6OHDA group. Right: No significant difference in speed coding score between D1 and D2 MSNs (n=31 D1 and 28 D2 MSNs, unpaired t-test, p=0.93). All data are represented as mean ± SEM.
Figure 6—figure supplement 2
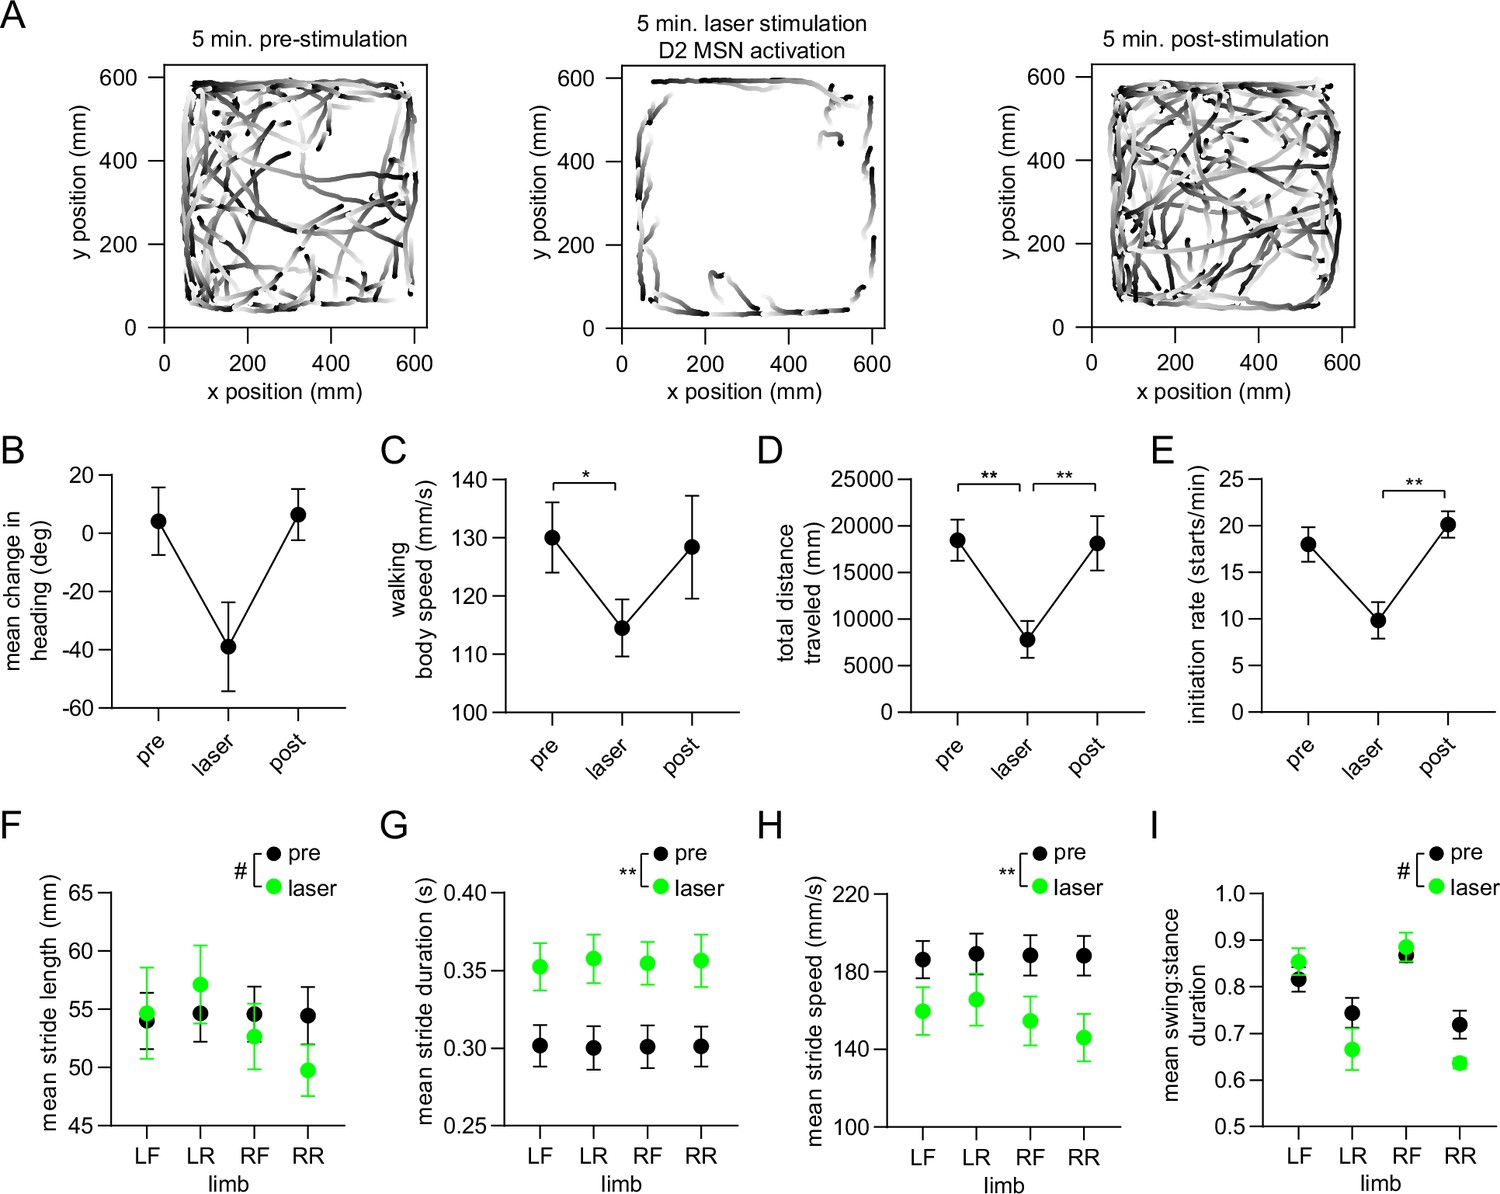
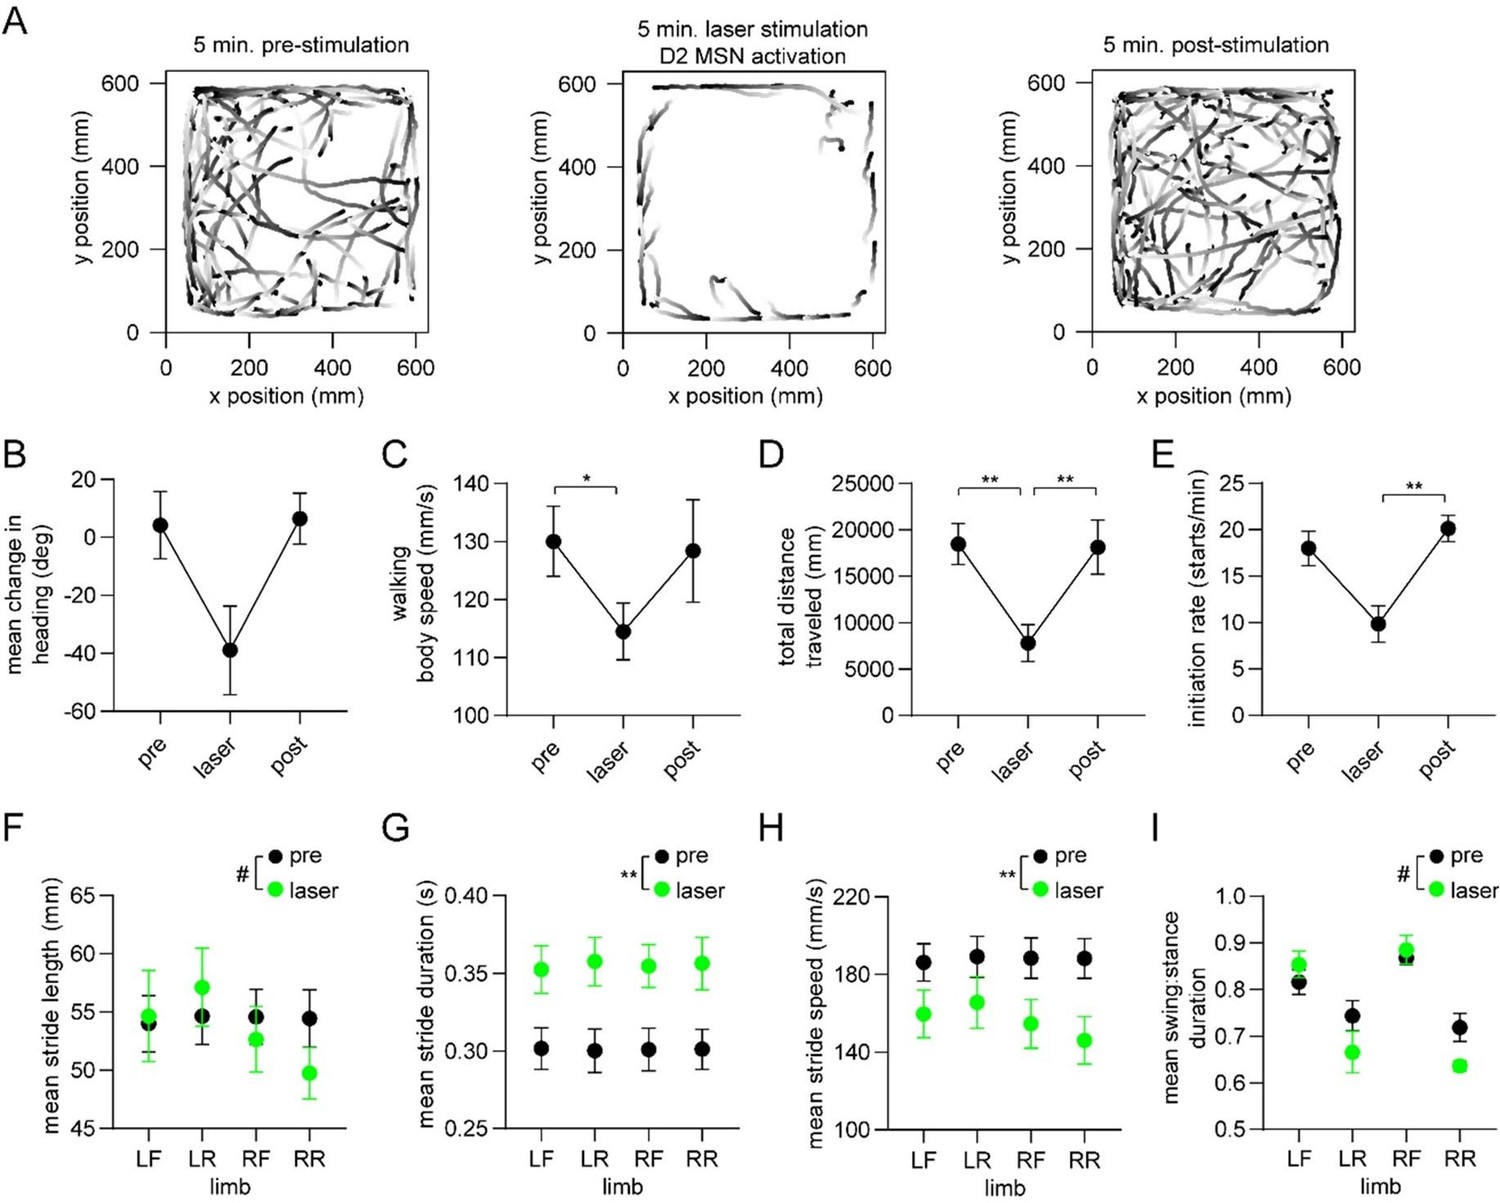
Optogenetic activation of D2 MSNs alters whole-body movement and single-limb gait.
(A) Walking bout body trajectories from one 15-min recording session during which the middle 5 min coincided with continuous optogenetic activation of striatal D2 MSNs in the right hemisphere. Light color represents the start of movement. (B) Mean change in movement direction in the pre-stimulation, laser, and post-stimulation periods. Negative angular values indicate ipsiversive turning (n=4 mice, angular permutation test adjusted for 3 comparisons, p>0.05). (C) Mean body speed in the pre-stimulation, laser, and post-stimulation periods (n=4 mice, one-way RM ANOVA, p=0.01). (D) Total distance covered in the pre-stimulation, laser, and post-stimulation periods (n=4 mice, one-way RM ANOVA, p<0.0001). (E) Rate of initiating movements in the pre-stimulation, laser, and post-stimulation periods (n=4 mice, one-way RM ANOVA, p=0.03). (F) Mean stride length per limb in the pre-stimulation and laser periods (n=4 mice, two-way ANOVA, pre vs laser: F1,3 = 0.9, p=0.42. Post-hoc multiple comparison tests revealed a significant difference for the RR limb: #p=0.03). (G) Mean stride duration per limb in the pre-stimulation and laser periods (n=4 mice, two-way ANOVA, pre vs laser: F1,3 = 83, p=0.003). (H) Mean stride speed per limb in the pre-stimulation and laser periods (n=4 mice, two-way ANOVA, pre vs laser: F1,3 = 161, p=0.001). (I) Mean stride swing:stance ratio per limb in the pre-stimulation and laser periods (n=4 mice, two-way ANOVA, pre vs laser: F1,3 = 1.7, p=0.28. Post-hoc multiple comparison tests revealed a significant difference for the LR and RR limbs: #p=0.02).
Author response image 1
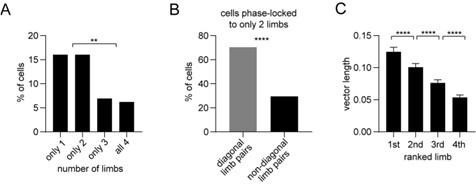
Phase-locking to different limbs (A-C).
Author response image 2
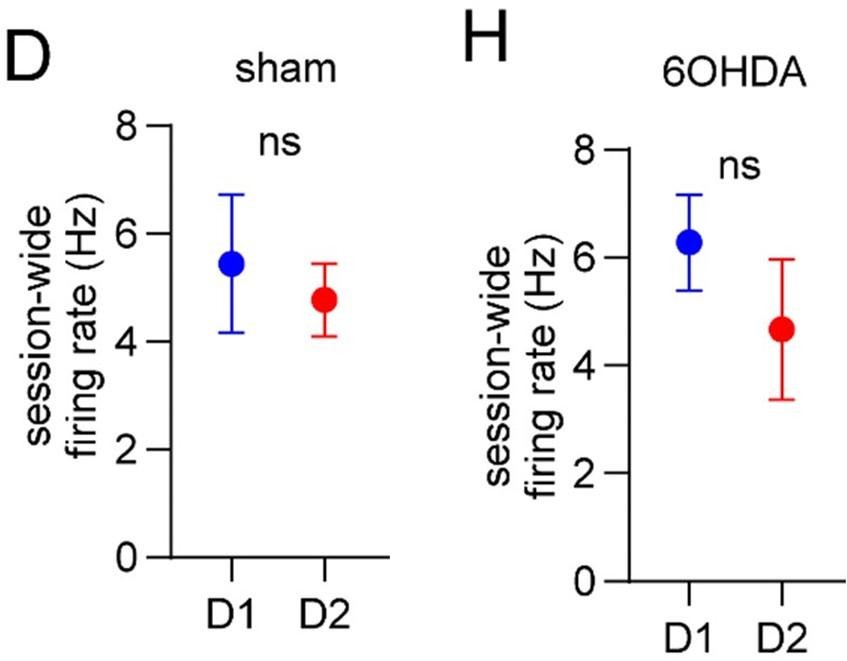
No difference in firing between D1 and D2 MSNs (D, H).
Author response image 3
Vector length is negatively correlated to firing rate (E).
Author response image 4
Venn diagrams showing the percentage of D1 and D2 MSNs with significant responses to limb phase of at least one limb, body speed, and start and/or stop of motion (H).
Author response image 5
Optogenetic activation of D2 MSNs alters whole-body movement and single-limb gait.
Additional files
Download links
A two-part list of links to download the article, or parts of the article, in various formats.
Downloads (link to download the article as PDF)
Open citations (links to open the citations from this article in various online reference manager services)
Cite this article (links to download the citations from this article in formats compatible with various reference manager tools)
Dopamine lesions alter the striatal encoding of single-limb gait
eLife 12:RP92821.
https://doi.org/10.7554/eLife.92821.3


