Structural insights into the orthosteric inhibition of P2X receptors by non-ATP analog antagonists
- State Key Laboratory of Genetic Engineering, Shanghai Key Laboratory of Bioactive Small Molecules, Collaborative Innovation Center of Genetics and Development, Department of Physiology and Neurobiology, School of Life Sciences, Fudan University, China
- School of Basic Medicine and Clinical Pharmacy, China Pharmaceutical University, China
- State Key Laboratory of Genetic Engineering, Department of Biochemistry and Biophysics, School of Life Sciences, Fudan University, China
Figures
Figure 1 with 6 supplements
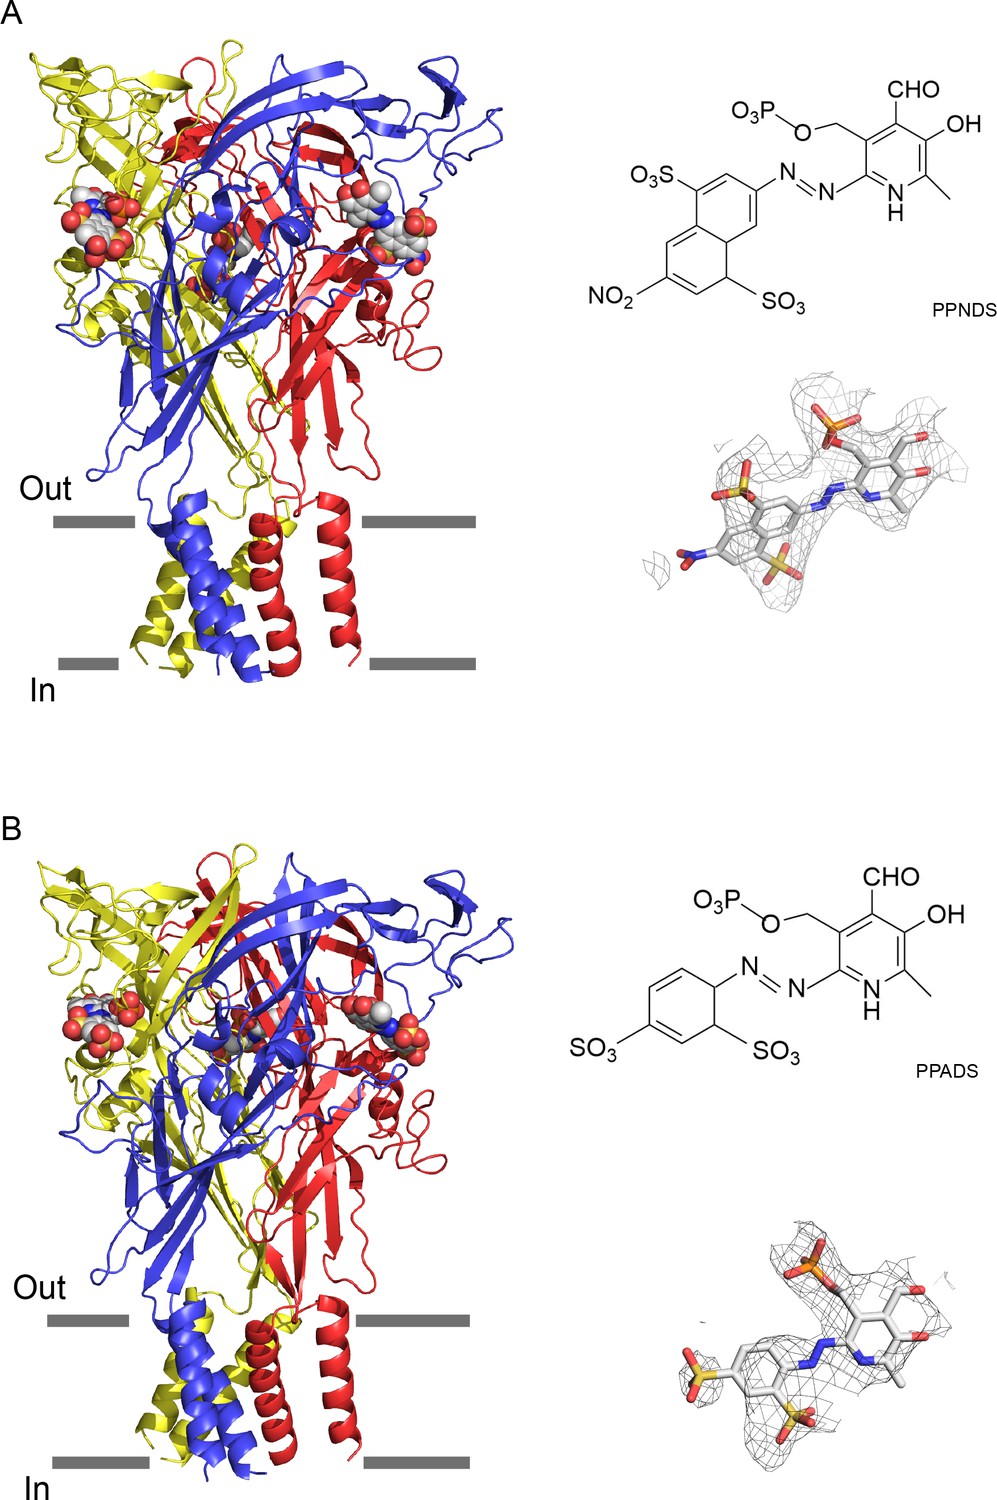
Cryogenic electron microscopy (cryo-EM) structures of pyridoxal-5'-phosphate-6-(2'-naphthylazo-6'-nitro-4',8'-disulfonate) (PPNDS)-bound and pyridoxal phosphate-6-azophenyl-2′,5′-disulfonic acid (PPADS)-bound panda P2X7 (pdP2X7).
The trimeric structures of PPNDS-bound (A) and PPADS-bound (B) pdP2X7, viewed parallel to the membrane. The PPNDS and PPADS molecules are shown as spheres. Each subunit of the trimers is colored blue, yellow, and red. The EM density maps contoured at 4.5σ and 3.5σ for PPNDS and PPADS are shown as gray mesh. The structural formulas of PPNDS and PPADS are also shown.
Figure 1—figure supplement 1
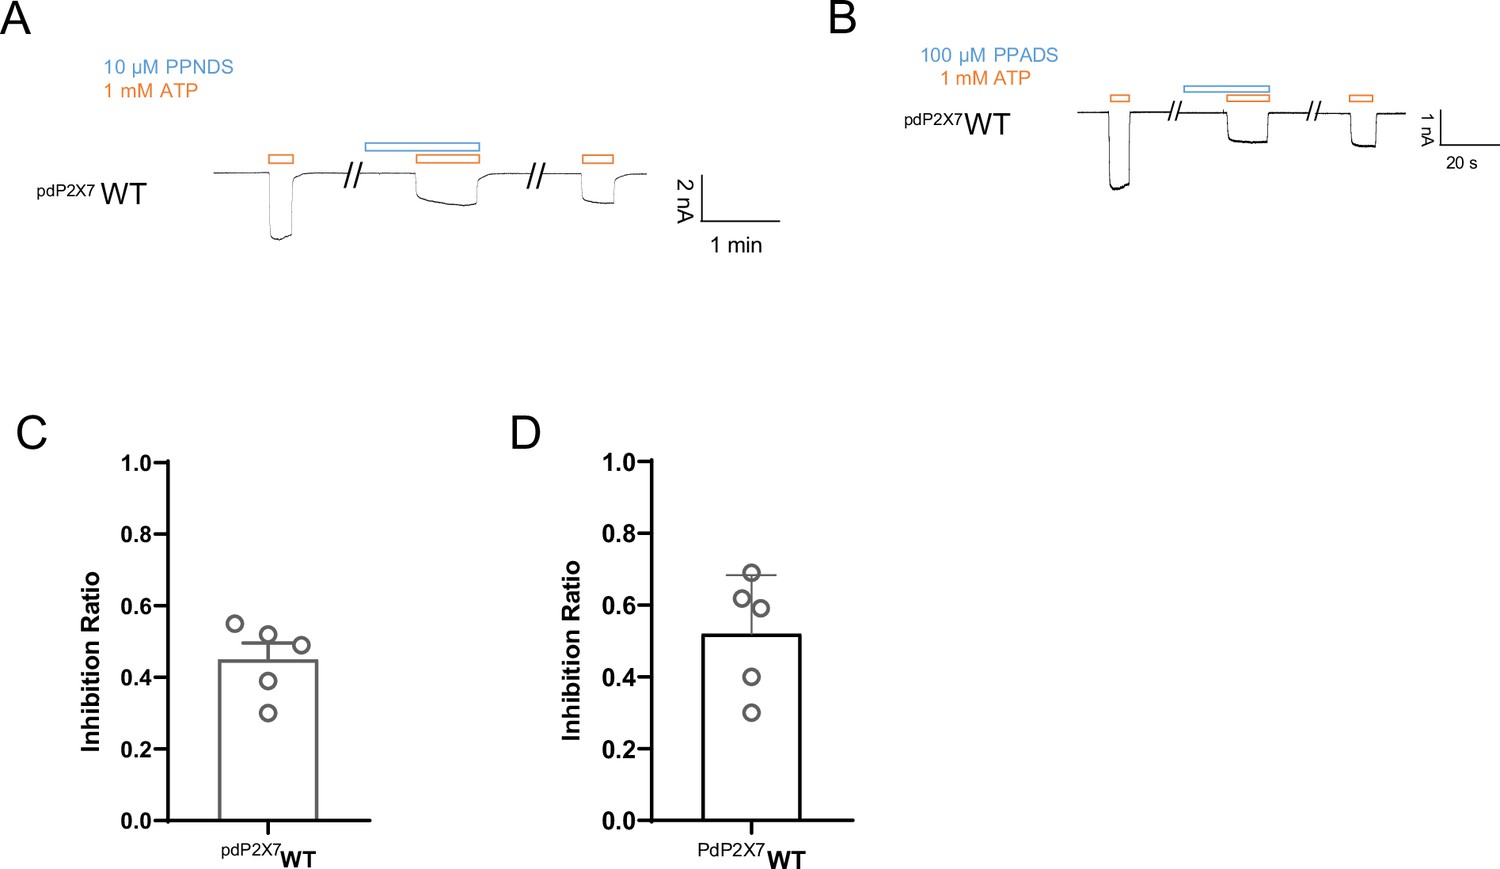
Effects of pyridoxal-5'-phosphate-6-(2'-naphthylazo-6'-nitro-4',8'-disulfonate) (PPNDS) and pyridoxal phosphate-6-azophenyl-2′,5′-disulfonic acid (PPADS) on panda P2X7 (pdP2X7) by patch-clamp recording.
(A–B) Representative current traces from patch-clamp recordings of pdP2X7. Effects of 10 µM PPNDS (blue) on the 1 mM ATP-evoked (orange) current of pdP2X7 (A). Effects of 100 µM PPADS (blue) on the 1 mM ATP-evoked (orange) current of pdP2X7 (B). (C–D) Effects of PPNDS (10 µM) (C) and PPADS (100 µM) (D) on ATP (1 mM)-evoked currents of pdP2X7 (mean ± SD, n=5). The graph for PPNDS was taken from Figure 6B. The inhibition ratio is defined by normalizing the peak current amplitude from the co-application of PPNDS/PPADS and ATP to the peak current amplitude from the ATP application prior to the co-application of PPNDS/PPADS and ATP.
-
Figure 1—figure supplement 1—source data 1
Numerical data for Figure 1—figure supplement 1C and D.
- https://cdn.elifesciences.org/articles/92829/elife-92829-fig1-figsupp1-data1-v1.xlsx
Figure 1—figure supplement 2
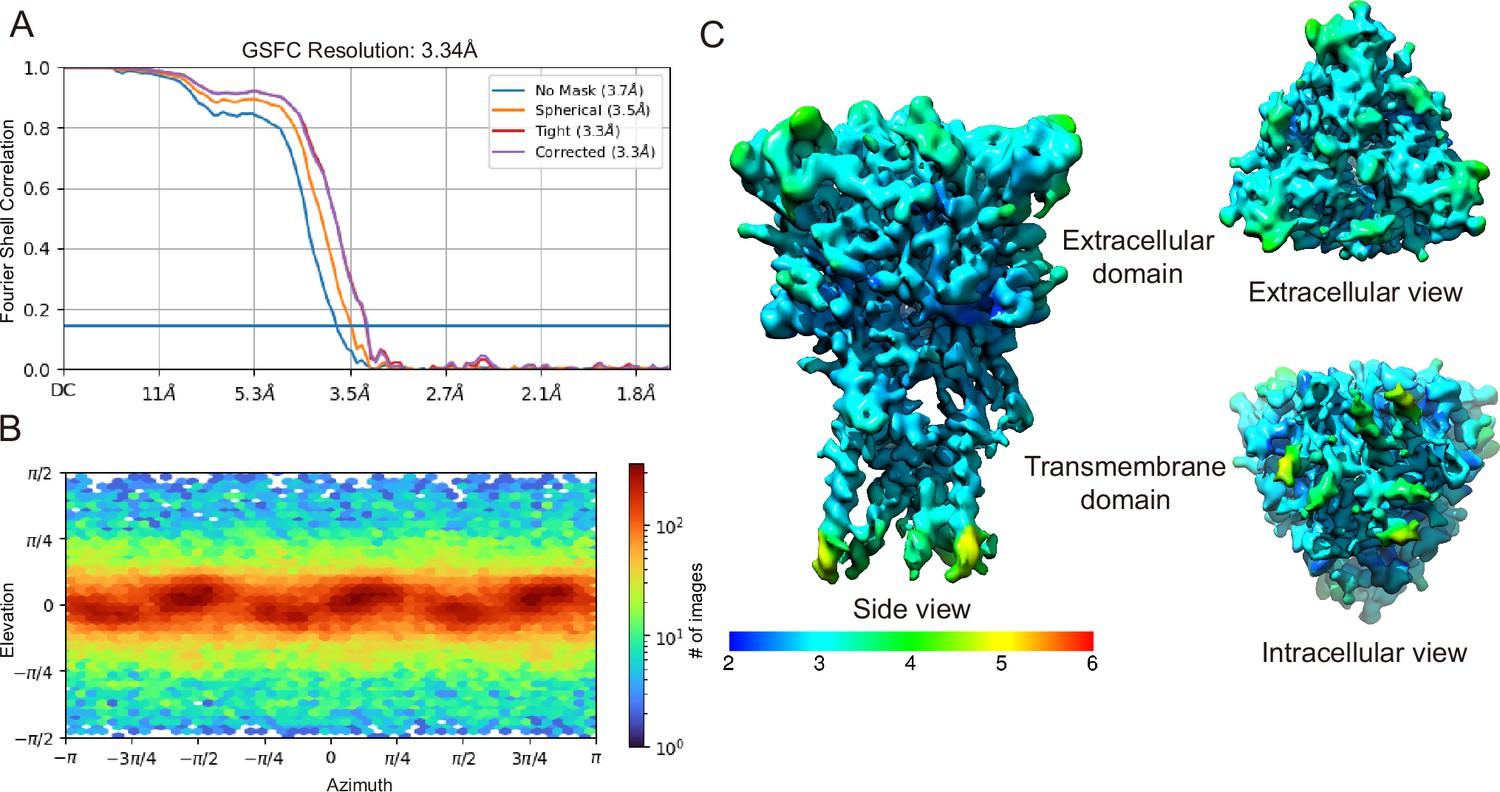
Cryogenic electron microscopy (cryo-EM) analysis of pyridoxal-5'-phosphate-6-(2'-naphthylazo-6'-nitro-4',8'-disulfonate) (PPNDS)-bound panda P2X7 (pdP2X7).
(A) The gold-standard Fourier shell correlation curves for the PPNDS-bound data. (B) Angular particle distribution. The heat map of particle projections in each viewing angle. (C) The side view, a top-down view from the extracellular surface and a bottom-up view from the intracellular surface colored by local resolution.
Figure 1—figure supplement 3
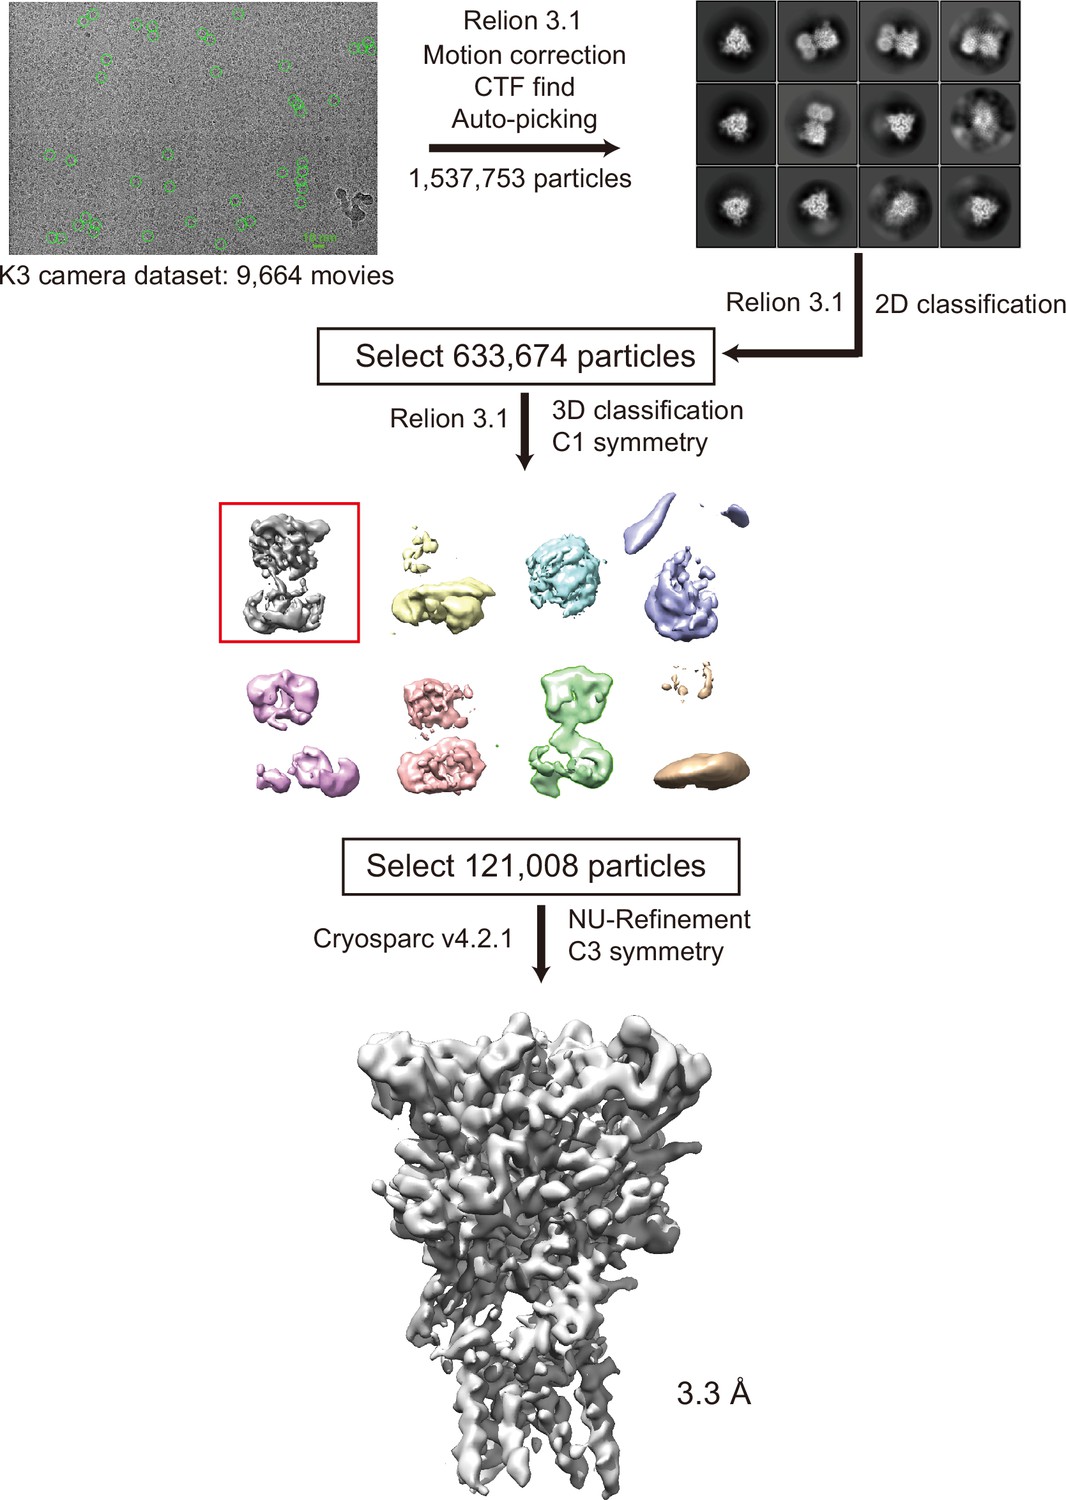
Cryogenic electron microscopy (cryo-EM) data process for pyridoxal-5'-phosphate-6-(2'-naphthylazo-6'-nitro-4',8'-disulfonate) (PPNDS)-bound panda P2X7 (pdP2X7).
Before applying C3 symmetry, all steps including 3D classification were performed in Relion 3.1. With C3 symmetry, further refinement using cryoSPARC v4.2.1 by non-uniform refinement of this final set of particles resulted in a cryo-EM map at 3.34 Å resolution.
Figure 1—figure supplement 4
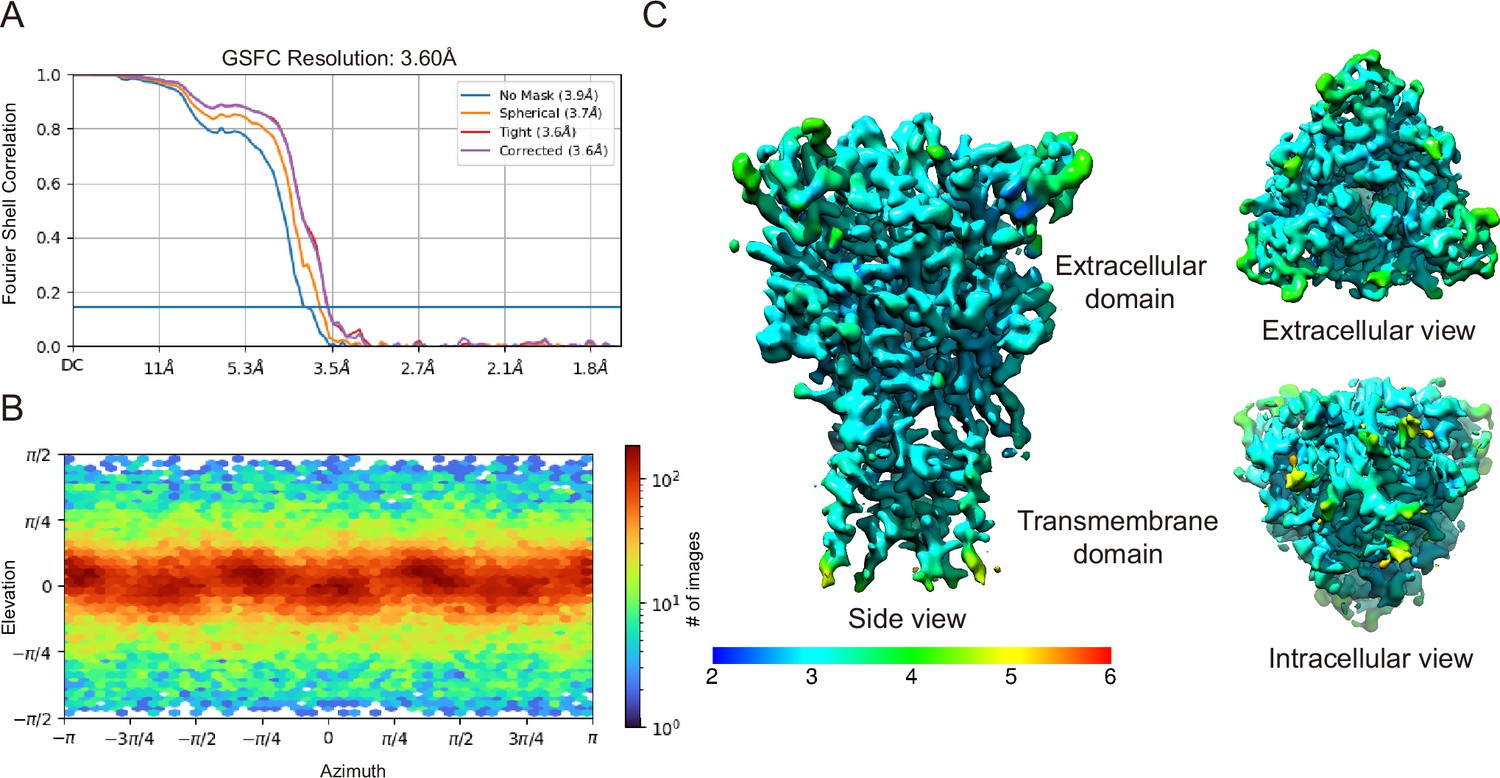
Cryogenic electron microscopy (cryo-EM) analysis of pyridoxal phosphate-6-azophenyl-2′,5′-disulfonic acid (PPADS)-bound panda P2X7 (pdP2X7).
(A) The gold-standard Fourier shell correlation curves for the PPADS-bound data. (B) Angular particle distribution. The heat map of particle projections in each viewing angle. (C) The side view, a top-down view from the extracellular surface and a bottom-up view from the intracellular surface colored by local resolution.
Figure 1—figure supplement 5
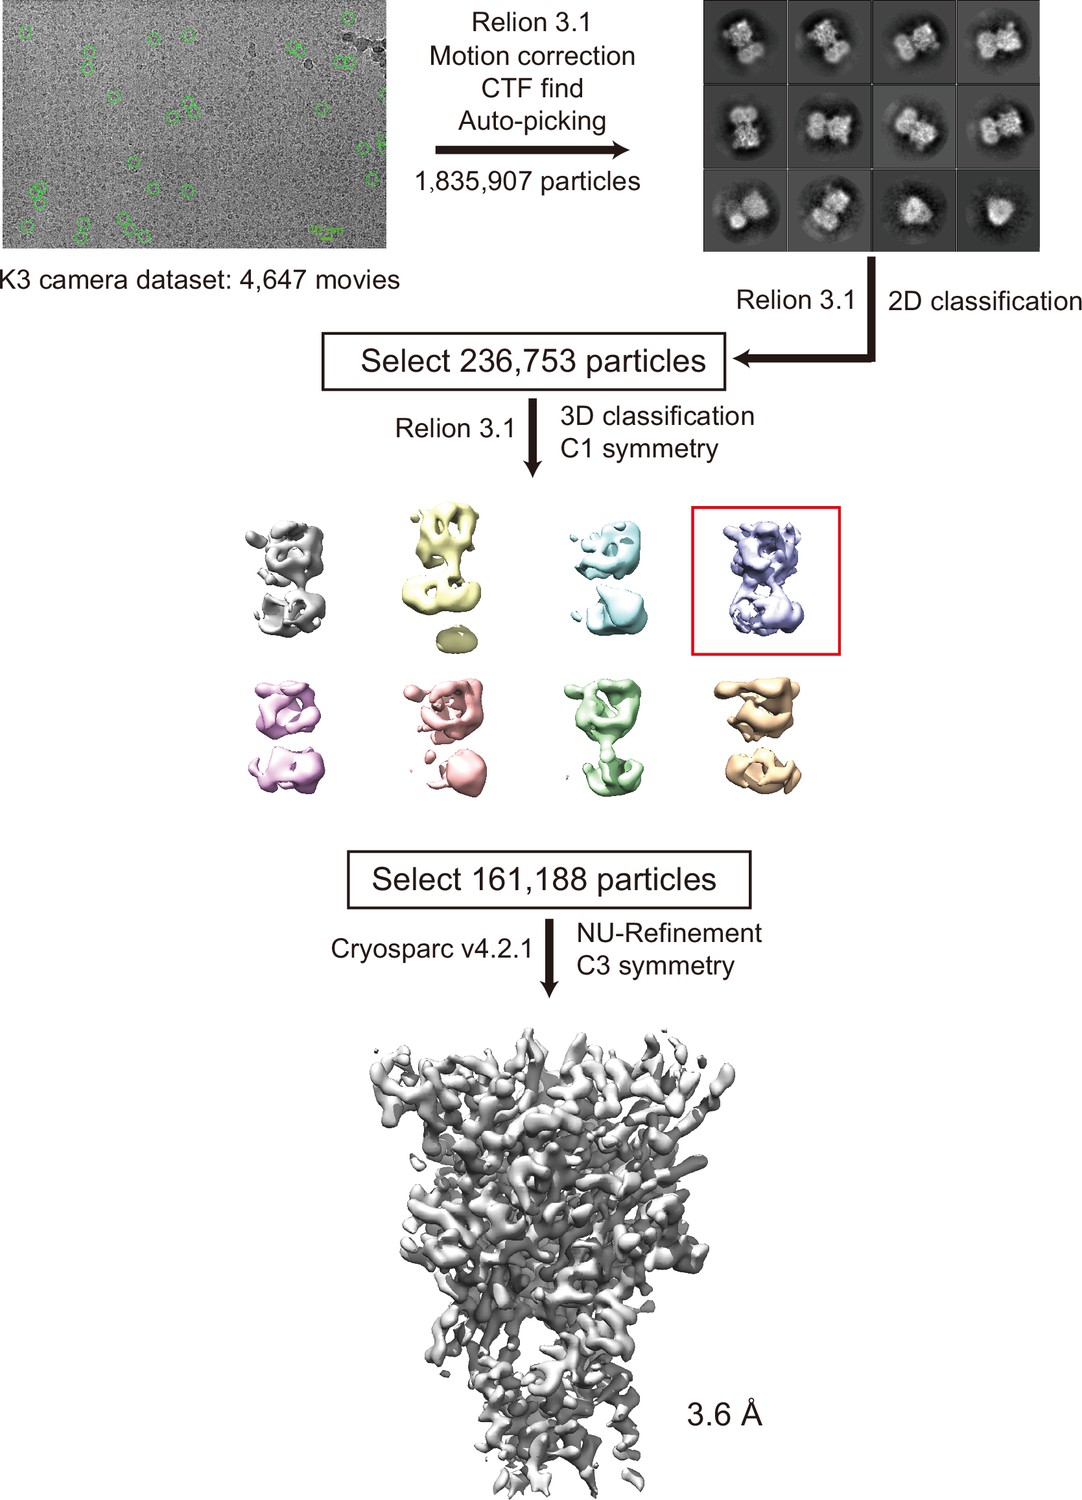
Cryogenic electron microscopy (cryo-EM) data process for pyridoxal phosphate-6-azophenyl-2′,5′-disulfonic acid (PPADS)-bound panda P2X7 (pdP2X7).
Before applying C3 symmetry, all steps including 3D classification were performed in Relion 3.1. With C3 symmetry, further refinement using cryoSPARC v4.2.1 by non-uniform refinement of this final set of particles resulted in a cryo-EM map at 3.60 Å resolution.
Figure 1—figure supplement 6
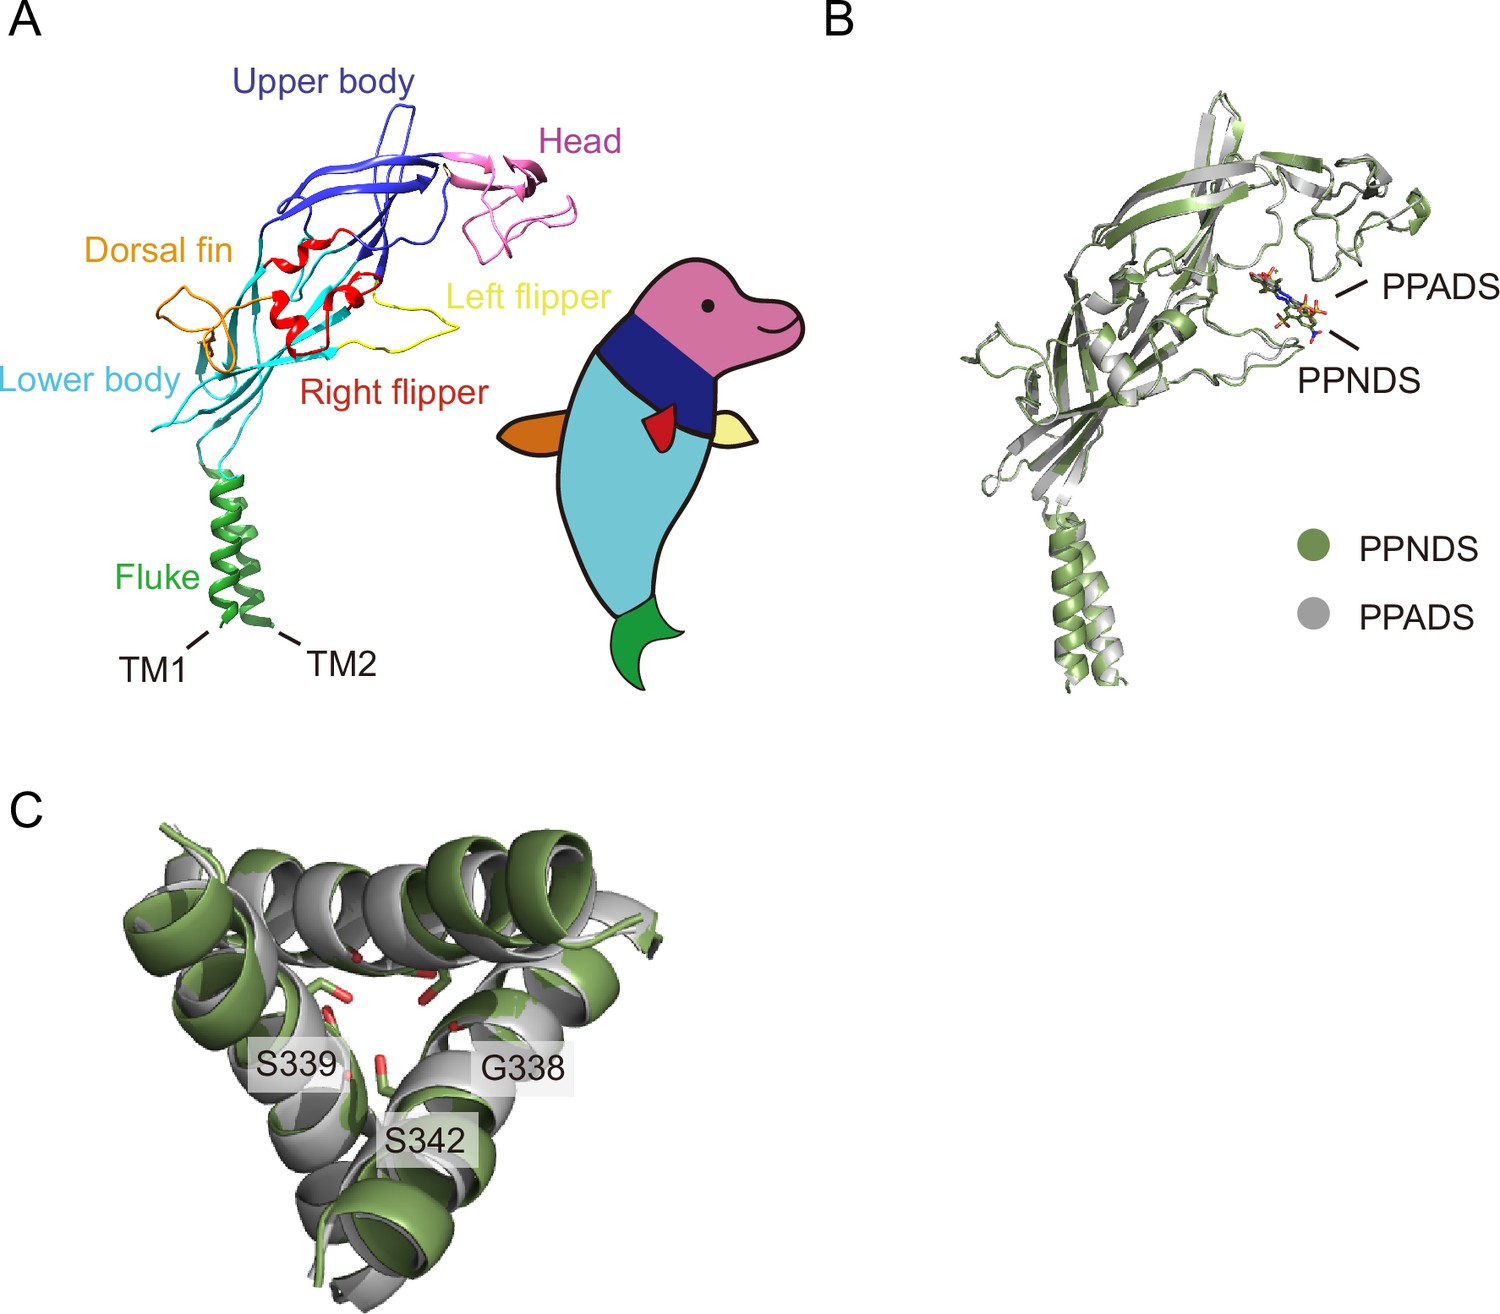
Dolphin model.
(A) The P2X7 protomer in cartoon representation. Each structural feature is colored according to the dolphin model. (B, C) Superposition of the pyridoxal-5'-phosphate-6-(2'-naphthylazo-6'-nitro-4',8'-disulfonate) (PPNDS)-bound structure (green) onto the pyridoxal phosphate-6-azophenyl-2′,5′-disulfonic acid (PPADS)-bound structure (gray). Each protomer is shown in cartoon representations, and PPNDS and PPADS are shown in stick representations (B). The intracellular view of the transmembrane domain and the residues at the constriction region are shown in stick representations (C).
Figure 2 with 2 supplements
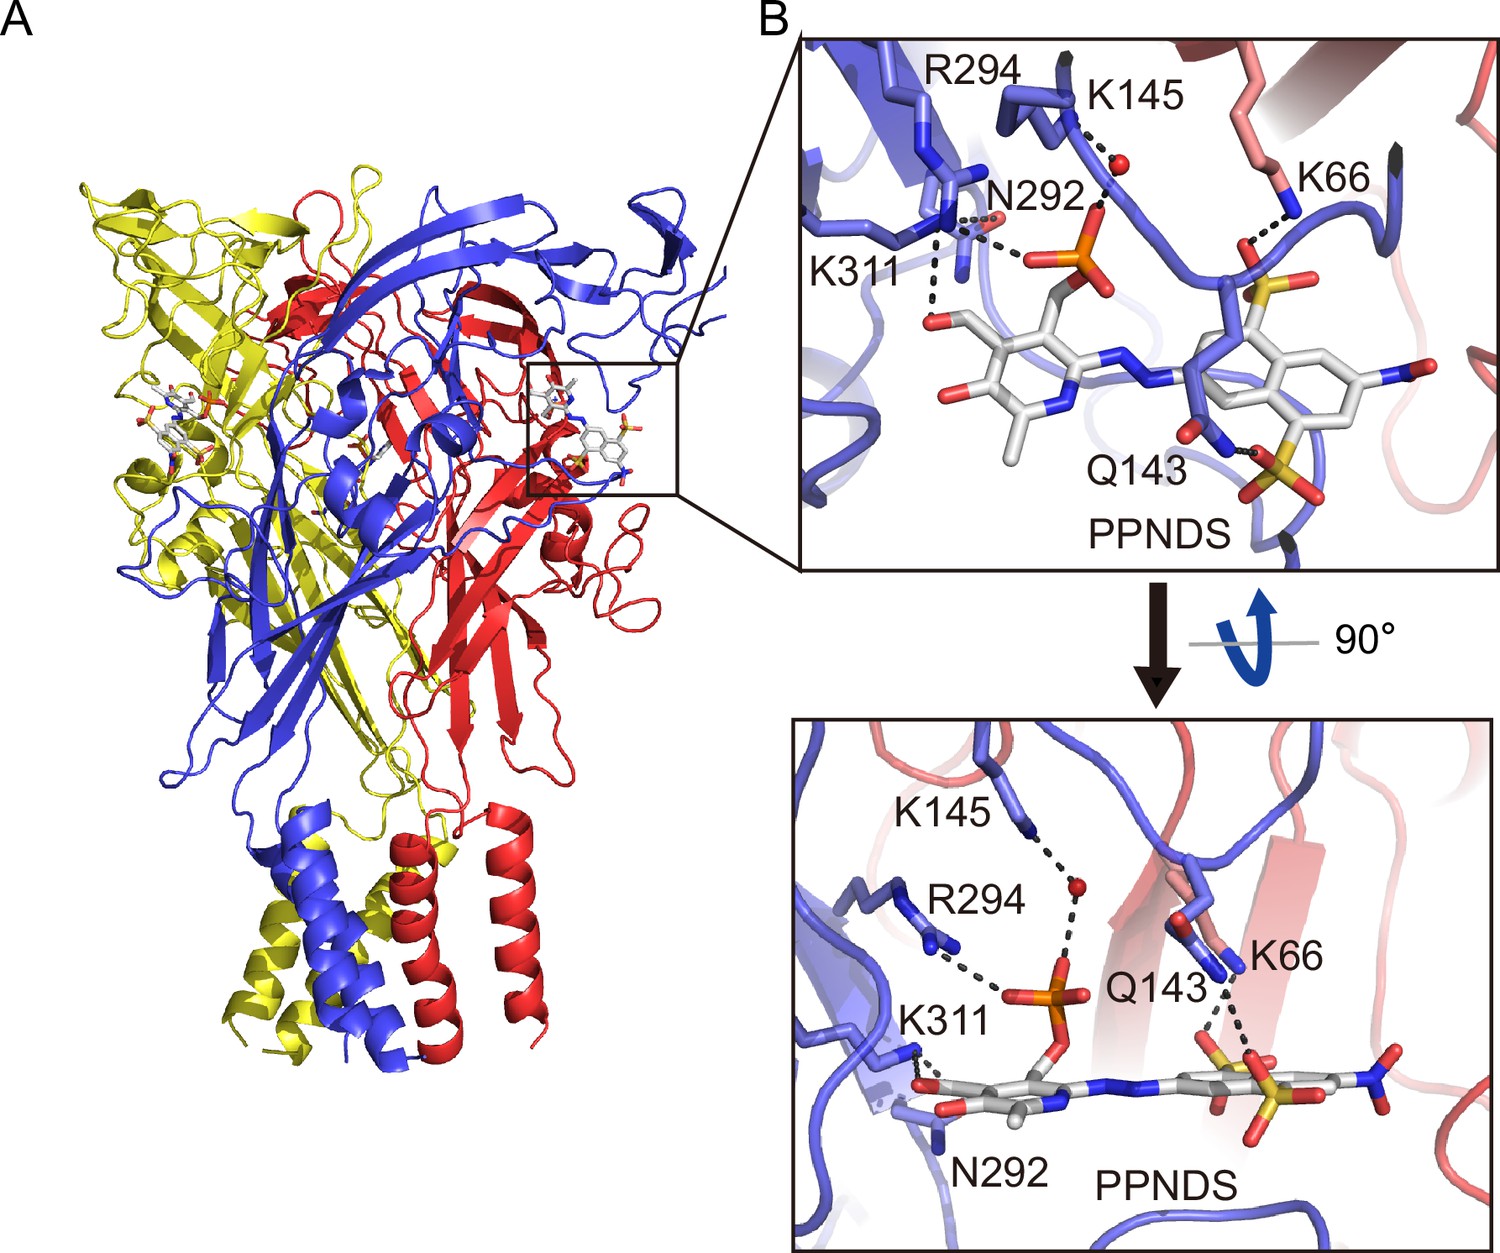
Binding site for pyridoxal-5'-phosphate-6-(2'-naphthylazo-6'-nitro-4',8'-disulfonate) (PPNDS).
(A, B) Overall structure (A) and close-up view of the PPNDS binding site (B) in the PPNDS-bound panda P2X7 (pdP2X7) structure. PPNDS molecules are shown by stick models. Water molecules are depicted as red spheres. Dotted black lines indicate hydrogen bonding.
Figure 2—figure supplement 1
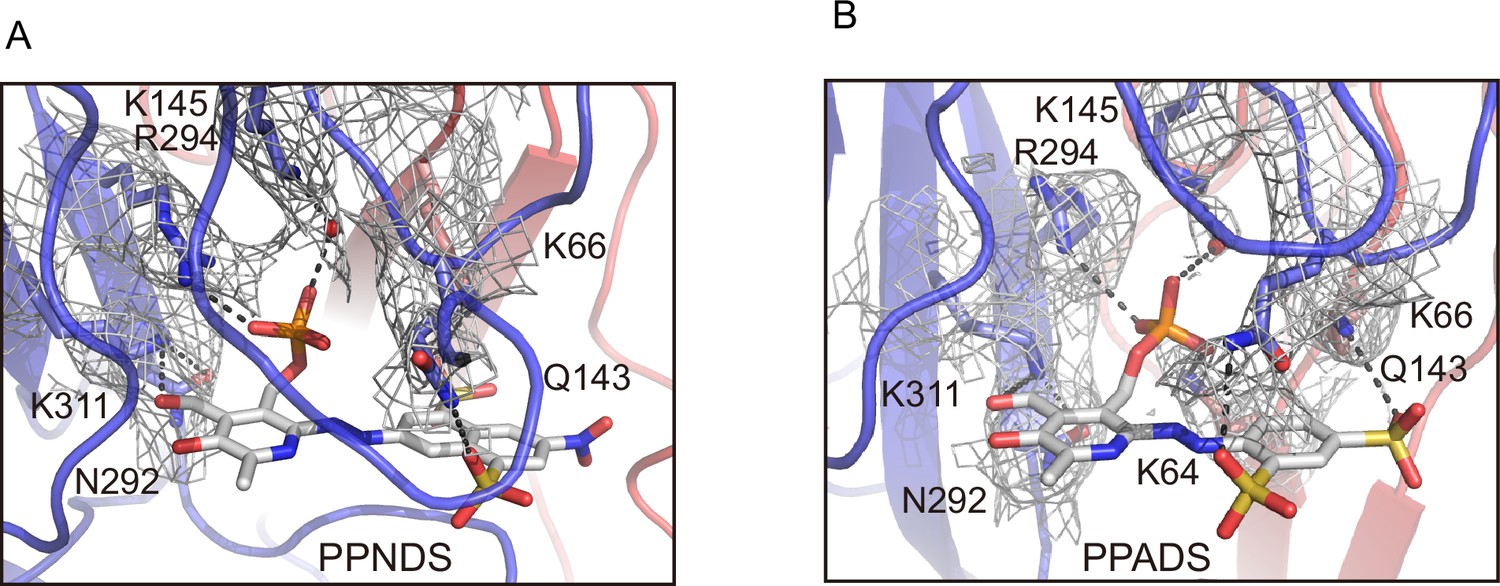
EM density maps for the pyridoxal-5'-phosphate-6-(2'-naphthylazo-6'-nitro-4',8'-disulfonate) (PPNDS) and pyridoxal phosphate-6-azophenyl-2′,5′-disulfonic acid (PPADS) binding sites.
(A, B) Close-up views of the PPNDS (A) and PPADS (B) binding sites. Dotted lines represent hydrogen bonds. The EM density maps for the residues involved in the PPNDS and PPADS interactions are shown and contoured at 5.0σ and 4.0σ, respectively.
Figure 2—figure supplement 2
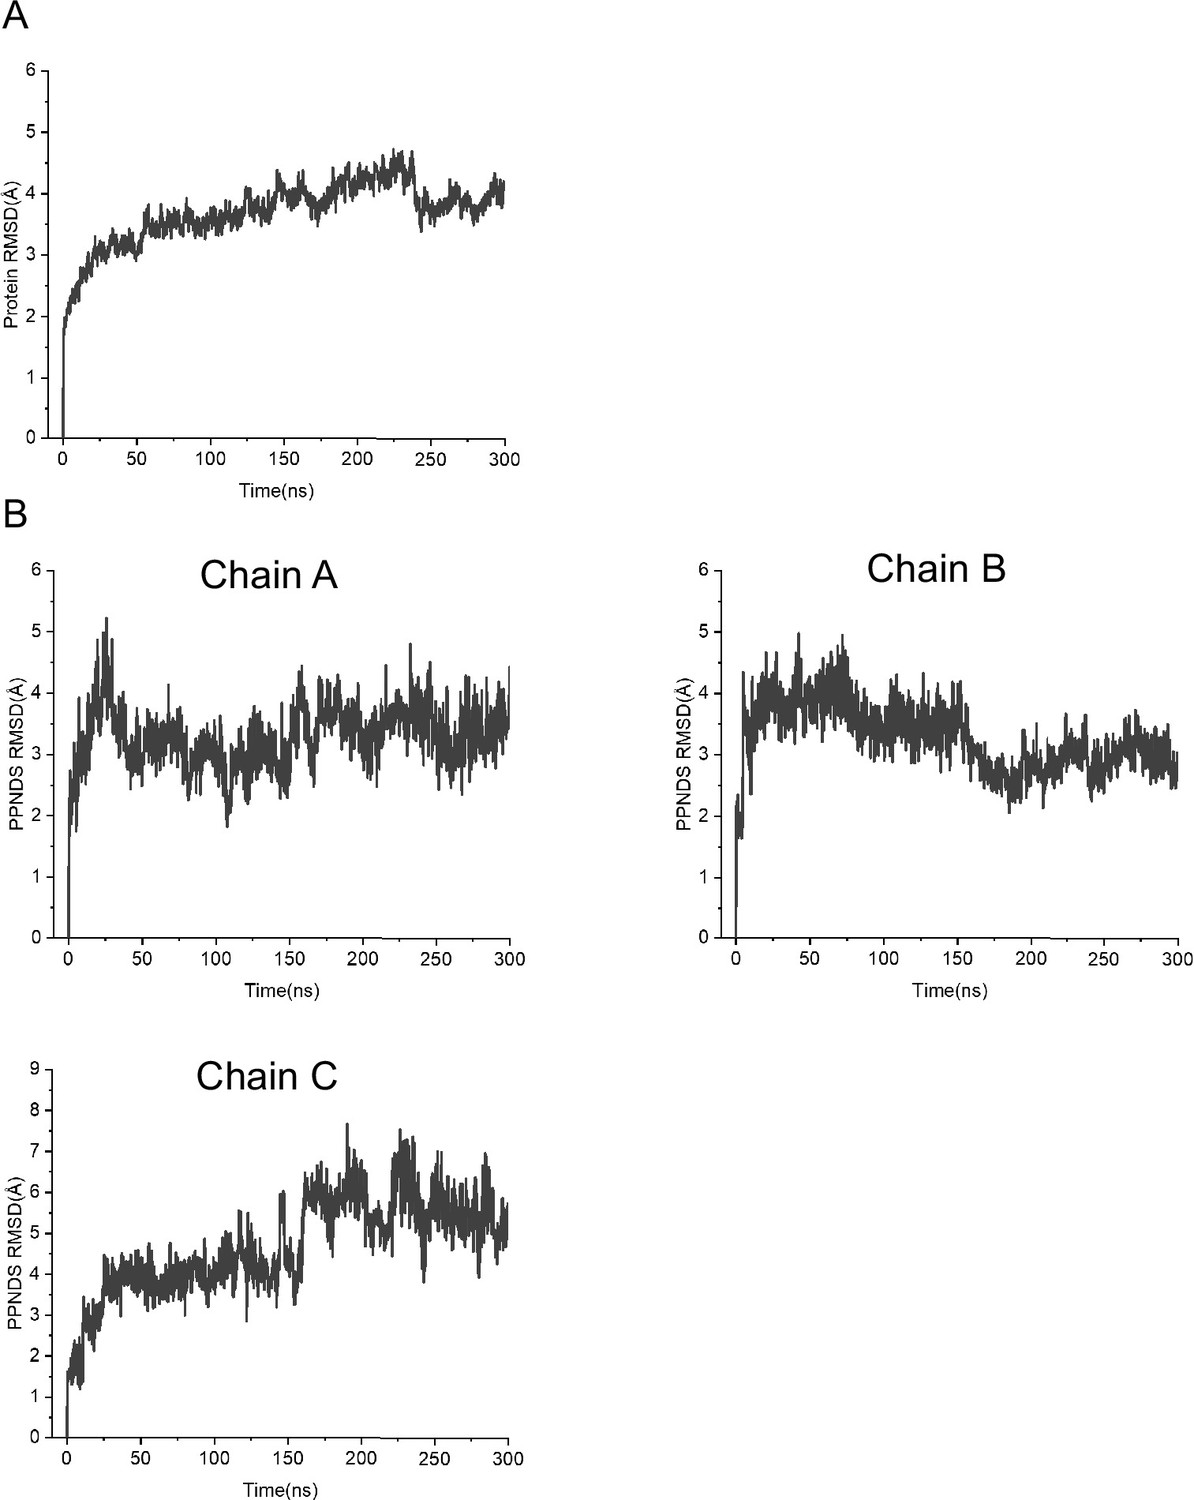
Molecular dynamics (MD) simulations of the pyridoxal-5'-phosphate-6-(2'-naphthylazo-6'-nitro-4',8'-disulfonate) (PPNDS)-bound panda P2X7 (pdP2X7) structure.
(A, B) The plots of the root mean square deviations (RMSD) of Cα atoms (A) and the RMSD values of atoms in PPNDS (B).
-
Figure 2—figure supplement 2—source data 1
Numerical data for Figure 2—figure supplement 2A, B.
- https://cdn.elifesciences.org/articles/92829/elife-92829-fig2-figsupp2-data1-v1.xlsx
Figure 3

Binding site for pyridoxal phosphate-6-azophenyl-2′,5′-disulfonic acid (PPADS).
(A, B) Overall structure (A) and close-up view of the PPADS binding site (B) in the PPADS-bound panda P2X7 (pdP2X7) structure. PPADS molecules are shown by stick models. Water molecules are depicted as red spheres. Dotted black lines indicate hydrogen bonding.
Figure 4
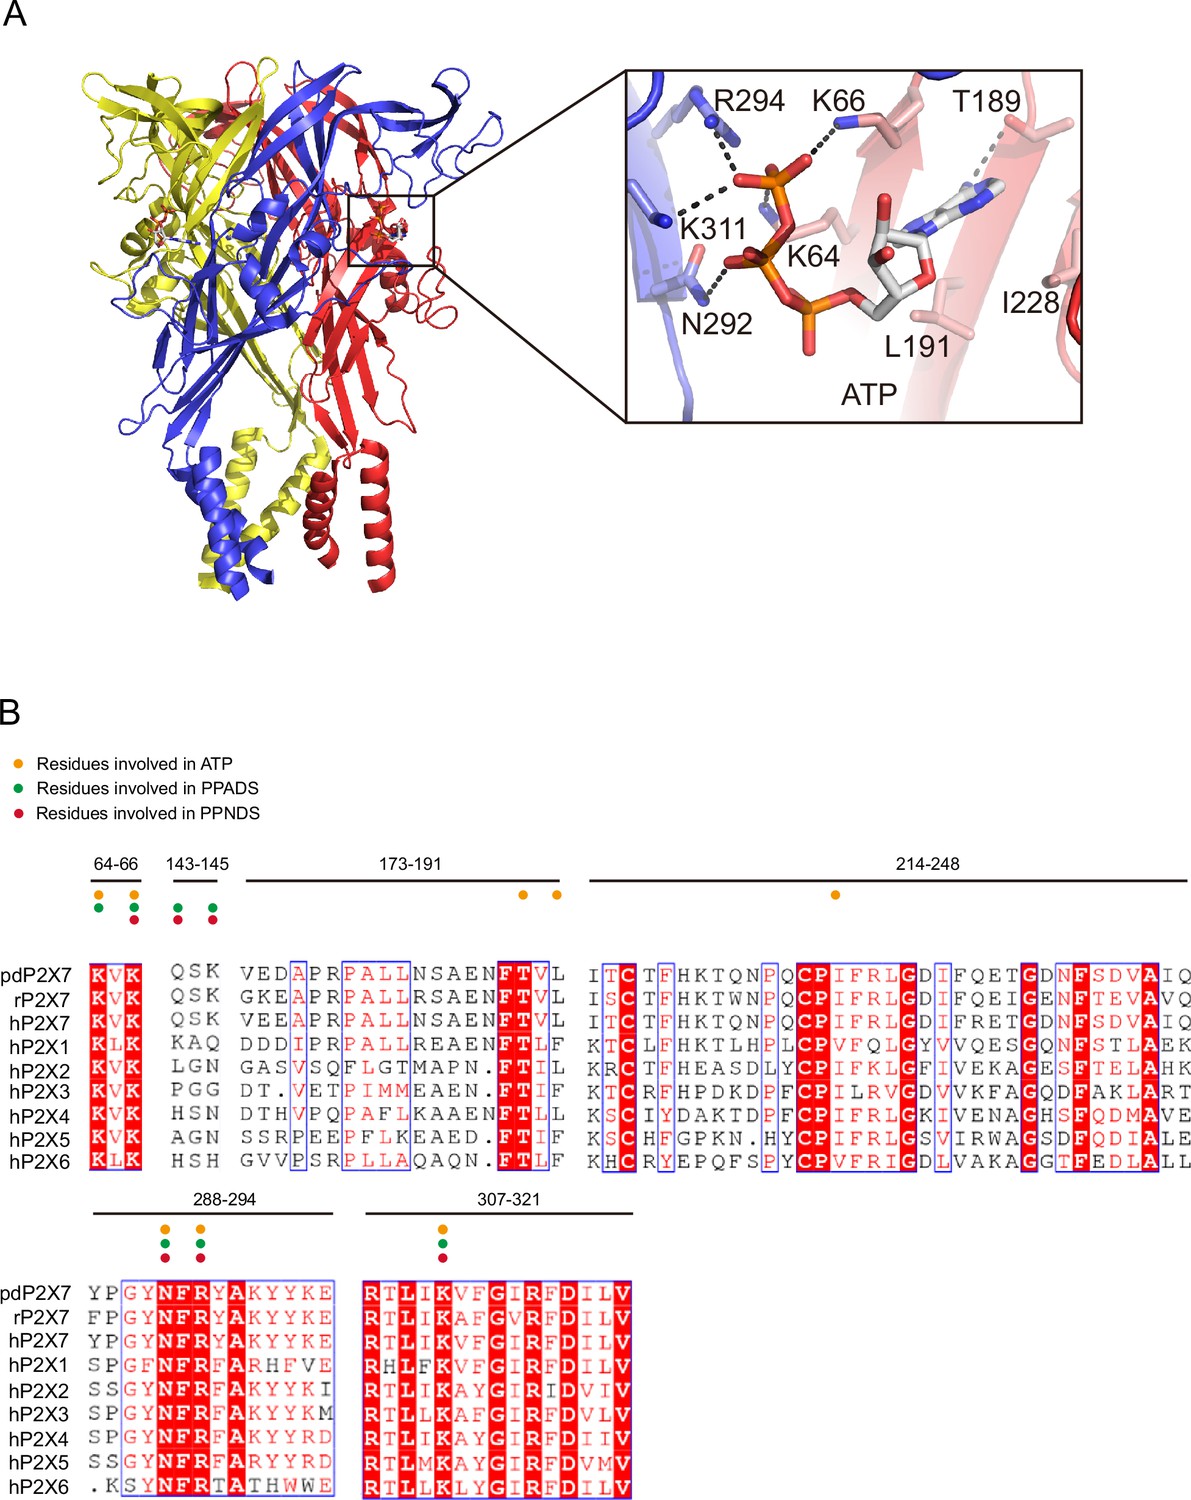
ATP-binding site and sequence comparison.
(A) Overall structure and close-up view of the ATP-bound rat P2X7 structure (PDB ID: 6U9W). The cytoplasmic domain is not shown. Dotted black lines indicate hydrogen bonding. (B) Sequence alignment of A. melanoleuca P2X7 (pdP2X7) (accession number: XP_002913164.3), Rattus norvegicus (rP2X7) (accession number: Q64663.1), and Homo sapiens P2X receptors (P2X1: P51575.1, P2X2: Q9UBL9.1, P2X3: P56373.2, P2X4: Q99571.2, P2X5: Q93086.4, P2X6: O15547.2, and P2X7: Q99572.4). Orange, green, and red circles indicate the residues involved in ATP, PPADS, and PPNDS recognition.
Figure 5
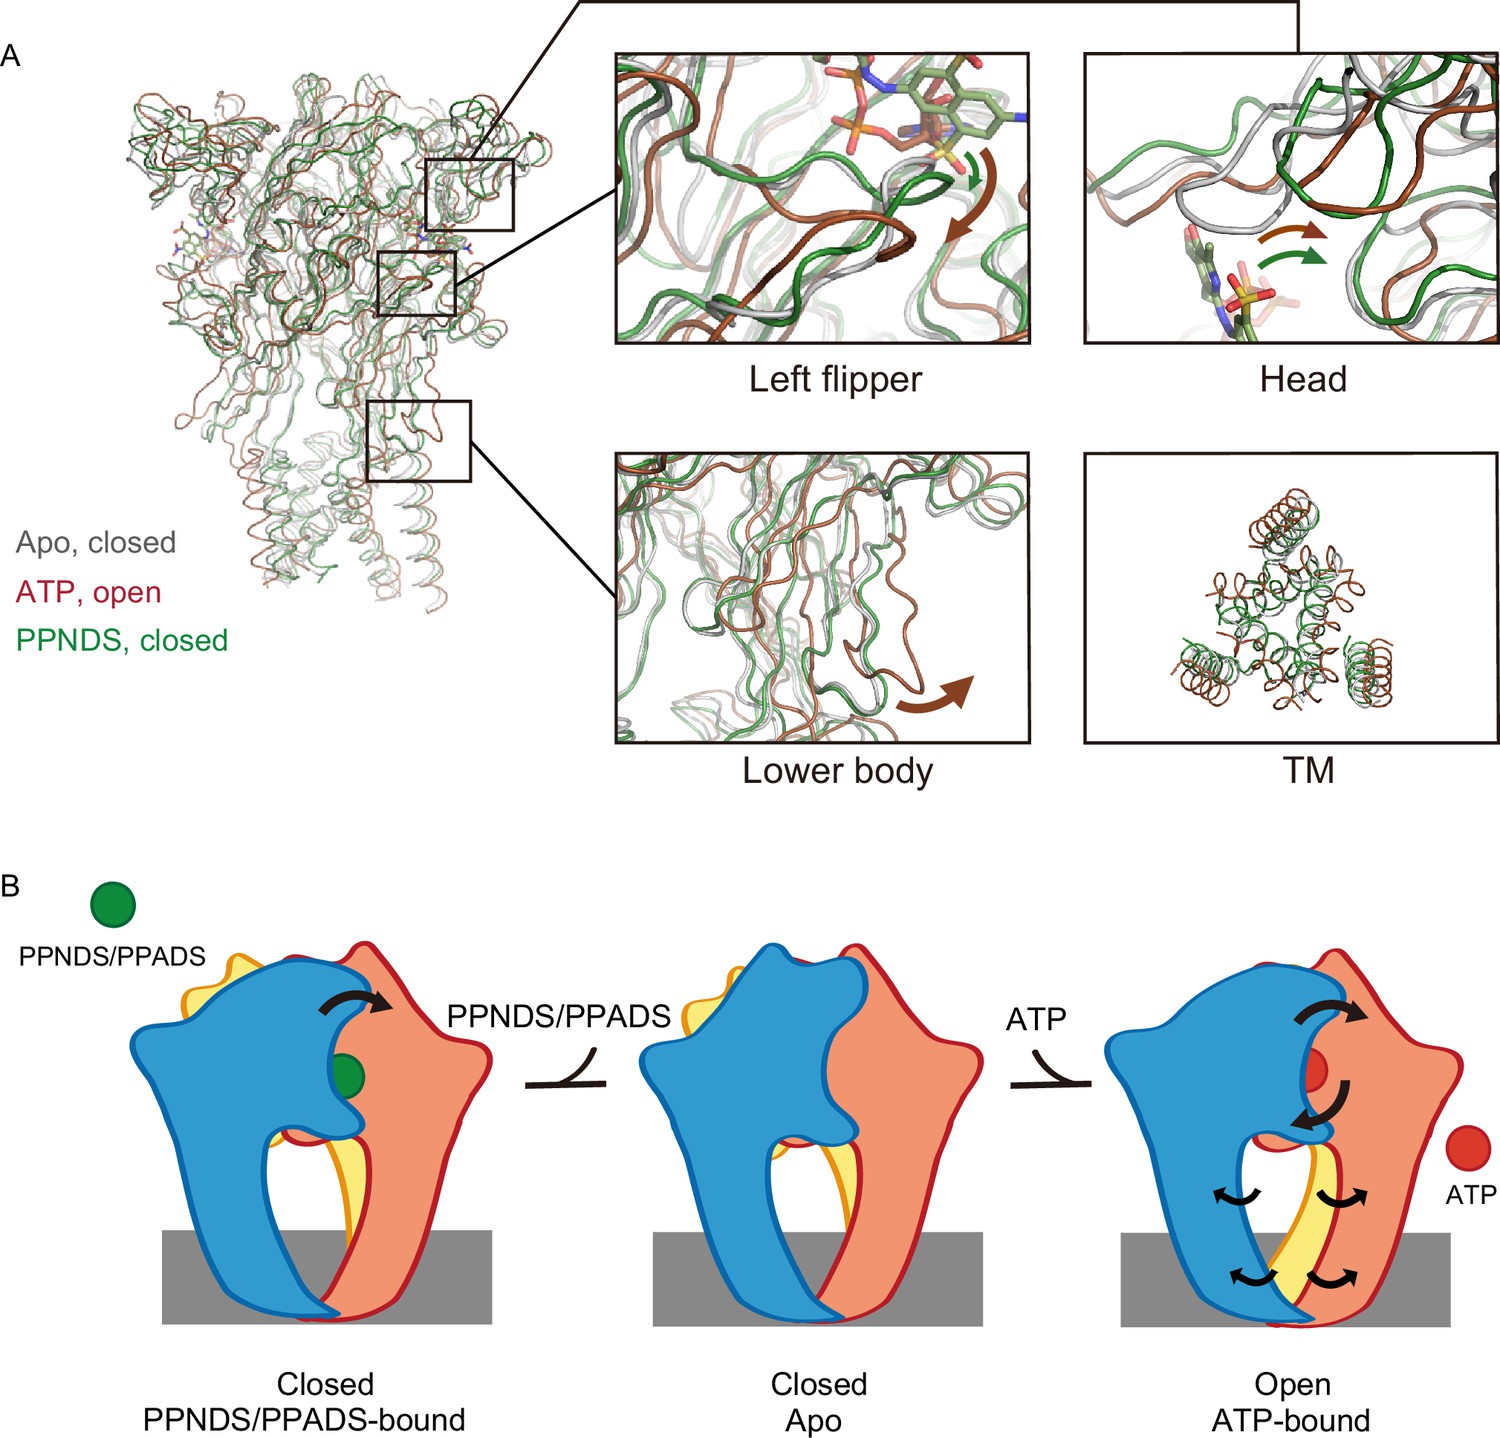
Structural comparison and inhibition mechanism.
(A) Superposition of the ATP-bound rP2X7 structure (red, PDB ID: 6U9W) and the pyridoxal-5'-phosphate-6-(2'-naphthylazo-6'-nitro-4',8'-disulfonate) (PPNDS)-bound panda P2X7 (pdP2X7) structure (green, this study) onto the apo rP2X7 structure (gray, PDB ID: 6U9V). Close-up views of the head, left flipper, and lower body domains and the intracellular view of the transmembrane (TM) domain are shown in each box. Arrows indicate the conformational changes from the apo- to ATP-bound states (red) and from the apo- to the PPNDS-bound states (green). (B) A cartoon model of the PPNDS/pyridoxal phosphate-6-azophenyl-2′,5′-disulfonic acid (PPADS)-dependent inhibition and ATP-dependent activation mechanisms.
Figure 6 with 1 supplement
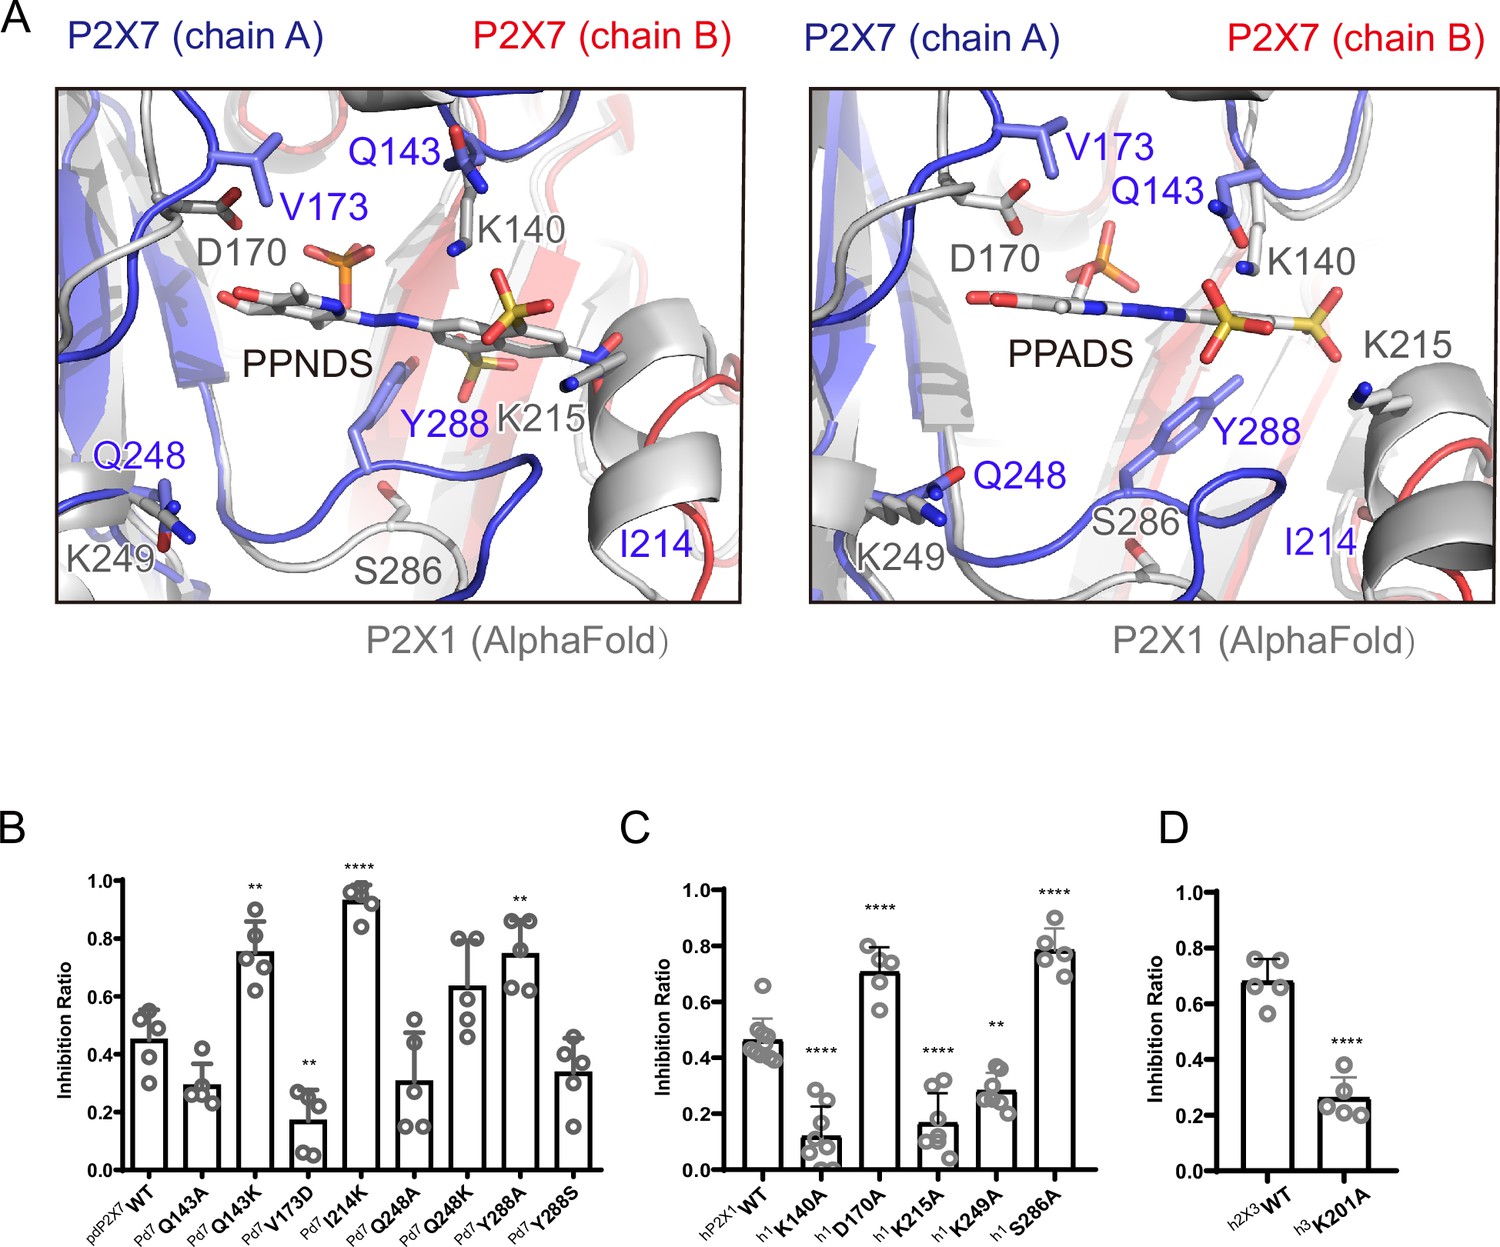
Structure-based mutational analysis.
(A) Superimposition of the pyridoxal-5'-phosphate-6-(2'-naphthylazo-6'-nitro-4',8'-disulfonate) (PPNDS)-bound and pyridoxal phosphate-6-azophenyl-2′,5′-disulfonic acid (PPADS)-bound structures in this study onto the predicted human P2X1 (hP2X1) structure (AlphaFold). Each subunit of the PPNDS-bound and PPADS-bound structures is shown in blue, yellow, and red, while the predicted hP2X1 structure is shown in gray. The PPNDS and PPADS molecules and the residues surrounding PPNDS and PPADS that are different between panda P2X7 (pdP2X7) and hP2X1 are shown as sticks. (B) Effects of PPNDS (10 µM) on ATP (1 mM)-evoked currents of pdP2X7 and its mutants (mean ± SD, n=5, one-way ANOVA post hoc test, **: p<0.01, ****: p<0.0001 vs. WT). (C) Effects of PPNDS (1 µM) on ATP (1 µM)-evoked currents of hP2X1 and its mutants (mean ± SD, n=5–10, one-way ANOVA post hoc test, **: p<0.01, ****: p<0.0001 vs. WT). (D) Effects of PPNDS (10 µM) on ATP (1 µM)-evoked currents of hP2X3 and its mutants (mean ± SD, n=5, unpaired t test, ****: p<0.0001 vs. WT).
-
Figure 6—source data 1
Numerical data for Figure 6B–D.
- https://cdn.elifesciences.org/articles/92829/elife-92829-fig6-data1-v1.xlsx
Figure 6—figure supplement 1
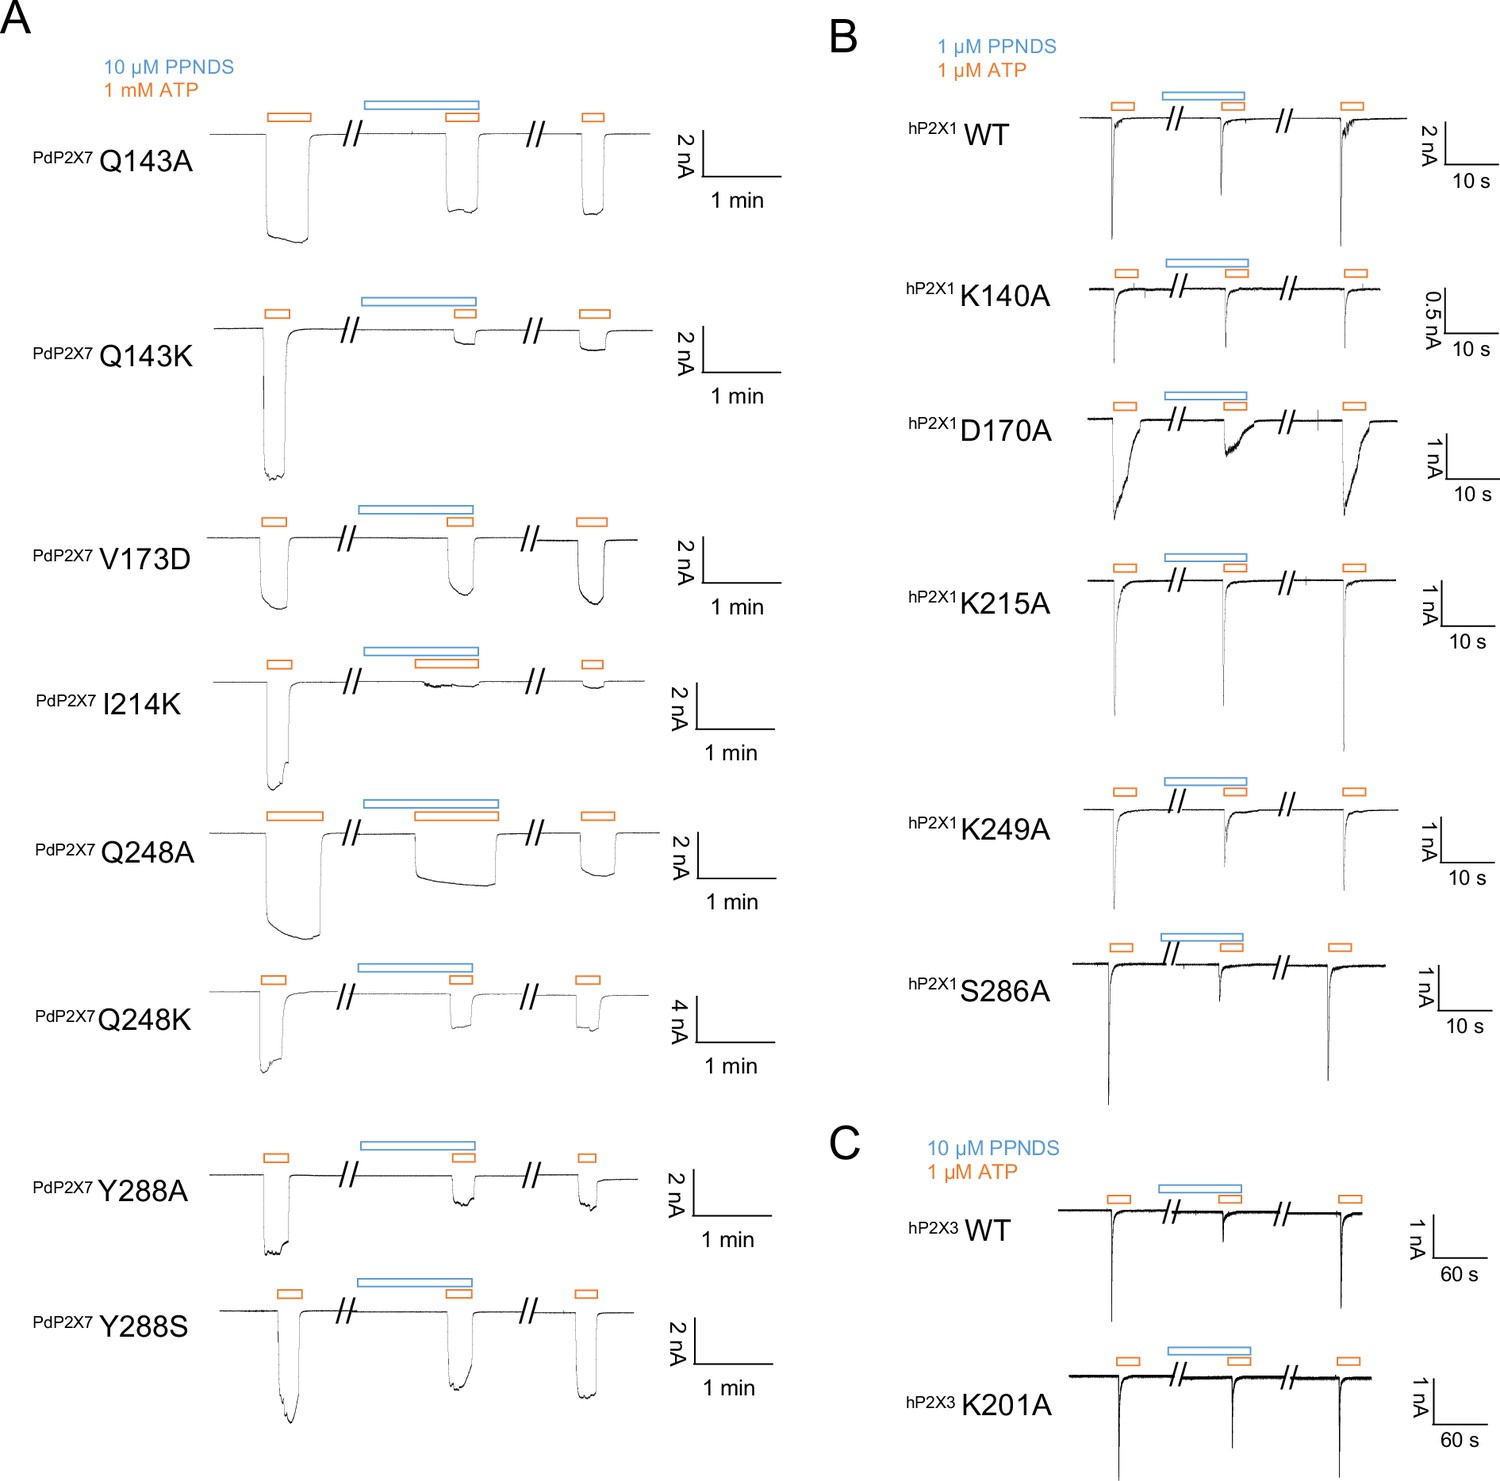
Effects of pyridoxal-5'-phosphate-6-(2'-naphthylazo-6'-nitro-4',8'-disulfonate) (PPNDS) on P2X receptors by patch-clamp recording.
(A–C) Representative current traces from patch-clamp recordings of P2X receptors. Effects of 10 µM PPNDS (blue) on the 1 mM ATP-evoked (orange) current of panda P2X7 (pdP2X7) mutants (A). Effects of 1 µM PPNDS (blue) on the 1 µM ATP-evoked (orange) current of human P2X1 (hP2X1) (B). Effects of 10 µM PPNDS (blue) on the 1 µM ATP-evoked (orange) current of hP2X3 (C).
Author response image 1
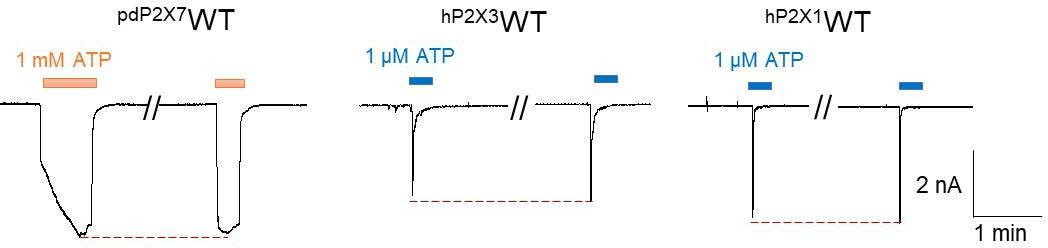
Representative current traces of pdP2X7, hP2X3, and hP2X1 after repeated applications of ATP.
The pdP2X7 currents were recorded using the whole-cell configuration, and the hP2X1 and hP2X3 currents were recorded using perforated patches.
Tables
Table 1
Cryogenic electron microscopy (cryo-EM) data collection, refinement, and validation statistics.
| PdP2X7 w. PPNDS (EMD-36671) (PDB: 8JV8) | PdP2X7 w. PPADS (EMD-36670) (PDB: 8JV7) | |
|---|---|---|
| Data collection and processing | ||
| Magnification | ×29,000 | ×29,000 |
| Voltage (kV) | 300 | 300 |
| Electron exposure (e–/Å2) | 50 | 50 |
| Defocus range (μm) | –1.3 to –2.0 | –1.3 to –2.0 |
| Pixel size (Å) | 0.83 | 0.83 |
| Symmetry imposed | C3 | C3 |
| Initial particle images (no.) | 663,674 | 236,753 |
| Final particle images (no.) | 121,008 | 161,188 |
| Map resolution (Å) | 3.34 | 3.60 |
| FSC threshold | 0.143 | 0.143 |
| Map resolution range (Å) | 1.9–40.4 | 2.2–10.2 |
| Refinement | ||
| Initial model used (PDB code) | This study | This study |
| Model resolution (Å) | 3.34 | 3.60 |
| FSC threshold | 0.143 | 0.143 |
| Model resolution range (Å) | 1.9–40.4 | 2.2–10.2 |
| Map sharpening B factor (Å2) | –50 | –150 |
| Model composition | ||
| Non-hydrogen atoms | 7245 | 7245 |
| Protein residues | 963 | 960 |
| Ligands | NAG:6, PPNDS:3 | NAG:6, PPADS:3 |
| B factors (Å2) | ||
| Protein | 148.30 | 117.36 |
| Ligand | 189.65 | 146.40 |
| R.m.s. deviations | ||
| Bond lengths (Å) | 0.014 | 0.003 |
| Bond angles (°) | 1.257 | 0.561 |
| Validation | ||
| MolProbity score | 2.51 | 1.70 |
| Clashscore | 13.86 | 9.04 |
| Poor rotamers (%) | 3.70 | 1.22 |
| Ramachandran plot | ||
| Favored (%) | 93.50 | 97.17 |
| Allowed (%) | 6.39 | 2.83 |
| Disallowed (%) | 0.1 | 0 |
Additional files
Download links
A two-part list of links to download the article, or parts of the article, in various formats.
Downloads (link to download the article as PDF)
Open citations (links to open the citations from this article in various online reference manager services)
Cite this article (links to download the citations from this article in formats compatible with various reference manager tools)
Structural insights into the orthosteric inhibition of P2X receptors by non-ATP analog antagonists
eLife 12:RP92829.
https://doi.org/10.7554/eLife.92829.3


