Tumor purity-related genes for predicting the prognosis and drug sensitivity of DLBCL patients
- Department of Pathology, National Cancer Center/National Clinical Research Center for Cancer/Cancer Hospital, Chinese Academy of Medical Sciences and Peking Union Medical College, China
- Department of Hepatobiliary Surgery, National Cancer Center/National Clinical Research Center for Cancer/Cancer Hospital, Chinese Academy of Medical Sciences and Peking Union Medical College, China
- Department of Pathology, National Cancer Center/National Clinical Research Center for Cancer/Cancer Hospital & Shenzhen Hospital, Chinese Academy of Medical Sciences and Peking Union Medical College, China
Figures
Figure 1
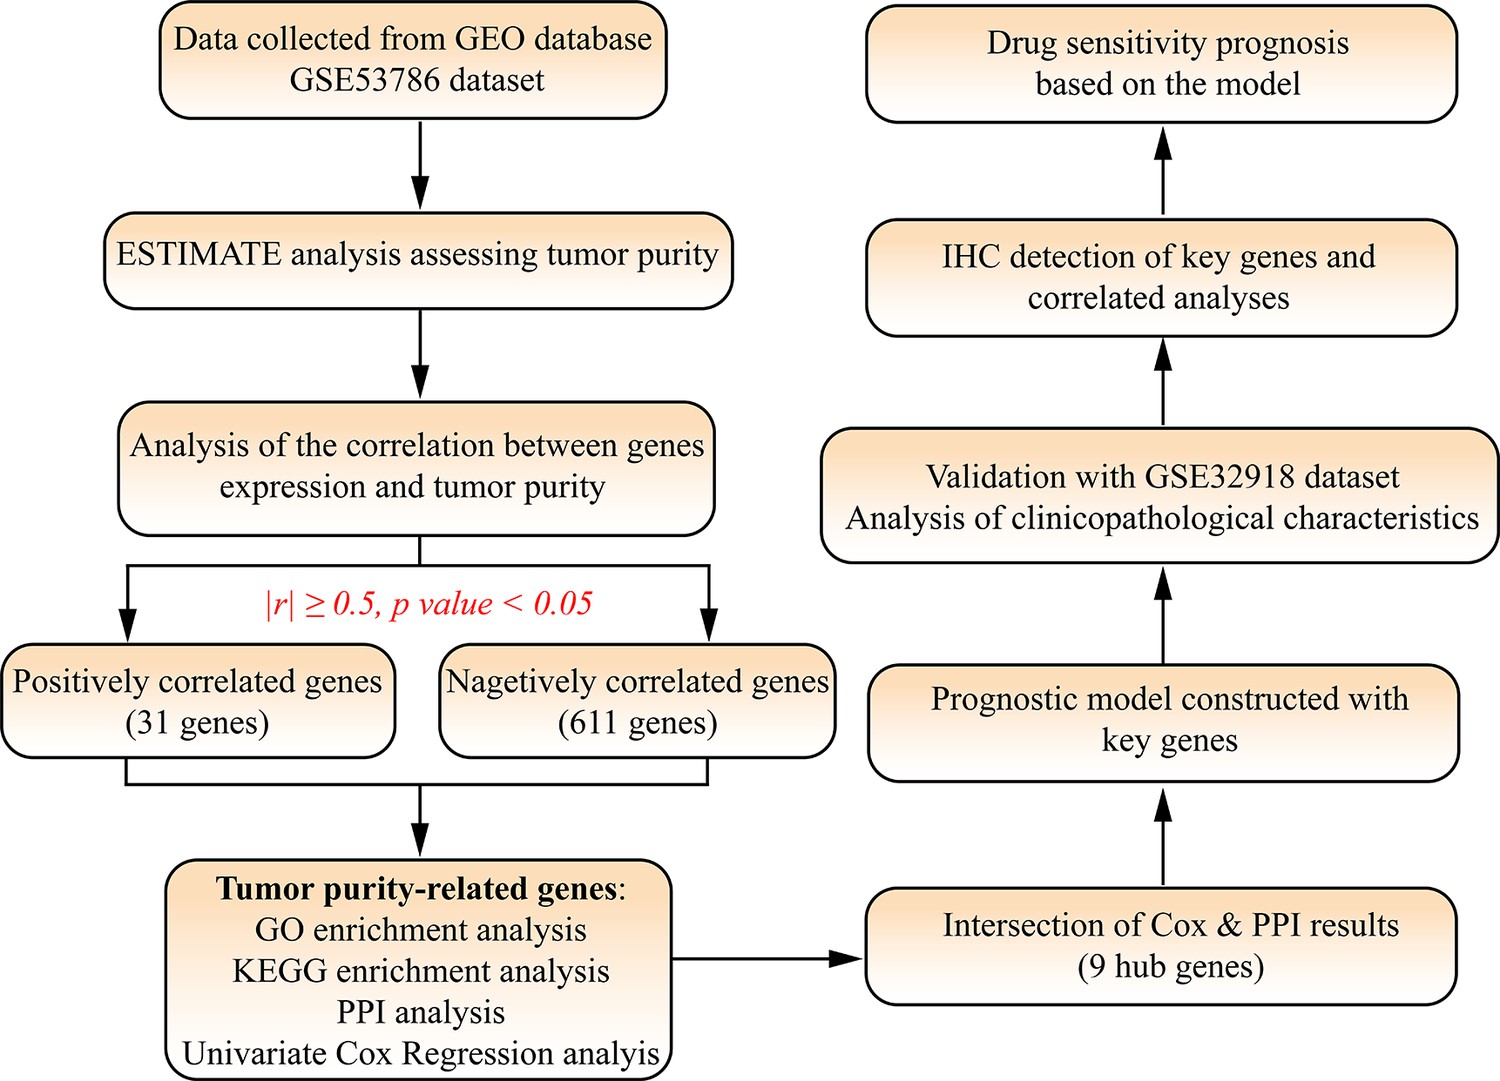
Flow chart and study design of this research.
Figure 2
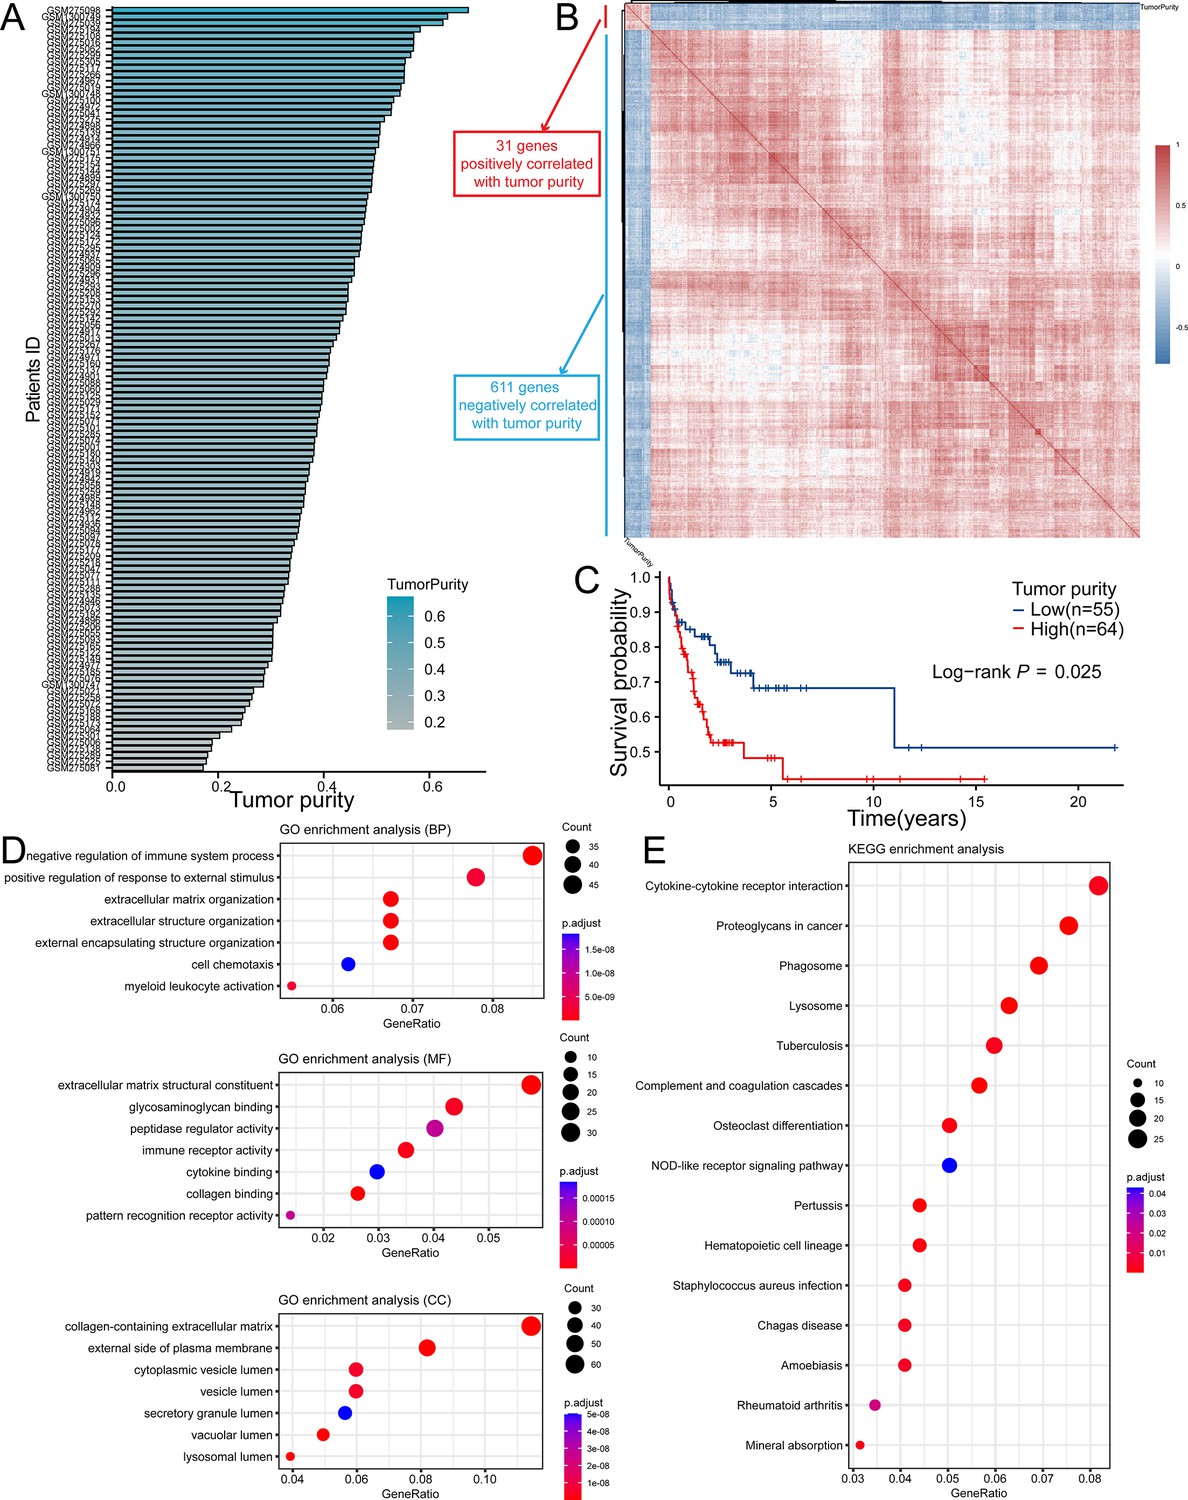
TPGs were screened out with GSE53786 dataset.
(A) The range (17.2–67.4%) of tumor purity of samples in GSE53786. (B) The heatmap shows genes defined as TPGs. (C) The K–M curve showed high tumor purity was correlated with poor prognosis in DLBCL patients in GSE53678 dataset (Patients were divided into two groups according to the best-cutoff provided by ‘survminer’ package in R). (D) GO analysis of TPGs. (E) KEGG analysis of TPGs. TPGs, tumor purity-related genes; K–M, Kaplan-Meier; DLBCL, diffuse large B cell lymphoma; GO, gene ontology; KEGG, Kyoto Encyclopedia of Genes and Genomes.
Figure 3
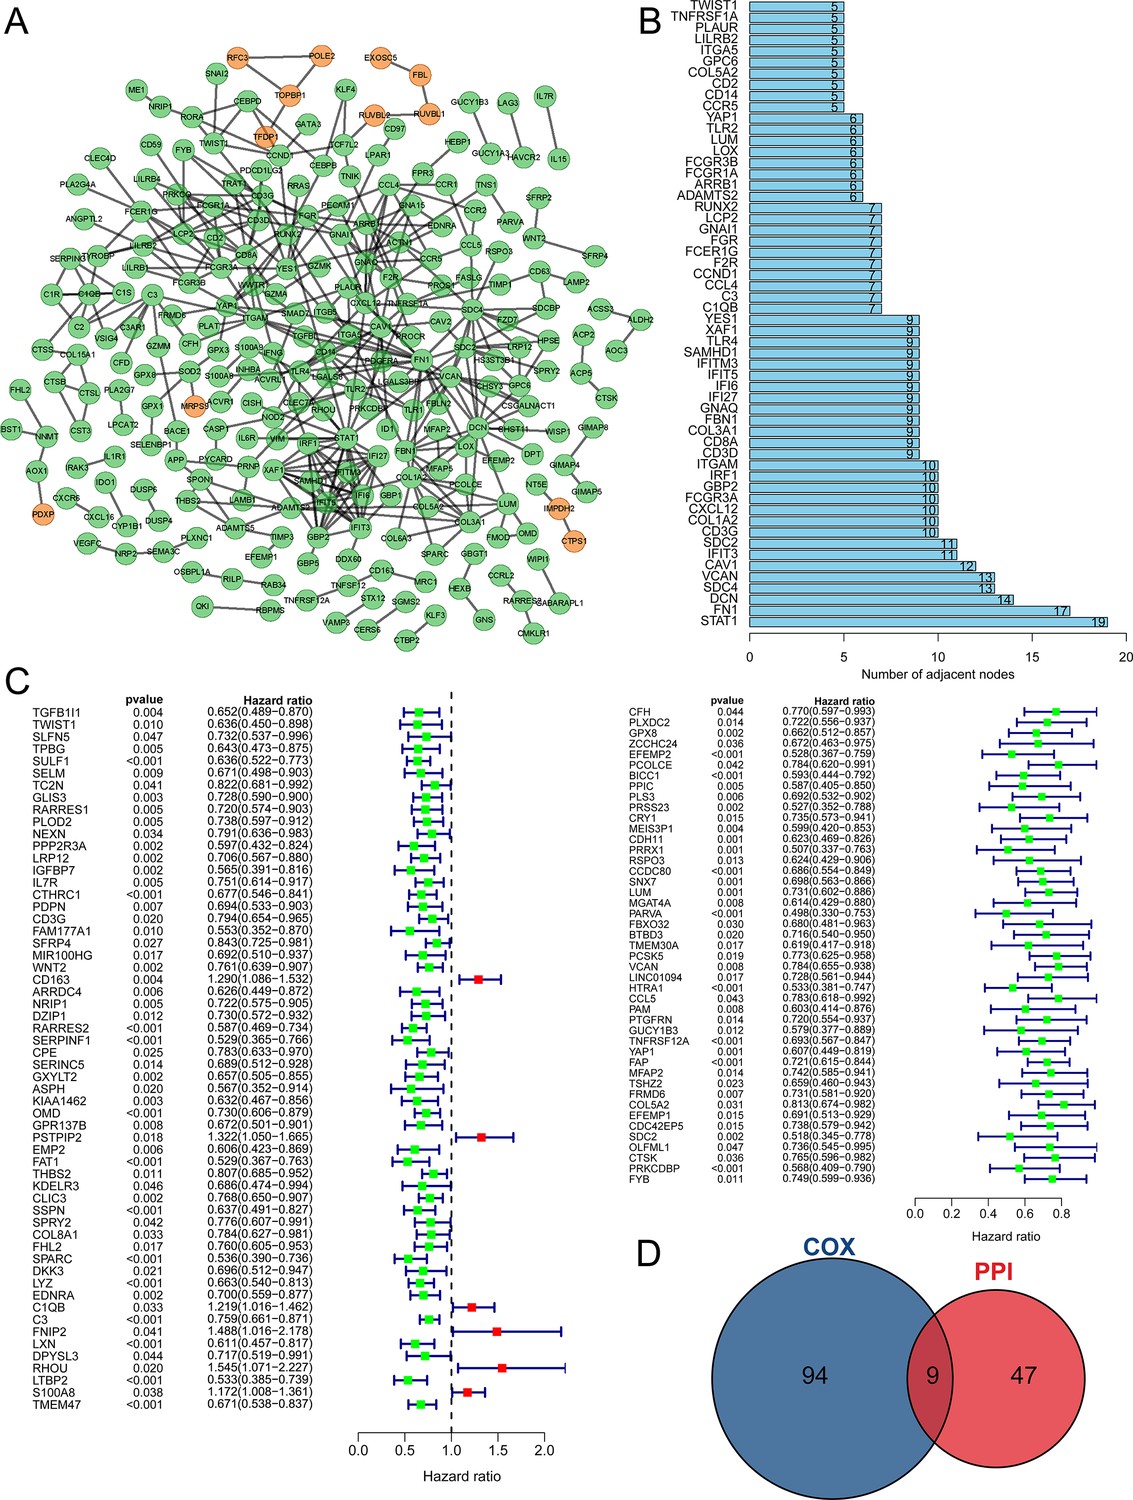
The key gene candidates used for constructing prognostic model were selected.
(A) The PPI network of tumor purity-related genes (TPGs) (orange nodes representing genes positively correlated with tumor purity, and green nodes representing genes negatively correlated with tumor purity). (B) The barplot shows hub genes with five or more interactive genes. (C) The forest plot showing prognostic TPGs of diffuse large B-cell lymphoma (DLBCL) patients in GSE53786. (D) The Venn plot shows intersection genes of PPI hub gene and prognostic TPGs. PPI, protein-protein interaction.
Figure 4
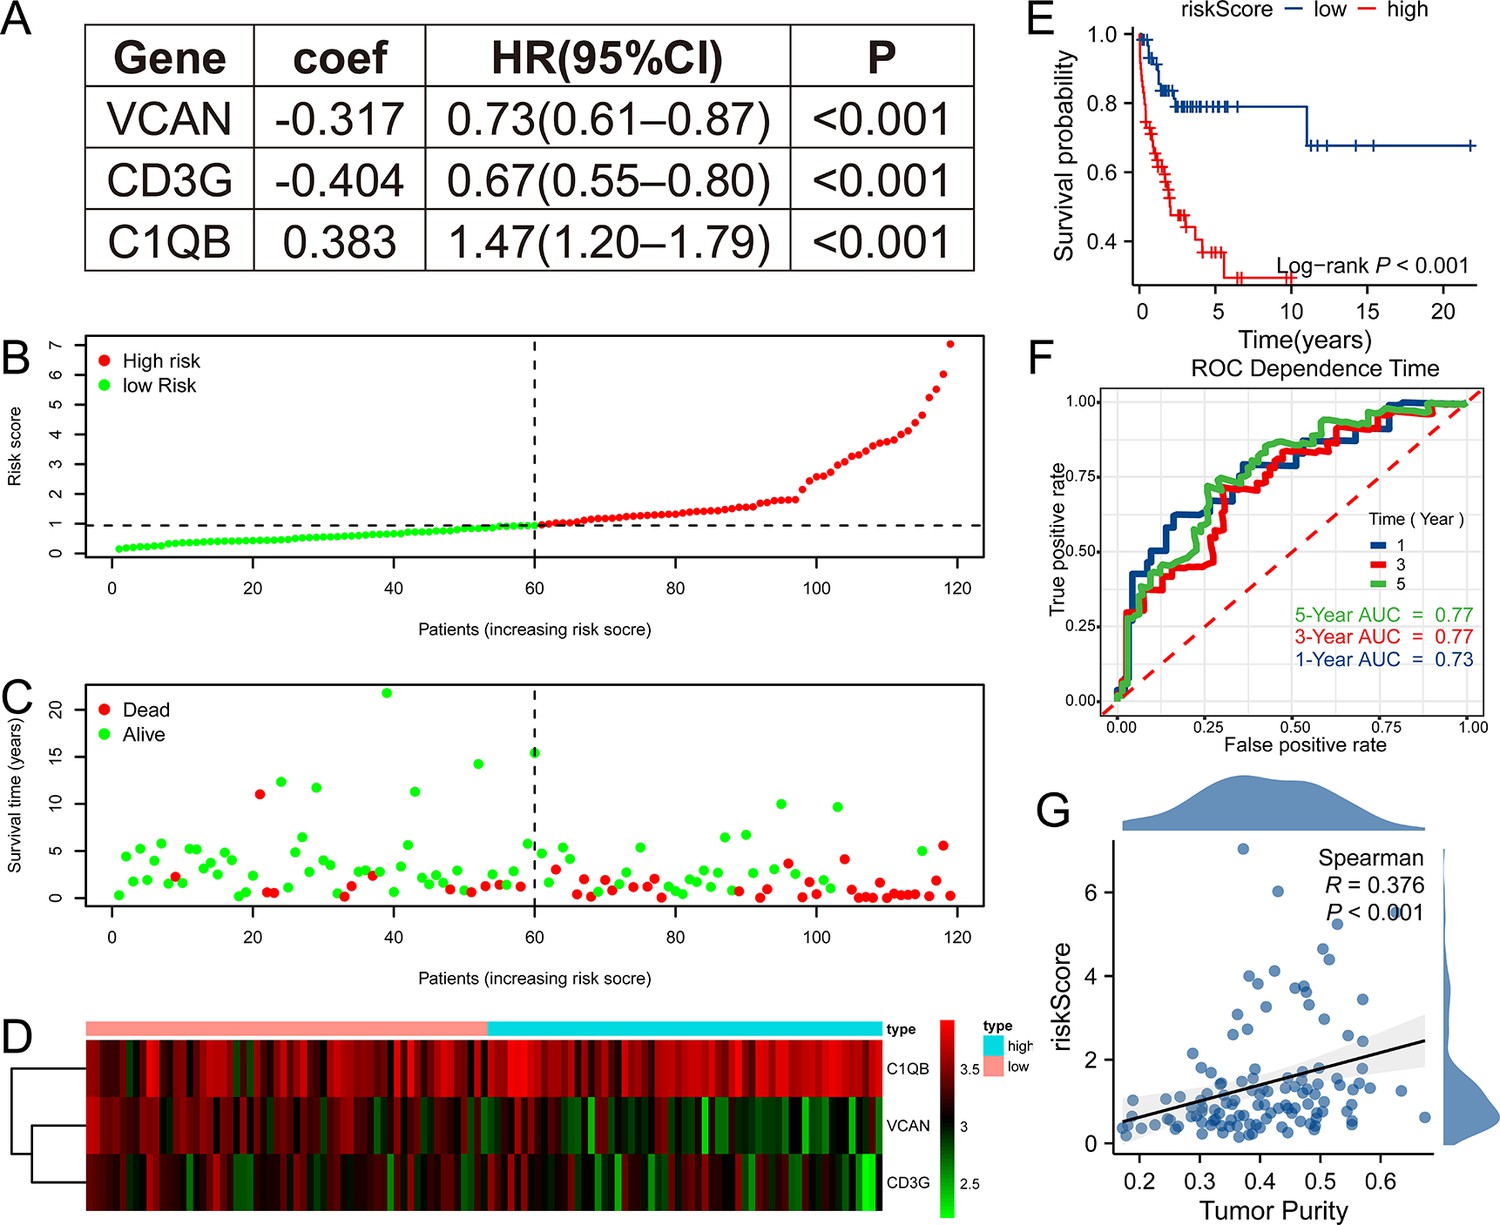
Tumor purity-related genes (TPGs) signature prognostic model was constructed.
(A) Three genes enrolled in the prognostic model. (B) The patients in GSE53786 dataset were divided into high (n = 59) and low-risk (n = 60) group according to the median riskScore based on the prognostic model. (C) High-risk group had worse prognosis than low-risk group. (D) The heatmap shows the expression discrepancy of the three genes. (E) Survival analysis revealed that high-risk group had poor prognosis in GSE53786 dataset. (n low = 60, n high = 59). (F) The ROC curve showed that the prognostic model performed well in predicting 1 year, 3 year, and 5 year prognosis in GSE53786 dataset. (G) Tumor purity was positively correlated with riskScore in GSE53786 dataset. ROC, receiver operating characteristic.
Figure 5 with 1 supplement
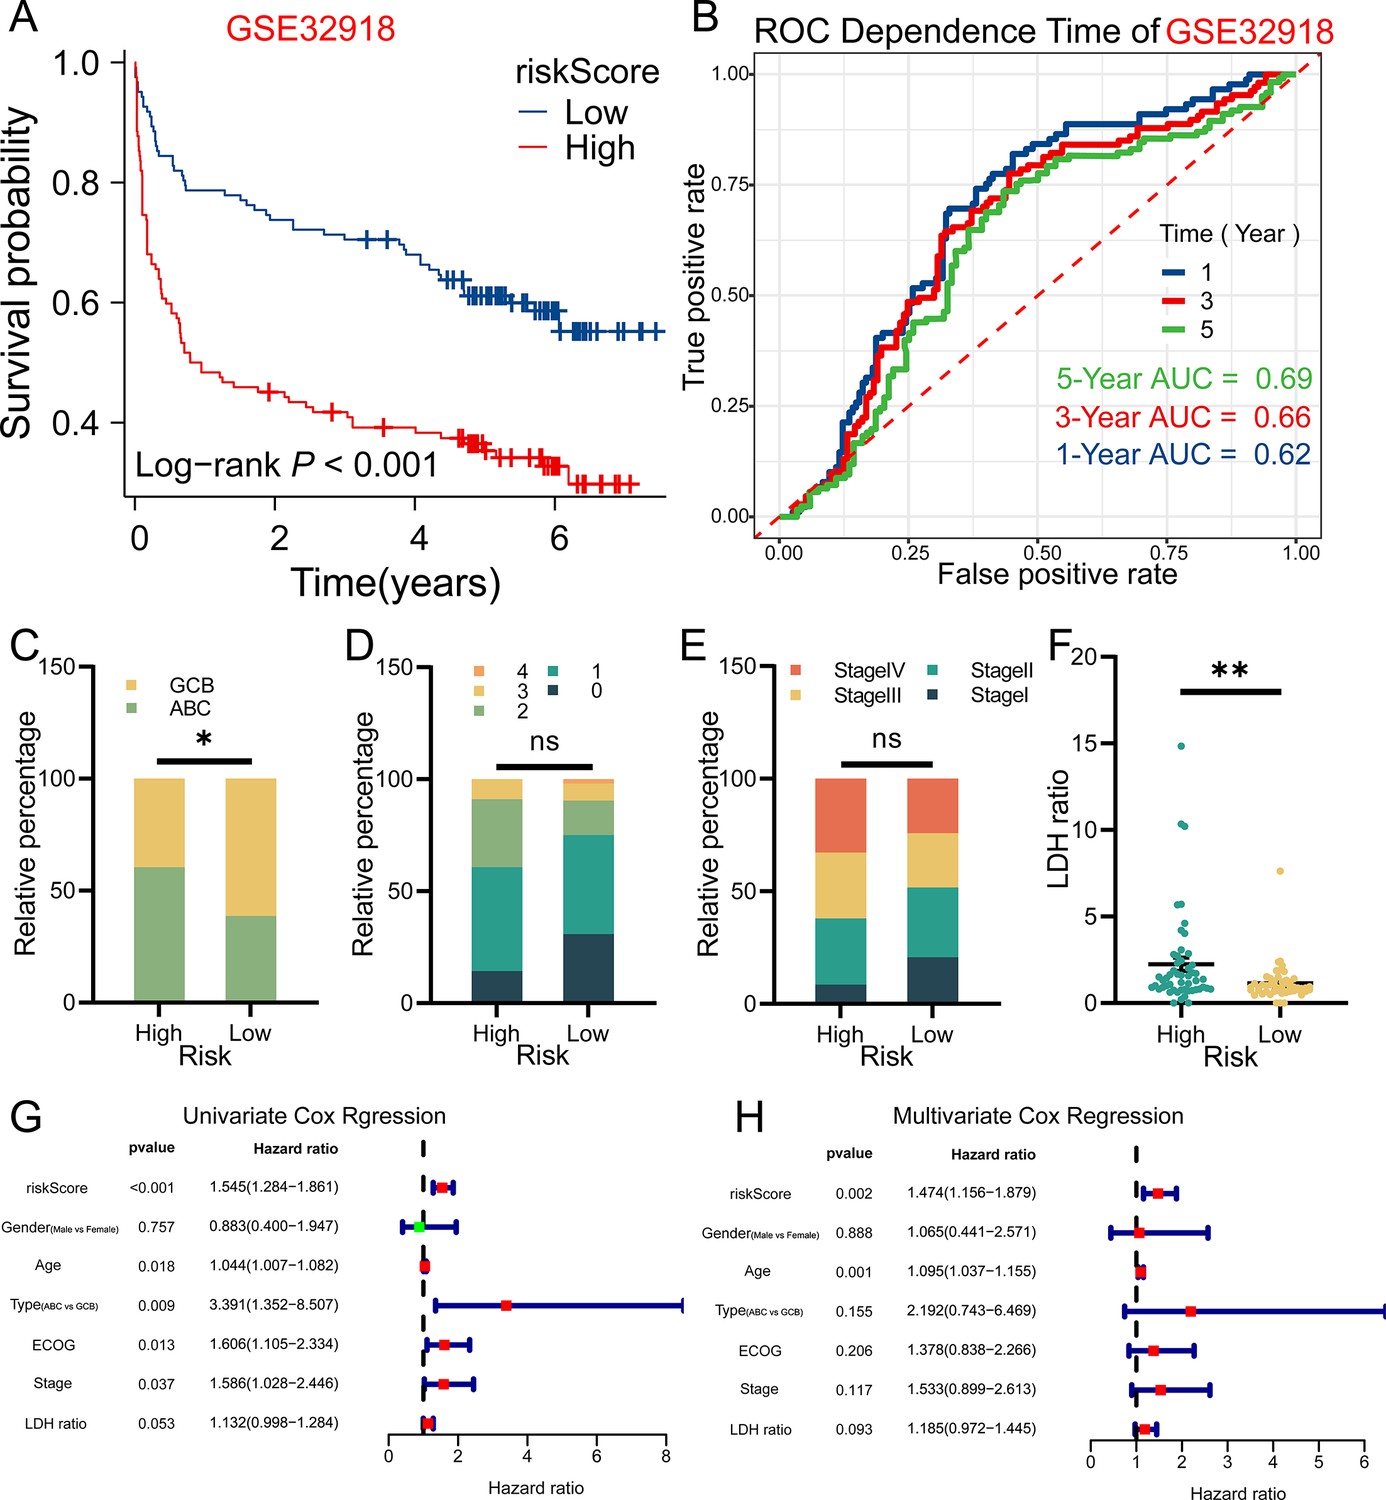
The riskScore of three tumor purity-related genes (TPGs) signature prognostic model was an independent prognostic factor in diffuse large B-cell lymphoma (DLBCL) patients.
(A) Survival analysis results in GSE32918 dataset was consistent to that of GSE53786 dataset (n Low = 124, n High = 125). (B) The prognostic model also did well in GSE32918 dataset. (C) High-risk group in GSE53786 dataset contained more ABC-type DLBCL, while low-risk group contained more GCB-type DLBCL (χ2 test). (D) The ECOG performance of two groups (GSE53786 dataset) showed no statistical difference (χ2 test). (E) More patients in high-risk group were at Stage III or Stage IV, and less patients were at Stage I, compared with low-risk group, although no statistical significance was shown (GSE53786 dataset) (χ2 test). (F) High-risk group had higher LDH ratio (GSE53786 dataset) (Wilcoxon rank sum test, data are shown as mean ± SEM). (G) The riskScore was associated with poor prognosis of DLBCL patients in GSE53786 dataset. (H) The riskSocre was an independent prognostic factor for DLBCL patients. *p<0.05, **p<0.01, ns, not significant. ABC, activated B cell; GCB, germinal center B cell; ECOG, Eastern Cooperative Oncology Group; LDH, lactic dehydrogenase.
Figure 5—figure supplement 1
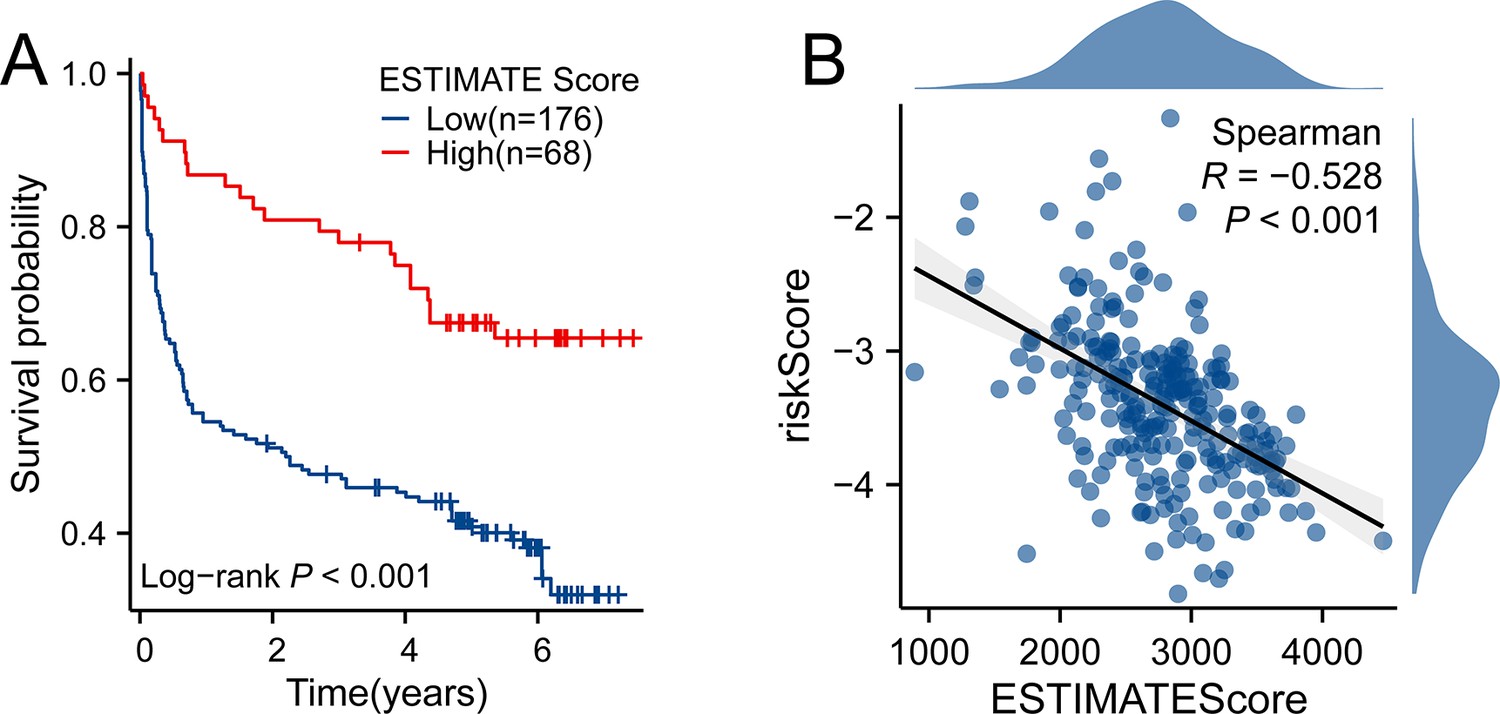
The correlation between tumor purity and prognosis and riskScore in GSE32918 dataset.
(A) High ESTIMATE-Score group had better prognosis. (B) ESTIMATE-Score was negatively associated with riskScore. Note: ESTIMATE-Score manifests the tumor purity, with high ESTIMATE-Score indicating low tumor purity and high immune and stromal components. Because the GSE32918 datasets were sequenced with illumina platform, the ESTIMATE algorithm only provided ESTIMATE Score to represent the tumor purity.
Figure 6 with 1 supplement
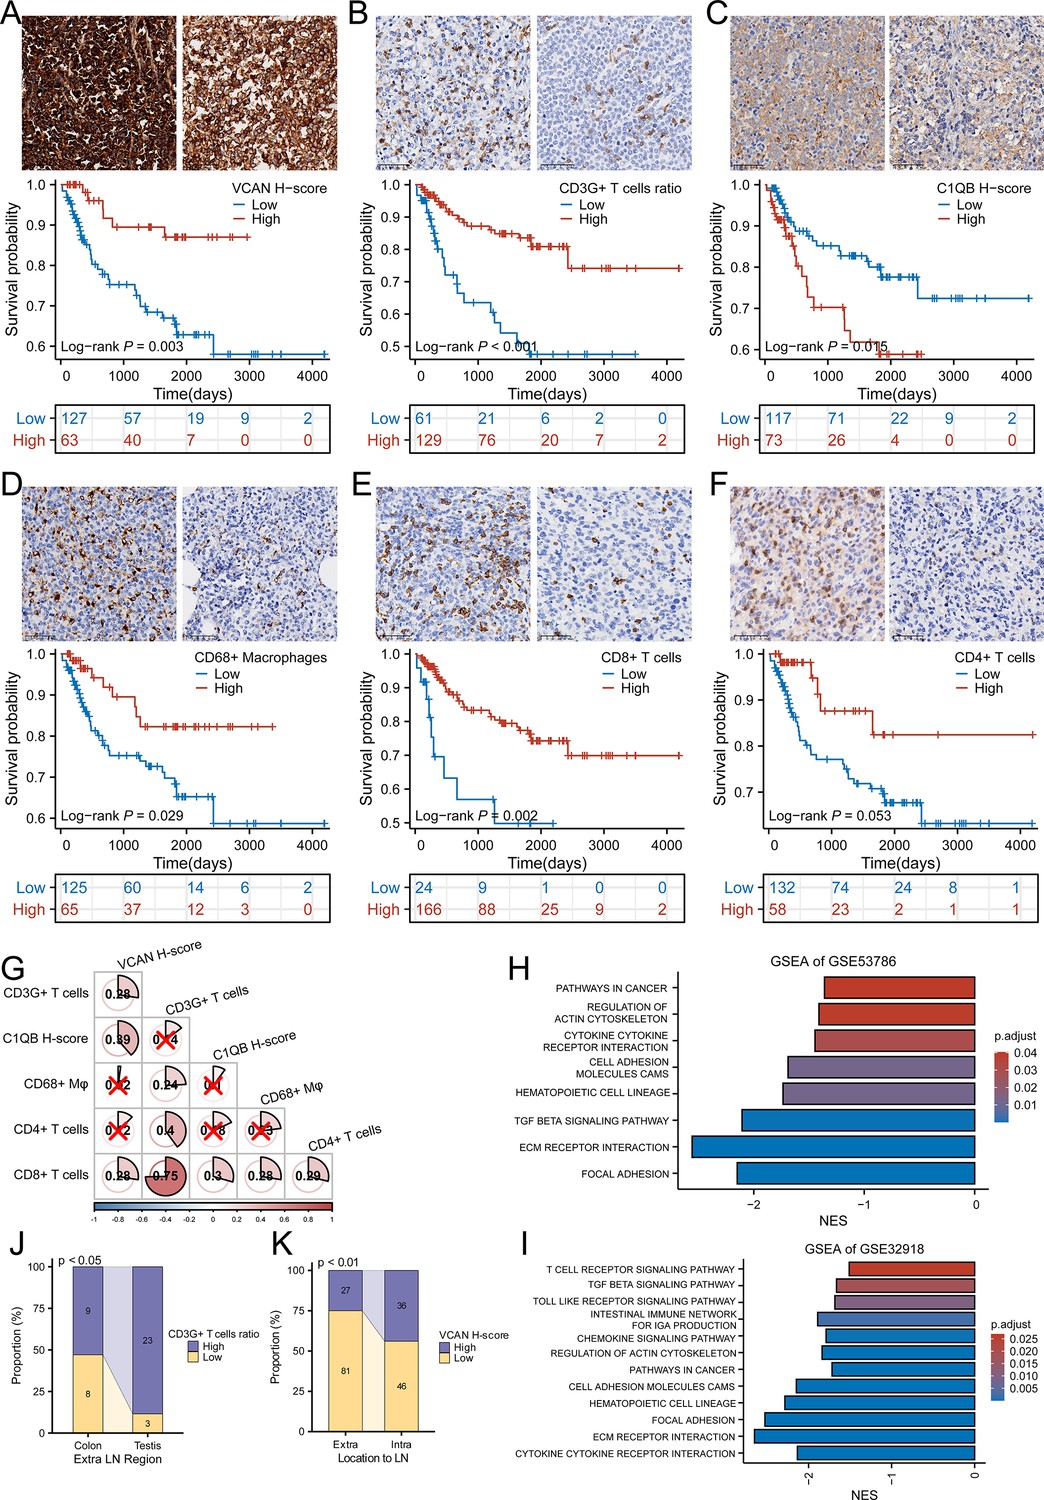
The analysis of CHCAMS cohort.
(A) The representative image of VCAN staining of high and low expression groups and the survival analysis based on VCAN expression (n Low = 127, n High = 63). (B) The representative image of CD3G staining of high and low CD3G+ T cells ratio groups and the survival analysis based on CD3G+ T cells ratio (n Low = 61, n High = 129). (C) The representative image of C1QB staining of high and low expression groups and the survival analysis based on C1QB expression (n Low = 117, n High = 73). (D) The representative image of CD68 staining of high and low CD68 + macrophages ratio groups and the survival analysis based on CD68 + macrophages ratio (n Low = 125, n High = 65). (E) The representative image of CD8 staining of high and low CD8 + T cells ratio groups and the survival analysis based on CD8 + T cells ratio (n Low = 24, n High = 166). (F) The representative image of CD4 staining of high and low CD4 + T cells ratio groups and the survival analysis based on CD4 + T cells ratio (n Low = 132, n High = 58). (G) The correlation between VCAN, CD3G+ T cells ratio, C1QB and CD68 + macrophages, CD8 + T cells and CD4 + T cells ratio . ‘×’ means no statistical significance. (H-I) GSEA analysis based on the differentially expressed genes between high-risk and low-risk group in GSE53786 and GSE32918. (J) The CD3G+ T cells infiltration varied from colon to testis originating diffuse large B-cell lymphoma (DLBCL) in male (Fisher’s exact test). (K) The VCAN expression level was different between intra- and extra-lymph node DLBCL (χ2 test).
Figure 6—figure supplement 1
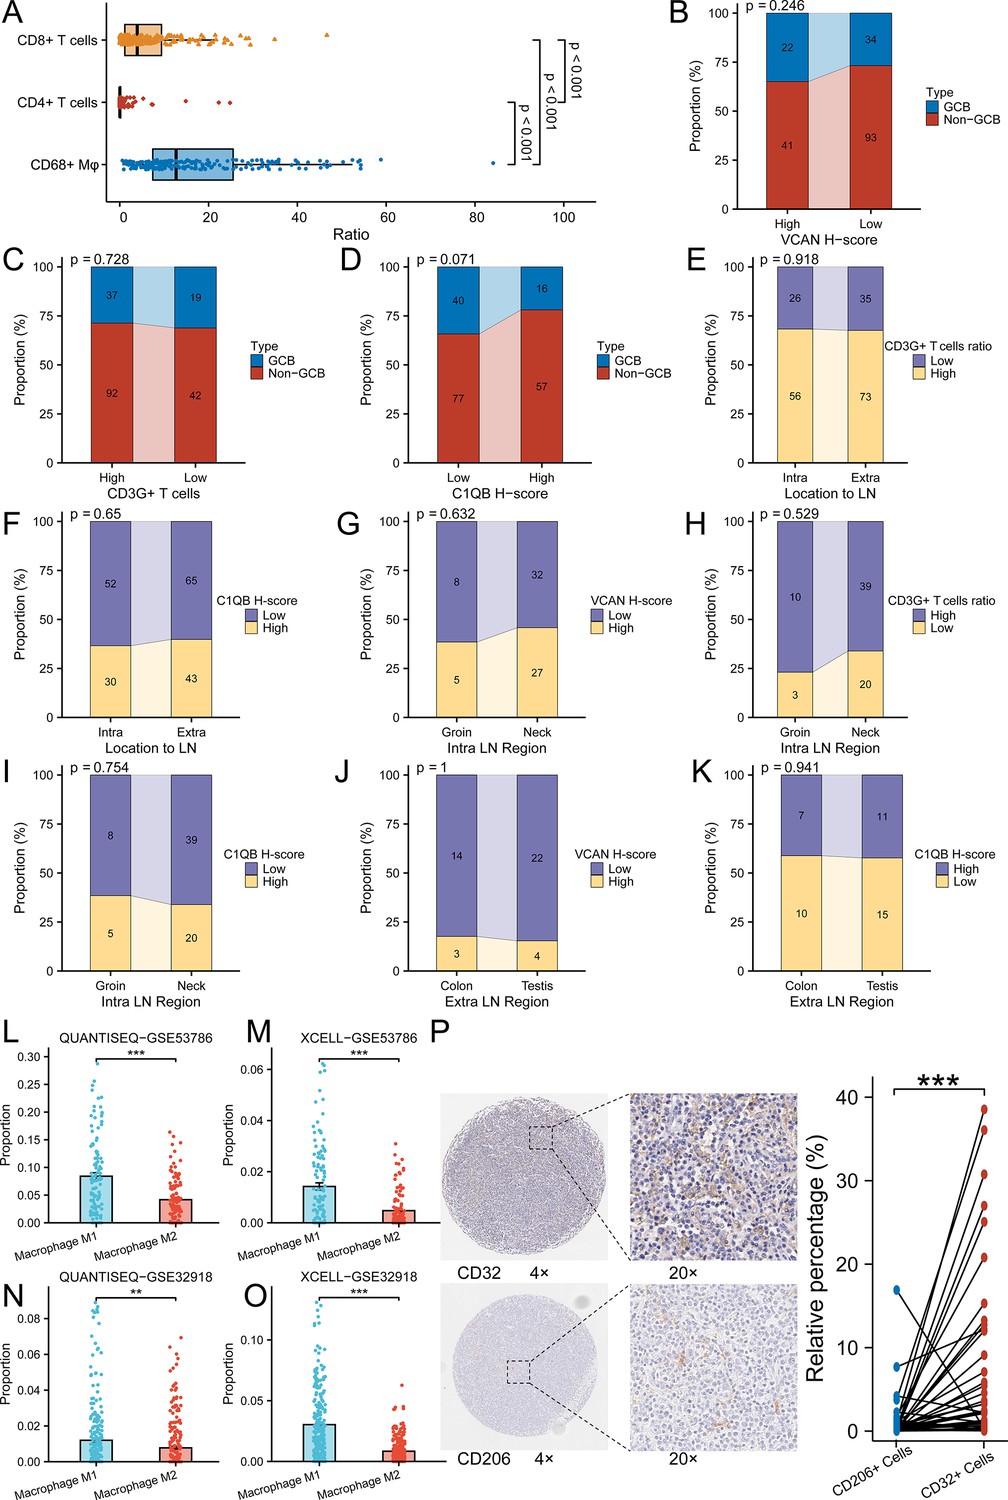
The immunoenvironment analysis and clinicopathological analysis of CHCAMS cohort and gene expression omnibus (GEO) datasets.
(A) The ratio of CD68 + macrophages, CD8 + T cells, and CD4 + T cells in CHCAMS cohort (n = 190, Kruskal-Wallis Test and Dunn’s Test, data are shown as mean ± SEM). (B-D) The correlation between VCAN, CD3G+ T cells, C1QB, and types of DLBCL in CHCAMS cohort (χ2 test). (E-K) The correlation between VCAN, CD3G+ T cells, C1QB, and DCBCL origination in CHCAMS cohort (E-G, I and K, χ2 test; H and J, Fisher’s exact test ). ‘Location to LN’ means the relative location of the tumor to lymph node, that is, intra-lymph node or extra-lymph node. (L-M) The predicted M1 and M2 macrophages proportion in GSE53786 dataset (n = 119, Wilcoxon rank sum test, data are shown as mean ± SEM). (N-O) The predicted M1 and M2 macrophages proportion in GSE32918 dataset (n = 249, Wilcoxon rank sum test, data are shown as mean ± SEM). (P) The validation of M1 (CD32 + cells) and M2(CD206 + cells) macrophages infiltration in diffuse large B-cell lymphoma (DLBCL) in CHCAMS cohort (n = 44, Wilcoxon signed rank test). **p<0.01, ***p<0.001.
Figure 7
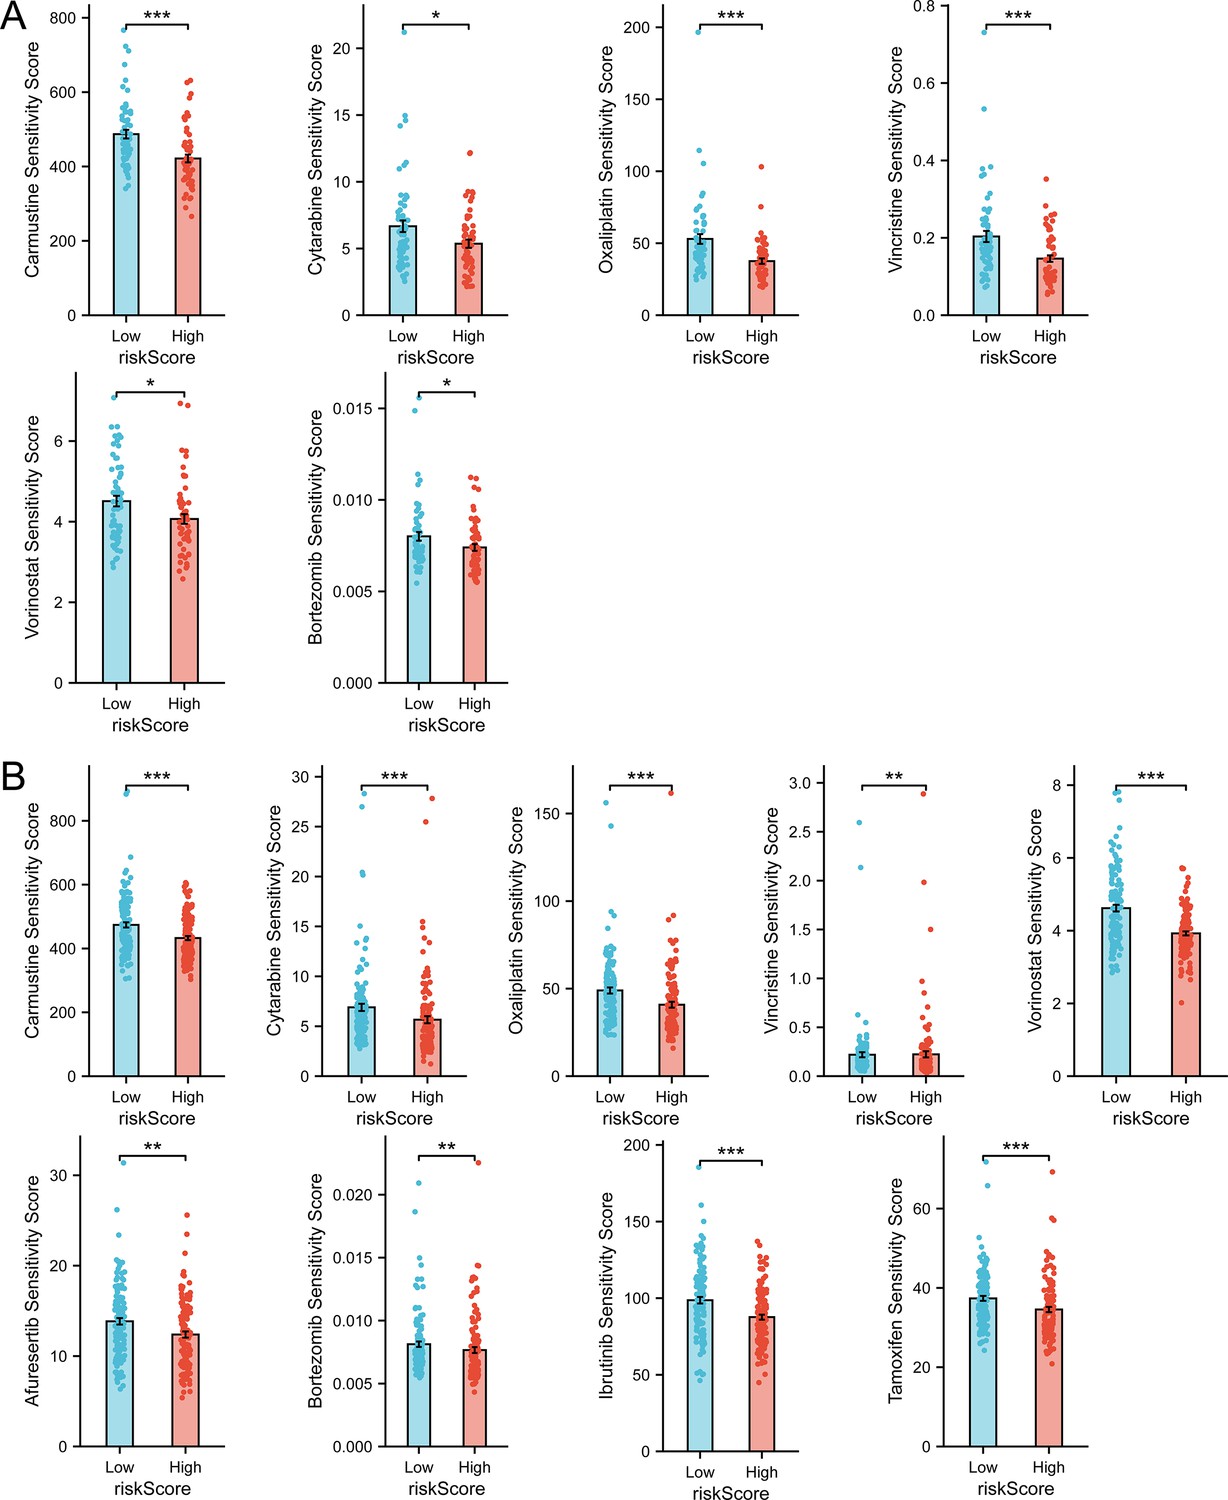
Drug sensitivity prediction revealed therapeutic candidates for high-risk group.
(A) Drug sensitivity prediction results with statistical significance in GSE53786 dataset (n Low = 60, n High = 59, Wilcoxon rank sum test, data are shown as mean ± SEM ). (B) Drug sensitivity prediction results with statistical significance in GSE32918 dataset (n Low = 124, n High = 125, Wilcoxon rank sum test, data are shown as mean ± SEM). According to ‘oncoPredict’ algorithm, sensitivity score indicates IC50 of drugs, with higher sensitivity score indicating lower sensitivity.
Additional files
-
Supplementary file 1
The clinicopathological characteristics of CHCAMS cohort.
- https://cdn.elifesciences.org/articles/92841/elife-92841-supp1-v1.docx
-
Supplementary file 2
The prediction of drug sensitivity.
- https://cdn.elifesciences.org/articles/92841/elife-92841-supp2-v1.docx
-
Supplementary file 3
The original data of macrophage subtype ratio of CHCAMS cohort.
- https://cdn.elifesciences.org/articles/92841/elife-92841-supp3-v1.xlsx
-
Supplementary file 4
The original data of CHCAMS cohort.
- https://cdn.elifesciences.org/articles/92841/elife-92841-supp4-v1.xlsx
-
MDAR checklist
- https://cdn.elifesciences.org/articles/92841/elife-92841-mdarchecklist1-v1.pdf
Download links
A two-part list of links to download the article, or parts of the article, in various formats.
Downloads (link to download the article as PDF)
Open citations (links to open the citations from this article in various online reference manager services)
Cite this article (links to download the citations from this article in formats compatible with various reference manager tools)
Tumor purity-related genes for predicting the prognosis and drug sensitivity of DLBCL patients
eLife 13:RP92841.
https://doi.org/10.7554/eLife.92841.3


