Identification and characterization of intermediate states in mammalian neural crest cell epithelial to mesenchymal transition and delamination
- Stowers Institute for Medical Research, United States
- Department of Anatomy and Cell Biology, University of Kansas Medical Center, United States
Figures
Figure 1 with 1 supplement
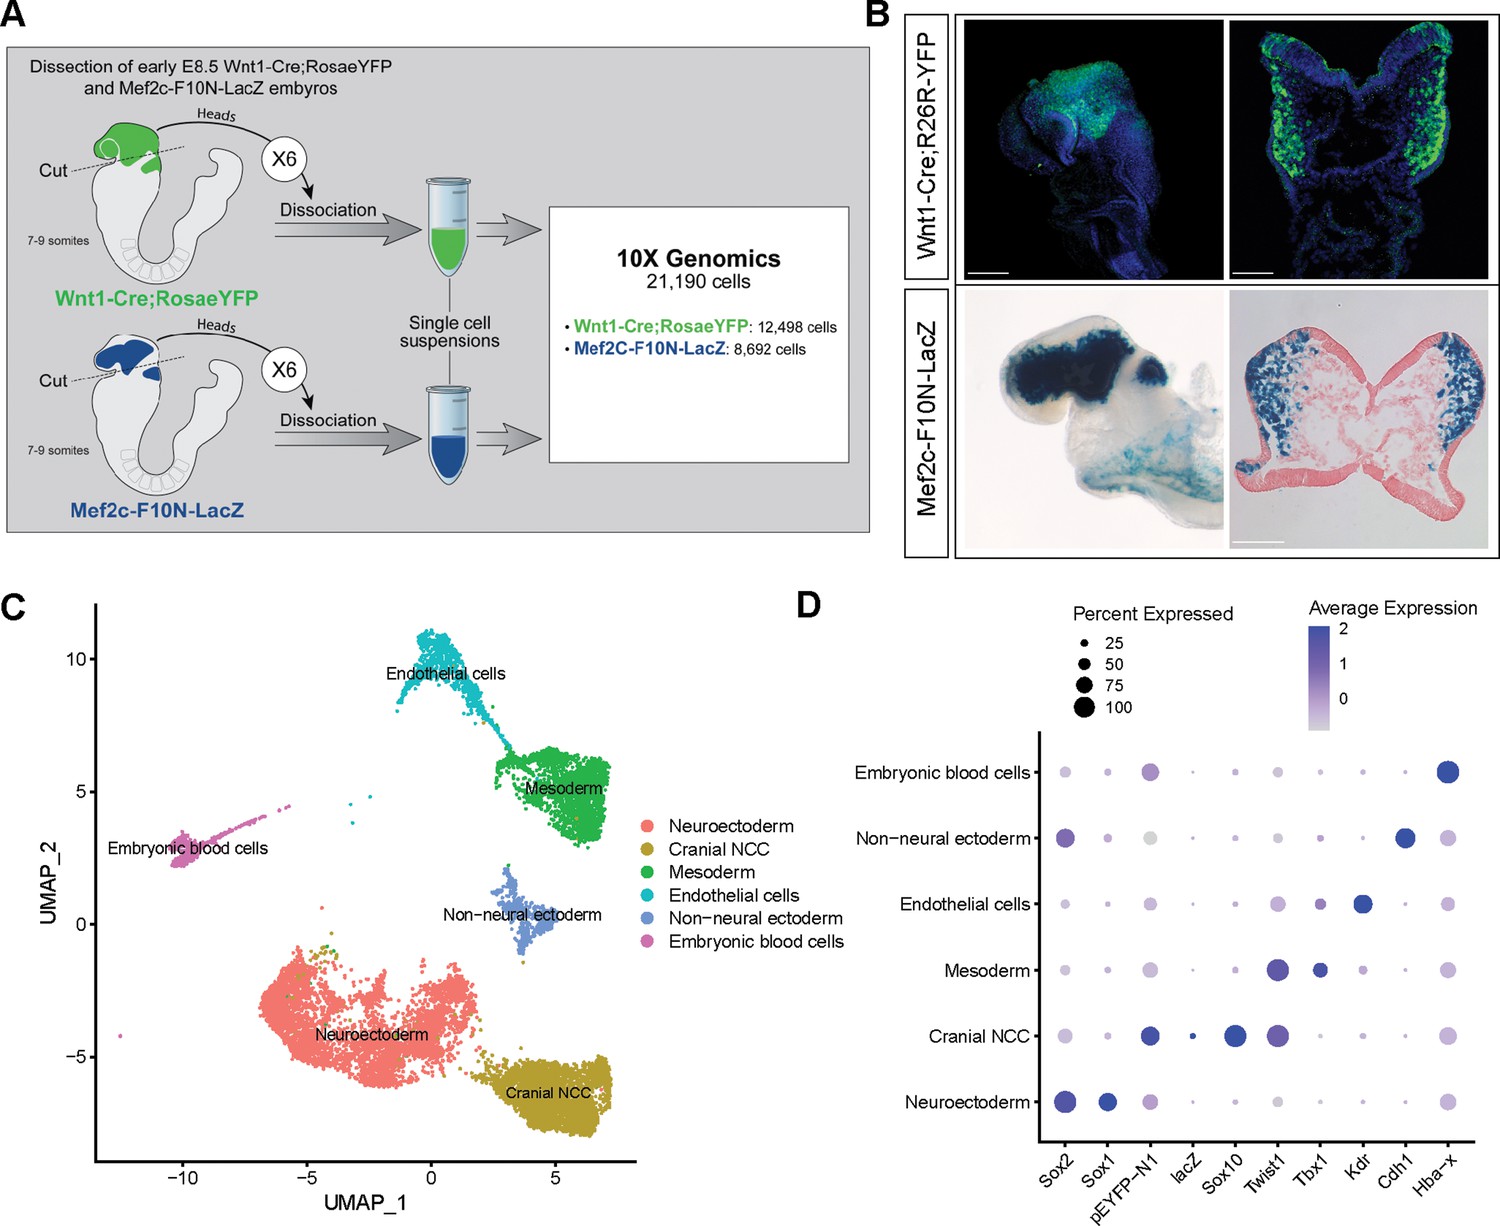
Single-cell RNA sequencing analysis of mouse early E8.5 cranial tissues.
(A) Schematic of experimental design. Wnt1-Cre;RosaLSL-eYFP and Mef2c-F10N-LacZ embryos with between 7 and 9 somites (6 each) were dissected and cranial tissues anterior to rhombomere 3 were collected. Tissues were dissociated into single-cell suspensions before being processed through the 10x Genomics pipeline. The final dataset used for analysis consisted of 21,190 cells (12,498 cells from Wnt1-Cre;RosaLSL-eYFP and 8692 from Mef2c-F10N-LacZ) and 29,041 genes. (B) YFP and LacZ staining of E8.5 Wnt1-Cre;RosaLSL-eYFP and Mef2c-F10N-LacZ embryos and 10 µm cranial transverse sections. YFP (green) labels cells located in the dorsal neuroepithelium and their lineages. As a result, both premigratory and migratory neural crest cells (NCC) are marked by YFP expression. LacZ (blue) labels migratory NCC. (C) Uniform Manifold Approximation and Projection (UMAP) and clustering of six major tissue types in the cranial region of E8.5 mouse embryos: cranial NCC, neuroectoderm, non-neural ectoderm, mesoderm, endothelial cells, and embryonic blood cells. (D) Dotplot showing the expression of tissue-specific markers used for cluster identification. Dot size indicates the percentage of cells in each corresponding cluster (y-axis) that expresses a specific gene (x-axis). Dot color intensity indicates the average expression level of a specific gene in a cell cluster. Scale bars: whole embryos 200 µm; embryo sections 100 µm.
Figure 1—figure supplement 1
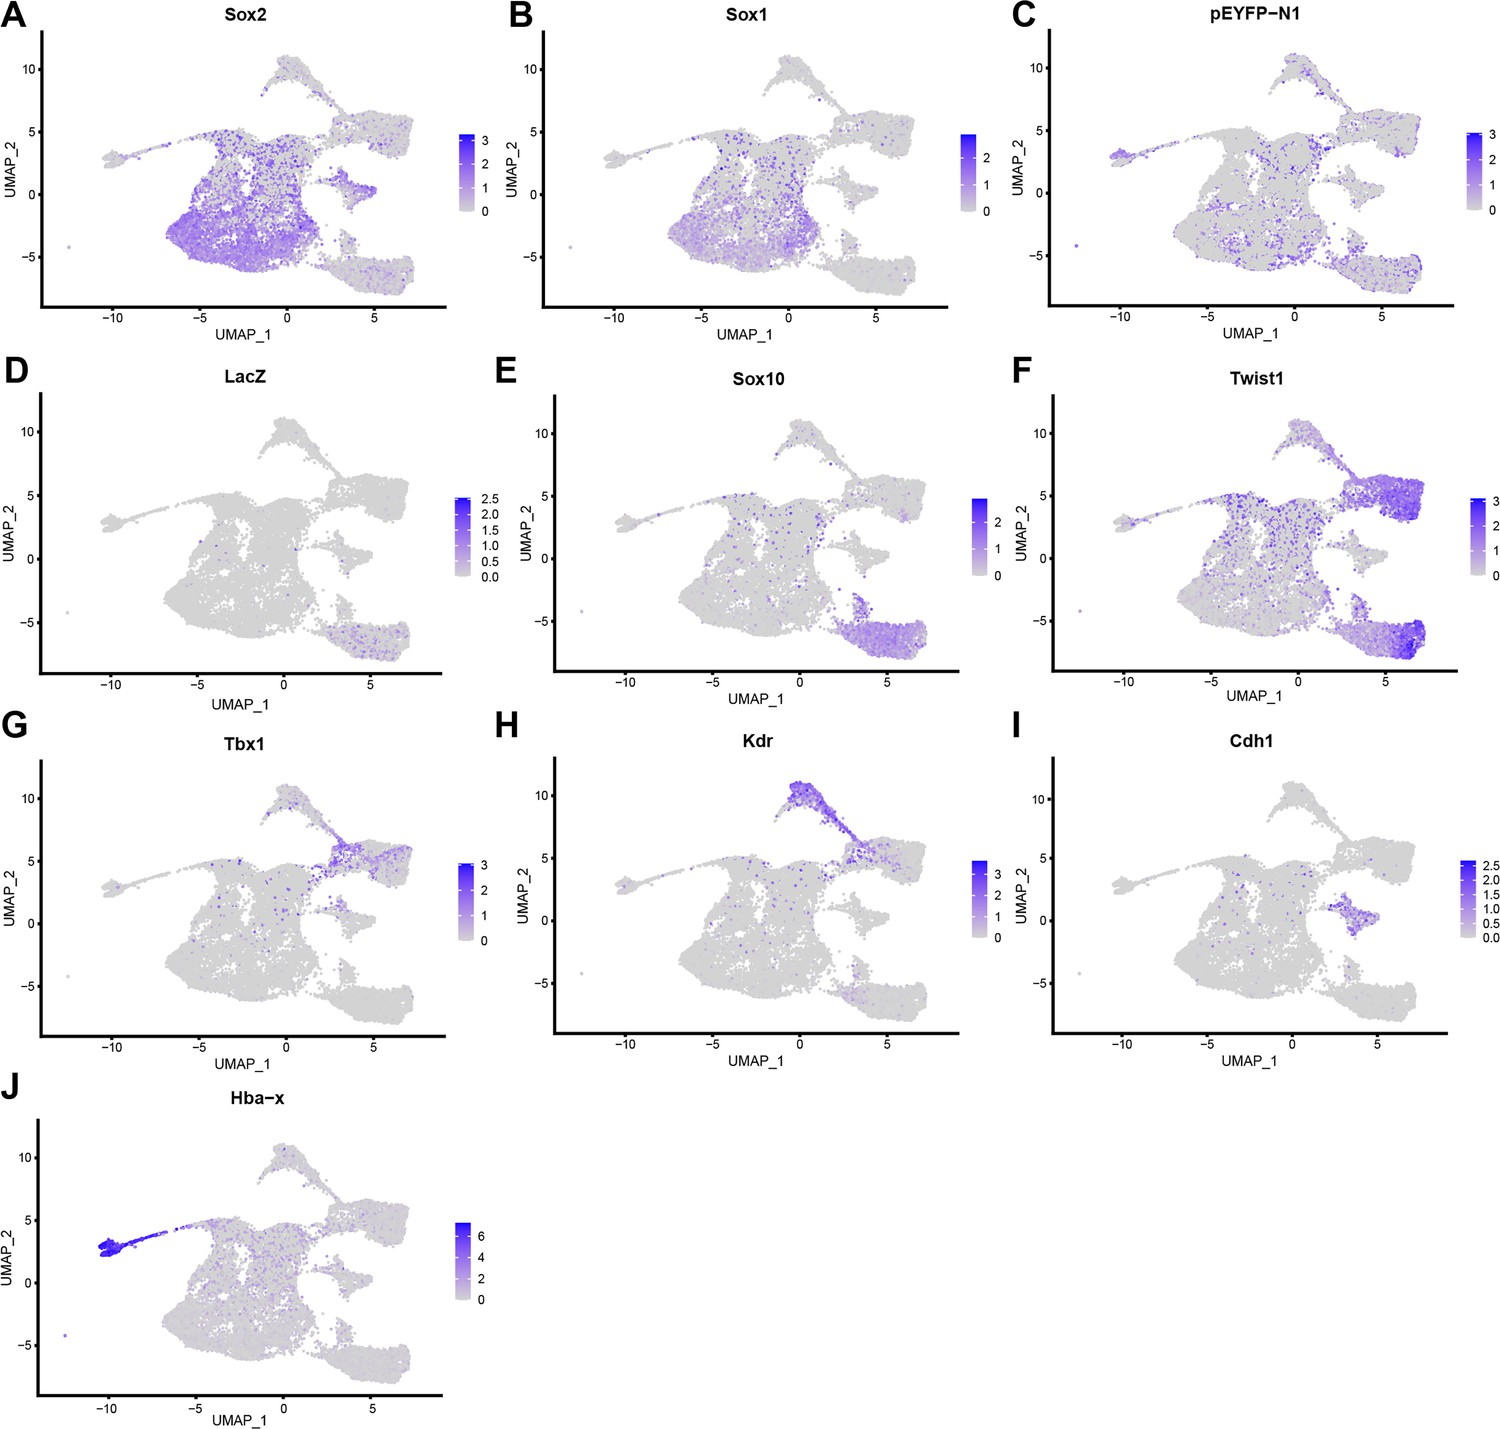
Expression of tissue-specific marker genes that identify six major cell type clusters in early E8.5 mouse embryonic cranial tissues.
FeaturePlots that show the expression of (A) Sox2, neuroectoderm marker; (B) Sox1, neuroectoderm marker; (C) eYFP, premigratory and migratory neural crest cell (NCC) marker; (D) LacZ, migratory NCC marker; (E) Sox10, migratory NCC marker; (F) Twist1, NCC and mesoderm marker; (G) Tbx1, mesoderm marker; (H) Kdr, endothelial cell marker; (I) Cdh1, non-neural ectoderm marker; (J) Hba-x, embryonic blood cell marker.
Figure 2 with 1 supplement
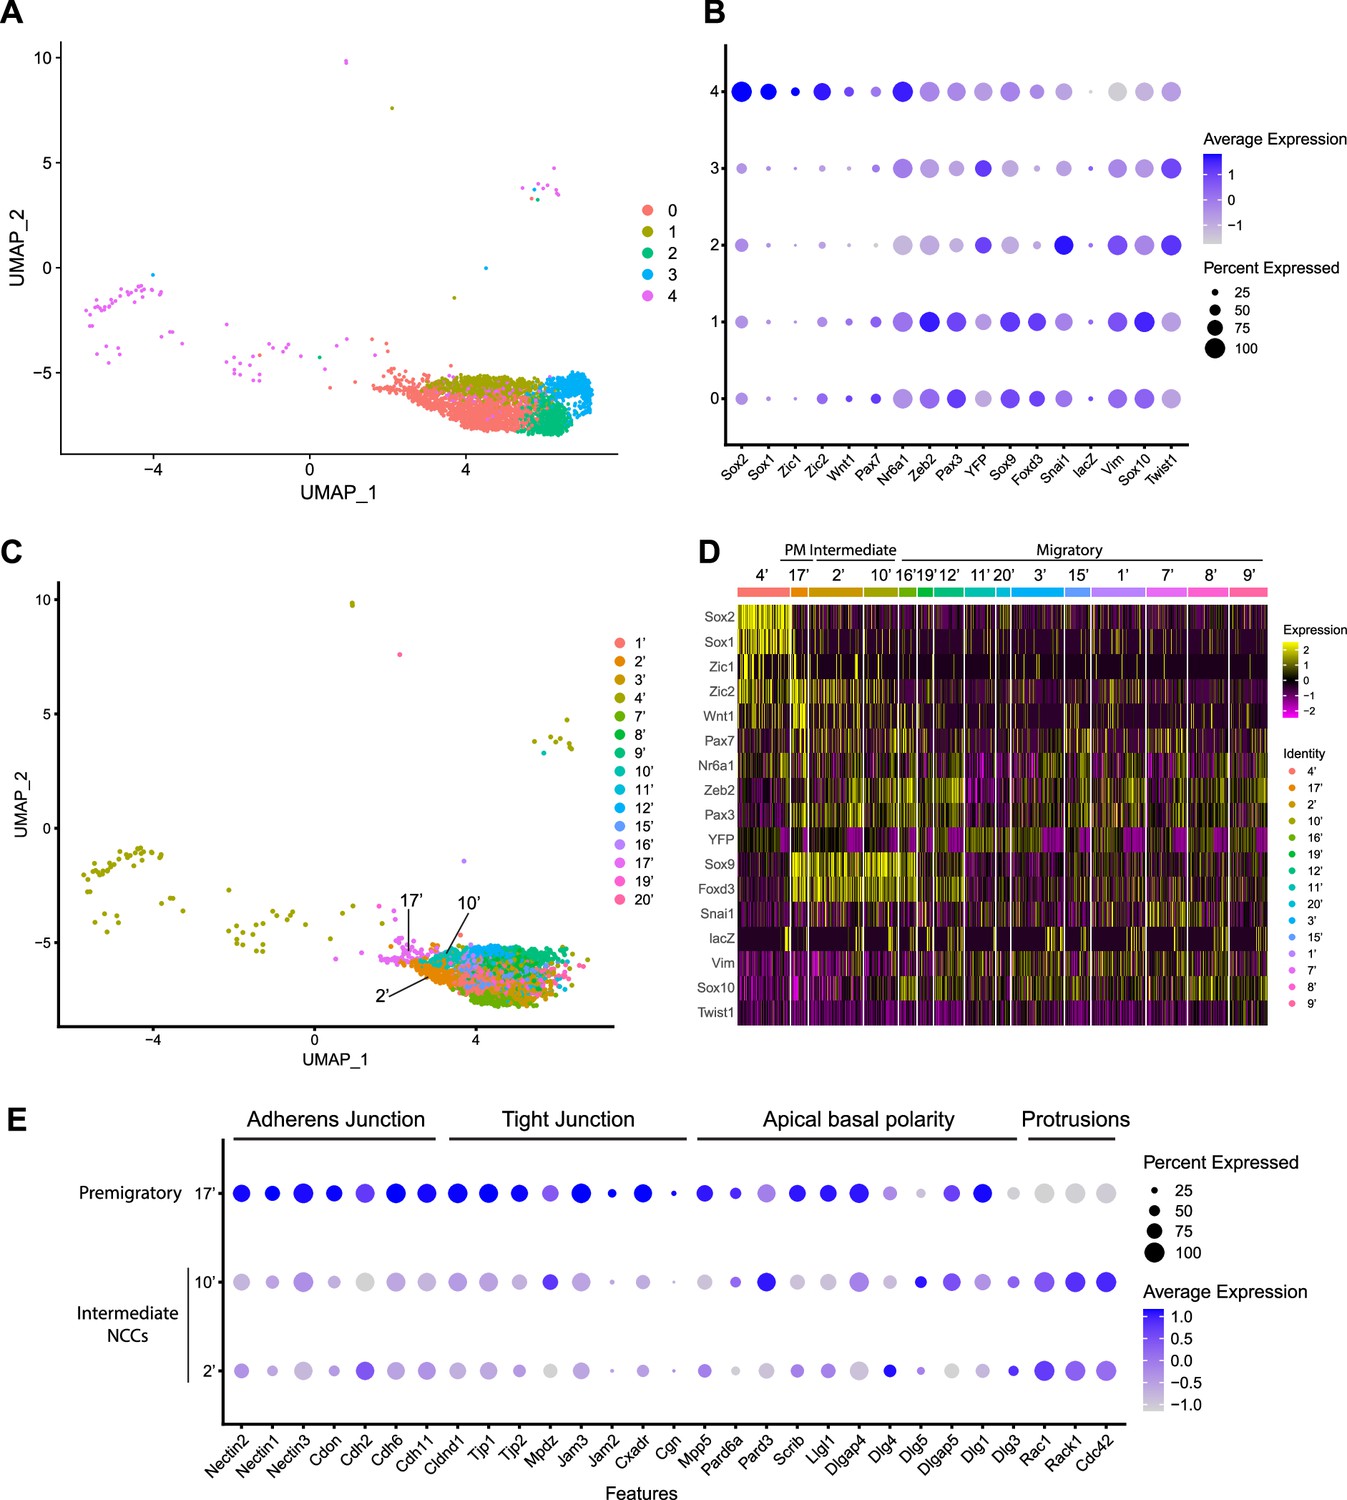
Expression of neural crest cell (NCC) development-related genes and epithelial to mesenchymal transition (EMT) functional genes identifies NCC EMT intermediate populations.
(A) Uniform Manifold Approximation and Projection (UMAP) and re-clustering of the cranial NCC cluster into five smaller subclusters at a resolution of 0.26. (B) Dotplot showing the expression of NCC development-related genes in five cranial NCC subclusters. (C) UMAP and re-clustering of the early migratory NCC subclusters 0, 1, and 4 into smaller subclusters at a resolution of 2.0. (D) Heatmap showing the expression of NCC development-related genes in the smaller early migratory NCC subclusters at a resolution of 2.0 shown in (C). High levels of expression are indicated in yellow, and low levels of expression are indicated in pink. Based on the gene expression profile of each subcluster, subcluster 17’ was determined to be premigratory NCC; subcluster 2’ and 10’ are EMT intermediate NCC; the remaining subclusters are migratory NCC. (E) Dotplot showing the expression of EMT functional genes in premigratory NCC subcluster 17’ and intermediate NCC subclusters 2’ and 10’. EMT intermediate NCC display reduced expression of adherens junction, tight junction, and apical basal polarity genes compared to premigratory NCC, whereas protrusion-related genes are upregulated in intermediate NCC.
Figure 2—figure supplement 1
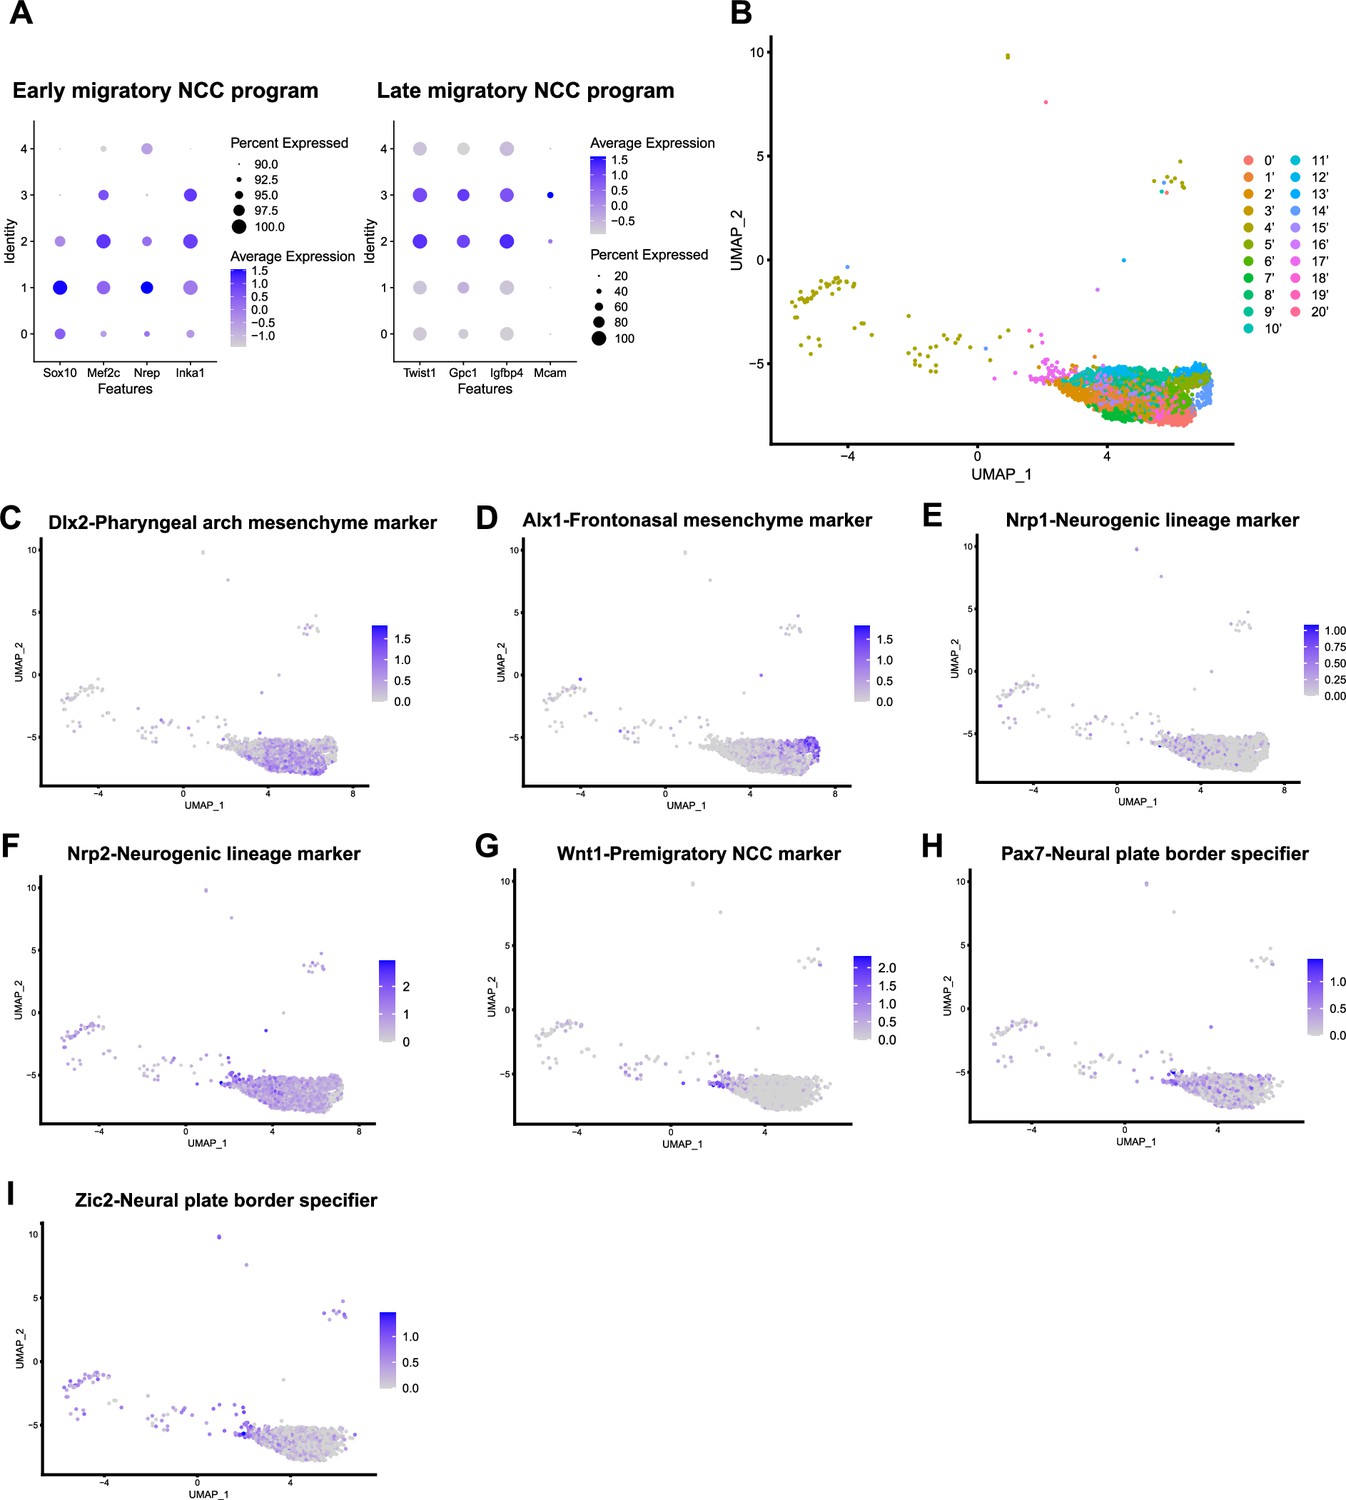
Additional gene expressions that support the identity of cranial neural crest cell (NCC) subclusters at 0.26 and 2.0 resolutions.
(A) Expression of NCC development program genes (Soldatov et al., 2019) confirms NCC subclusters 0 and 1 as early migratory NCC and subclusters 2 and 3 as late migratory NCC. Dotplots showing the expression of early and late NCC program genes in five NCC subclusters at resolution 0.26. Subclusters 0–3 all express early migratory NCC program genes, but only subclusters 2 and 3 express a significant level of late migratory NCC program genes. (B) Uniform Manifold Approximation and Projection (UMAP) and re-clustering of the cranial NCC cluster into 21 smaller subclusters at a resolution of 2.0. (C–F) FeaturePlots show the expression of mesenchyme and neurogenic lineage markers in cranial NCC. Subcluster 2 displays a high expression of pharyngeal arch mesenchyme marker Dlx2 (C). The frontonasal mesenchyme marker Alx1 is specifically expressed by subcluster 3 (D). Neurogenic lineage markers Nrp1 and Nrp2 are expressed in late migratory NCC (E, F). (G–I) FeaturePlots showing expression of the premigratory NCC marker Wnt1 (G) and neural plate border specifiers Pax7 and Zic2 (H, I) in early migratory NCC. Subcluster 2’ and 10’ cells express reduced levels of Wnt1, Zic2, and Pax7 than subcluster 17’ cells.
Figure 3
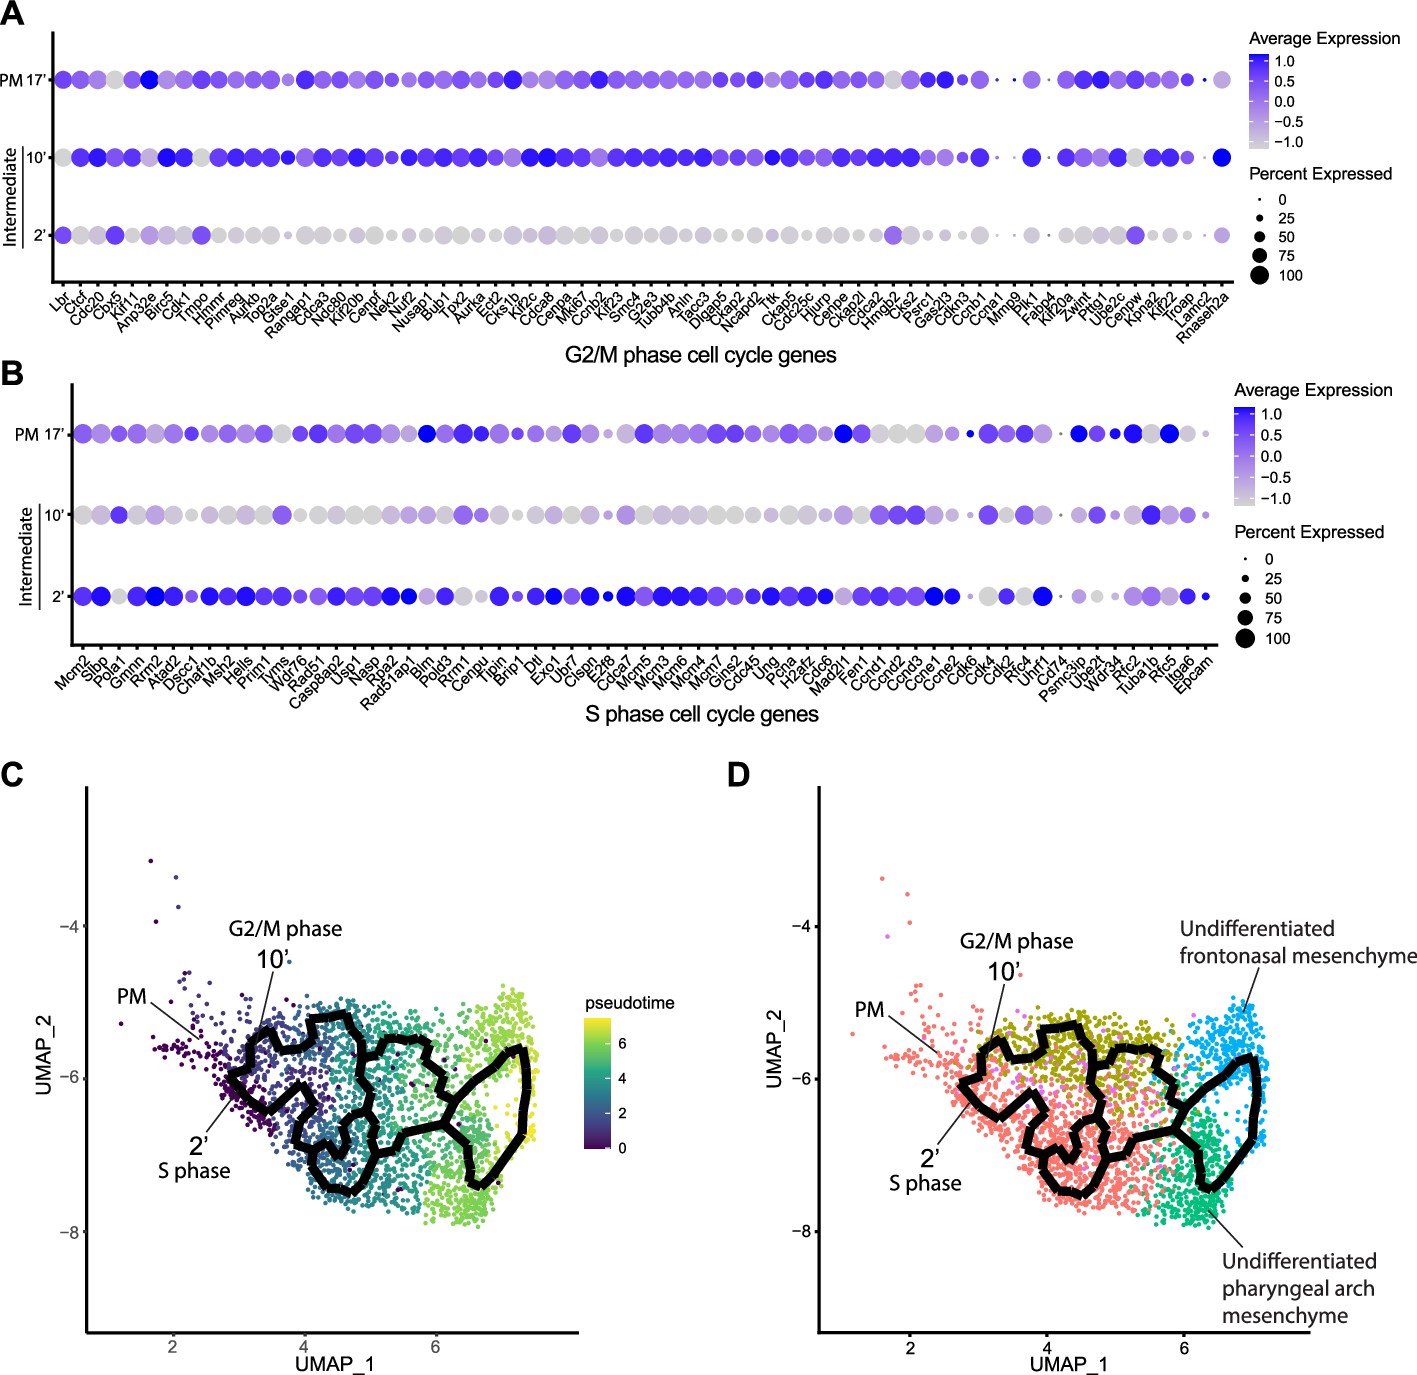
Mouse cranial neural crest cell (NCC) delaminate in S phase or G2/M phase cell cycle independently.
(A) Dotplot showing the expression of G2/M phase cell cycle genes in premigratory NCC (PM) and epithelial to mesenchymal transition (EMT) intermediate NCC. G2/M phase cell cycle genes are expressed in PM and intermediate subcluster 10’ cells. (B) Dotplot showing the expression of S phase cell cycle genes in PM and EMT intermediate NCC. S phase cell cycle genes are expressed in PM and intermediate subcluster 2’ cells. (C) Pseudotime analysis of the cranial NCC cluster reveals the temporal relationship between intermediate NCC subclusters 2’ and 10’. Dark color indicates early NCC development, and light color indicates later NCC development. PM and intermediate NCC subclusters represent the earliest developmental timepoints among all cranial NCC. (D) Trajectory analysis of the cranial NCC cluster reveals lineage/fate relationship between PM and intermediate NCC subclusters 2’ and 10’. Two intermediate NCC subclusters develop simultaneously and independently from premigratory NCC. Apart from their cell cycle status, early migratory NCC formed from the different intermediate subclusters are transcriptionally indistinguishable. Color coding of the cell population is consistent with the re-clustering of the cranial NCC cluster into five smaller subclusters at a resolution of 0.26 as shown previously in Figure 2A.
Figure 4 with 1 supplement
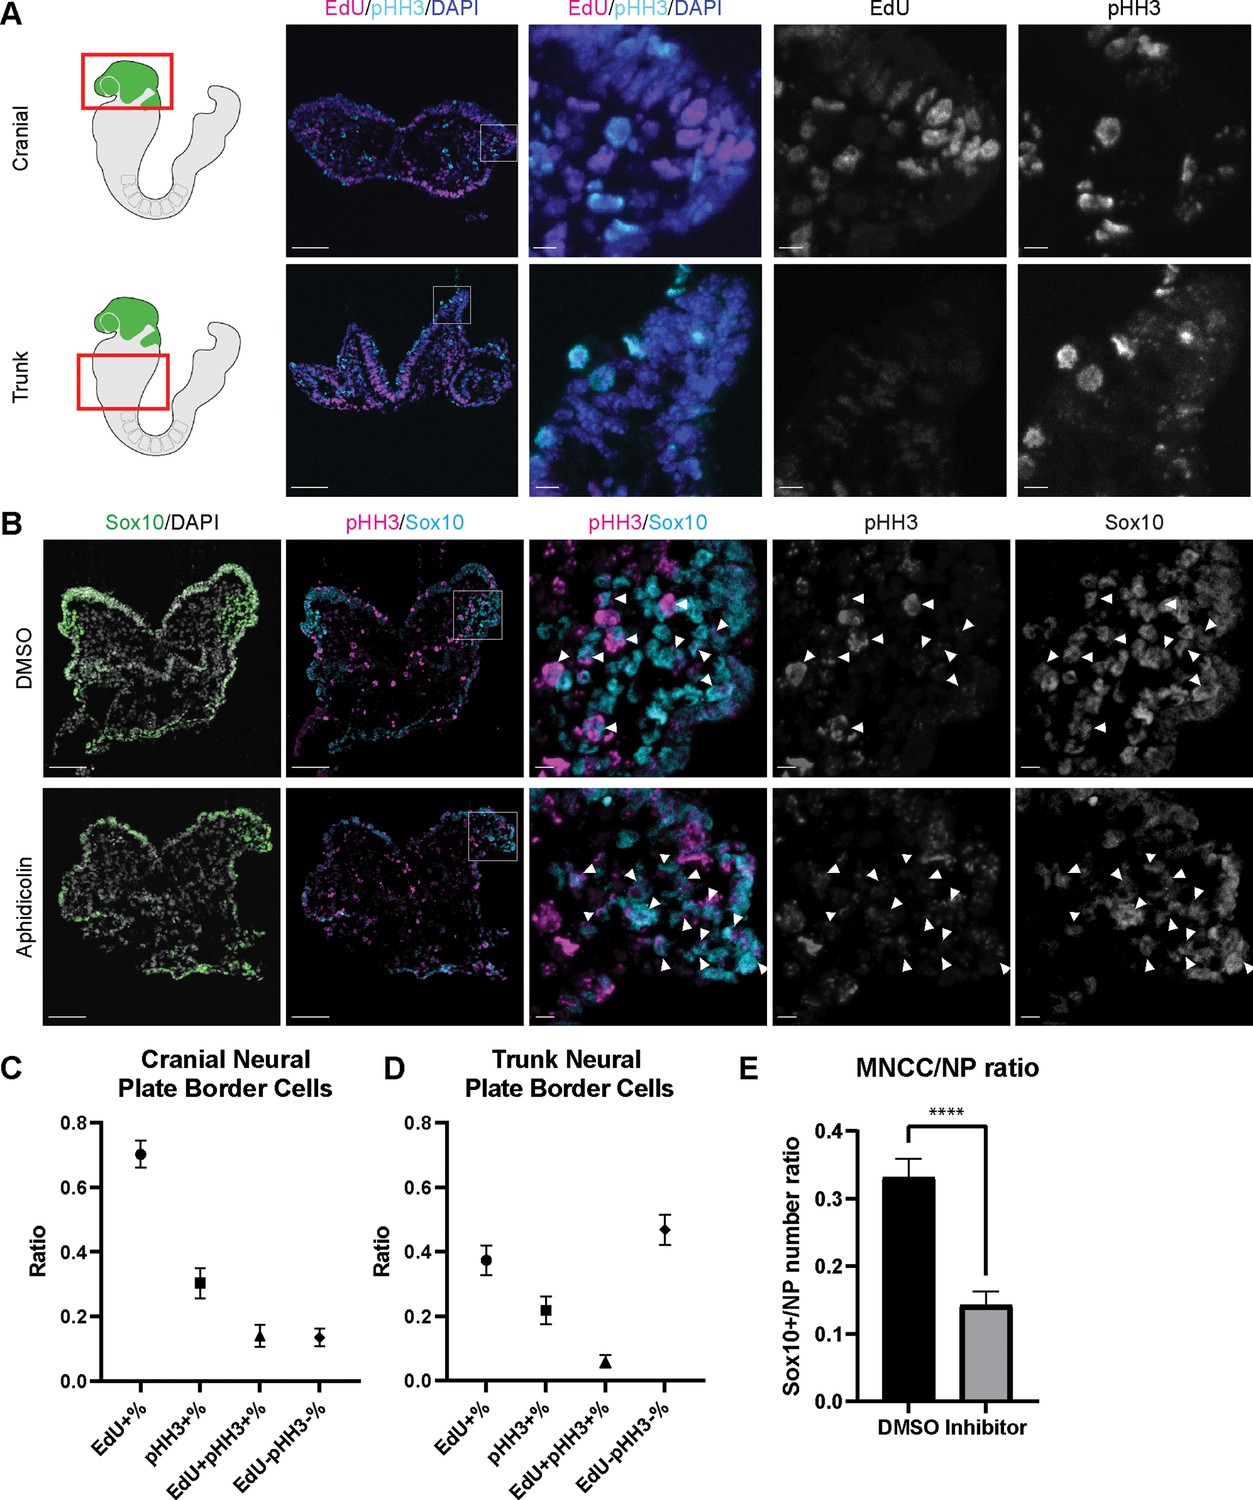
Cell cycle regulation plays an important role in mouse cranial neural crest cell (NCC) delamination and epithelial to mesenchymal transition (EMT).
(A) Cell cycle marker staining of early E8.5 mouse embryonic cranial and trunk tissues reveals differences in cell cycle status between cranial delaminating premigratory NCC and trunk neural plate border cells. EdU (magenta) and phospho-histone H3 (pHH3) (cyan) staining were performed on 10 µm transverse sections of early E8.5 (5–7 somites) Wnt1-Cre;RosaLSL-eYFP mouse embryo cranial and trunk tissues. (B) E8.0 CD1 mouse embryos treated with Aphidicolin exhibit reduced migratory NCC that primarily express pHH3. Cranial sections of treated embryos were stained with Sox10, EdU, and pHH3 (magenta) and arrowheads indicate migratory NCC expressing pHH3. Most remaining migratory NCC in Aphidicolin-treated samples express pHH3. In contrast, a small proportion of migratory NCC in control DMSO-treated samples express pHH3. (C) Cell cycle staining quantification of delaminating premigratory NCC in the cranial neural plate border shows that most cells express cell cycle markers. Staining and quantification were performed on delaminating premigratory NCC in the cranial neural plate border of 5–7 somite Wnt1-Cre;RosaLSL-eYFP mouse embryos (n=3). The neural plate border region was manually selected in the most dorsolateral domain of the neural plate. EdU+%=the percentage of EdU positive cells within eYFP positive delaminating premigratory NCC in the selected neural plate border domain. pHH3+%=the percentage of pHH3 positive cells within eYFP positive delaminating premigratory NCC. EdU +pHH3+%=the percentage of EdU and pHH3 double positive cells within eYFP positive delaminating premigratory NCC. EdU-pHH3-%=the percentage of EdU and pHH3 double negative cells within eYFP positive delaminating premigratory NCC. (D) Cell cycle staining quantification of trunk neural plate border cells shows that a significant proportion of cells do not express any cell cycle markers. Staining and quantification were performed on trunk neural plate border cells of 5–7 somite Wnt1-Cre;RosaLSL-eYFP mouse embryos (n=3). The neural plate border region was manually selected in the most dorsolateral domain of the neural plate. EdU+%=the percentage of EdU positive cells within DAPI positive neural plate border cells at the trunk axial level. pHH3+%=the percentage of pHH3 positive cells within DAPI positive trunk neural plate border cells. EdU+pHH3+%=the percentage of EdU and pHH3 double positive cells within DAPI positive trunk neural plate border cells. EdU-pHH3-%=the percentage of EdU and pHH3 double negative cells within DAPI positive trunk neural plate border cells. (E) Quantification of Sox10 expressing migratory NCC upon Aphidicolin and control treatment reveals fewer cranial migratory NCC in Aphidicolin-treated embryos. Sox10 staining and quantification were performed on cranial sections of 4–6 somite CD1 mouse embryos post treatment (n=3 per treatment; ****p<0.0001). For quantification, we calculated the ratio of Sox10 positive migratory NCC over DAPI positive neural plate/neuroepithelial cells. Scale bars: embryo sections 100 µm; section insets 10 µm.
Figure 4—figure supplement 1
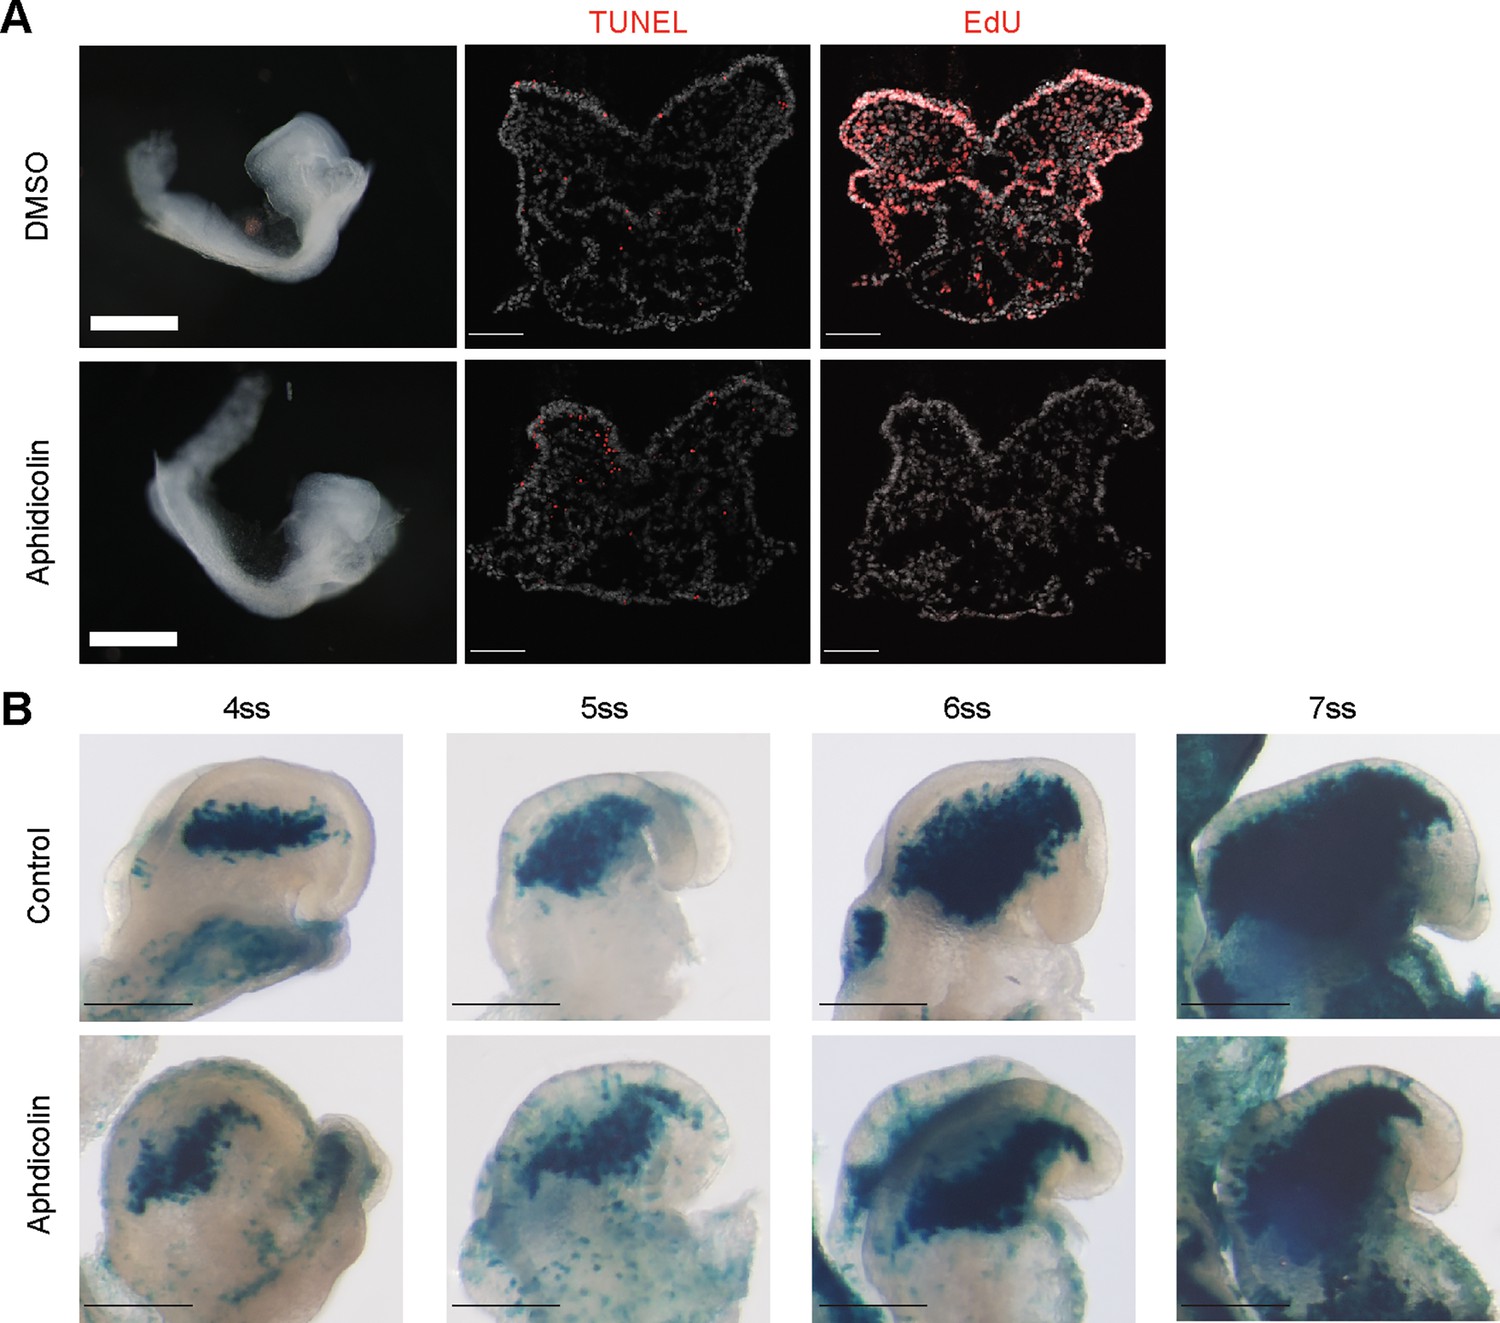
Aphidicolin treatment on Mef2c-F10N-LacZ embryos shows consistent results as CD1 embryos.
(A) Aphidicolin treatment in early E8.5 CD1 embryos for 12–13 hr prevented cells from entering S phase cell cycle and induced minimal cell death. Aphidicolin-treated embryos exhibit a lack of EdU incorporation and a similar level of TUNEL signal compared to the control. (B) Mef2c-F10N-LacZ embryos treated with Aphidicolin for 12–13 hr exhibit reduced migratory NCC as evidenced by β-galactosidase staining. Scale bars: whole embryos 75 µm in A, 200 µm in B; embryo sections 100 µm.
Figure 5 with 2 supplements
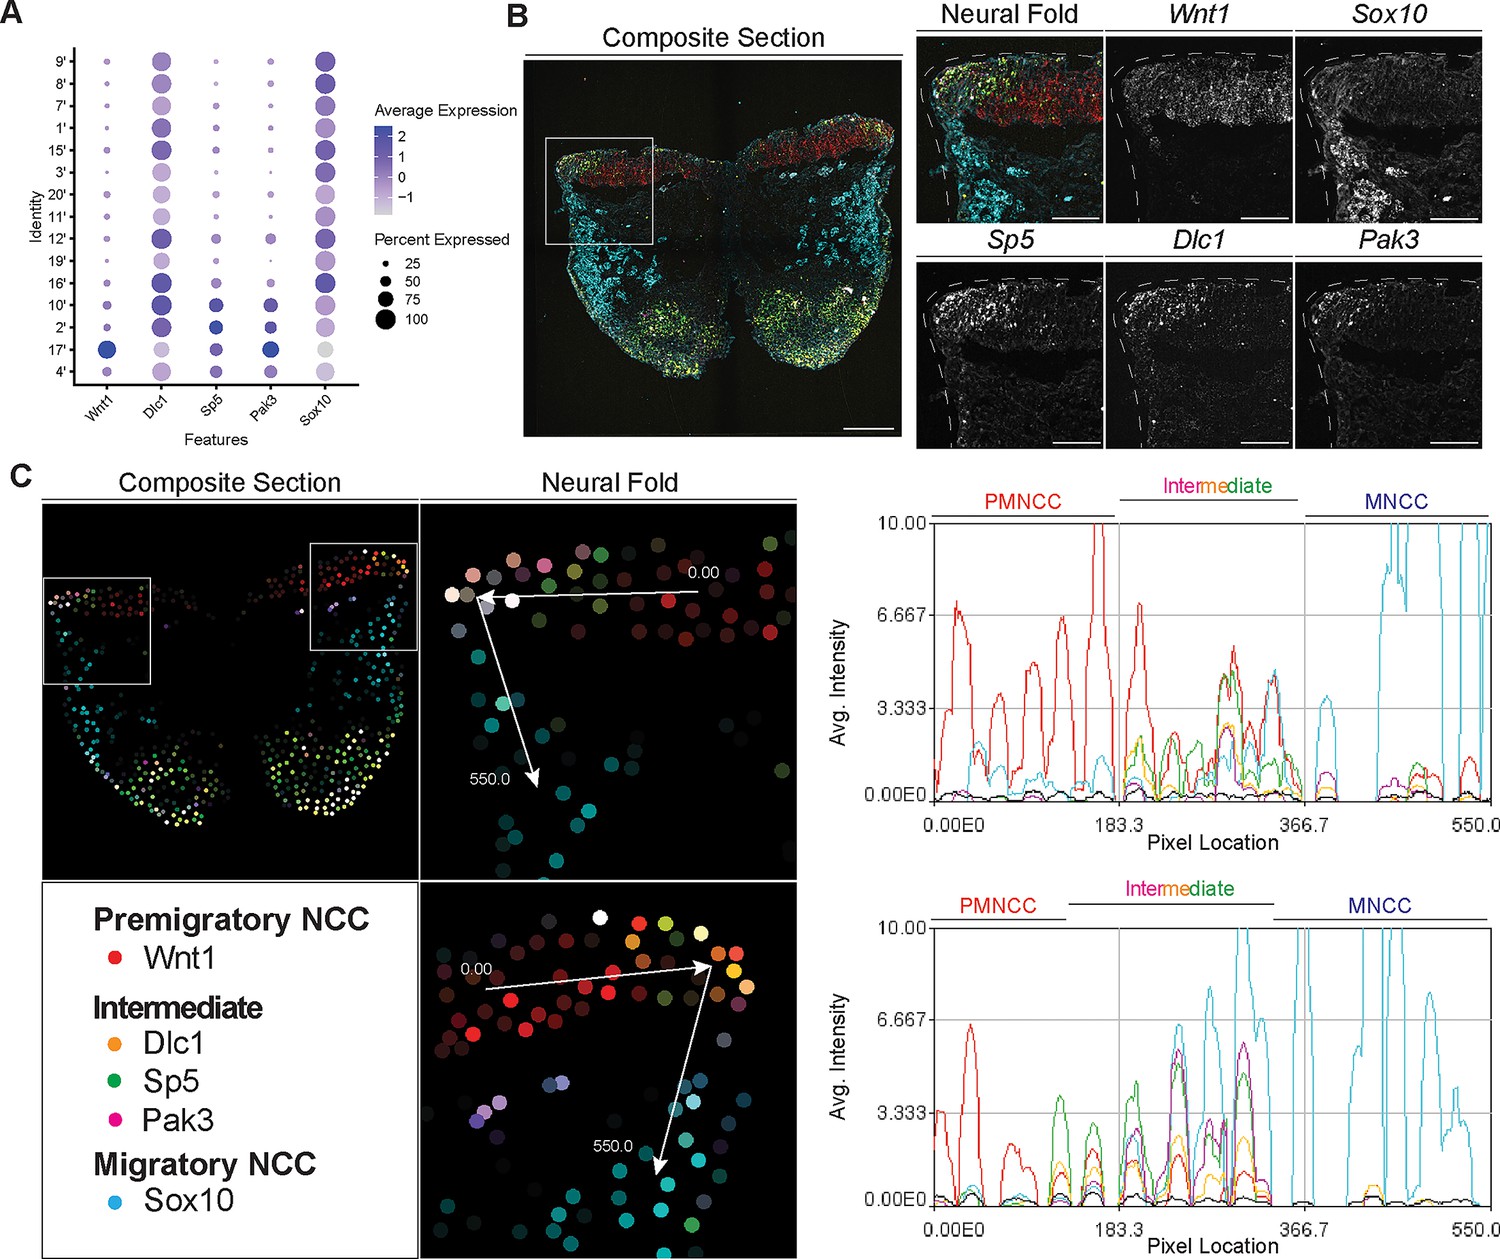
Signal amplification by exchange reaction for multiplexed fluorescent in situ hybridization (SABER-FISH) of epithelial to mesenchymal transition (EMT) intermediate stage markers pinpoints the location of EMT intermediate neural crest cell (NCC) within the dorsal most region of the neural fold.
(A) Dotplot showing the expression of selected EMT intermediate NCC markers in early migratory NCC subclusters (resolution 2.0). (B) SABER-FISH staining of premigratory, EMT intermediate stage, and migratory NCC marker genes on the same section. Higher magnification insets of the left side neural fold (box) showing that Wnt1 is expressed in the neuroepithelium and Sox10 is expressed in migratory NCC populating the underlying mesenchyme. Dlc1, Sp5, and Pak3 are expressed in the dorsolateral most region of the neuroepithelium. (C) 2D map showing the number of transcripts per cell, calculated from the SABER-FISH staining. To evaluate the expression of each gene within and across tissues, a polyline kymograph was generated along the track indicated by the arrows at a width of 100 pixels. The polyline kymograph can be seen to the right of each neural fold map it depicts. At the beginning of the track, Wnt1 expression is highest, demarcating the dorsal lateral domain of the neuroepithelium. Toward the middle of the track, at the location of the most dorsolateral region of the neuroepithelium, Wnt1 is expressed along with the intermediate stage markers Dlc1, Sp5, and Pak3. As the track progresses to just outside of the neuroepithelium, Sox10 expression appears and increases as the track continues through the migratory NCC population. Scale bars: embryo sections 100 µm; section insets 50 µm.
Figure 5—figure supplement 1
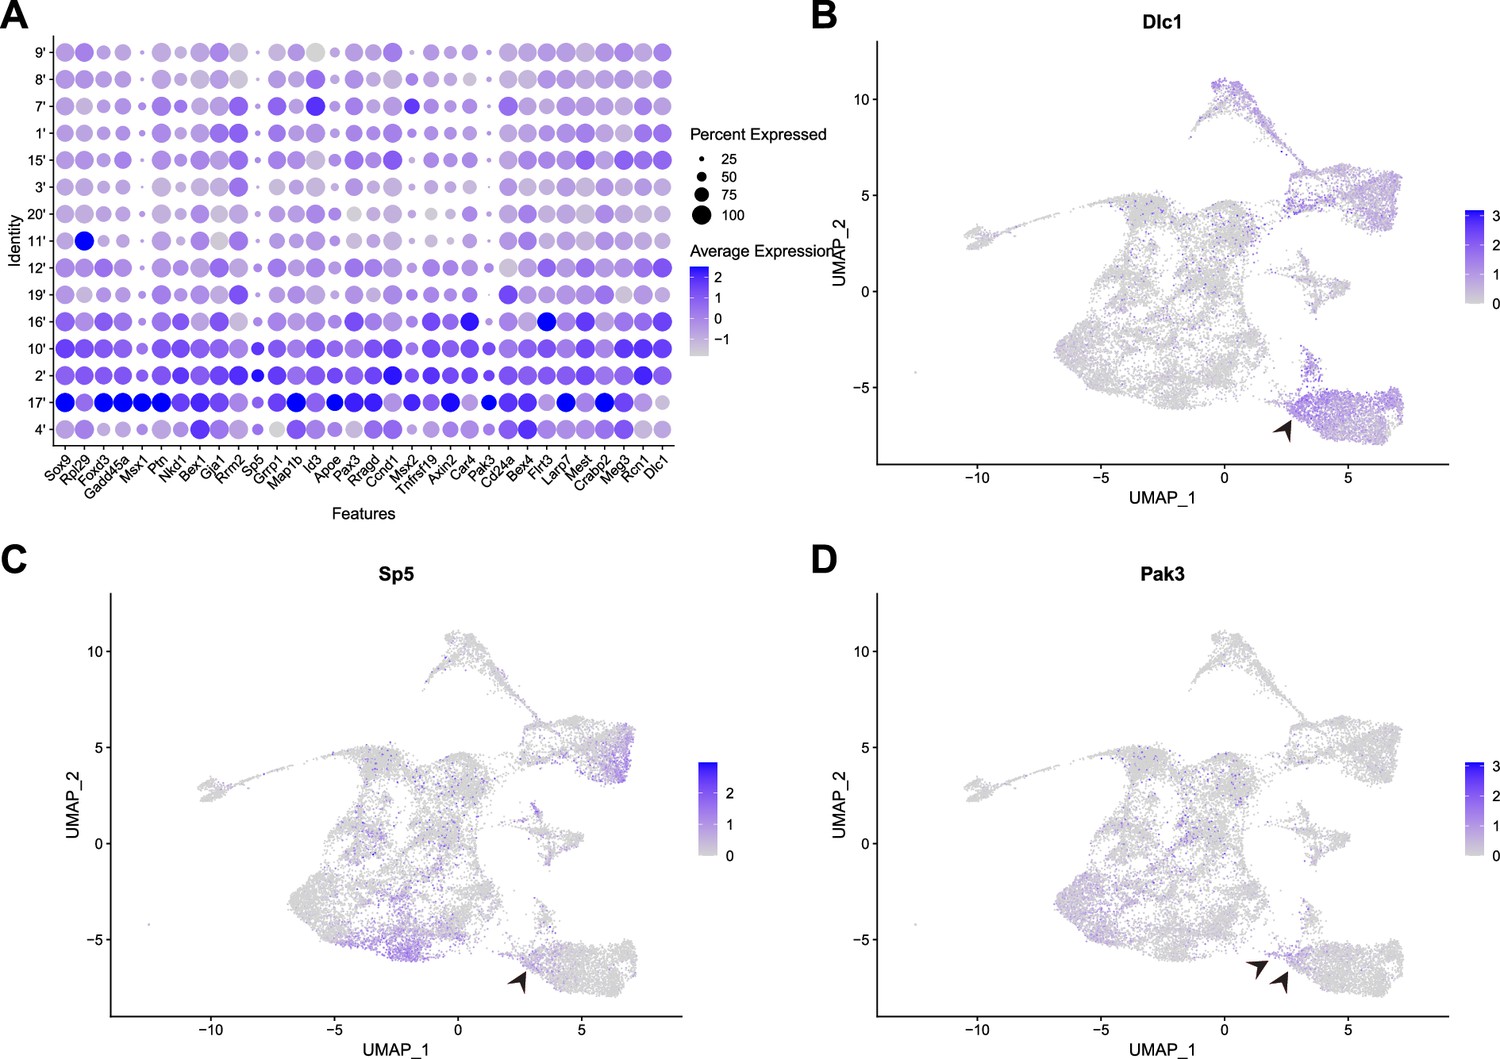
Expression of epithelial to mesenchymal transition (EMT) intermediate neural crest cell (NCC) markers in single-cell RNA sequencing (scRNA-seq) data.
(A) Dotplot showing the expression of all EMT intermediate NCC markers in early migratory NCC subclusters (resolution 2.0). (B–D) FeaturePlots showing the expression of Dlc1, Sp5, and Pak3 in all early E8.5 cranial mouse embryo tissues. The expression of Dlc1, Sp5, and Pak3 is largely restricted to NCC, neuroectoderm, and mesoderm cells. Arrowheads indicate Dlc1, Sp5, and Pak3 expression specifically in premigratory and intermediate NCC.
Figure 5—figure supplement 2
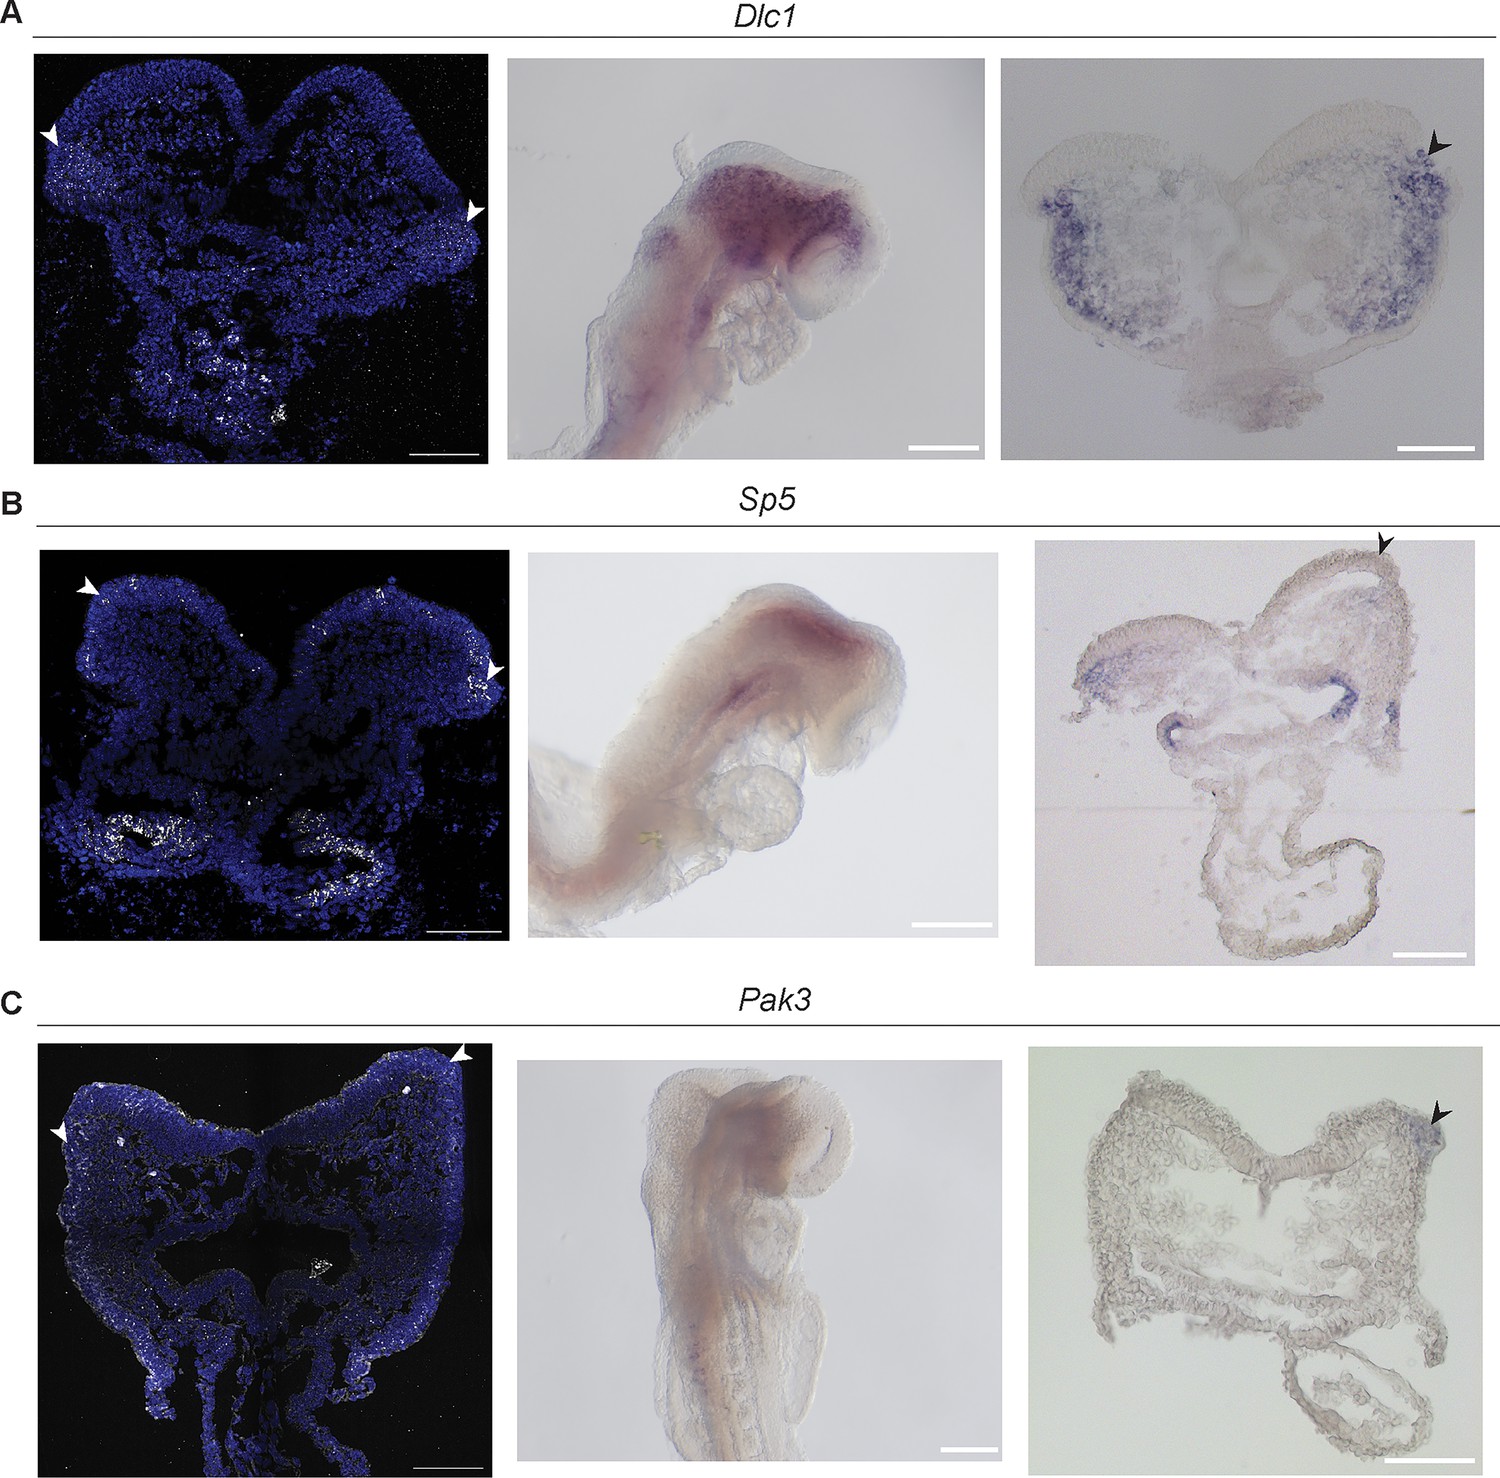
Expression of intermediate neural crest cell (NCC) markers Dlc1, Sp5, and Pak3 by signal amplification by exchange reaction for multiplexed fluorescent in situ hybridization (SABER-FISH) and traditional in situ hybridization in E8.5 mouse embryos and cranial sections.
Arrowheads indicate positive signals in the dorsolateral neuroepithelium. (A) Dlc1 signal was observed in the dorsolateral region of the neuroepithelium as well as in cells just outside of the neuroepithelium in the underlying mesenchyme. (B) Sp5 expression is localized within the neuroepithelium and underlying dorsal mesenchyme. (C) Pak3 expression is observed in ectodermal tissues including the neuroectoderm or neuroepithelium. Scale bars: whole embryos 100 µm; embryo sections 100 µm.
Figure 6 with 1 supplement
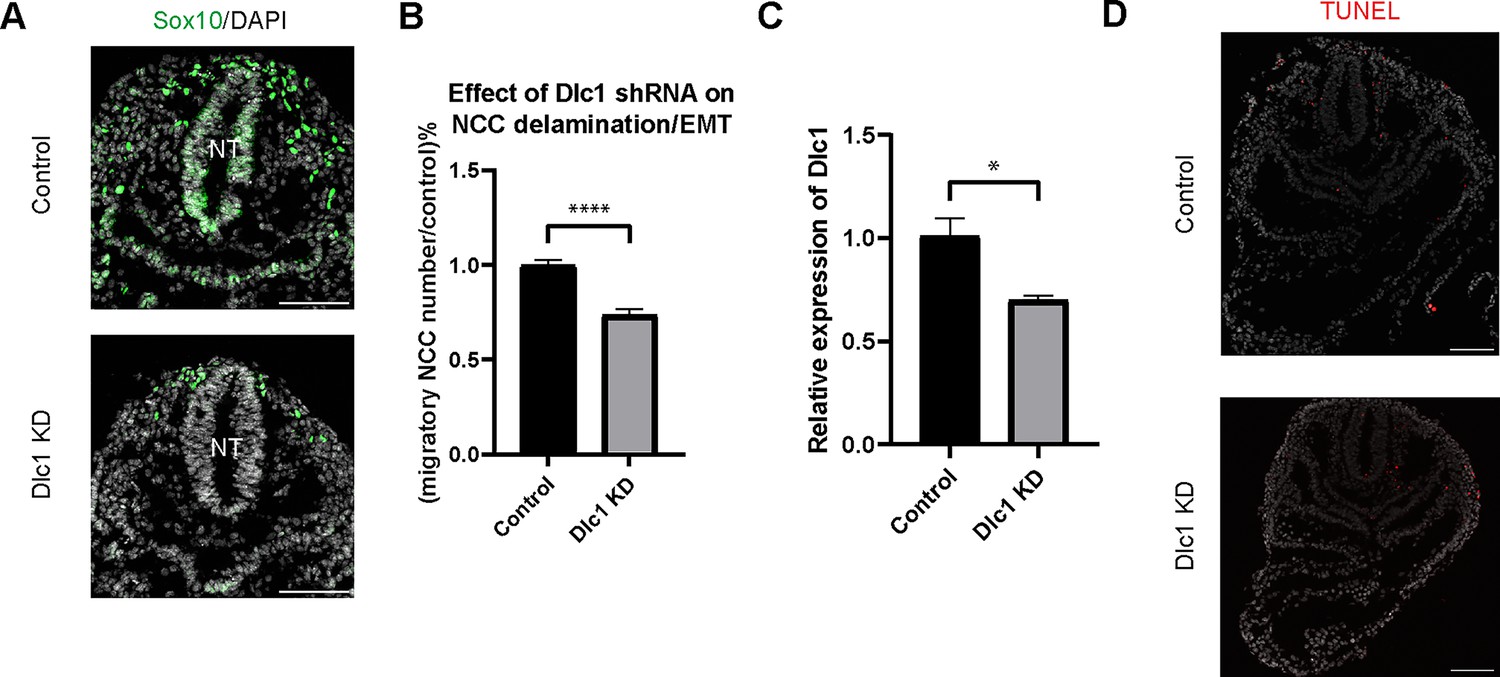
Dlc1 plays a regulatory role in mouse cranial neural crest cell (NCC) epithelial to mesenchymal transition (EMT) and delamination.
(A) Sox10 immunostaining was performed on cranial sections of E8.5 control and Dlc1 knockdown mouse embryos. (B) Dlc1 knockdown significantly reduced the number of migratory NCC compared to the control. The number of Sox10+ migratory NCC was quantified in control (n=4) and all Dlc1 knockdown (n=12) embryos. All datapoints in Dlc1 knockdown samples were normalized to the control samples. ****p<0.0001. (C) Dlc1 shRNA-based lentiviruses achieved an average of 30% reduction of Dlc1 expression in all Dlc1 knockdown embryos based on quantitative reverse transcription-PCR (qRT-PCR) analysis. *p<0.05. (D) TUNEL staining showed minimal cell death in Dlc1 knockdown samples. Scale bars: embryo sections 100 µm.
Figure 6—figure supplement 1

Dlc1 plays a regulatory role in mouse cranial neural crest cell (NCC) epithelial to mesenchymal transition (EMT) and delamination.
(A) Dlc1 splice-variant a, Dlc1 splice-variant b, and Dlc1 splice-variant c, shRNA-based lentiviruses consistently achieved 30% reduction of Dlc1 expression based on quantitative reverse transcription-PCR (qRT-PCR) analysis. *p<0.05. (B) Embryos injected with Dlc1 splice-variant a, Dlc1 splice-variant b, and Dlc1 splice-variant c, shRNA-based lentiviruses consistently showed significantly fewer migratory NCC compared to the control. The number of Sox10+ migratory NCC was quantified in control (n=4), Dlc1 splice-variant a, (n=4), Dlc1 splice-variant b (n=4), and Dlc1 splice-variant c (n=4) embryos. All datapoints in Dlc1 splice-variant a, Dlc1 splice-variant b, and Dlc1 splice-variant c samples were normalized to the control samples. *p<0.05, ****p<0.0001.
Tables
Key resources table
| Reagent type (species) or resource | Designation | Source or reference | Identifiers | Additional information |
|---|---|---|---|---|
| Gene (Mus. musculus) | Dlc1 | GenBank | MGI:MGI:1354949 | |
| Strain, strain background (M. musculus) | Wnt1-Cre | The Jackson Laboratory | RRID:IMSR_JAX:003829 | |
| Strain, strain background (M. musculus) | RosaeYFP | The Jackson Laboratory | RRID:IMSR_JAX:006148 | |
| Strain, strain background (M. musculus) | Mef2c-F10N-LacZ | doi: https://doi.org/10.1016/j.ydbio.2015.02.022; Aoto et al., 2015 | ||
| Cell line (Homo sapiens) | 293T | ATCC | CRL-3216 | |
| Biological sample (M. musculus) | Mouse embryonic cranial tissues | This paper | Freshly isolated from E8.5 mouse embryos | |
| Antibody | Anti-GFP (Rabbit polyclonal) | Invitrogen | Cat#: A-6455 | IF(1:500) |
| Antibody | Anti-GFP (Rabbit monoclonal) | Invitrogen | Cat#: G10362 | IF(1:500) |
| Antibody | Anti-rabbit IgG (H+L) Cross-Adsorbed Secondary Antibody, Alexa Fluor 488 (Goat polyclonal) | Invitrogen | Cat#: A-11008 | IF(1:500) |
| Antibody | DAPI | Sigma-Aldrich | Cat#: D9564 | IF(1:1200) SABER-FISH(1:1000) |
| Antibody | Anti-mouse SOX10 (Rabbit monoclonal) | Abcam | Cat#: ab155279 | IF(1:500) |
| Antibody | Anti-human phospho-Histone H3 (Mouse monoclonal) | Millipore | Cat#: 05–806 | IF(1:500) |
| Antibody | Anti-mouse secondary antibody Alexa Fluor 546 (Goat) | Invitrogen | Cat#: A21045 | IF(1:500) |
| Antibody | Anti-rat secondary antibody Alexa Fluor 647 (Goat) | Invitrogen | Cat#: A21267 | IF(1:500) |
| Antibody | Anti-Mouse IgG (H+L) Highly Cross-Adsorbed Secondary Antibody, Alexa Fluor Plus 647 (Donkey polyclonal) | Invitrogen | Cat#: #A32787 | IF(1:500) |
| Recombinant DNA reagent | Dlc1 (plasmid) | doi: https://doi.org/10.1016/j.febslet.2004.12.090 | ISH; Dr. Marian Durkin | |
| Recombinant DNA reagent | Pak3 (plasmid) | doi: https://doi.org/10.2337/db13-0384 | ISH; Dr. Gerard Gradwohl | |
| Recombinant DNA reagent | Sp5 (Plasmid) | doi: https://doi.org/10.1371/journal.pone.0087018 | ISH; Dr. Terry Yamaguchi | |
| Recombinant DNA reagent | shRNA to Dlc1 | GeneCopoeia | Cat#: MSH100727-LVRU6MP | |
| Sequence-based reagent | Dlc1_F | This paper | qRT-PCR primer | AGCGGCTGTGAAAGAAA |
| Sequence-based reagent | Dlc1_R | This paper | qRT-PCR primer | GCATTACCCTTGGAGAAGA |
| Sequence-based reagent | B2M_F | This paper | qRT-PCR primer | CACTGACCGGCCTGTATGC |
| Sequence-based reagent | B2M_R | This paper | qRT-PCR primer | GGTGGCGTGAGTATACTTGAATTTG |
| Sequence-based reagent | CANX_F | This paper | qRT-PCR primer | CCAGACCCTGATGCAGAGAAG |
| Sequence-based reagent | CANX_R | This paper | qRT-PCR primer | CCTCCCATTCTCCGTCCATA |
| Sequence-based reagent | Sox10 | other; Kishi et al., 2019 | Oligo pools for SABER-FISH designed and ordered through IDT using stringent settings as previously described | |
| Sequence-based reagent | Wnt1 | other; Kishi et al., 2019 | Oligo pools for SABER-FISH designed and ordered through IDT using stringent settings as previously described | |
| Sequence-based reagent | Dlc1 | other; Kishi et al., 2019 | Oligo pools for SABER-FISH designed and ordered through IDT using stringent settings as previously described | |
| Sequence-based reagent | Sp5 | other; Kishi et al., 2019 | Oligo pools for SABER-FISH designed and ordered through IDT using stringent settings as previously described | |
| Sequence-based reagent | Pak3 | other; Kishi et al., 2019 | Oligo pools for SABER-FISH designed and ordered through IDT using stringent settings as previously described | |
| Commercial assay or kit | In Situ Cell Death Detection Kit, TMR red | Roche | #12156792910 | |
| Commercial assay or kit | Click-iT Plus EdU Cell Proliferation Kit for Imaging, Alexa Fluor 555 dye | Invitrogen | Cat#: C10638 | |
| Commercial assay or kit | Qiagen miRNeasy Micro Kit | Qiagen | Cat#: 217084 | |
| Commercial assay or kit | SuperScript III First-Strand Synthesis System | Invitrogen | Cat#: 18080051 | |
| Chemical compound, drug | Aphidicolin | Sigma-Aldrich | Cat#: A0781 | (0.5 ug/ml) |
| Chemical compound, drug | Ampicillin | Amresco | Cat#: 0339 | (100 ug/ml) |
| Chemical compound, drug | PerfeCTa SYBR Green FastMix | Quantbio | Cat#: 95072–250 | |
| Chemical compound, drug | Tissue Rinse Solution A | Millipore | Cat#: BG-8-A | |
| Chemical compound, drug | Tissue Rinse Solution B | Millipore | Cat#: BG-8-B | |
| Chemical compound, drug | Tissue Stain Base Solution | Millipore | Cat#: BG-8-C | |
| Software, algorithm | FIJI/ImageJ | Fiji | https://imagej.net/software/fiji/ | |
| Software, algorithm | RStudio | Posit | https://posit.co/download/rstudio-desktop/ | |
| Other | VECTASHIELD Antifade Mounting Medium with DAPI | Vector Laboratories | Cat#: H-1200 | |
| Other | Tissue-Tek O.C.T. Compound | VWR | Cat#: 25608–930 | |
| Other | Anti-Digoxigenin-AP, Fab fragments | Roche | 11093274910 | ISH(1:2000) |
Additional files
-
Supplementary file 1
Summary table of key neural crest cell (NCC) development related genes and reporters, organized by their expression in the neuroepithelium, neural plate border, and migrating NCC (MNCC), as determined by single-cell RNA sequencing.
- https://cdn.elifesciences.org/articles/92844/elife-92844-supp1-v1.docx
-
Supplementary file 2
Summary table of forward and reverse primers used for quantitative reverse transcription-PCR (qRT-PCR) of Dlc1, B2M, CANX.
- https://cdn.elifesciences.org/articles/92844/elife-92844-supp2-v1.docx
-
MDAR checklist
- https://cdn.elifesciences.org/articles/92844/elife-92844-mdarchecklist1-v1.pdf
Download links
A two-part list of links to download the article, or parts of the article, in various formats.
Downloads (link to download the article as PDF)
Open citations (links to open the citations from this article in various online reference manager services)
Cite this article (links to download the citations from this article in formats compatible with various reference manager tools)
Identification and characterization of intermediate states in mammalian neural crest cell epithelial to mesenchymal transition and delamination
eLife 13:RP92844.
https://doi.org/10.7554/eLife.92844.3


