The evolution of olfactory sensitivity, preferences, and behavioral responses in Mexican cavefish is influenced by fish personality
- Paris-Saclay Institute of Neuroscience, CNRS and University Paris-Saclay, France
Figures
Figure 1

Experimental setup for testing behavioral responses to olfactory stimulation in individual, 6-week-old, A. mexicanus larvae.
(A) Each fish is placed individually in 150 ml water in a rectangular test box placed on an infrared light emitting table. Control or odorant solution are delivered at the two extremities of the box, inside tubes covered with a net. Medium- to high-throughput behavioral testing is achieved by parallel recording of 32 test boxes placed under 8 infrared (IR) recording cameras (4 test boxes per camera). (B) After 1 hr or 24 hr habituation, the test consists of 1 hr IR video recording. The first 30 min provide the control/baseline behavior of individual fish. Odorant stimulation is given at 30 min, and the behavioral responses are recorded for 30 more minutes.
Figure 2 with 3 supplements

Basal swimming behaviors of 6-week-old cavefish (CF), surface fish (SF), and F2 hybrids (F2).
(A) Examples of typical and distinctive basal swimming patterns exhibited by A. mexicanus morphotypes. The behavioral patterns (random, wall following, circles, thigmotactism) and the individual fish shown are indicated. Each pattern is best described by the combination of three types of representations. (1) The top left track shows the displacement of the fish along the x-axis of the box, representing back-and-forth swims along its long dimension. (2) The bottom left track is the top view, 2D representation of the trajectory. (3) The right track is the 2D plus time (color-coded) representation and helps, for example, to discern between wall following and thigmotactism. (B) Distribution of basal swimming pattern displayed by SF, F2, and CF after 1 hr or after 24 hr of habituation. Numbers of fish tested are indicated. The elementary color code is indicated (R in blue, WF in red, C in green, T in yellow). Exact swimming patterns and combinations are given on the colored plots (Figure 2—figure supplement 2 for the full color code). Fisher’s exact tests for statistical comparisons between groups. Of note, in this and subsequent figures, the swimming pattern color code does not relate whatsoever with the time color code used in the 2D plus time representation of swimming tracks such as in panel A. (C) Box plots showing the swimming speed in SF (blue), F2 (green), and CF (red), after 1 hr or 24 hr of habituation. Values are mean speed calculated over a period of 15 min. Numbers of fish tested are indicated. Mann-Whitney tests p-values are shown. (D) Examples of the stability of the basal swimming pattern over 4 experimental days in three individuals, with 24 hr of habituation time. One SF displaying random pattern, one CF displaying wall following, and one F2 displaying thigmotactism+random swim are shown.
-
Figure 2—source data 1
Raw data file describing the mean swimming speed (averaged between the 10th and the 25th minute of recording) and the baseline swimming patterns of fish on the first day of experimental testing, after 1 hr or 24 hr of habituation.
- https://cdn.elifesciences.org/articles/92861/elife-92861-fig2-data1-v1.zip
-
Figure 2—source data 2
Raw data file describing the baseline swimming patterns of fish on 4 consecutive days of experimental testing (d1 to d4), after 24 hr of habituation.
- https://cdn.elifesciences.org/articles/92861/elife-92861-fig2-data2-v1.zip
Figure 2—figure supplement 1
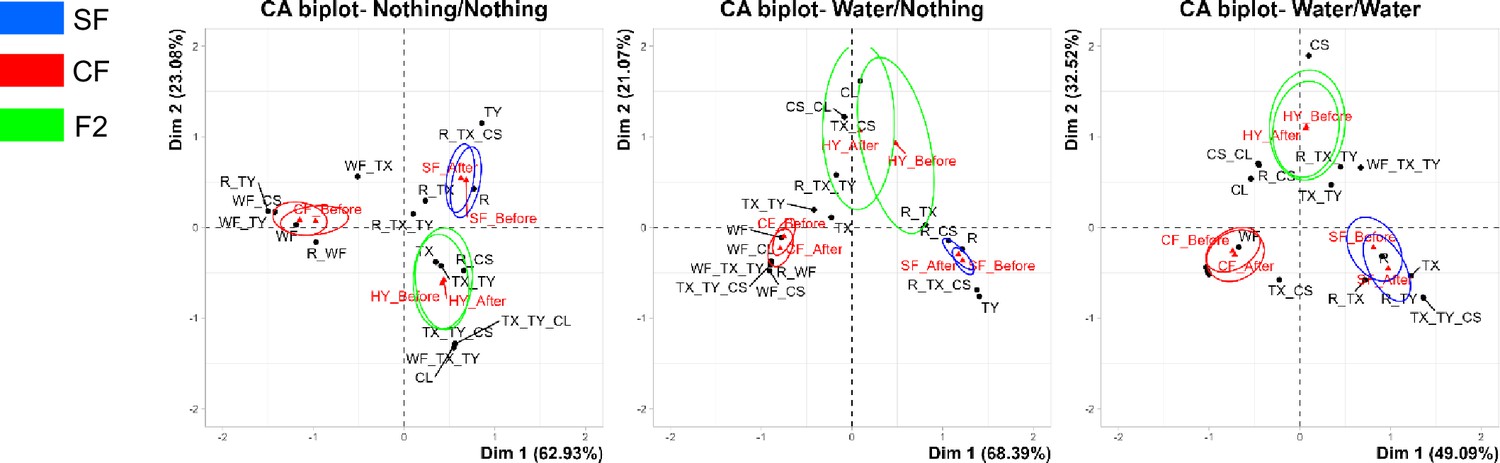
Correspondence analyses (CA) for assessment of behavioral pattern differences between morphs and behavioral pattern change after different stimuli.
Confident ellipses for each condition in the behavioral space are shown in blue for surface fish (SF), green for F2 hybrids, red for cavefish (CF). The conditions are indicated at the top of the graphs. Control experiments. CA shows that behavioral patterns in the three types of fish are clearly distinctive in the behavioral space: confidence ellipses are strictly non-overlapping. Moreover, CA confirms that for the three types of fish, the swimming pattern does not vary along the 1 hr test when no injection is made (nothing/nothing), when water is injected on one side (water/nothing), or when water is injected on both sides (water/water). In all cases, confidences ellipses overlap in the ‘before’ and ‘after’ condition. These analyses fully confirm the results shown in Figures 2B and 3B with the colored bar plot representation.
Figure 2—figure supplement 2
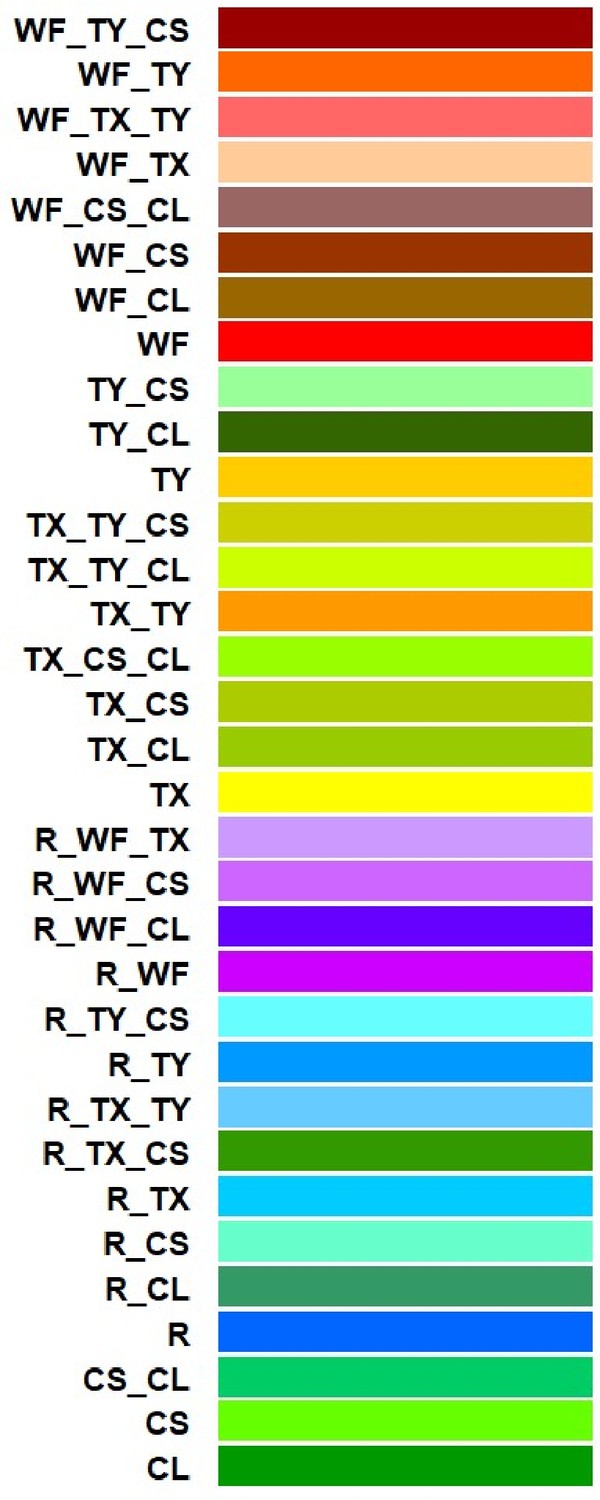
Complete color code for the description of baseline swimming patterns.
The color code is also valid for all the following figures.
Figure 2—figure supplement 3
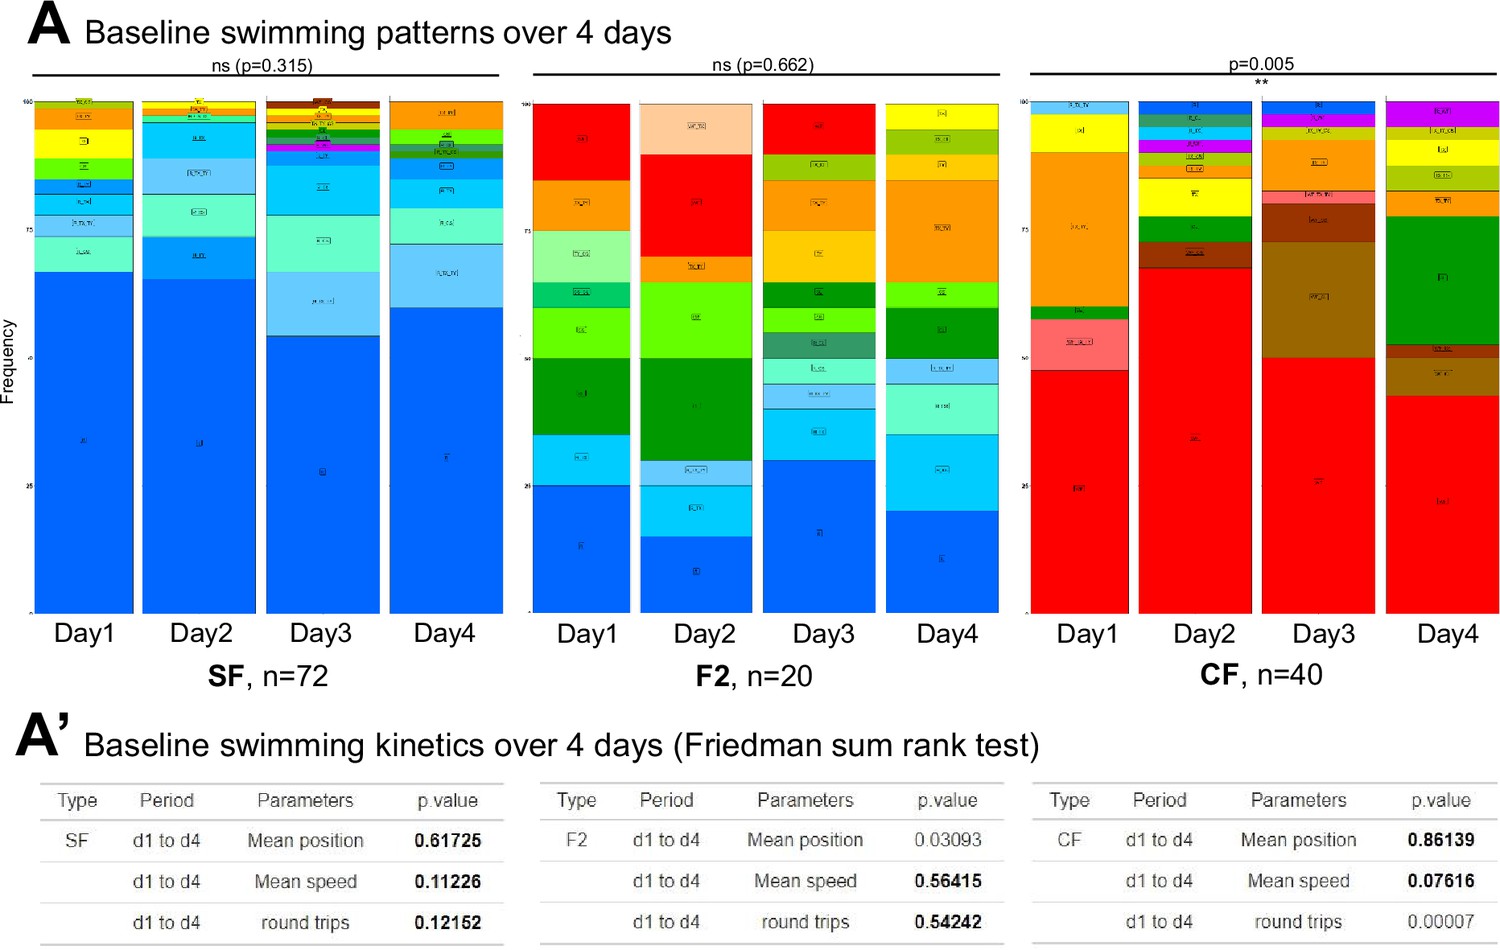
Stability of swimming patterns over time.
(A) Distribution of swimming patterns exhibited by surface fish (SF), F2 hybrids (F2), and cavefish (CF) (number of fish tested is indicated) along 4 testing days, with 24 hr habituation time. Fisher’s exact tests. The color code for the different swimming patterns and combinations is given in the inset below. The table in A’ shows statistics summary for paired comparison of individual’s mean position, swimming speed, and the total number of round trips in X plus Y over 4 testing days, using Friedman tests. The results of additional pairwise Wilcoxon comparisons between different days are as follows. All these pairwise comparisons were NS except for CF round trip numbers (d1/d2 p=0.04; d1/d3 p=0.0009; all other comparisons NS) and F2 position (d1/d3 p=0.022; d3/d4 p=0.042). These results suggest that fish display individual swimming behaviors that are stable through time and may be considered as individual swimming personality or temperament.
Figure 3 with 1 supplement

Controls on the olfactory setup and solution delivery method.
(A) Lack of behavioral response in a representative cavefish (CF) individual after injection of water on one side of the test box. (B) Lack of change in qualitative swimming pattern displayed by surface fish (SF), CF, and F2 hybrids (F2), before and after water injection on one side. Fisher’s exact tests. (C) Lack of change in quantitative swimming kinetics in SF (blue), CF (red), and F2 (green), before (pale colors) and after (dark colors) water injection on one side. In this and the following graphs, box plots show the swimming speed, the fish position along the X-axis of the test box, and the numbers of back-and-forth swims along the X (length) and Y (width) axes of the box. All values are averaged over a 15 min period, either before or after the injection. A thin line links the value ‘before’ and the value ‘after’, for each individual. Numbers of fish tested are indicated on the ‘speed’ box plots. Numbers next to dots indicate the identity of outlier individuals.
Figure 3—figure supplement 1
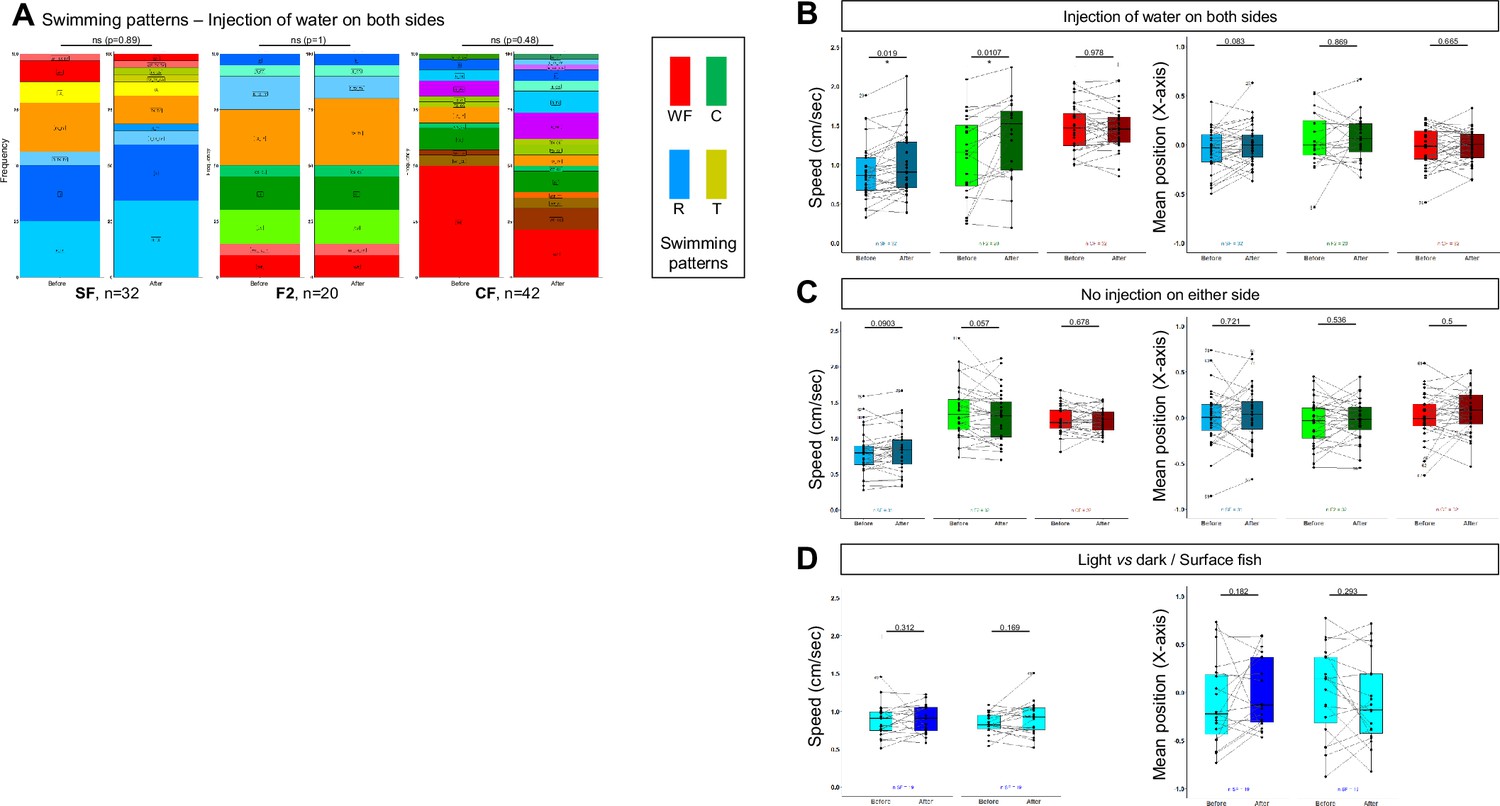
Additional controls for experimental design.
(A) Lack of change in swimming pattern displayed by surface fish (SF), cavefish (CF), and F2 hybrids (F2), before and after water injection on both sides. Fisher’s exact tests. (B) Global lack of change in quantitative swimming kinetics in SF (blue), F2 (green), and CF (red), before and after water injection on both sides. Mean speed and mean position are shown. (C) Lack of change in quantitative swimming kinetics in SF, CF, and F2 when no injection is performed at all. Mean speed and mean position are shown. The result suggests that an individual’s behavior is stable throughout the 1 hr test. (D) Lack of change in swimming speed or position on the box when SF are recorded in the dark (dark blue), in the light (light blue), or when the light is switched off after 30 min.
Figure 4 with 2 supplements

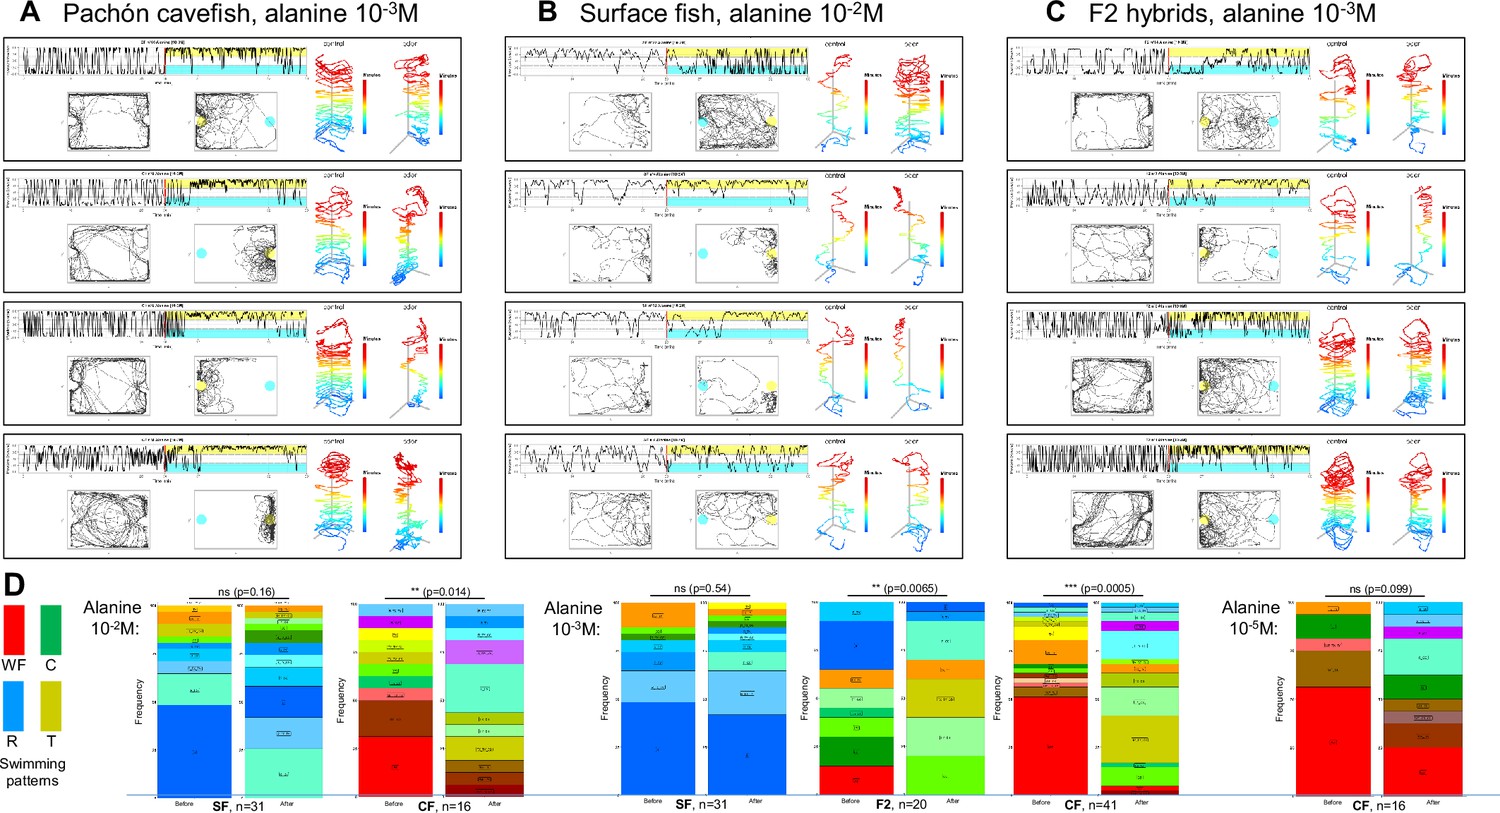
Behavioral responses to alanine of 6-week-old cavefish (CF), surface fish (SF), and F2 hybrids (F2).
(A–C) Representative individual responses of CF, SF, and F2 after injection of alanine at the indicated concentrations. In the two left graphs of each panel, the blue color indicates the water/control injection side and the yellow color indicates the alanine injection side. (D–G) Box plots showing swimming speed (D), mean position along the X-axis (E) and the number of back-and-forth trips in X and Y (F,G) in SF (blue), CF (red), and F2 (green), before (lighter color) or after (darker color) the injection of alanine at the indicated concentration. Values are calculated over a 15 min period. Black lines link the ‘before odor’ and ‘after odor’ value for each individual. Numbers close to black dots indicate the identity of outlier individuals. p-Values from paired Mann-Whitney tests are shown. The number of fish tested is indicated. (H) Change in swimming patterns exhibited by SF and CF after injection of alanine 10–4 M. Fisher’s exact tests.
-
Figure 4—source data 1
Raw data file describing behavioral responses of fish to various concentrations of different amino acids.
The position in the box, the swimming speed, the number of round trips in X and Y as well as the swimming patterns are given before (between the 10th and the 25th minute of recording) and after (between the 37th and the 52th minute of recording) odor injection.
- https://cdn.elifesciences.org/articles/92861/elife-92861-fig4-data1-v1.zip
Figure 4—figure supplement 1
Additional examples of behavioral responses to alanine.
(A) Examples of cavefish (CF) responses to alanine 10–3 M (intermediate concentration). Note the reproducible switch in position toward the odorant side in the box (yellow shading) and the change in behavioral pattern. Note that CF n°8, which was tested twice with the same concentration of alanine, switched from wall following to small circles and thigmotactism along the Y border of the box in both cases. CF n°4 on the other hand swam in large circles before injection, and changed its pattern to display intense thigmotactism accompanied with a few circles. (B) Examples of surface fish (SF) responses to alanine 10–2 M (high concentration). Upon injection, SF show changes in swimming patterns and increase their swimming speed, suggesting that the stimulus was perceived. SF n°22 swam very actively randomly. SF n°4 switched from random with small circles to circles plus thigmotactism. SF n°12 added thigmotactism to its random pattern upon stimulus. Some SF, like SF n°8, did not seem to respond, even at such high alanine concentration. (C) Examples of F2 hybrids (F2) responses to alanine 10–3 M (intermediate concentration). F2 n°14 did not appear to move its position to the odorant part of the box, but a striking change in swimming pattern from intense thigmotactism to random swim was observed. F2 n°7 explored close to the odor source and decreased swimming speed. F2 n°3 and 1 switched from wall following to circles with thigmotactism associated to a change in position toward the odor side. (D) Change in swimming patterns displayed by SF, F2, and CF after injection of alanine 10–2 M, 10–3 M, and 10–5 M. Fisher’s exact tests.
Figure 4—figure supplement 2
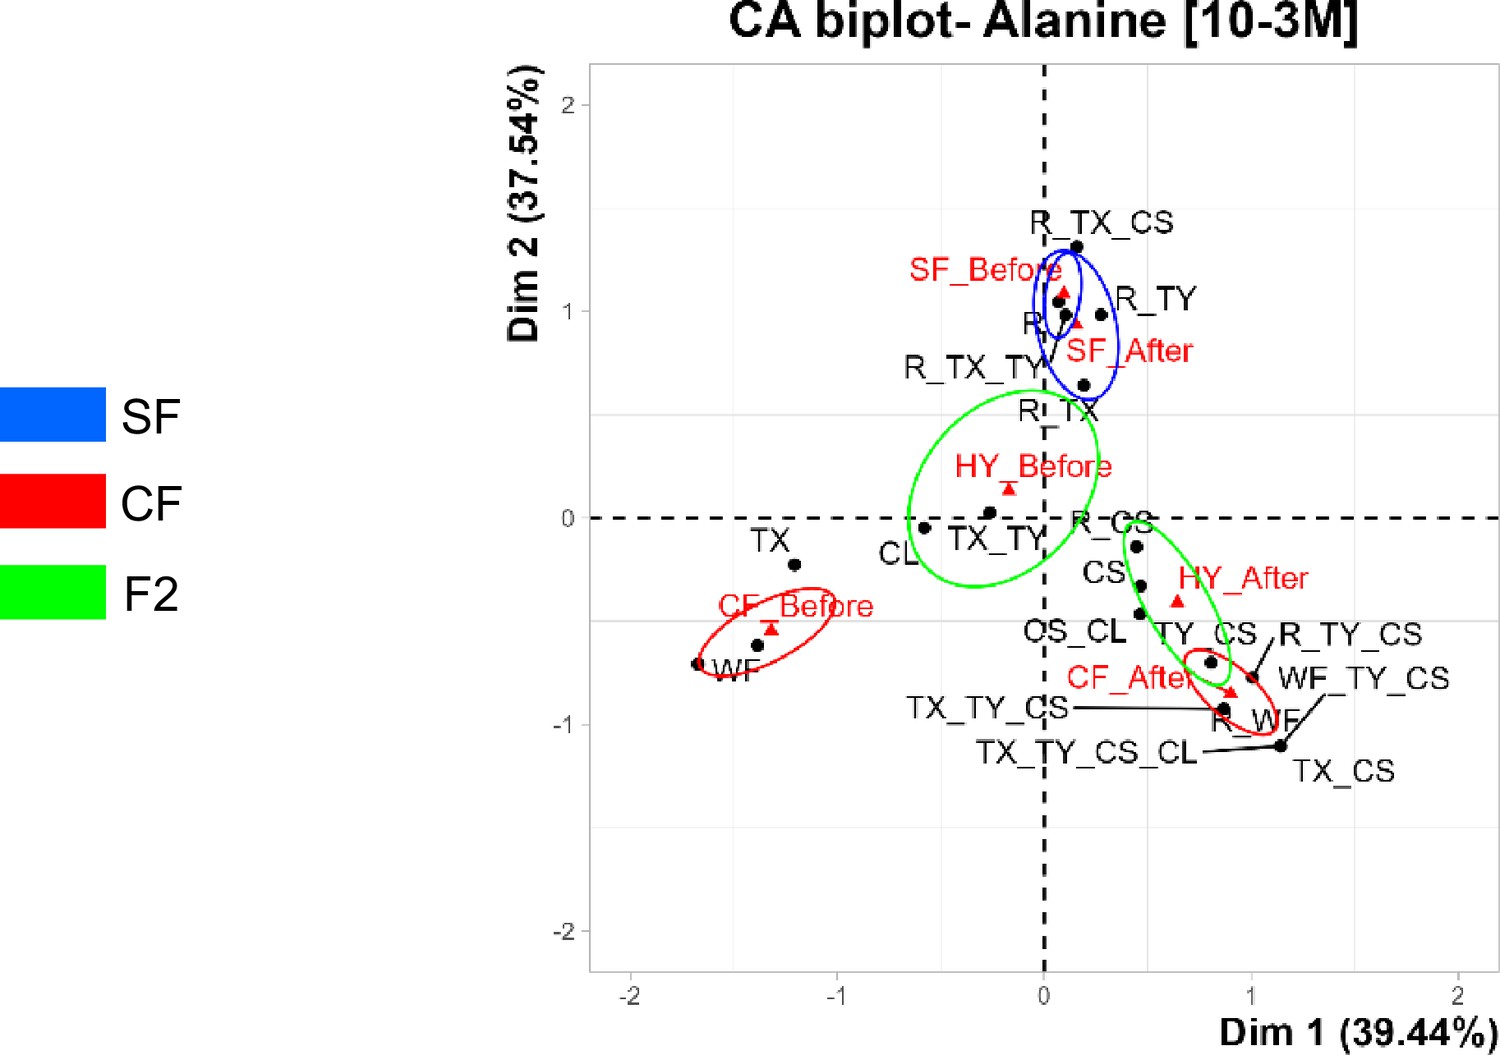
Correspondence analyses (CA) for assessment of behavioral pattern change after alanine injection.
Confident ellipses for each condition in the behavioral space are shown in blue for surface fish (SF), green for F2 hybrids, red for cavefish (CF). The conditions are indicated at the top of the graphs.Odor stimulation experiments (alanine). Overlap of confidence ellipses indicate a lack of change in behavioral pattern after odor stimulus, whereas separated confidence ellipses indicate a change in behavioral pattern after odor stimulus. The CA fully confirms the results shown in Supplementary file 1 (summary) and Figure 4 with the colored bar plot representation.
Figure 5 with 2 supplements

Behavioral responses to serine and cysteine 10–2 M.
(A,B and H,I) Representative individual responses of cavefish (CF) and surface fish (SF) after injection of serine (A,B) or cysteine (H,I) at high concentration (10–2 M). In the two left graphs, the blue color indicates the water/control injection side and the green (serine) or red (cysteine) color indicates the injection side. (C–F and J–M) Box plots showing swimming speed (C,J), mean position along the X-axis (D,K), and the number of back-and-forth trips in X and Y (EL and FM) in SF (blue), CF (red), and F2 hybrids (F2) (green), before (lighter color) or after (darker color) injection of serine 10–2 M (C–F) or cysteine 10–2 M (J–M). Values are calculated over a 15 min period. Black lines link the ‘before odor’ and ‘after odor’ value of each individual fish. Numbers close to black dots indicate the identity of outlier individuals. p-Values from paired Mann-Whitney tests are shown. The number of fish tested is indicated. (G and N) Change in swimming patterns elicited after injection of 10–2 M serine (G) or cysteine (N) in SF and CF (F2 not shown). Fisher’s exact tests.
-
Figure 5—source data 1
Raw data file describing behavioral responses of fish to various concentrations of different amino acids.
The position in the box, the swimming speed, the number of round trips in X and Y as well as the swimming patterns are given before (between the 10th and the 25th minute of recording) and after (between the 37th and the 52th minute of recording) odor injection.
- https://cdn.elifesciences.org/articles/92861/elife-92861-fig5-data1-v1.zip
Figure 5—figure supplement 1
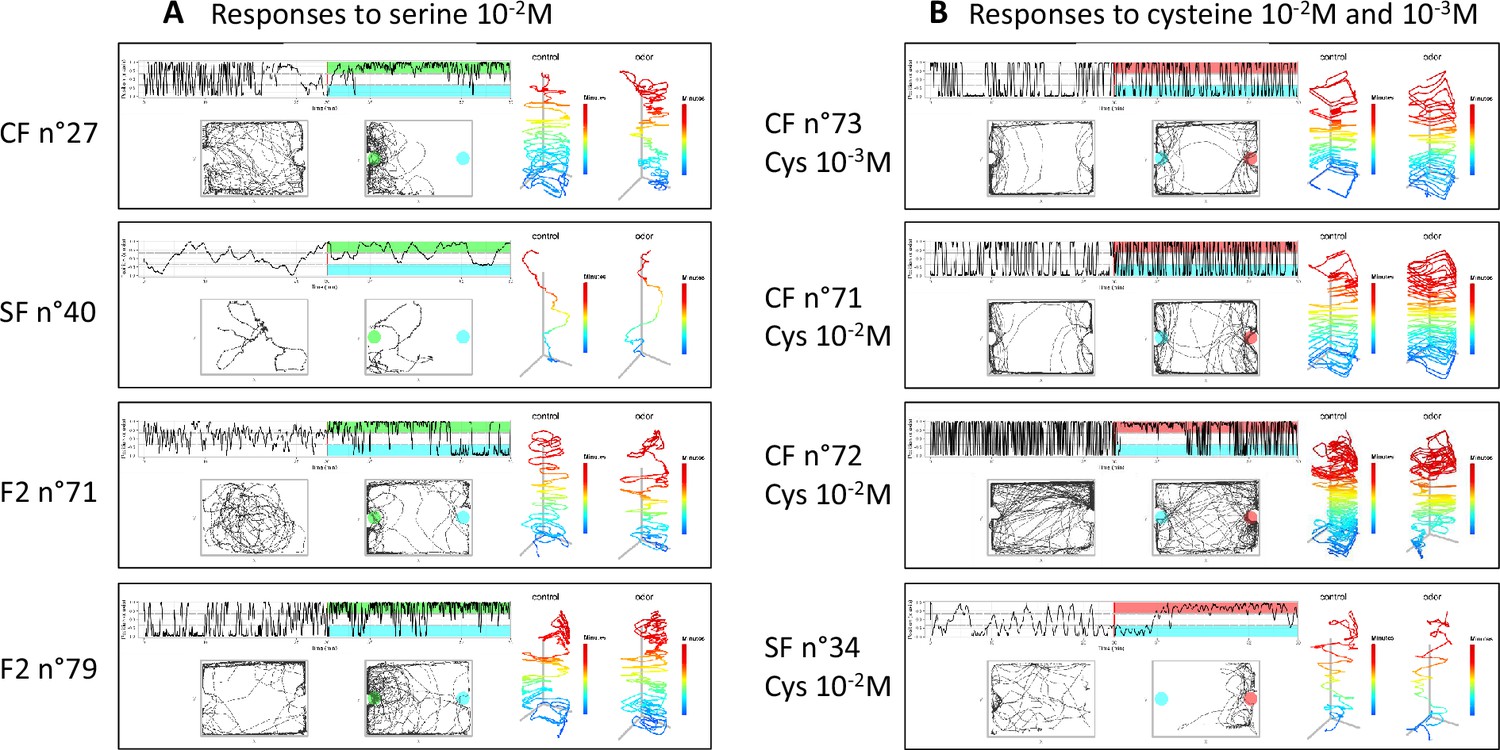
Additional examples of behavioral responses to serine and cysteine.
(A) Responses to serine 10–2 M (high concentration). Note the change in behavioral pattern and position in the box observed in cavefish (CF) and F2 hybrids (F2) but not in surface fish (SF). The two F2 shown had different baseline swimming patterns: circles in F2 n°71, thigmotactism in F2 n°79. Yet, both individuals showed a change in swim pattern and an attraction to the serine side of the box. (B) Responses to cysteine 10–2 M (high concentration) and 10–3 M (intermediate concentration). CF n°73 gives an example of an individual that did not respond to 10–3 M cysteine: no change in position, no change in pattern, no change in swim kinetics. CF n°71 and CF n°72 on the other hand did respond to cysteine 10–2 M, the former by an increase in activity, the latter by a transient change in position. SF n°34 is a rare example of an SF that was attracted to cysteine.
Figure 5—figure supplement 2
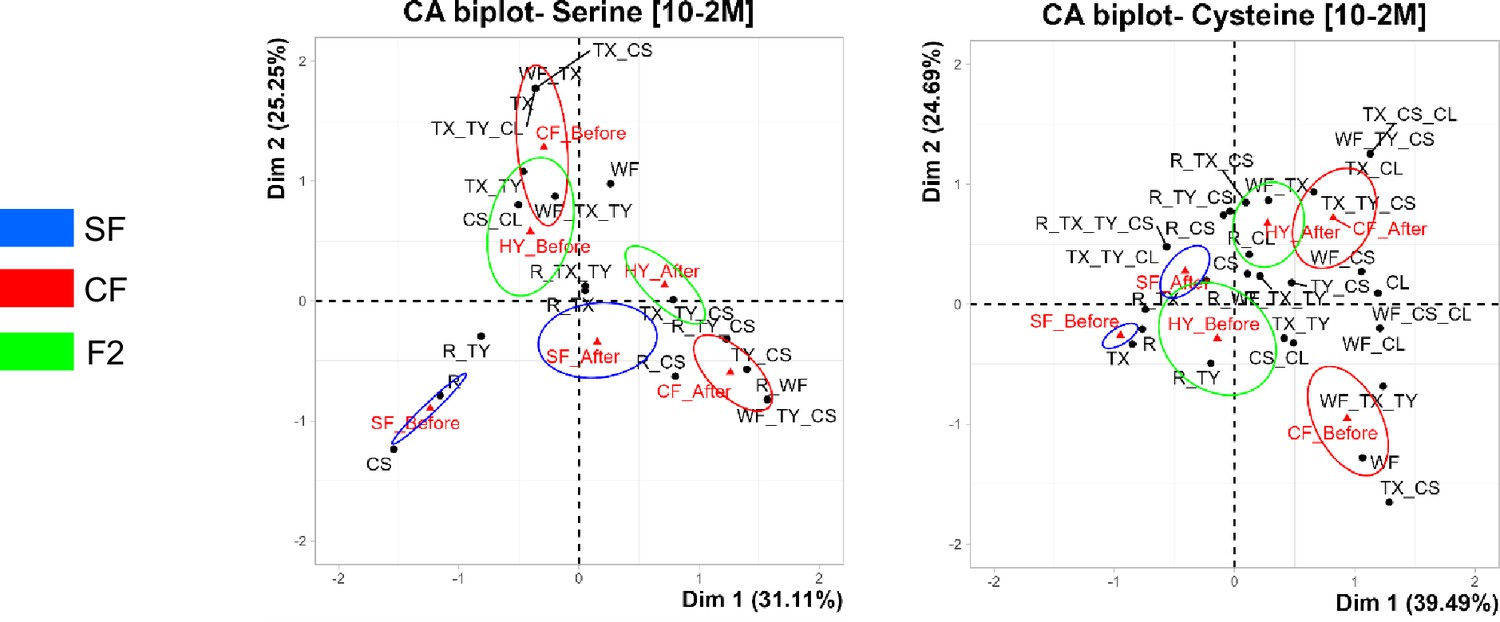
Correspondence analyses (CA) for assessment of behavioral pattern change after serine and cysteine injection.
Confident ellipses for each condition in the behavioral space are shown in blue for surface fish (SF), green for F2 hybrids, red for cavefish (CF). The conditions are indicated at the top of the graphs. Odor stimulation experiments (serine and cysteine). Overlap of confidence ellipses indicate a lack of change in behavioral pattern after odor stimulus, whereas separated confidence ellipses indicate a change in behavioral pattern after odor stimulus. The CA fully confirms the results shown in Supplementary file 1 (summary) and Figure 5 with the colored bar plot representation.
Figure 6 with 2 supplements

Behavioral responses to lysine, histine, and leucine 10–2 M.
(A–D) Box plots showing swimming speed (A), mean position along the X-axis (B), and the number of back-and-forth trips in X and Y (CD) in surface fish (SF) (blue), cavefish (CF) (red), and F2 hybrids (F2) (green), before (lighter color) or after (darker color) the injection of the indicated amino acid. Values are calculated over a 15 min period. Black lines link the ‘before odor’ and ‘after odor’ value of each individual fish. Numbers close to black dots indicate the identity of outlier individuals. p-Values from paired Mann-Whitney tests are shown. The number of fish tested is indicated. See Figure 6—figure supplement 1 for examples of representative individual responses. (E–G) Change in swimming patterns elicited after injection of 10–2 M lysine (E) or histidine (F) or leucine (G) in SF, CF, and F2. Fisher’s exact tests.
-
Figure 6—source data 1
Raw data file describing behavioral responses of fish to various concentrations of different amino acids.
The position in the box, the swimming speed, the number of round trips in X and Y, as well as the swimming patterns are given before (between the 10th and the 25th minute of recording) and after (between the 37th and the 52th minute of recording) odor injection.
- https://cdn.elifesciences.org/articles/92861/elife-92861-fig6-data1-v1.zip
Figure 6—figure supplement 1
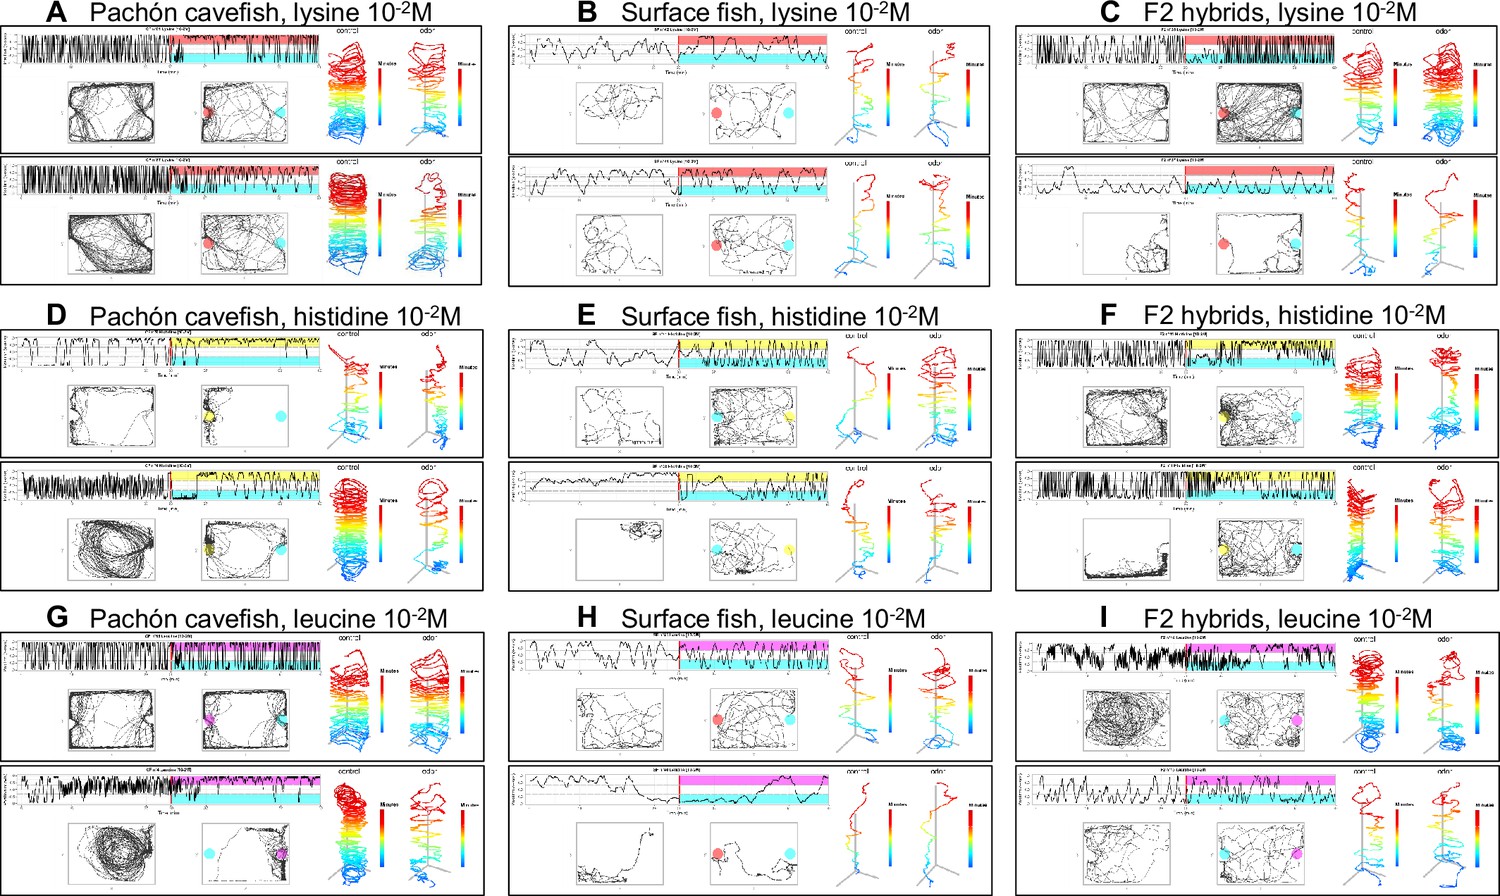
Examples of behavioral responses to lysine (ABC), histidine (DEF), and leucine (GHI) 10–2 M (high concentration).
In each panel, in the two left graphs, the blue color indicates the water/control injection side. The lysine injection side is shown in red, the histidine injection side is yellow, the leucine injection side is pink. (A) The two cavefish (CF) individuals shown decrease their swimming activity upon injection. Moreover, n°81 and 87 shift their position to the odor side of the box. A change in swimming pattern from intensive wall following to thigmotactism with circles and some random swimming is also observed. (B) The two surface fish (SF) individuals shown do not change their swimming pattern (random) or kinetics in response to lysine. (C) F2 hybrids (F2) n°35 increased swimming activity upon lysine injection but did not show attraction to odorant side. F2 n°37 kept its random pattern of swimming and was not attracted to the odorant side. (D) Whether the CF individual was initially displaying thigmotactism (CF n°8) or swimming in large circles (CF n°4), the response to histidine included decreasing the swimming activity and restricting locomotion to the odorant side of the box. (E) The two SF individuals shown swam slowly and randomly as baseline pattern. Both increased their activity and spent more time in the odorant side. (F) F2 n°11 and 1 were both attracted to histidine odorant side and they changed their swimming pattern. (G) CF n°65 showed no response, neither in activity, in position nor in pattern. CF n°4 drastically changed all swimming parameters. (H) SF showed little reaction to leucine. SF n°43 and 40 persisted in random swimming patterns, without change of position or swimming kinetics. (I) F2 n°16 and 13 had markedly different baseline patterns (large circles versus random swim, respectively). The former changed its pattern to less active and small circles, suggesting that it perceived leucine injection. The latter showed no behavioral response.
Figure 6—figure supplement 2
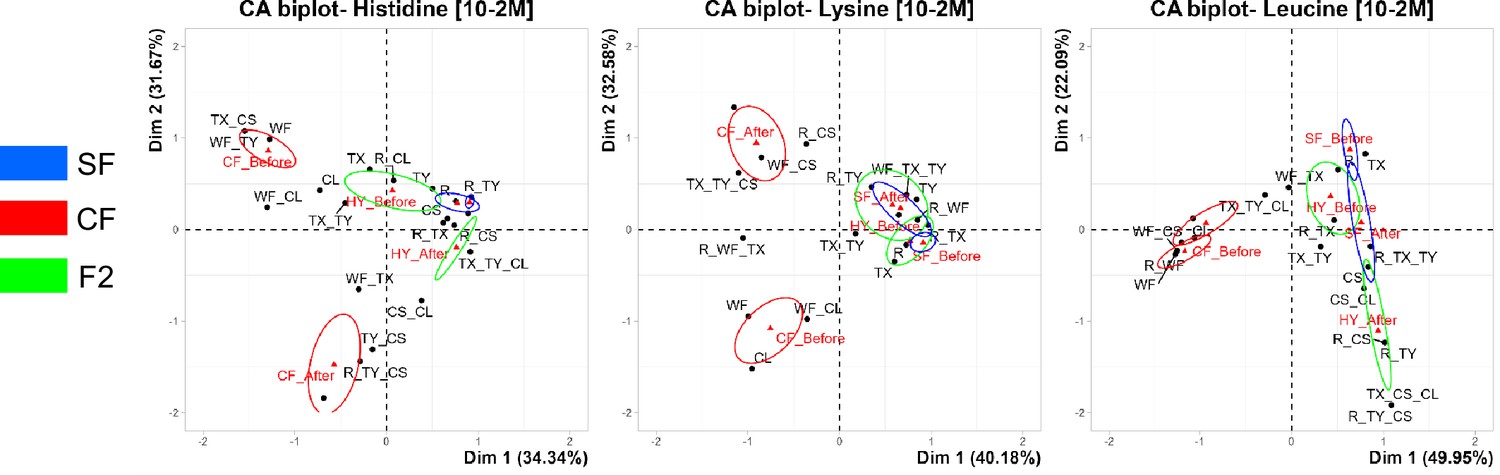
Correspondence analyses (CA) for assessment of behavioral pattern change after lysine, histidine, and leucine injection.
Confident ellipses for each condition in the behavioral space are shown in blue for surface fish (SF), green for F2 hybrids, red for cavefish (CF). The conditions are indicated at the top of the graphs. Odor stimulation experiments (lysine, histidine, leucine). Overlap of confidence ellipses indicate a lack of change in behavioral pattern after odor stimulus, whereas separated confidence ellipses indicate a change in behavioral pattern after odor stimulus. The CA fully confirms the results shown in Supplementary file 1 (summary) and Figure 6 with the colored bar plot representation.
Figure 7 with 1 supplement

Individual olfactory scores of surface fish (SF), cavefish (CF), and F2 hybrids (F2) for different odors.
(A) Graphs representing index values (i.e. the variation between the ‘before’ and the ‘after’ odor condition; the value 0 corresponds to no change) for the four response parameters (speed, thigmotactism in X and Y, position, and swim pattern) used to calculate the total individual olfactory score for each fish (last column of points on each graph). Each fish is depicted by a colored line linking its four different indexes and its final individual olfactory score. The dotted line at value 1.5 indicates the score threshold above which a fish is considered as a responder. The percentages in black and gray indicate the proportion of responders/non-responders, respectively. The colored lines of responders are bright, those of non-responders are pale. Amino acids and concentrations are indicated. Top row: CF; bottom row: SF. (B) Distributions of individual olfactory scores of SF (blue), CF (red), and F2 (green) for different odors. The threshold score (1.5) is indicated by a dotted line.
Figure 7—figure supplement 1
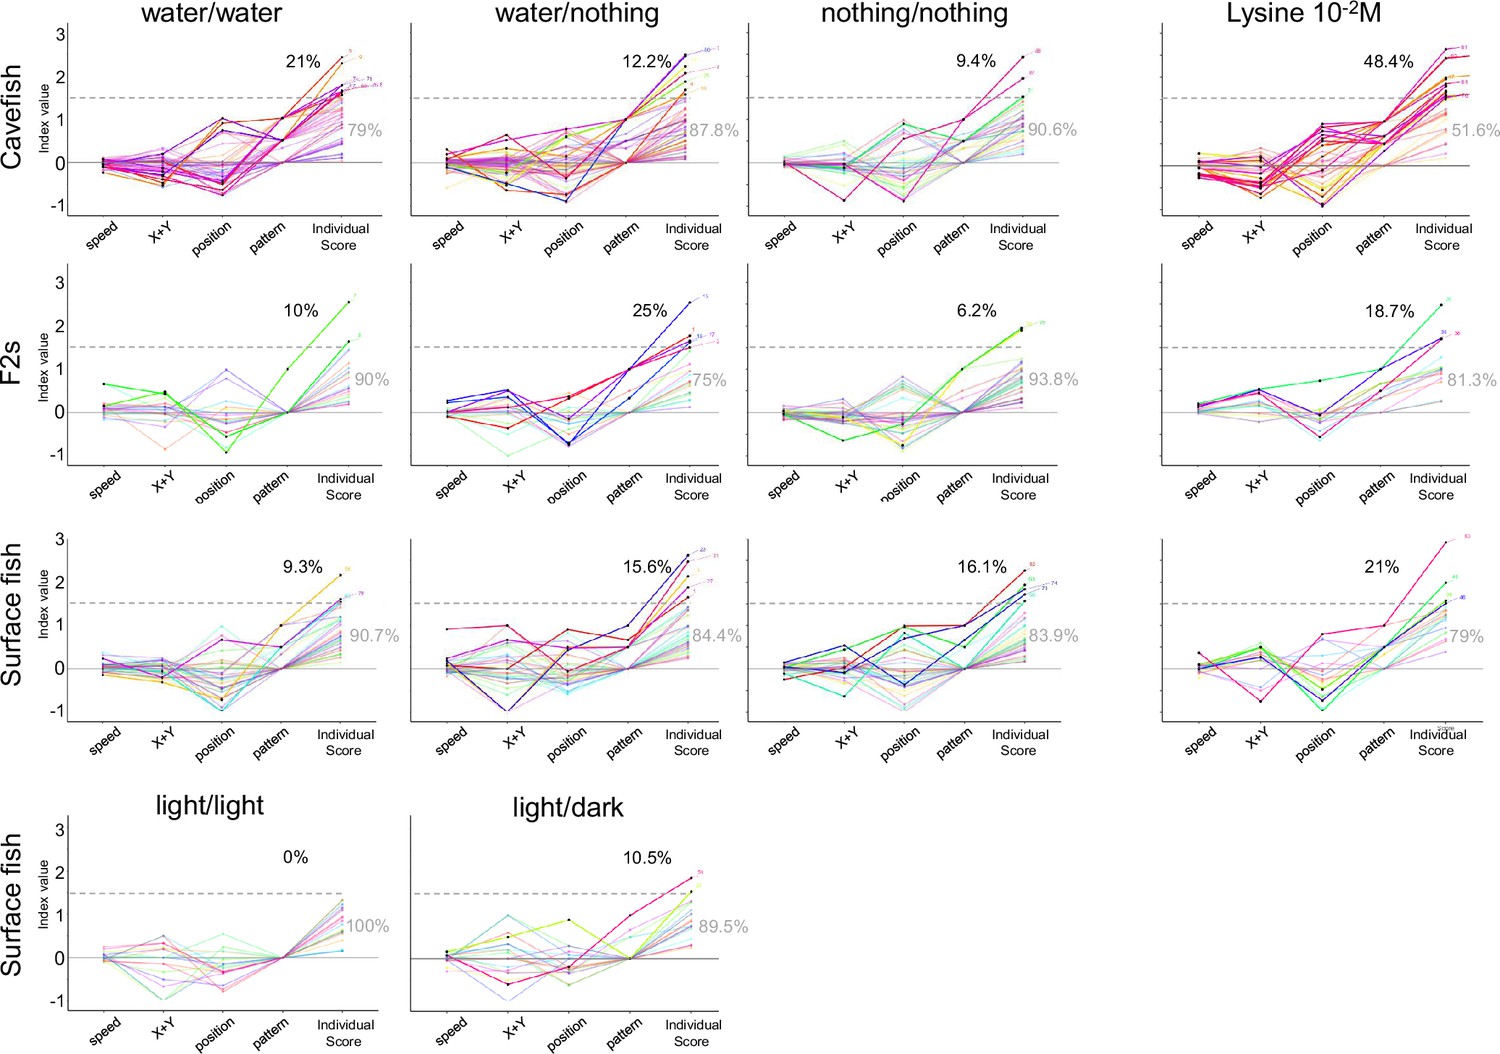
Individual olfactory scores of surface fish (SF), cavefish (CF), and F2 hybrids (F2) in control and experimental conditions.
The graphs represent index values for the four response parameters used to calculate the total individual olfactory score for each fish. Each fish is depicted by a colored line linking its four different indexes and its final individual olfactory score. Experimental conditions and fish types are indicated. The threshold value for olfactory score was set at 1.5 (dotted line), because very few individuals of the three fish types have scores above this value in control experiments when water is perfused in the box on both sides. The percentages in black and gray indicate the proportion of responders/non-responders, respectively. The colored lines of responders are bright, those of non-responders are pale.
Figure 8 with 1 supplement

The individual olfactory score is related to individual fish swimming personality.
(A) Box plots showing individual olfactory scores in surface fish (SF) (blue), F2 hybrids (F2) (green), and cavefish (CF) (red) as a function of their individual baseline swimming pattern. As stated in Methods, only amino acid conditions for which more than 40% of fish were responders (score >1.5) are pooled and plotted on this graph. Mann-Whitney two-tailed with Bonferroni post hoc tests were performed on each morphotype. (B) Regressions to explore the correlation between baseline swimming speed displayed by individual fish before odor injection and their individual olfactory score. Fish and amino acid type and concentrations are indicated. Linear correlations were calculated with Spearman’s rank correlation test followed by Student’s t test for the p-values. Conditions for which significant correlation was found are labeled with an asterisk. (C) The PVE (percentage of variation explained) on the individual score is plotted as a function of individual baseline behavior, to probe the predictability of the behavioral output as a function of ‘swimming pattern personality’. (D) The PVE on the individual score is plotted as a function of individual swimming speed, to probe the predictability of the behavioral output as a function of ‘locomotor activity personality’. Linear correlations were calculated with Spearman’s rank correlation test followed by Student’s t test for the p-values. Conditions for which significant correlation was found are labeled with an asterisk. SF (blue), F2 (green), and CF (red).
Figure 8—figure supplement 1
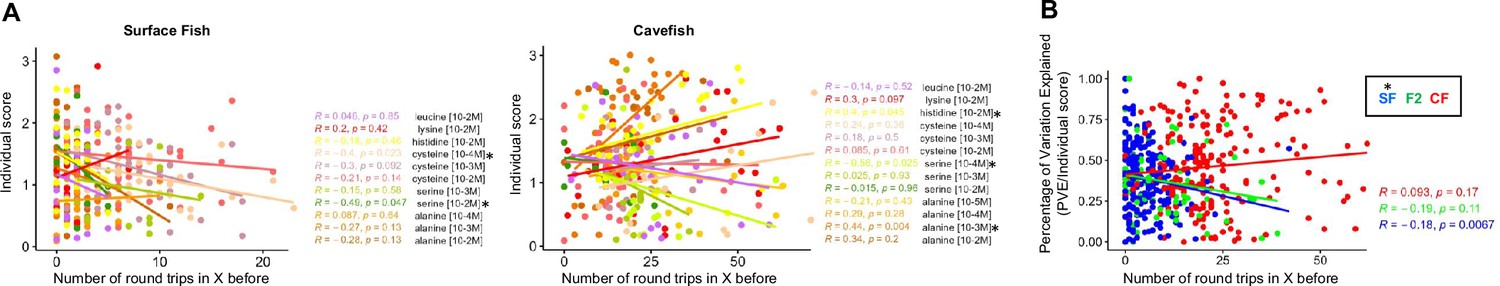
Relationships between the number of round trip in X and the olfactory score.
(A) Regressions to explore the correlation between baseline number of round trips in X displayed by individual fish before odor injection and their individual olfactory score. Fish and amino acid type and concentrations are indicated. Linear correlations were calculated with Spearman’s rank correlation test followed by Student’s t test for the p-values. Conditions for which significant correlation was found are labeled with an asterisk. (B) The PVE (percentage of variation explained) on the individual score is plotted as a function of individual swimming parameter (numbers of round trips in X), to probe the predictability of the behavioral output as a function of ‘locomotor activity personality’. Linear correlations were calculated with Spearman’s rank correlation test followed by Student’s t test for the p-values. Conditions for which significant correlation was found are labeled with an asterisk. Surface fish (SF) (blue), F2 hybrids (F2) (green), and cavefish (CF) (red).
Videos
Video 1
Infra-red video recorded for 4 CF, showing 30 sec of baseline behavior before odor injection, and 30 sec of olfactory response after injection of alanine 10-3 M on the left.
Additional files
-
MDAR checklist
- https://cdn.elifesciences.org/articles/92861/elife-92861-mdarchecklist1-v1.docx
-
Supplementary file 1
Summary of the results.
(A) Population level summary. For each amino acid and each concentration tested, arrows indicate whether the considered parameter has changed (increased or decreased). ns indicates no significant change, - indicates the condition was not tested in the fish type (SF in blue, CF in red, F2 in green). (B) Individual level summary. The percentage of fish displaying an individual olfactory score superior to 1.5 is indicated.
- https://cdn.elifesciences.org/articles/92861/elife-92861-supp1-v1.pdf
Download links
A two-part list of links to download the article, or parts of the article, in various formats.
Downloads (link to download the article as PDF)
Open citations (links to open the citations from this article in various online reference manager services)
Cite this article (links to download the citations from this article in formats compatible with various reference manager tools)
The evolution of olfactory sensitivity, preferences, and behavioral responses in Mexican cavefish is influenced by fish personality
eLife 12:RP92861.
https://doi.org/10.7554/eLife.92861.3


