Downregulation of Mirlet7 miRNA family promotes Tc17 differentiation and emphysema via de-repression of RORγt
- Immunology Graduate Program, Baylor College of Medicine, United States
- Department of Medicine, Immunology & Allergy Rheumatology, Baylor College of Medicine, United States
- Dan Duncan Comprehensive Cancer Center, Baylor College of Medicine, United States
- Department of Pathology and Immunology, Baylor College of Medicine, United States
- Center for Translational Research on Inflammatory Diseases, Michael E Debakey, Baylor College of Medicine, United States
- Department of Medicine, Section of Pulmonary and Critical Care, Baylor College of Medicine, United States
Figures
Figure 1

Repression of Mirlet7 gene clusters in lung T cells from chronic obstructive pulmonary disease (COPD) patients and murine models of emphysema.
(A) Schematic representation of the Mirlet7 polycistronic transcripts in humans and in mice are shown. (B) Expression analysis of MIRLET7A1HG and MIRLET7BHG from the publicly available lung transcriptome dataset from RNA-seq of COPD and control patients (GEO: GSE57148). (C) Quantitative RT-PCR (qPCR) of mature MIRLET7A from resected lung tissue of COPD (n = 15) and control subjects (n = 11). (D) qPCR and regression analysis of MIRLET7A, MIRLET7B, MIRLET7D, and MIRLET7F expression to emphysema severity score based on CT: 0 = no, 1 = upper lobes only, 2 = upper/middle lobes, 3 = extensive pan lobular emphysema (n = 19). (E) Schematic diagram of experimental emphysema in mice induced by either intranasal (i.n.) instillation of nanosized carbon black (nCB) or exposure to cigarette smoke (CS) by whole-body inhalation (w.b.i.). qPCR analysis for pri-Mirlet7a1/f1/d and pri-Mirlet7b/c2 from lung tissue or lung-derived CD8+ and CD4+ T cells of mice with emphysema elicited by (F) nCB or (G, H) CS (n = 3–6 per group). Data are representative of three independent experiments displayed as mean ± standard error of the mean (SEM). Mann–Whitney (B, C) or Student’s t-test (F–H). *p < 0.05, **p < 0.01, ***p < 0.001, ****p < 0.0001.
-
Figure 1—source data 1
Source data for Figure 1B–D, F–H.
- https://cdn.elifesciences.org/articles/92879/elife-92879-fig1-data1-v1.xlsx
Figure 2 with 2 supplements

Deletion of the Mirlet7bc2 cluster in T cells enhances nanosized carbon black (nCB)- or cigarette smoke (CS)-triggered emphysema.
(A) Schematic representation of let7bc2LOF and control mice. (B) Quantitative PCR (qPCR) analysis of pri-Mirlet7b/c2 from flow-sorted live, TCRβ+CD4+CD8+ double-positive (DP) thymocytes of control and let7bc2LOF mice (n = 3–5 per group). (C–G) Control and let7bc2LOF mice were exposed to phosphate buffered saline (PBS) or nCB over 4 weeks, or alternatively air or CS by whole-body inhalation of CS for 16 weeks. (C) Representative hematoxylin and eosin (H&E)-stained lung sections from PBS-, nCB-, or CS-exposed mice as indicated on each panel (×20 magnification; scale bars, 50 µm). (D, E) Mean linear intercept (MLI) measurement of lung morphometry. (F) Total and differential cell counts from bronchoalveolar lavage (BAL) fluid from controls and nCB-emphysemic mice (n = 4–7 per group). (G) Mmp9 and Mmp12 mRNA expression from BAL cells of air- and smoke-exposed control and let7bc2LOF mice (n = 4–6 per group). Data are representative of at least three independent experiments displayed as mean ± standard error of the mean (SEM) using Student’s t-test (B) or two-way analysis of variance (ANOVA) with post hoc Tukey correction (D–G). *p < 0.05, **p < 0.01, ***p < 0.001, ****p < 0.0001.
-
Figure 2—source data 1
Source data for Figure 2B, D–G.
- https://cdn.elifesciences.org/articles/92879/elife-92879-fig2-data1-v1.xlsx
Figure 2—figure supplement 1
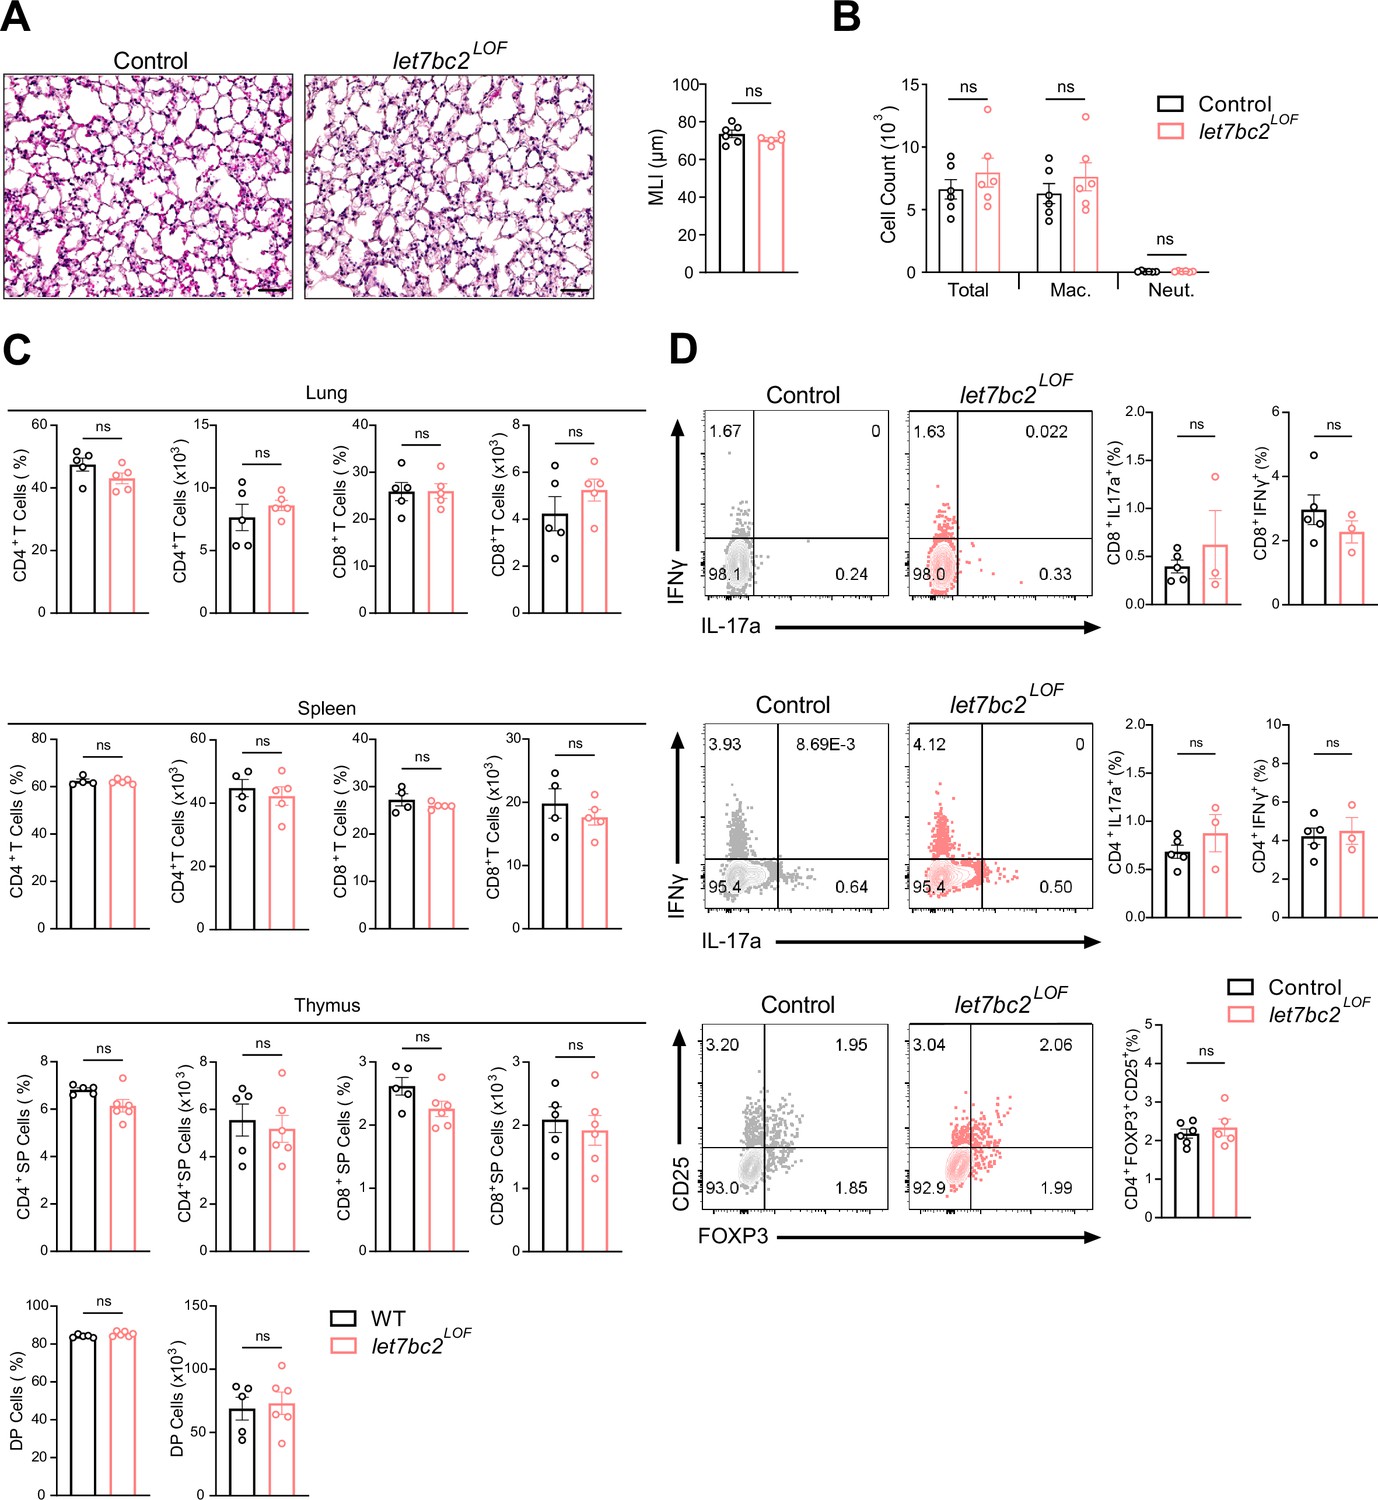
T cell-specific deletion of the Mirlet7bc2 does not promote lung inflammation or pathology with moderate aging.
(A) Representative hematoxylin and eosin (H&E)-stained lung sections from Control and let7bc2LOF naive mice aged to one year (×20 magnification; scale bars, 50 µm) with mean linear intercept (MLI) measurement of lung morphometry (n = 5–6 per group). (B) Total and differential cell count from bronchoalveolar lavage (BAL) fluid from indicated naive mice (n = 6 per group; Mac. = macrophages, Neut. = neutrophils). (C) Flow cytometric analysis of CD4+, CD8+, or double-positive (DP) T cells from the lungs, spleen, and thymus of mice at steady state (n = 4–6 per group). (D) Immunophenotyping of Tc17, Tc1, Th17, Th1, and Tregs from lungs of naive control and let7bc2LOF mice (n = 3–5 per group). Data are representative of three independent experiments and displayed as mean ± standard error of the mean (SEM) using Student’s t-test.
Figure 2—figure supplement 2

Pri-Mirlet7b/c2 expression in lung CD8+ T cells of naive and nanosized carbon black (nCB)-exposed mice.
(A) Quantitative PCR (qPCR) analysis of Pri-Mirlet7b/c2 from sorted lung CD8+ T cells of PBS vehicle- or nCB-treated control and let7bc2LOF mice (n = 3–6 per group). Data are representative of two independent experiments and displayed as mean ± standard error of the mean (SEM) using two-way analysis of variance (ANOVA) with post hoc Tukey correction. ****p < 0.0001.
Figure 3 with 1 supplement
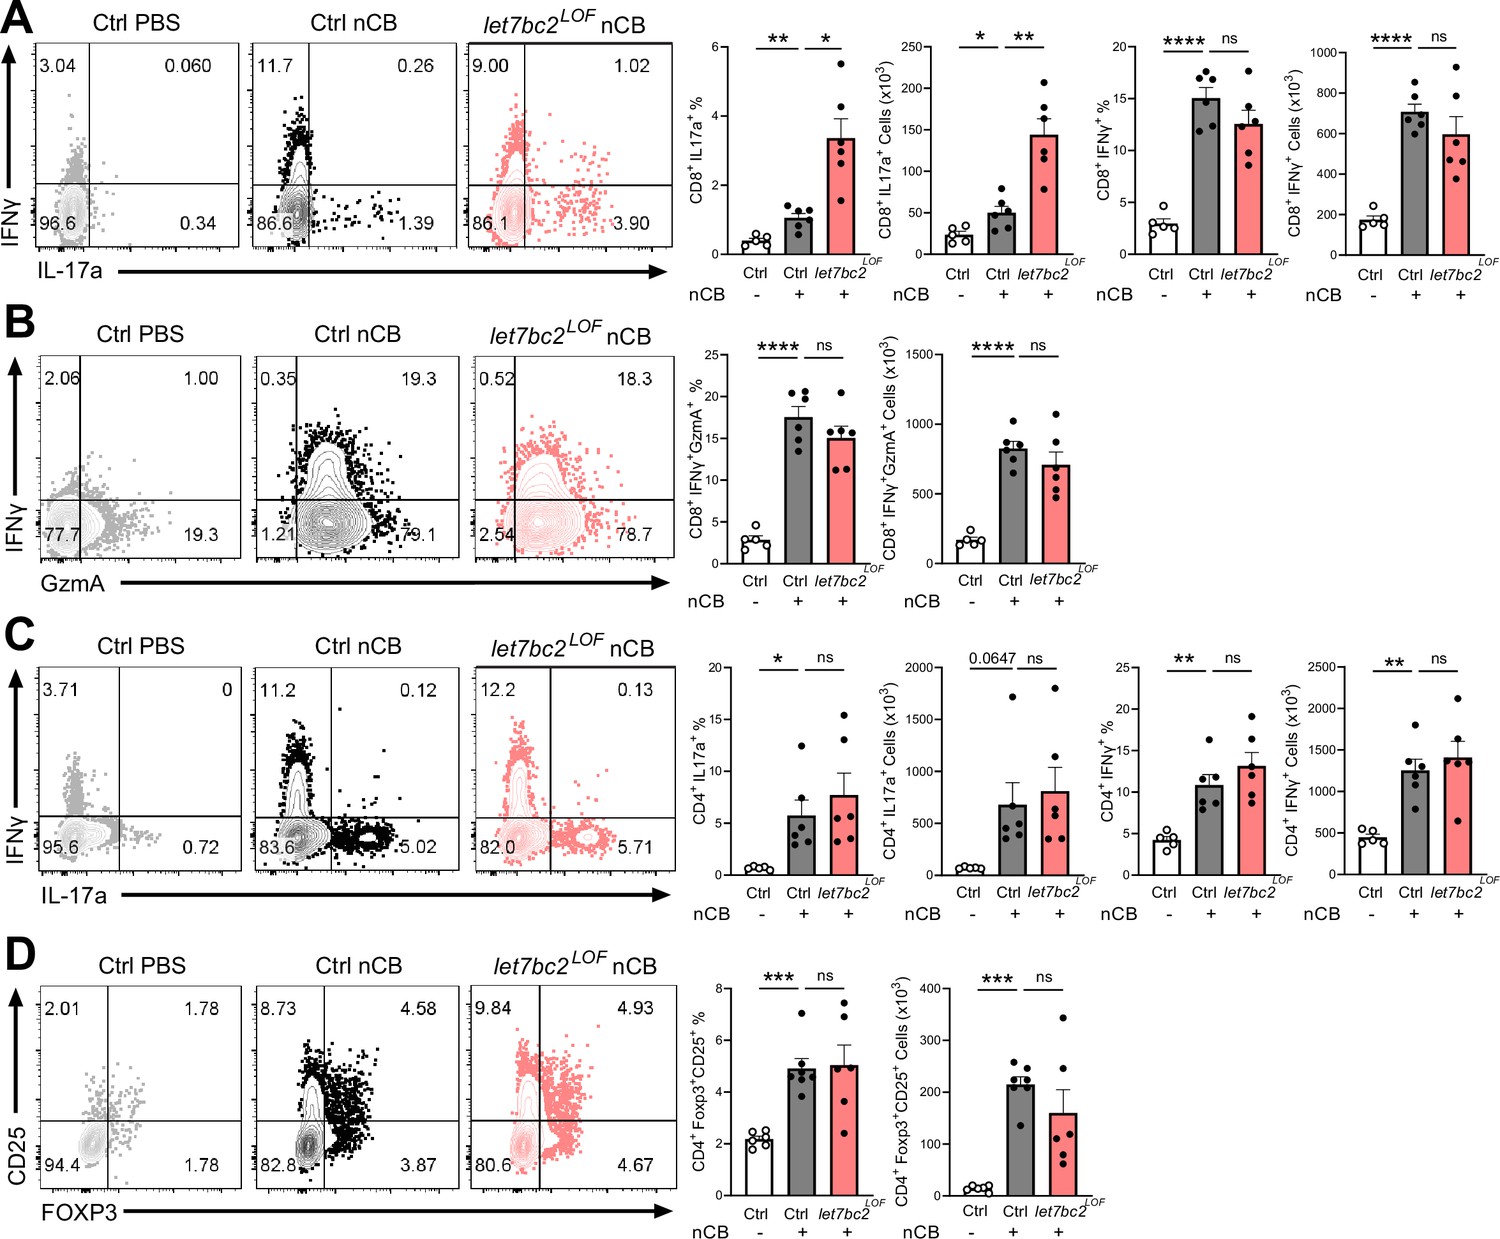
In vivo T cell ablation of the Mirlet7bc2 cluster enhances Tc17 inflammatory response to nanosized carbon black (nCB) emphysema.
Representative flow plots with percentage and counts of live TCRβ+ (A) CD8+IL-17a+ and CD8+IFNγ+, (B) CD8+IFNγ+GzmA+, (C) CD4+IL-17a+ and CD4+IFNγ+, and (D) CD4+FOXP3+CD25+ cells from the lungs of control (Ctrl) PBS vehicle- (n = 5–6), control nCB- (n = 6), and let7bc2LOF nCB-exposed mice. Data are representative of three independent experiments displayed as mean ± standard error of the mean (SEM) using analysis of variance (ANOVA) with post hoc Sidak correction. *p < 0.05, **p < 0.01, ***p < 0.001, ****p < 0.0001.
-
Figure 3—source data 1
Source data for Figure 3A–D.
- https://cdn.elifesciences.org/articles/92879/elife-92879-fig3-data1-v1.xlsx
Figure 3—figure supplement 1
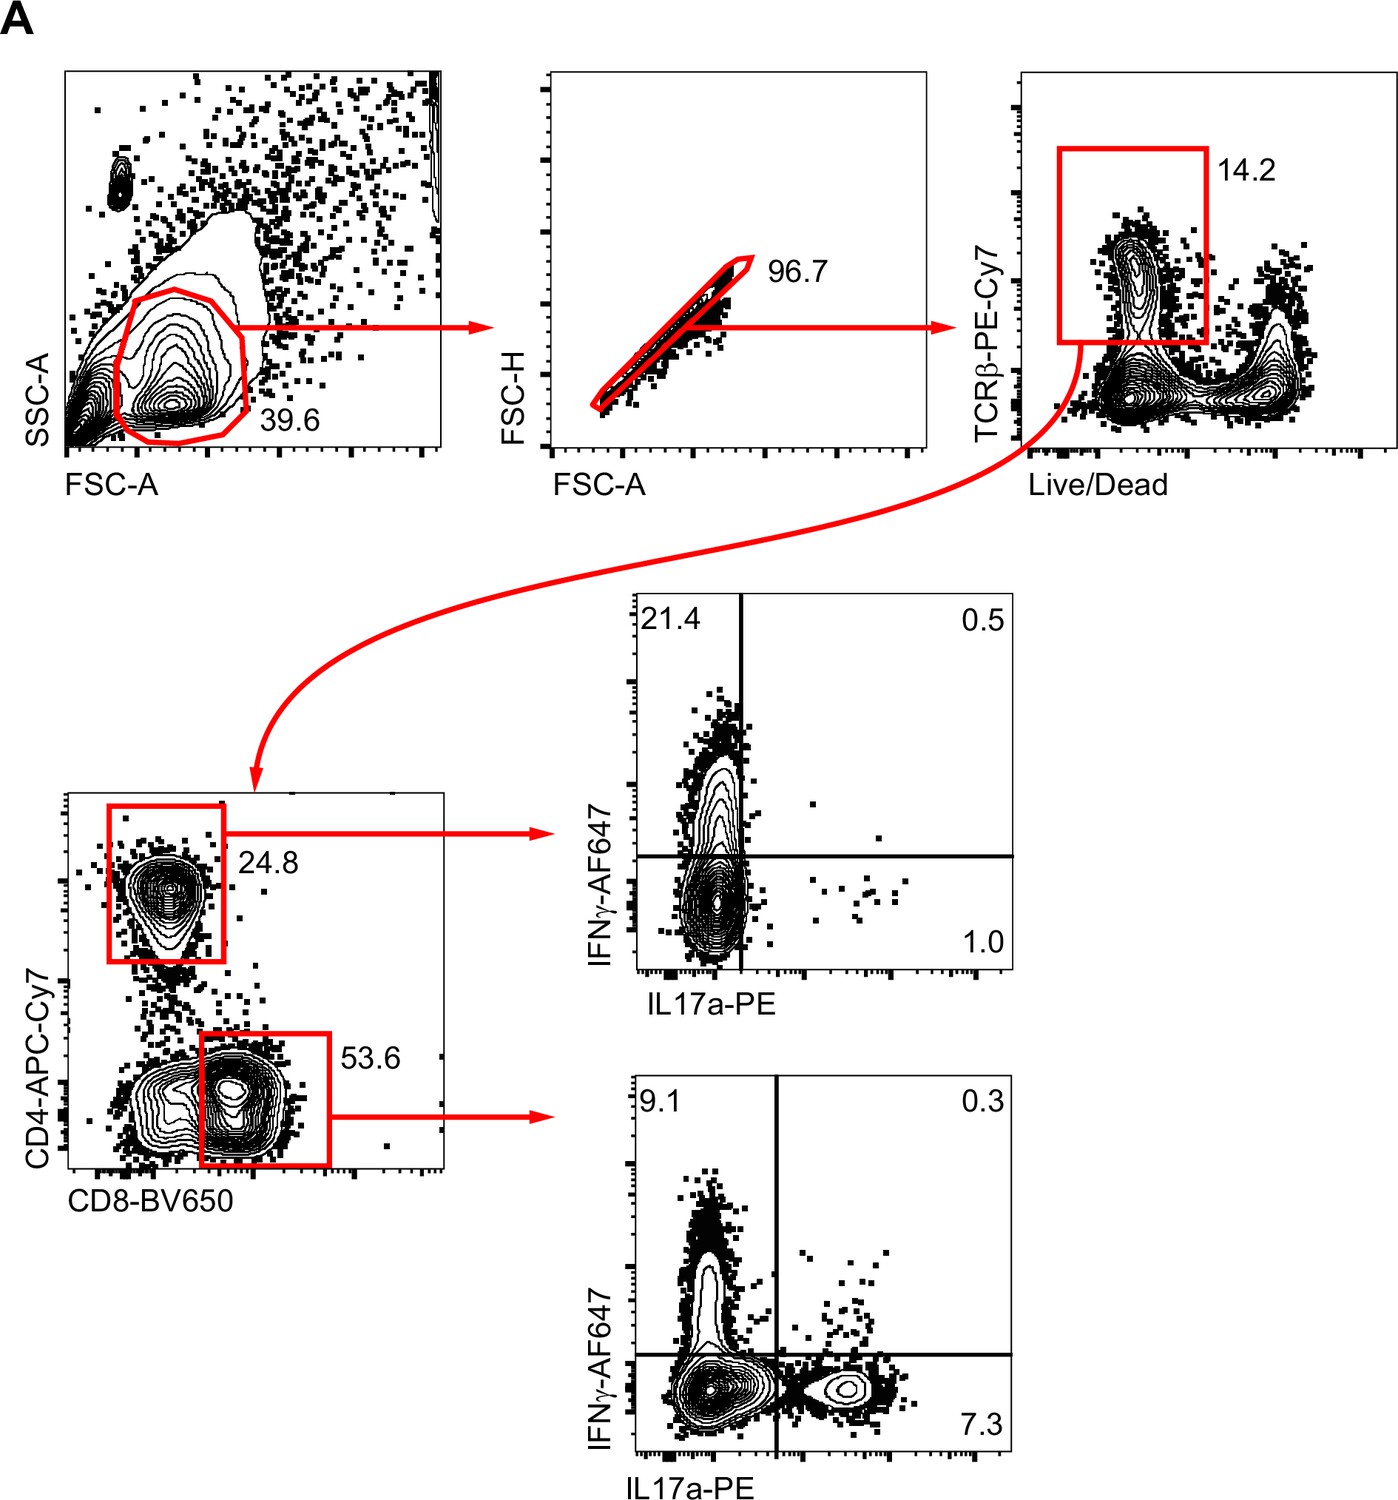
T cell flow cytometry gating.
(A) Representative flow cytometric gating and quantification strategy for detection of lung Th1/Th17 and Tc1/Tc17 cell populations is shown in wild-type mice.
Figure 4 with 1 supplement
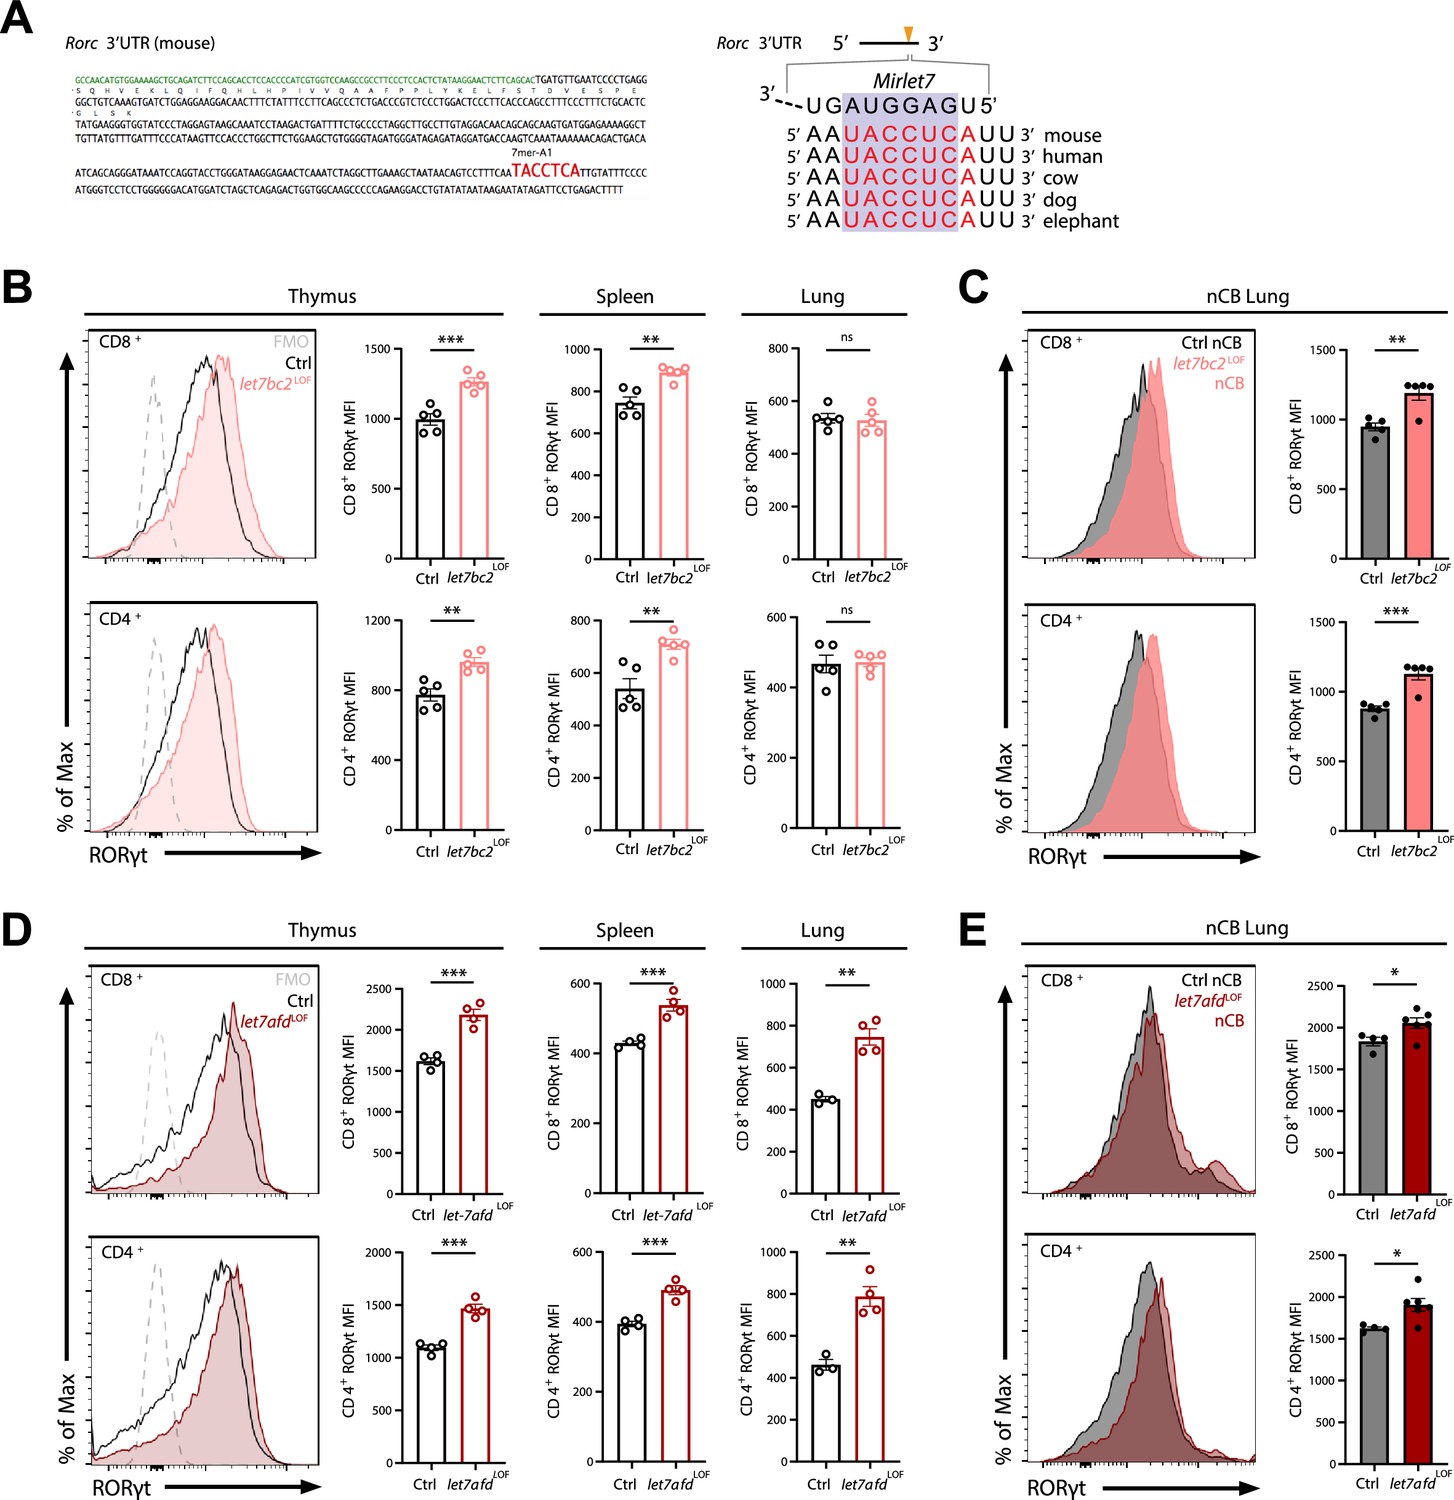
Deletion of either Mirlet7bc2 or Mirlet7afd cluster in T cells enhances RORγt expression in vivo.
(A) Left: Schematic representation of the murine Rorc 3′UTR with Mirlet7-binding site as identified by TargetScan. Right: Schematic of a conserved Mirlet7 microRNA (miRNA) target sequence in the 3′UTR of Rorc. Flow analysis of RORγt expression by mean fluorescent intensity (MFI) quantification in live TCRβ+CD8+ or CD4+ T cells from indicated tissues of (B) naïve control (Ctrl) and let7bc2LOF mice or (C) nanosized carbon black (nCB)-treated lungs by representative flow plot and MFI quantification (n = 5 per group). (D) RORγt expression by MFI quantification in naive let7afdLOF mice thymus, spleen, and lungs (n = 3–4 per group), or (E) nCB-exposed lungs (n = 5 per group). Data are representative of at least three independent experiments displayed as mean ± standard error of the mean (SEM) using Student’s t-test. *p < 0.05, **p < 0.01, ***p < 0.001.
-
Figure 4—source data 1
Source data for Figure 4B–E.
- https://cdn.elifesciences.org/articles/92879/elife-92879-fig4-data1-v1.xlsx
Figure 4—figure supplement 1
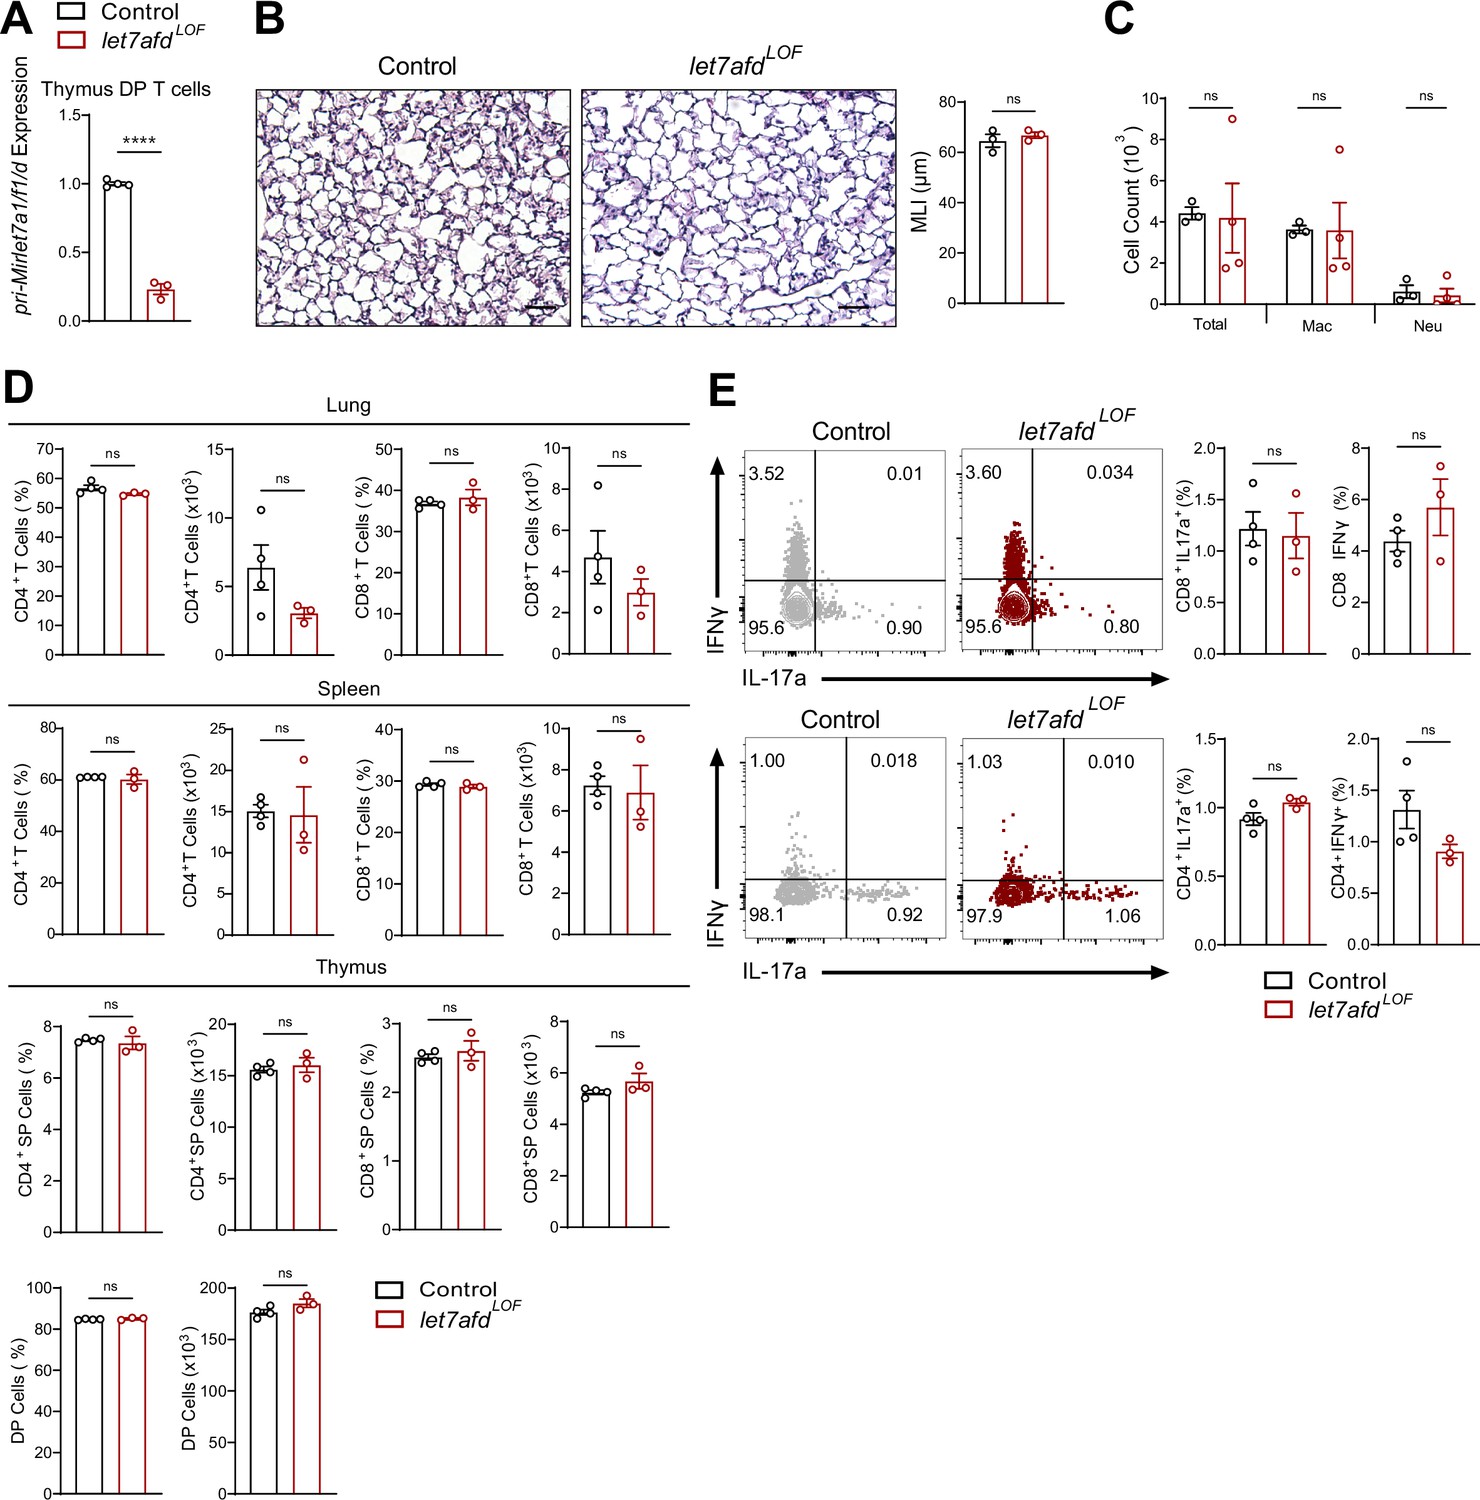
T cell-specific deletion of the Mirlet7afd cluster does not promote lung inflammation or pathology with moderate aging.
(A) Quantitative PCR (qPCR) analysis of pri-Mirlet7a1/f1/d from flow-sorted live, TCRβ+, CD4+CD8 double-positive (DP) thymocytes of control and let7afdLOF mice (n = 3–4 per group). (B) Representative hematoxylin and eosin (H&E)-stained lung sections from indicated mice aged to 6 months (×20 magnification; scale bars, 50 μm) with mean linear intercept (MLI) measurement of lung morphometry (n = 3 per group). (C) Total and differential cell count from bronchoalveolar lavage (BAL) fluid from control and let7afdLOF naive mice (n = 3–4 per group; Mac. = macrophages, Neut. = neutrophils). (D) Flow cytometric analysis of CD4+, CD8+, or DP T cells from the lungs, spleen, and thymus of control and let7afdLOF mice at steady state (n = 3–4 per group). (E) Immunophenotyping of Tc17, Tc1, Th17, and Th1 cell from lungs of mice (n = 3–4 per group). Data are representative of two independent experiments and displayed as mean ± standard error of the mean (SEM) using Student’s t-test. ****p < 0.0001.
Figure 5
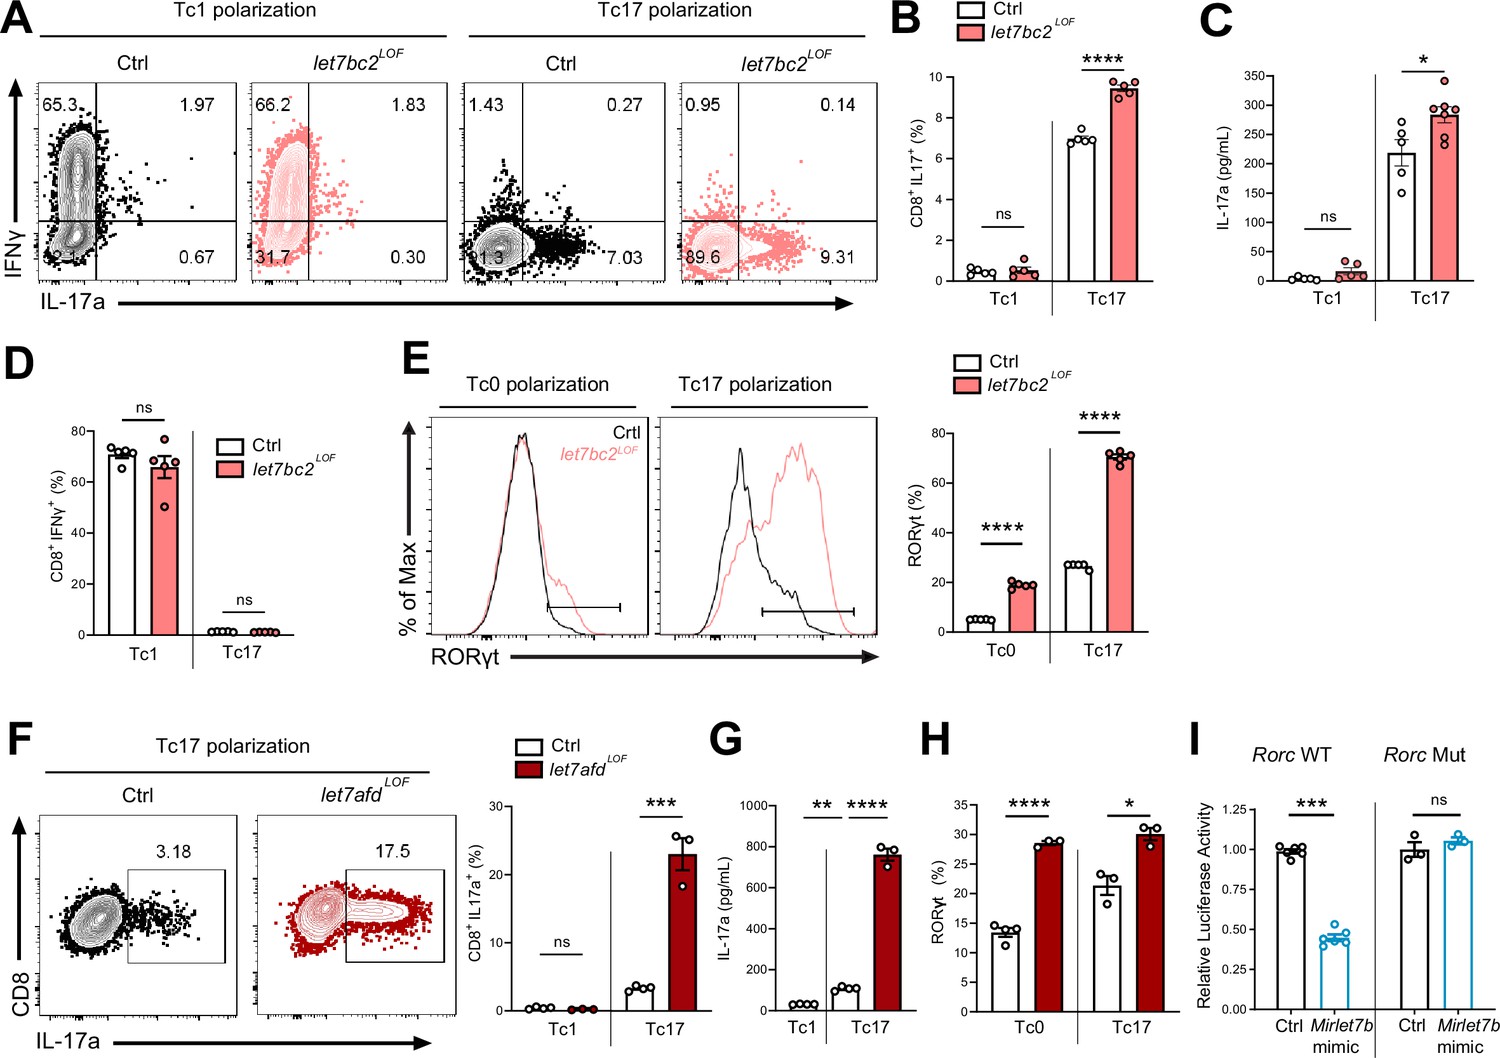
Mirlet7 restricts Tc17 in vitro differentiation in part via direct targeting of Rorc mRNA.
(A) Representative flow plots of live TCRβ+CD8+, IL-17a+, and IFNγ+ populations from Tc1 and Tc17 polarized naive splenic CD8+ T cells from control and let7bc2LOF mice and (B) quantification of CD8+IL-17a+ cells (n = 5 per group). (C) ELISA of IL-17a from the supernatant of Tc1 and Tc17 polarized control and let7bc2LOF cells (n = 5–6 per group). (D) Flow quantification of CD8+IFNγ+ populations in Tc1 and Tc17 polarized control and let7bc2LOF cells (n = 5 per group). (E) Representative flow plot and quantification of RORγt from Tc0 or Tc17 differentiated naive splenic CD8+ T cells isolated from control and let7bc2LOF mice (n = 5 per group). (F) Representative flow plots of CD8+IL-17a+ population frequency and quantification of Tc17 polarized naive splenic CD8+ cells of indicated mice polarized under Tc1 or Tc17 conditions. (G) ELISA of IL-17a from control, Tc1 (n = 4), control Tc17 (n = 4), and let7afdLOF Tc17 (n = 3) polarized cells. (H) Quantification of RORγt from Tc0 or Tc17 in vitro polarized naive CD8+ T cells from control and let7afdLOF mice (n = 3–4 per group). (I) Control (Rorc WT) or binding site mutant (Rorc Mut) 3′UTRs of Rorc were cloned downstream of the renilla luciferase reporter. Plasmids were cotransfected with either a control-miR (black bars) or Mirlet7b mimic (blue bars) duplex into cultured cells. Reporter activity was measured 24 hr after transfection and normalized to firefly activity. Data are representative of two (H), three independent experiments (A–G), or carried out in triplicate (I) and displayed as mean ± standard error of the mean (SEM) using Student’s t-test. *p < 0.05, **p < 0.01, ***p < 0.001, ****p < 0.0001.
-
Figure 5—source data 1
Source data for Figure 5B–I.
- https://cdn.elifesciences.org/articles/92879/elife-92879-fig5-data1-v1.xlsx
Figure 6
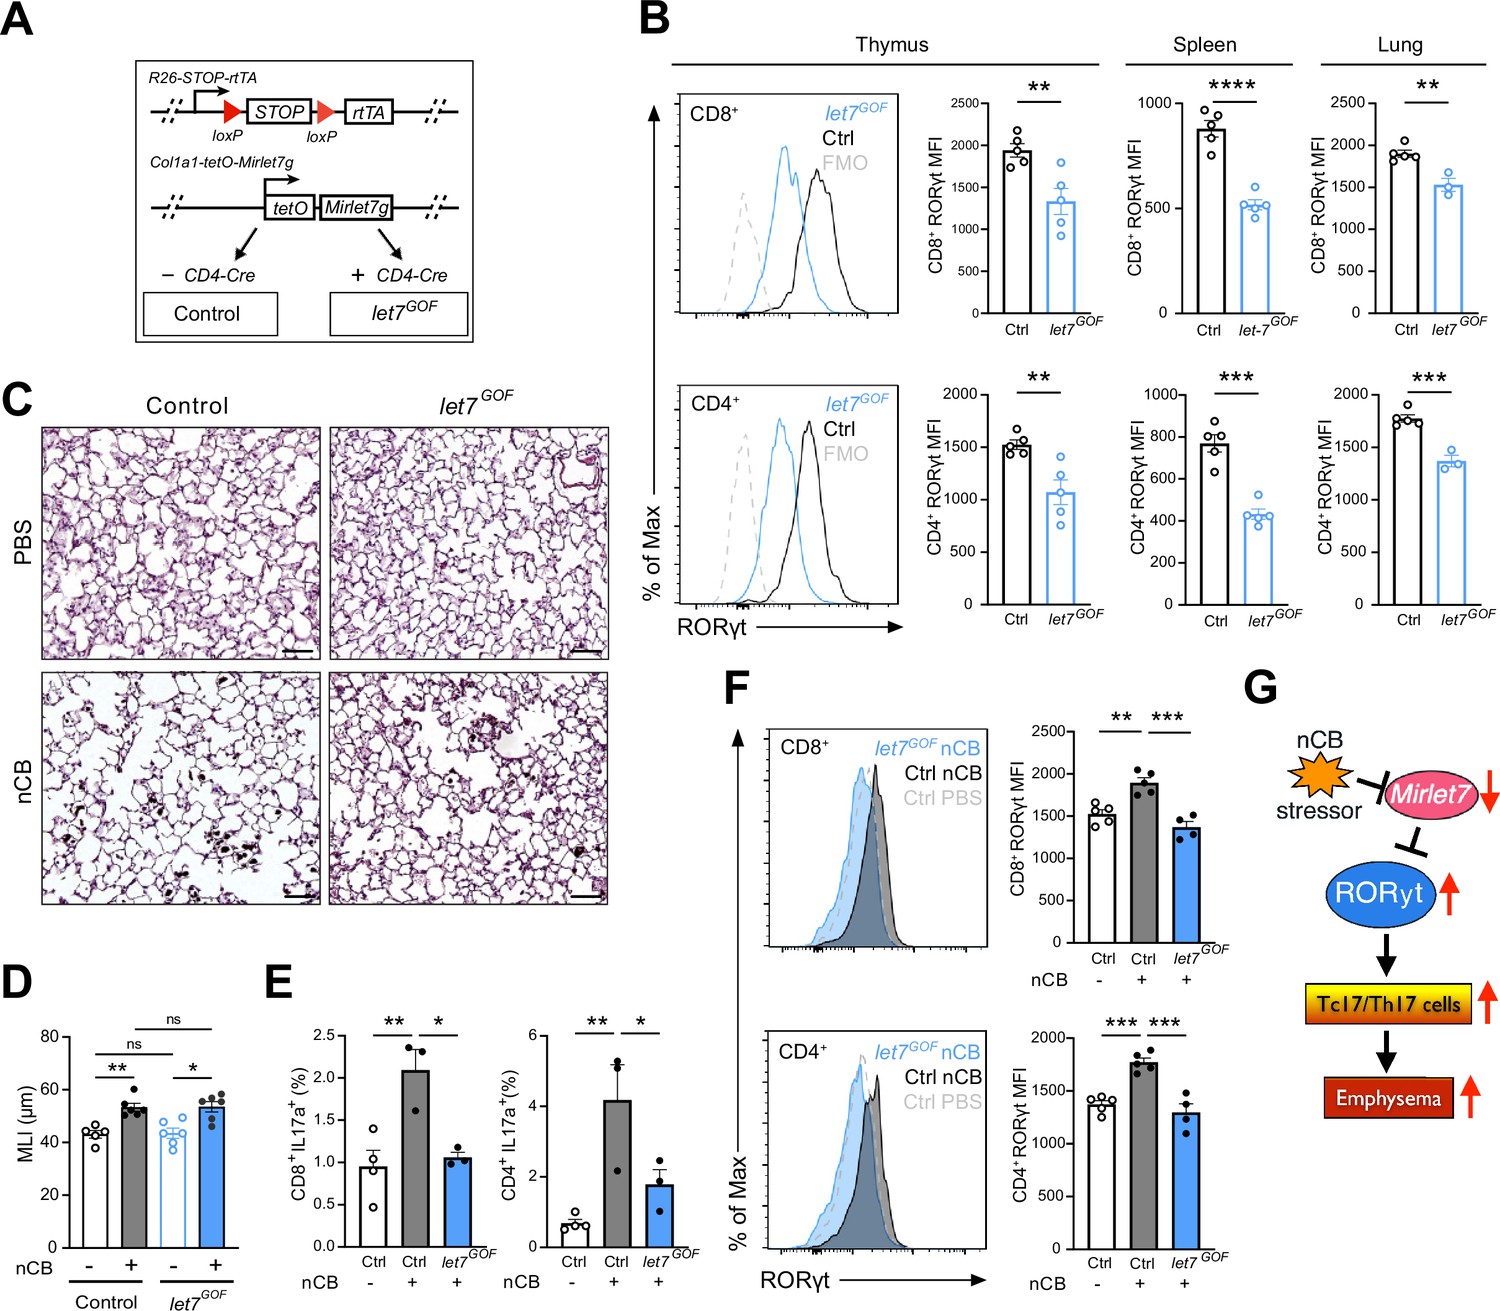
Enforced Mirlet7g expression in T cells restrains induction of RORγt and Tc17/Th17 inflammation in lungs of nanosized carbon black (nCB)-exposed mice.
(A) Schematic outlining our T cell inducible Mirlet7g mouse model (let7GOF). Flow analysis of RORγt expression in live, TCRβ+CD8+ or CD4+ T cells from (B) indicated mice in thymus, spleen, and lungs (n = 3–5 per group). (C) Control and let7GOF mice were treated with PBS vehicle or nCB then analyzed. Representative hematoxylin and eosin (H&E)-stained lung sections from PBS- and nCB-exposed mice as indicated on each panel (×20 magnification; scale bars, 50 µm). (D) Mean linear intercept (MLI) measurements from indicated mice (n = 5–6 per group). Flow analysis of lungs gated on live TCRβ+ CD8+ or CD4+ cells for (E) IL-17a+ population frequency (n = 3–4 per group) or (F) RORγt expression by representative flow plot and mean fluorescent intensity (MFI) quantification (n = 4–5 per group). (G) Figure model of Mirlet7/RORγt axis in emphysema pathogenesis. Data are representative of two (B) or three (C–F) independent experiments and displayed as mean ± standard error of the mean (SEM) using Student’s t-test (B) or two-way analysis of variance (ANOVA) with Tukey’s multiple correction (D–F). *p < 0.05, **p < 0.01, ***p < 0.001, ****p < 0.0001.
-
Figure 6—source data 1
Source data for Figure 6B, D–F.
- https://cdn.elifesciences.org/articles/92879/elife-92879-fig6-data1-v1.xlsx
Additional files
-
Supplementary file 1
Genotyping primers and duplexes for luciferase assay.
Primer names and sequences are indicated above.
- https://cdn.elifesciences.org/articles/92879/elife-92879-supp1-v1.docx
-
Supplementary file 2
Demographics of subjects by emphysema severity.
Mean ± standard deviation is shown for age, FEV1 %, FEV1/FVC %. Abbreviations: FEV1 (forced expiratory volume in 1 s). FEV1/FVC (forced expiratory volume/forced vital capacity).
- https://cdn.elifesciences.org/articles/92879/elife-92879-supp2-v1.docx
-
MDAR checklist
- https://cdn.elifesciences.org/articles/92879/elife-92879-mdarchecklist1-v1.pdf
Download links
A two-part list of links to download the article, or parts of the article, in various formats.
Downloads (link to download the article as PDF)
Open citations (links to open the citations from this article in various online reference manager services)
Cite this article (links to download the citations from this article in formats compatible with various reference manager tools)
Downregulation of Mirlet7 miRNA family promotes Tc17 differentiation and emphysema via de-repression of RORγt
eLife 13:RP92879.
https://doi.org/10.7554/eLife.92879.3


