A novel bivalent interaction mode underlies a non-catalytic mechanism for Pin1-mediated protein kinase C regulation
- Department of Biochemistry & Biophysics, Texas A&M University, United States
- Department of Cell Biology & Genetics, Texas A&M University, United States
Figures
Figure 1 with 5 supplements
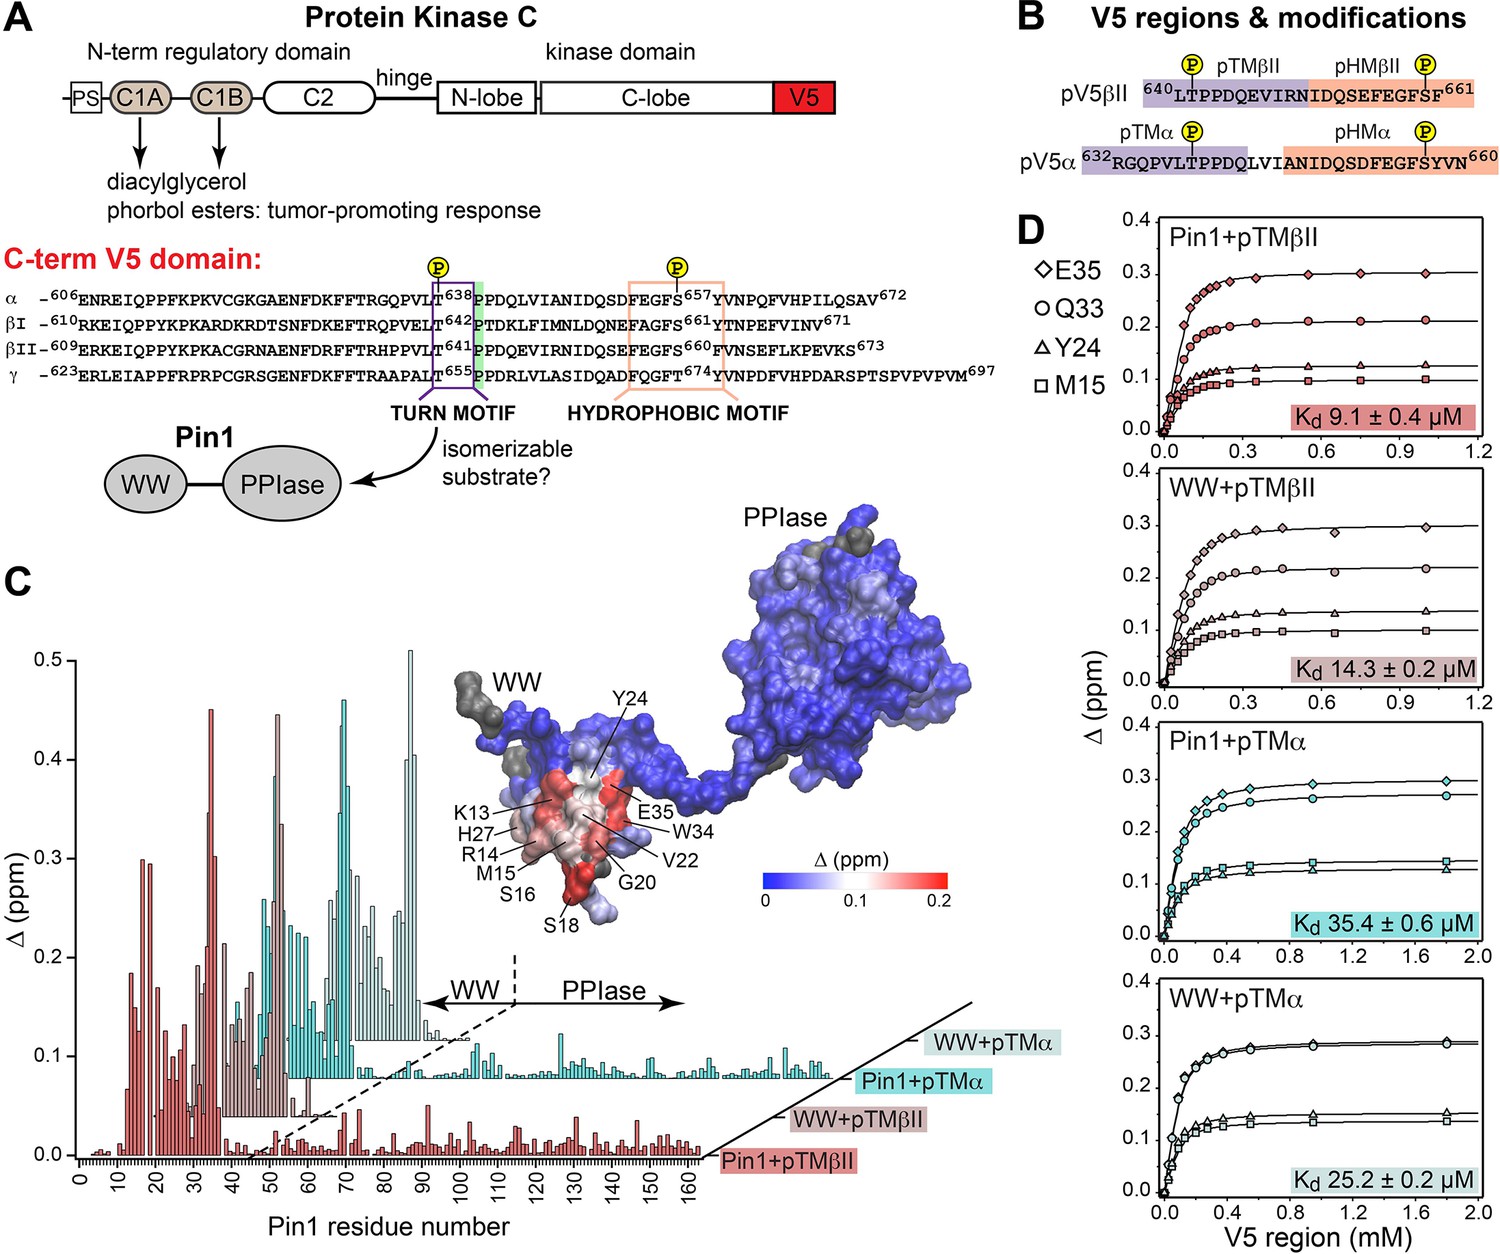
Pin1 binds the turn motifs of α and βII PKC isoenzymes through its WW domain.
(A) Multi-modular architecture of conventional PKC isoenzymes, shown along with the amino acid sequence alignment of the C-terminal V5 domains. Turn and hydrophobic motifs are highlighted in purple and orange, respectively. (B) Notations for the V5 peptides that were selected for the NMR-detected binding experiments conducted in this study. (C) Residue-specific chemical shift perturbation (CSP) plots of Pin1 and its isolated WW domain obtained upon binding of pTMβII and pTMα. The turn motifs (TMs) interact exclusively with the WW domain. The CSP values Δ for the Pin1::pTMβII complex are color-coded and mapped on to lowest-energy solution NMR structure of apo Pin1 (PDB: 1NMV). (D) Representative binding isotherms and dissociation constants for the formation of the complexes between TMs and Pin1 and its WW domain. The source 2D 15N-1H heteronuclear single-quantum coherence (HSQC) NMR spectra are given in Supplementary files 1–4.
Figure 1—figure supplement 1
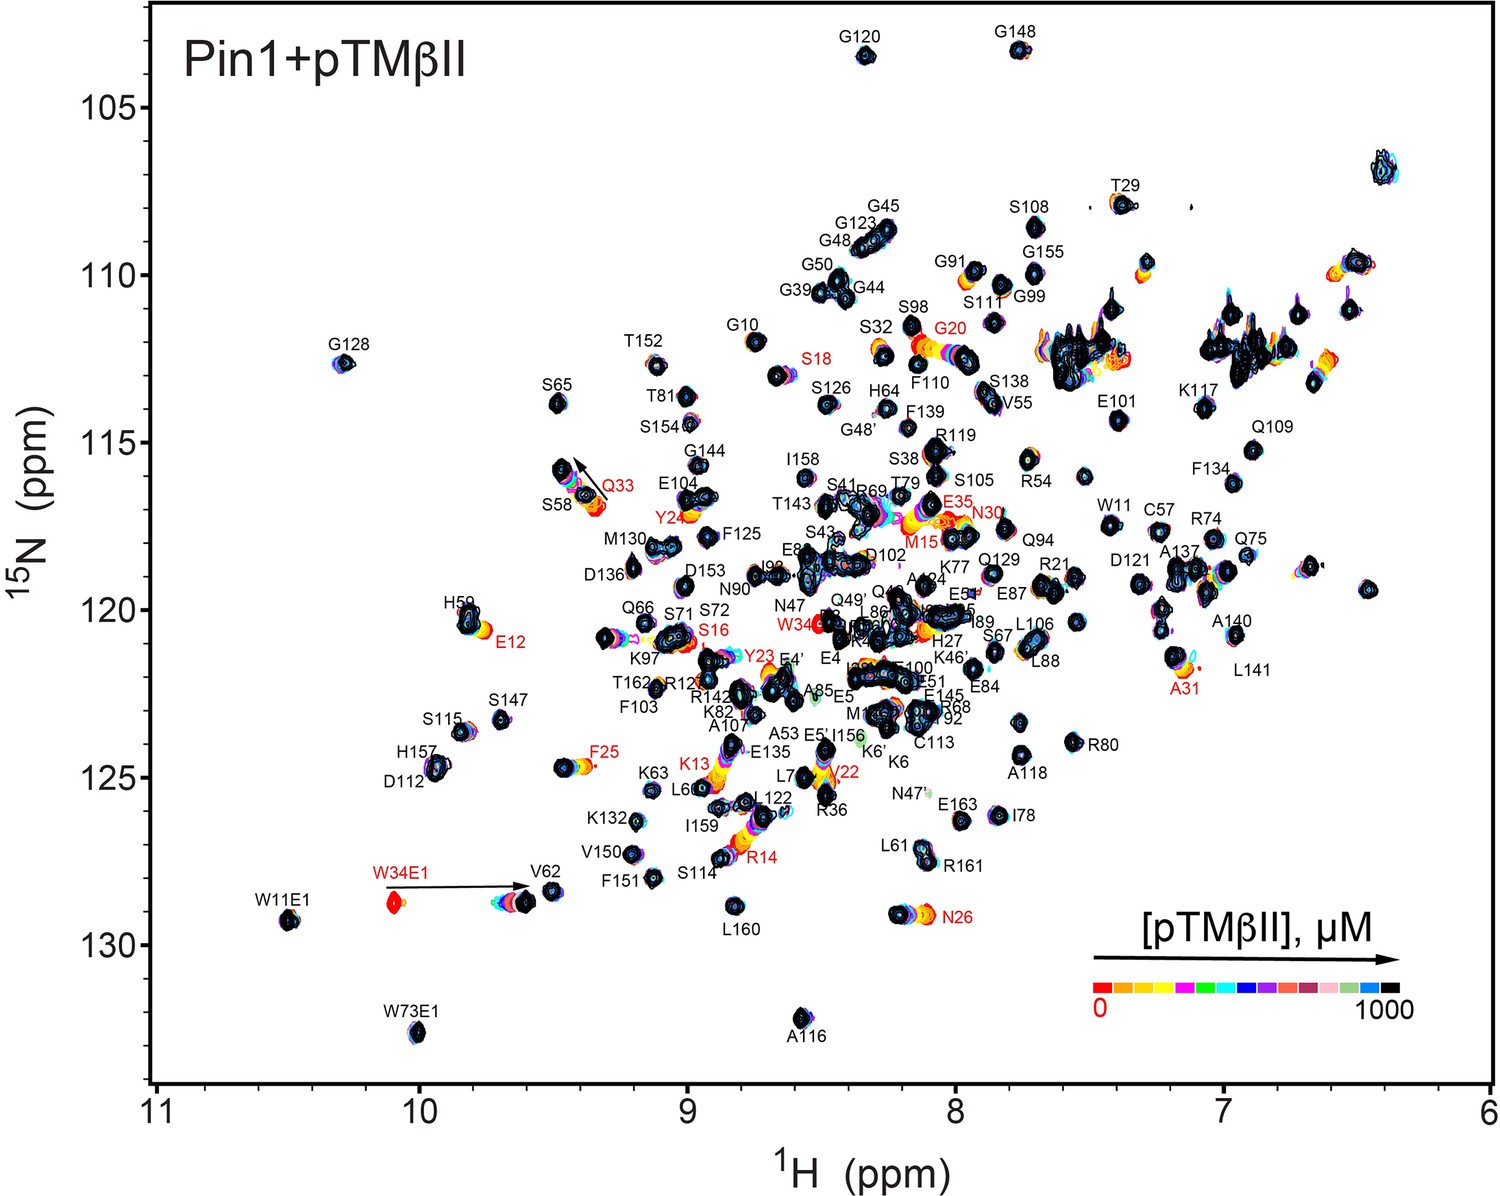
NMR-detected binding of the PKCβII turn motif (pTMβII) to full-length Pin1.
The protein concentration was 100 μM, and the pTMβII concentration varied from 0 mM to 1 mM. Most of the affected N-HN resonances are in fast exchange on the NMR chemical shift timescale (Supplementary file 2, binding experiment #1).
Figure 1—figure supplement 2
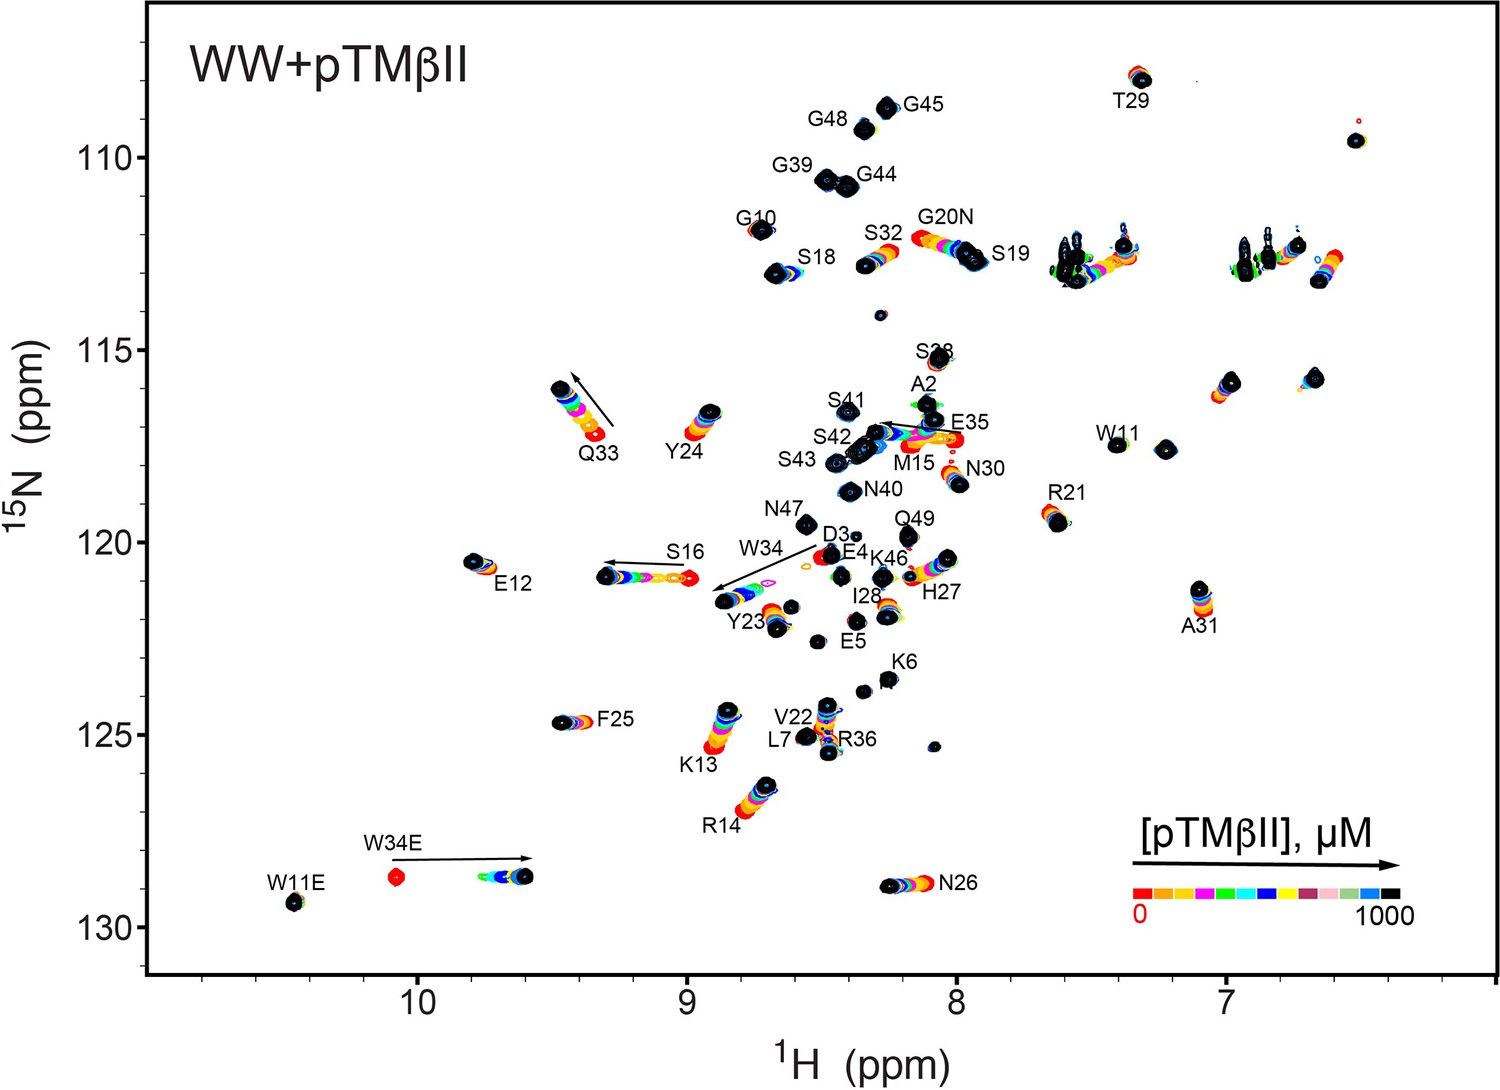
NMR-detected binding of the PKCβII turn motif (pTMβII) to the isolated WW domain.
The protein concentration was 100 μM, and the pTMβII concentration varied from 0 mM to 1 mM. Most of the affected N-HN resonances are in fast exchange on the NMR chemical shift timescale (Supplementary file 2, binding experiment #2).
Figure 1—figure supplement 3
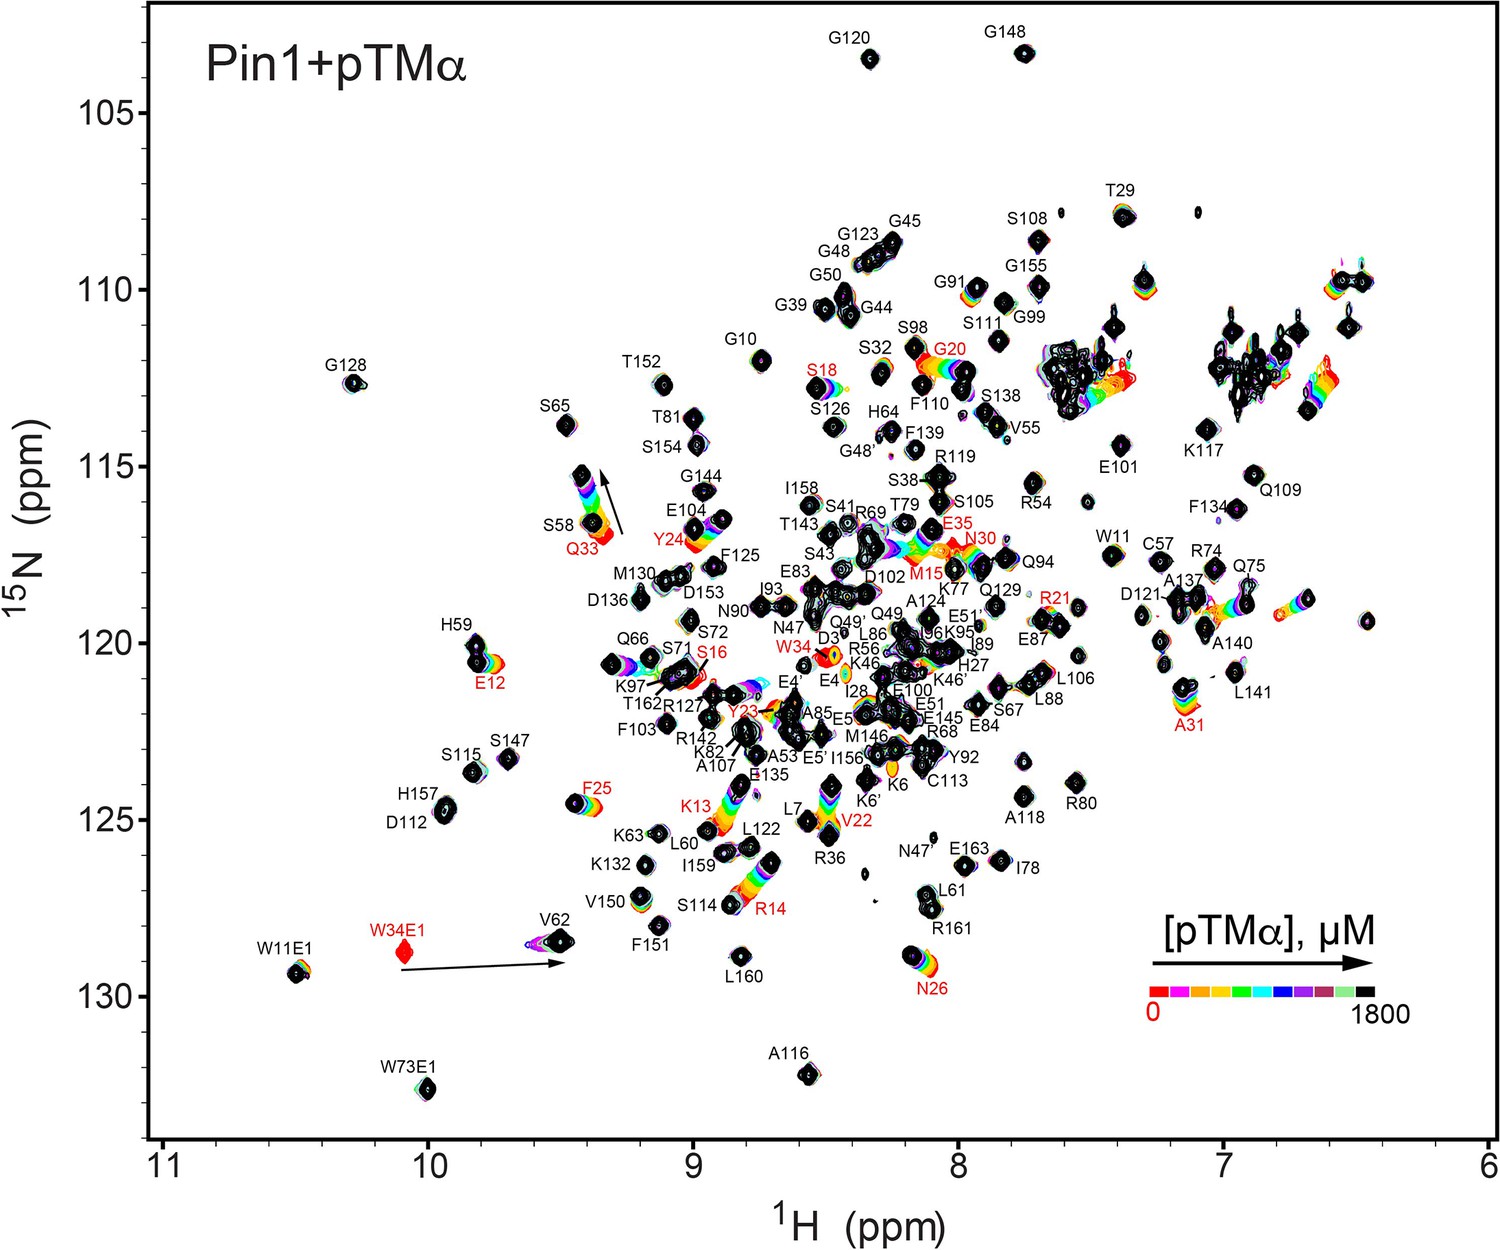
NMR-detected binding of the PKCα turn motif (pTMα) to full-length Pin1.
The protein concentration was 100 μM, and the pTMα concentration varied from 0 mM to 1.8 mM. Most of the affected N-HN resonances are in fast exchange on the NMR chemical shift timescale (Supplementary file 2, binding experiment #3).
Figure 1—figure supplement 4
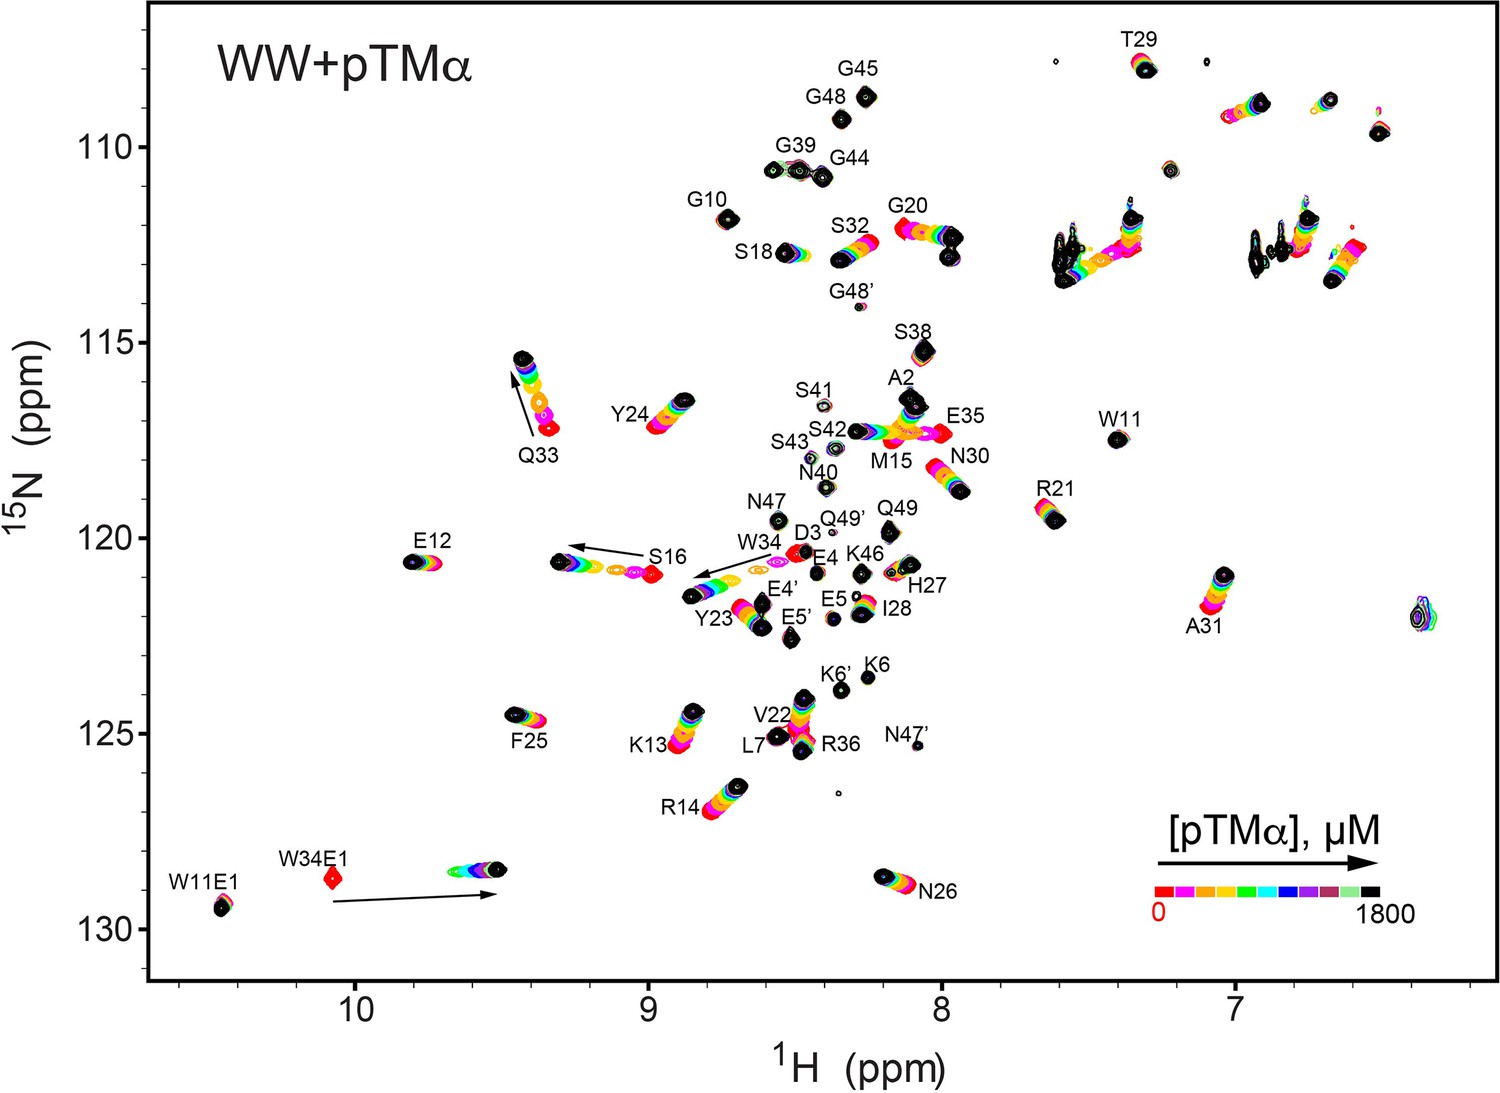
NMR-detected binding of the PKCα turn motif (pTMα) to the isolated WW domain.
The protein concentration was 100 μM, and the pTMα concentration varied from 0 mM to 1.8 mM. Most of the affected N-HN resonances are in fast exchange on the NMR chemical shift timescale (Supplementary file 2, binding experiment #4).
Figure 1—figure supplement 5
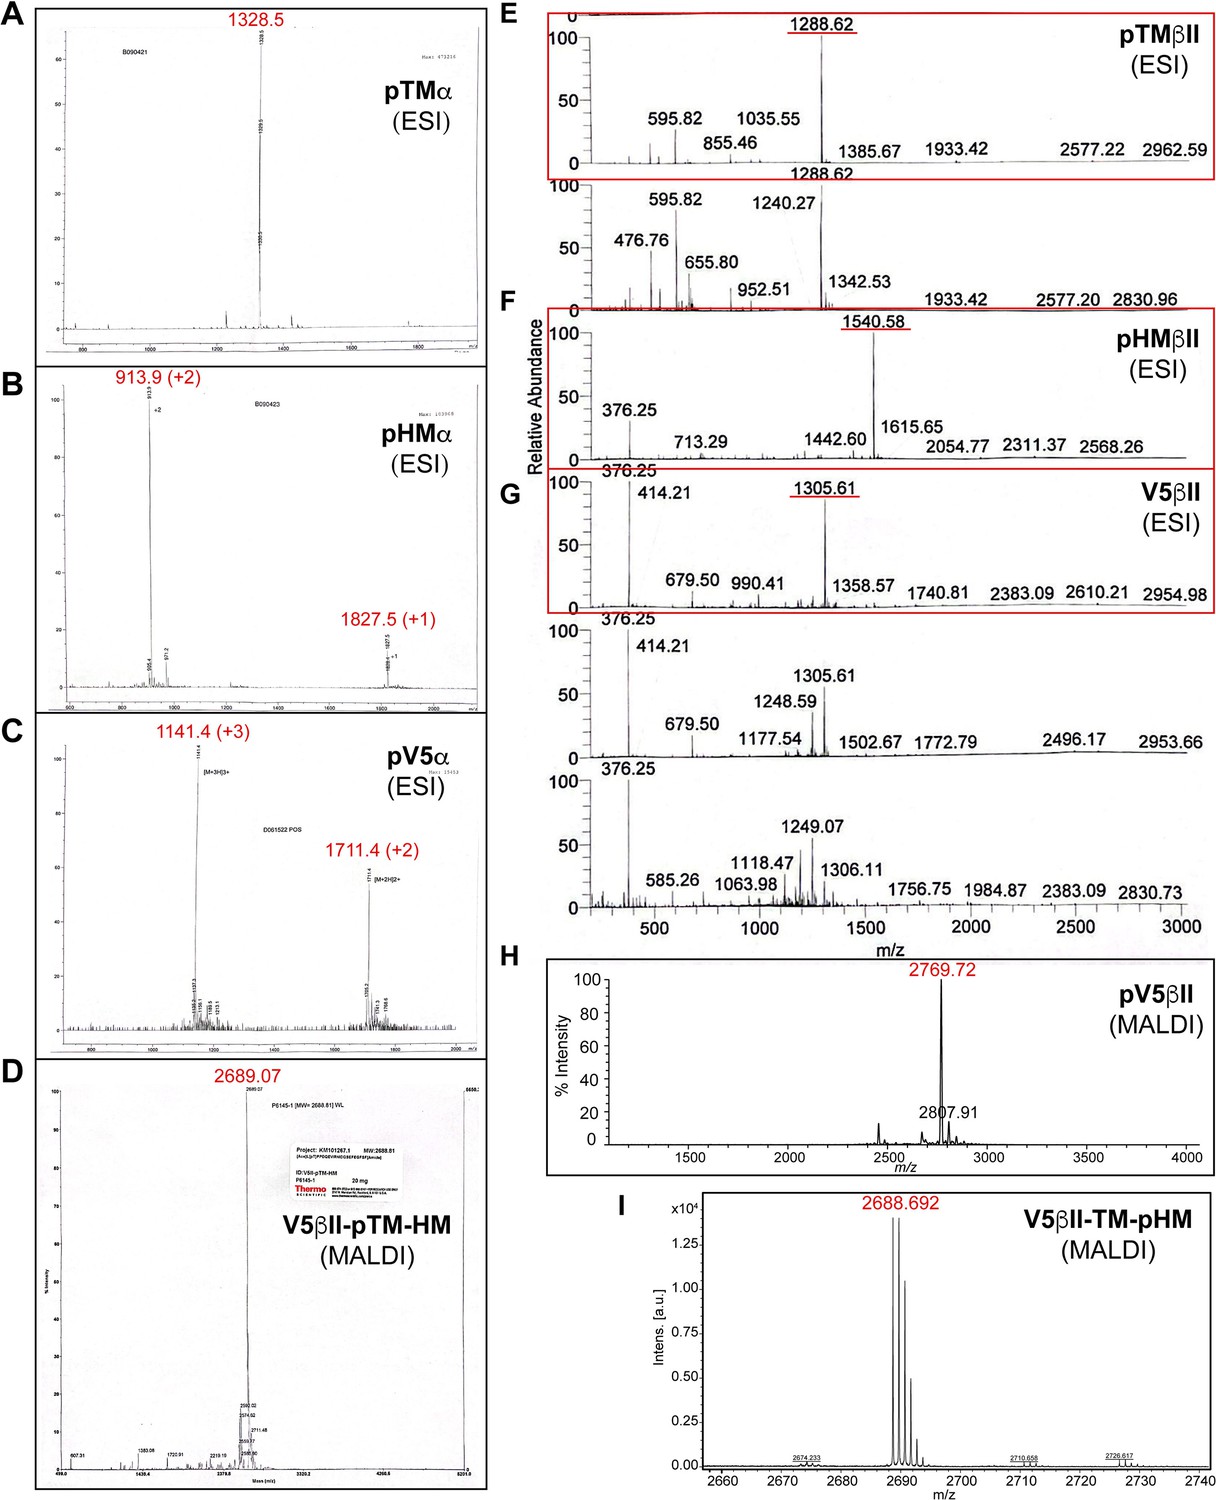
Mass spectrometry data for the synthesized peptides derived from the C-terminal V5 regions of PKC isozymes.
(A–I) Mass spectra of the phosphorylated peptides used in this work. Expected molecular masses are: 1328.4 (pTMα); 1826.8 (pHMα); 3421.5 (pV5α); 2689.8 (V5βII-pTM-HM); 1288.3 (pTMβII); 1540.5 (pHMβII); 2609.8 (V5βII); 2769.8 (pV5βII); and 2689.8 (V5βII-TM-pHM).
Figure 2
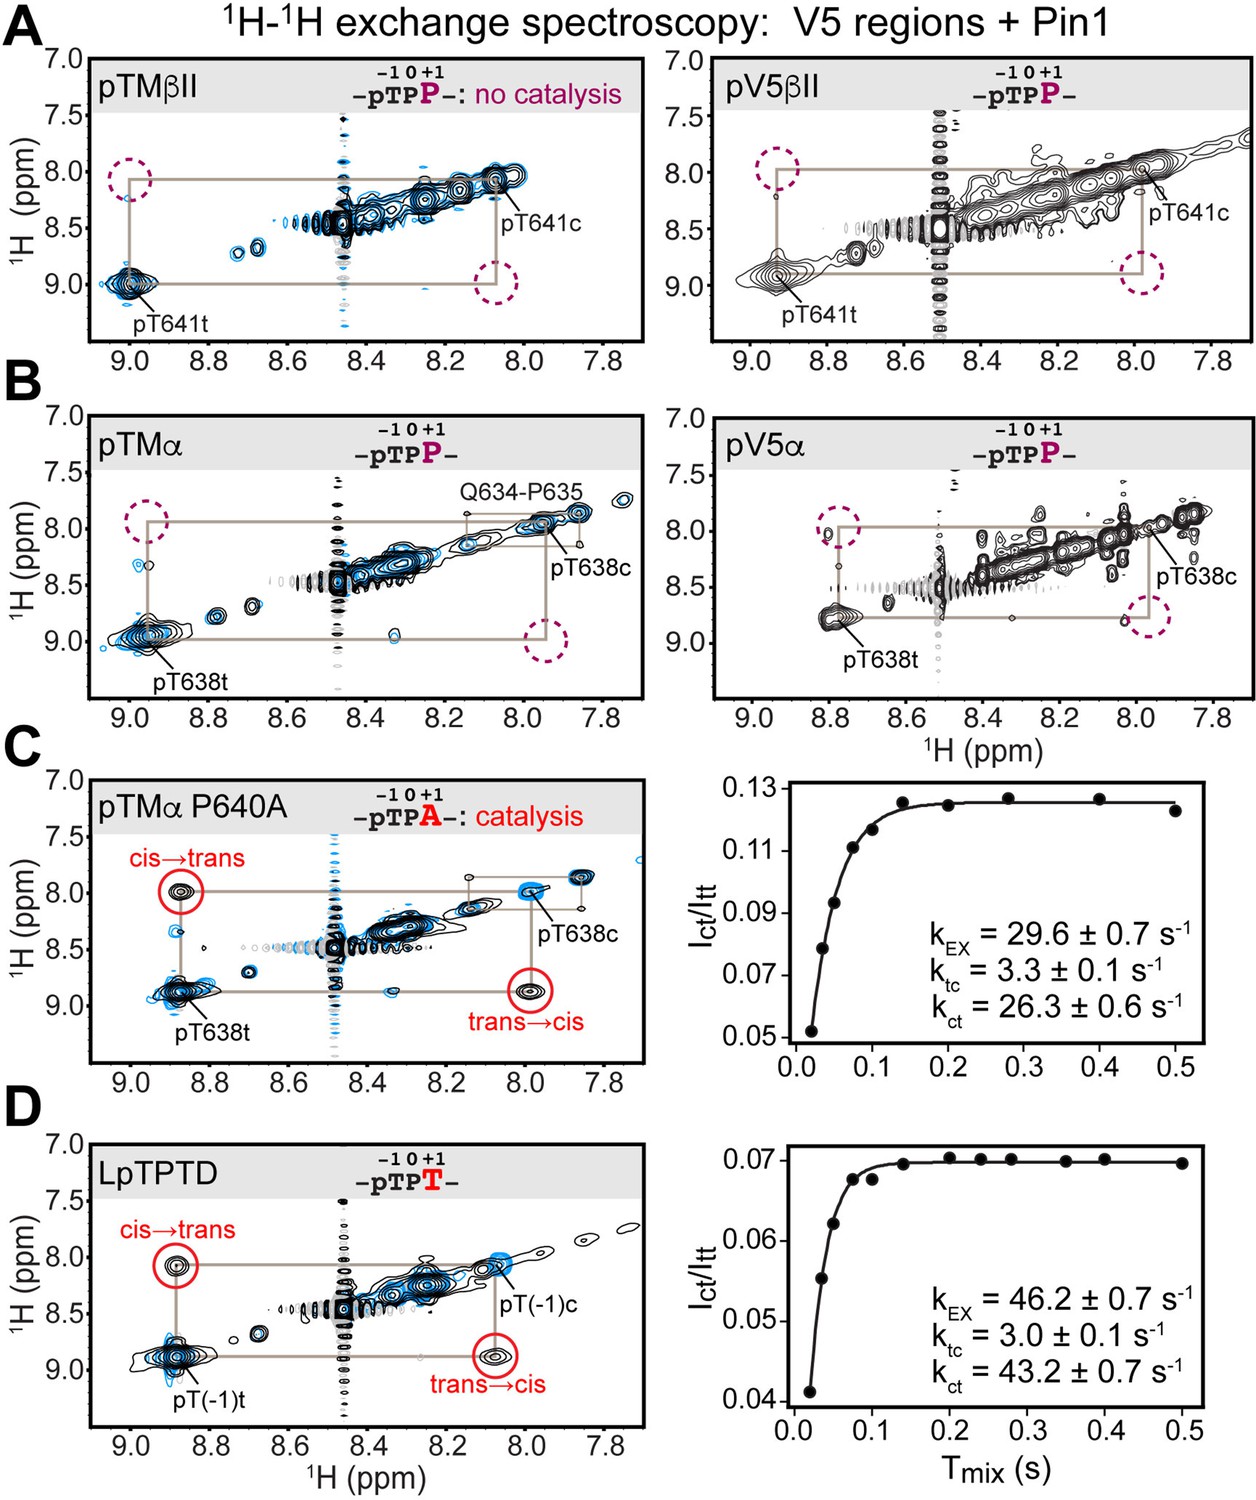
Pin1 does not appreciably catalyze isomerization of the turn motif in α and βII PKC isoenzymes due to presence of proline at the +1 position.
No exchange cross-peaks characteristic of Pin1-catalyzed pThr-Pro cis-trans isomerization are present in the spectra of turn motif (TM) regions from the PKC βII (A) and α (B) isoforms. This is demonstrated for both, isolated TM and the pV5 regions that harbor both HM and TM. Non-specific catalysis by Pin1 is evident in the appearance of exchange cross-peaks for the 1HN of Gln634 in cis and trans conformations of the Gln634-Pro635 segment (B). Replacement of Pro640 with Ala at the (+1) position of pTMα results in significant rate enhancement with the kEX value of 29.6 s–1 (C). Thr at the (+1) position similarly enhances the rate of isomerization, as demonstrated for a short five-residue LpTPPD peptide common to the TM regions of α, βII, and γ PKCs (D). The reference spectra collected with same parameters in the absence of Pin1 are shown in blue. The concentration of the V5 region peptides was 1–2 mM, with Pin1 added at catalytic amounts of 50 μM. The mixing times for all spectra are 0.5 s. The NMR spectra show the expansion of the 1H-1H amide region.
Figure 3 with 2 supplements
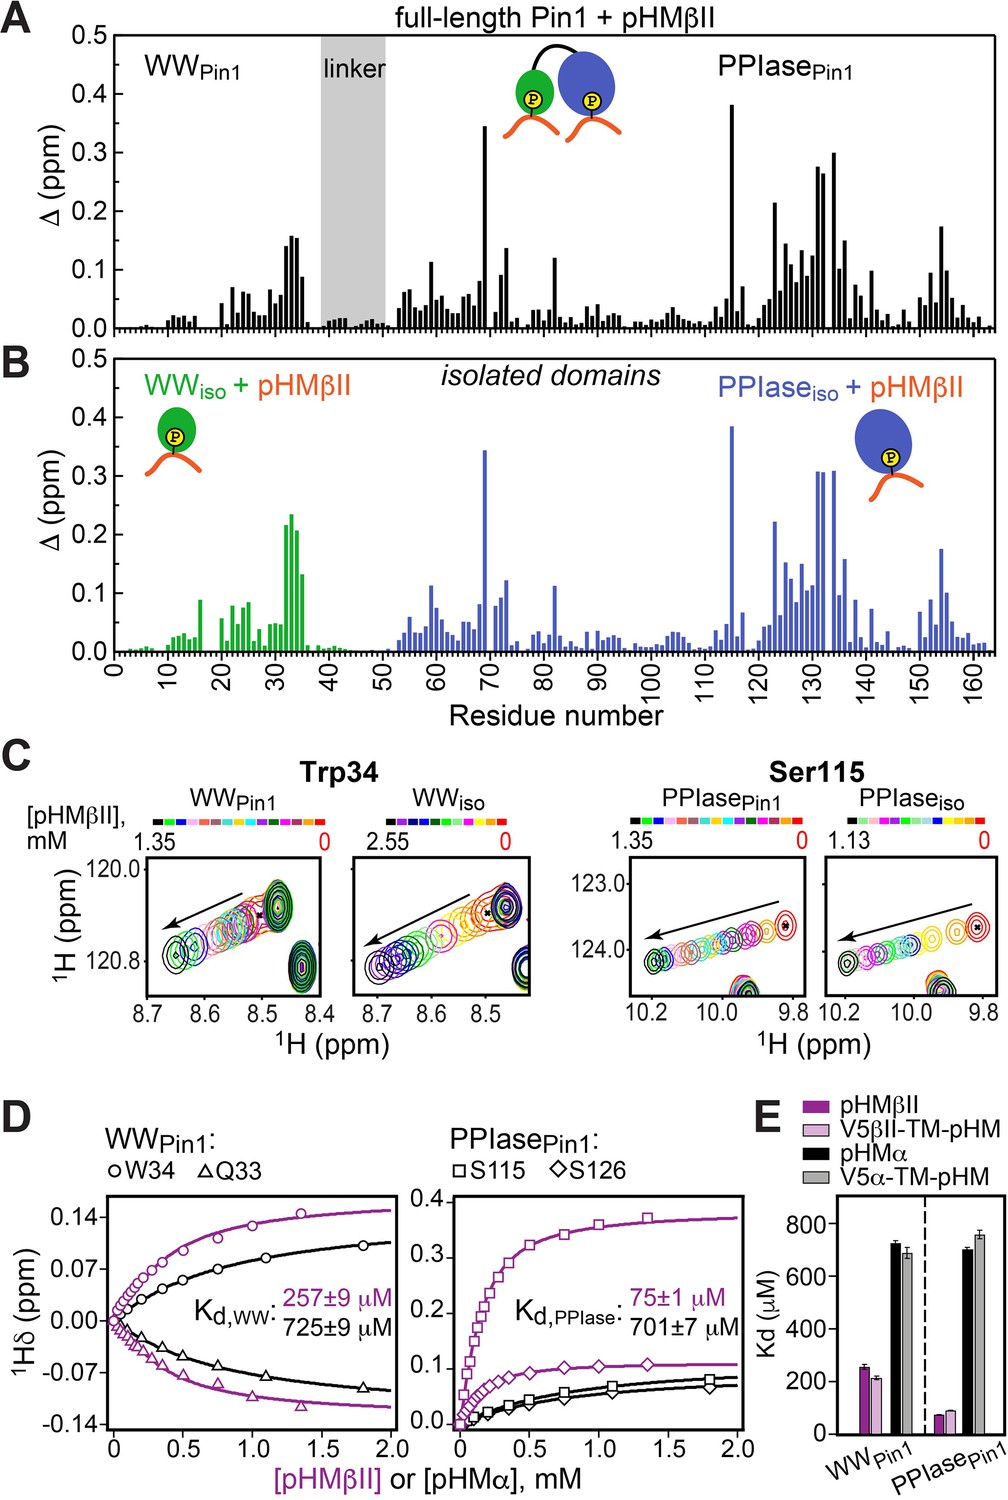
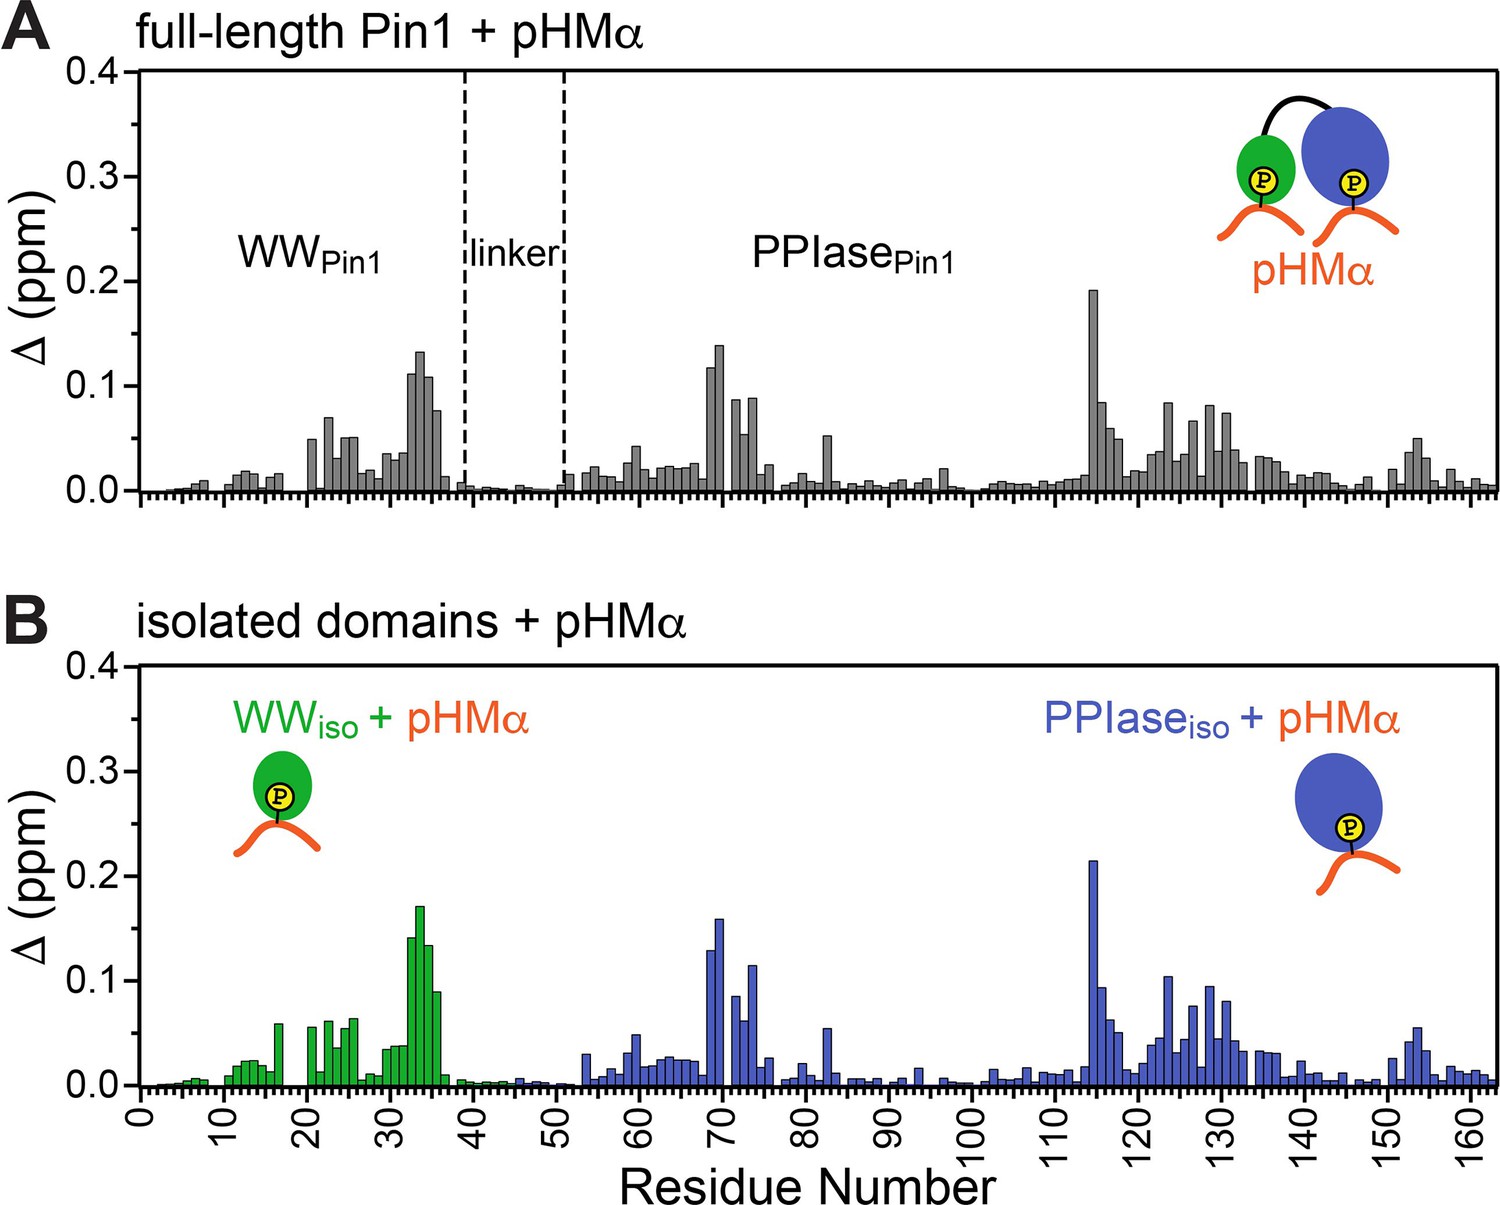
Hydrophobic motif interacts with Pin1 via two independent sites.
Comparison of the chemical shift perturbation (CSP) plots obtained at maximum concentrations of pHMβII versus ligand-free proteins for (A) full-length Pin1 and (B) isolated WW and PPIase domains. The similarity of the CSP patterns in (A) and (B) indicates that pHM has two independent binding sites in Pin1, one per domain. (C) Expansion of the 15N-1H chemical shift correlation spectra of Trp34 in the WW domain and Ser115 in the PPIase domain showing the fast-exchange regime of pHM binding. Full spectra are given in Figure 3—figure supplement 1. (D) Representative pHMβII (purple) and pHMα (black) binding curves for the Pin1 residues that belong to the WW and PPIase domains. Solid lines are the global fits to a model with two independent binding sites. (E) The unphosphorylated turn motif (TM) region upstream of the hydrophobic motif (HM) has no influence on the HM interaction mode with Pin1. Experimental conditions for all α and βII experiments are given in Supplementary file 2, experimental IDs # 5–10, 12, and 13.
Figure 3—figure supplement 1
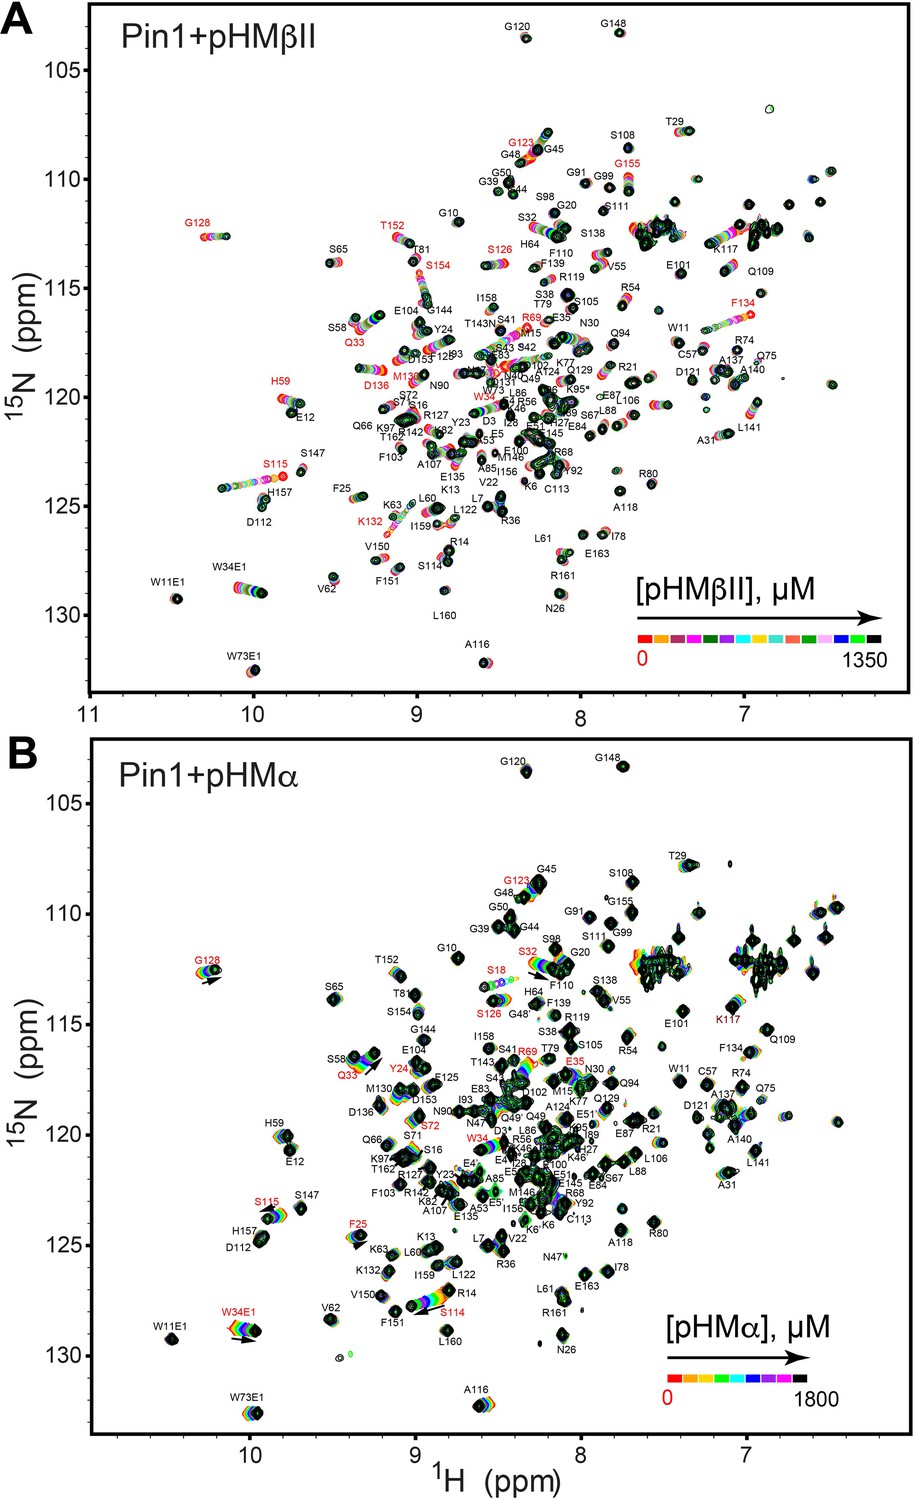
NMR-detected binding of hydrophobic motifs from PKCβII (A, pHMβII) and α (B, pHMα) to full-length Pin1.
The protein concentration was 100 μM, and the pHM concentration varied from 0 mM to 1.35 mM (pHMβII), and from 0 mM to 1.8 mM (pHMα). Most of the affected N-HN resonances are in fast exchange on the NMR chemical shift timescale (Supplementary file 2, binding experiments #7 and #10).
Figure 3—figure supplement 2
Pin1 binds hydrophobic motif of PKCα (pHMα) via two independent sites.
Comparison of the chemical shift perturbation (CSP) plots obtained at maximum concentrations of pHMα used in binding experiments versus ligand-free proteins for (A) full-length Pin1 and (B) isolated WW and PPIase domains. The similarity of the CSP patterns in (A) and (B) indicates that Pin1 has two pHM binding sites, one per domain. The protein concentration was 100 μM. Other details are given in Supplementary file 2 for the binding experiments #5, 6, and 7.
Figure 4 with 5 supplements
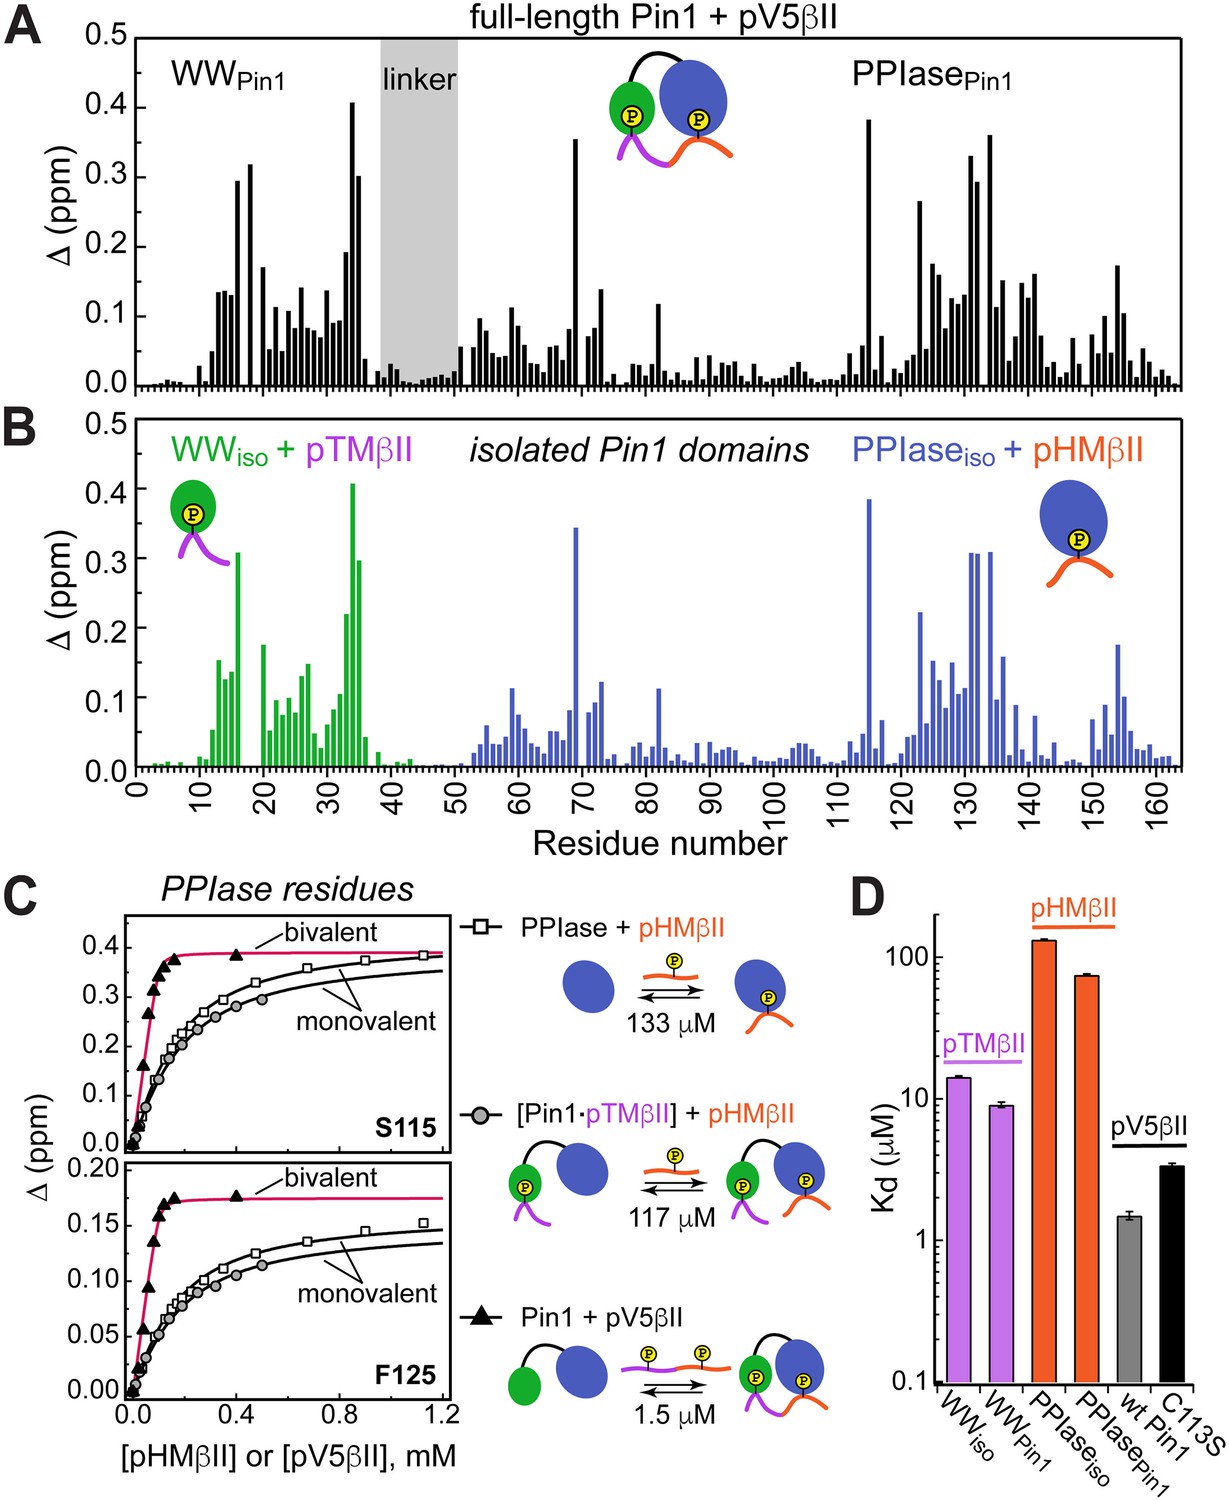
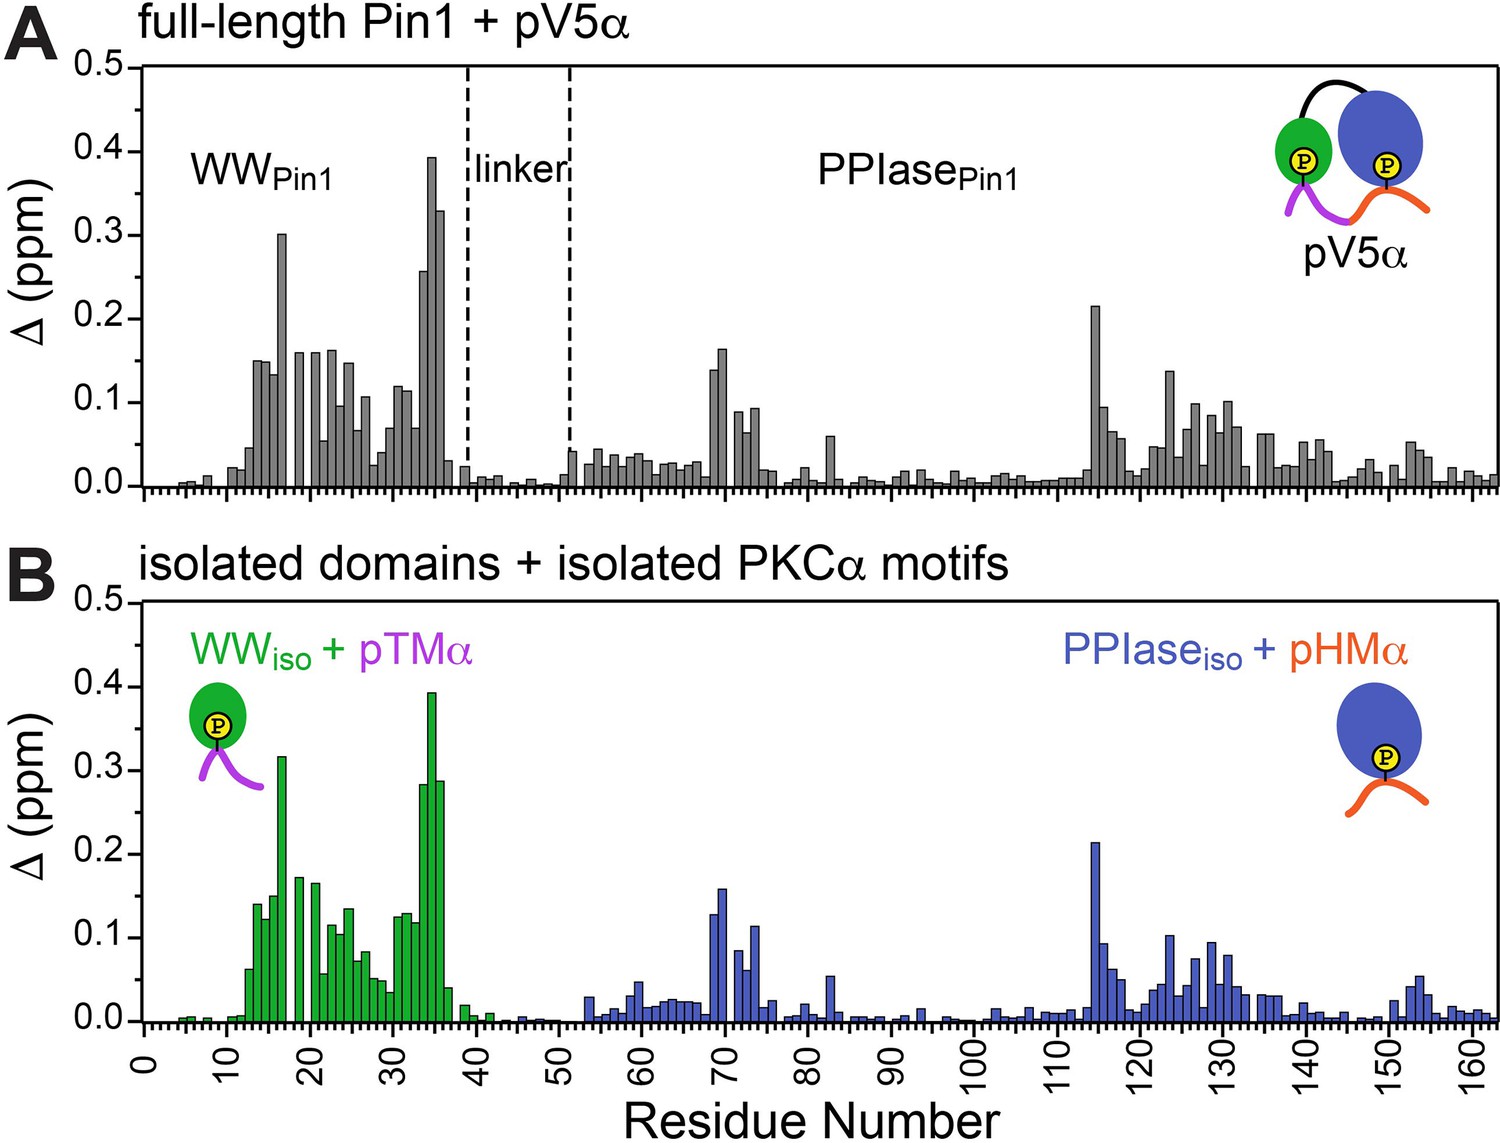
Unidirectional bivalent binding mode of the C-terminal PKCβII region to Pin1.
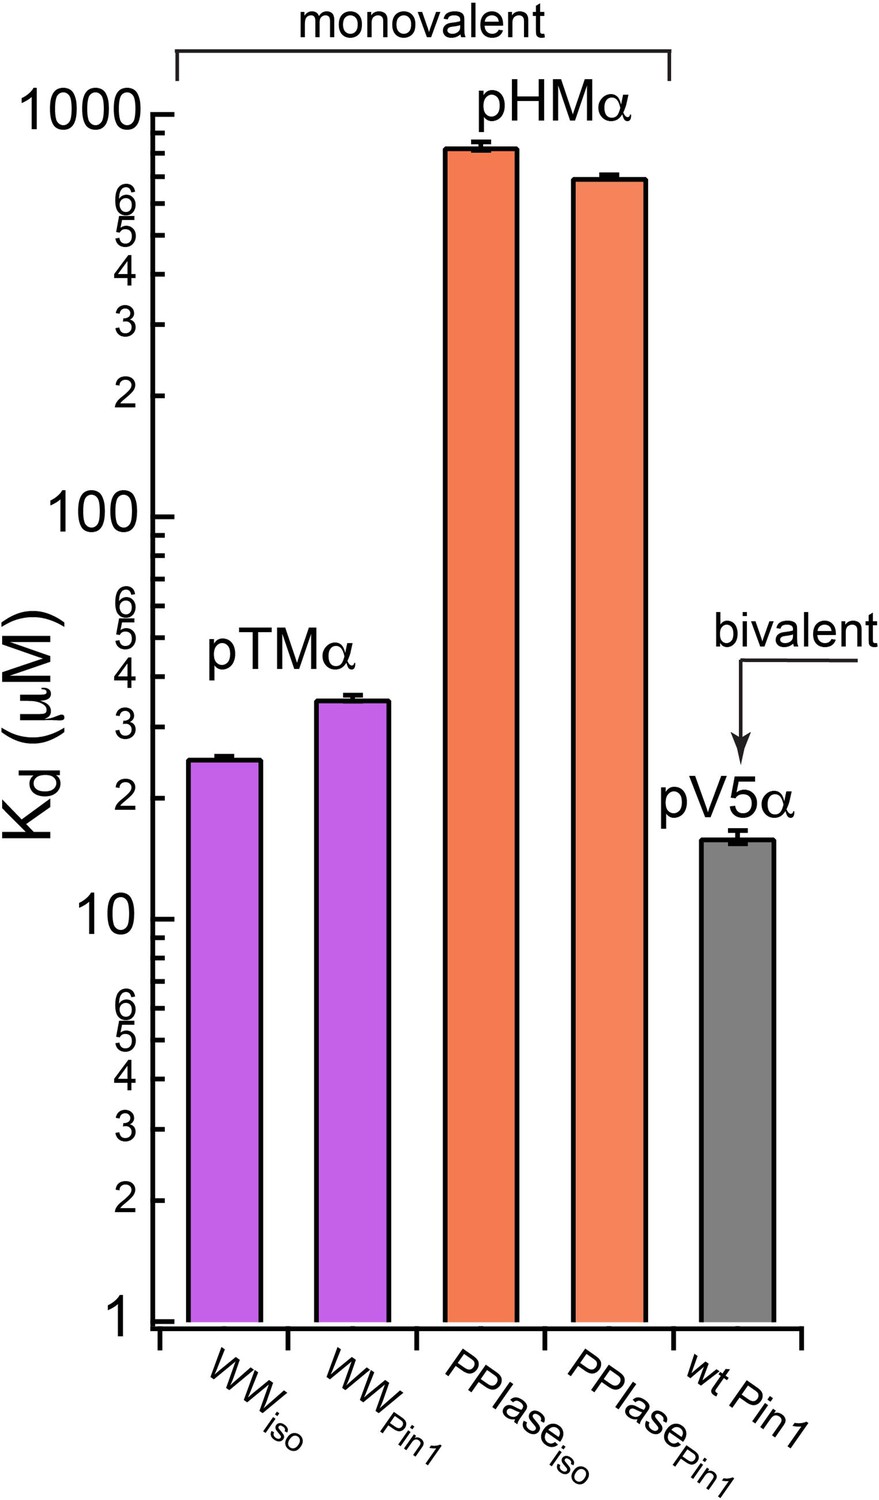
(A, B) Comparison of the chemical shift perturbation (CSP) plots of Pin1 obtained at maximum concentrations of pV5βII (A) and those of isolated domains, WWiso and PPIaseiso, at maximum concentrations of pTMβII and pHMβII (B), respectively. The similarity of CSP patterns in (A) and (B) indicates that the C-term region of PKCβII binds to Pin1 in a unidirectional bivalent mode. (C) The turn motif (TM) and hydrophobic motif (HM) binding sites reside on the WW and PPIase domains, respectively. The protein concentration is 100 μM. Other details are given in Supplementary file 2, binding experiment IDs #9, 15, and 18. (D) Kd values for the monovalent interactions of the HM and TM with isolated Pin1 domains and full-length Pin1 are contrasted with the Kd value for the bivalent Pin1-pV5βII interactions. ~10-fold enhancement for the pTM binding to the WW domain and ~90-fold enhancement of the pHM binding to the PPIase domain are attributed to bivalency. The Kd values used for this plot were obtained in the NMR-detected binding experiments. The Kd value for pV5βII binding to the catalytically deficient C113S Pin1 variant (black bar, 3.4 μM) exceeds the wild-type value by ~2-fold.
Figure 4—figure supplement 1
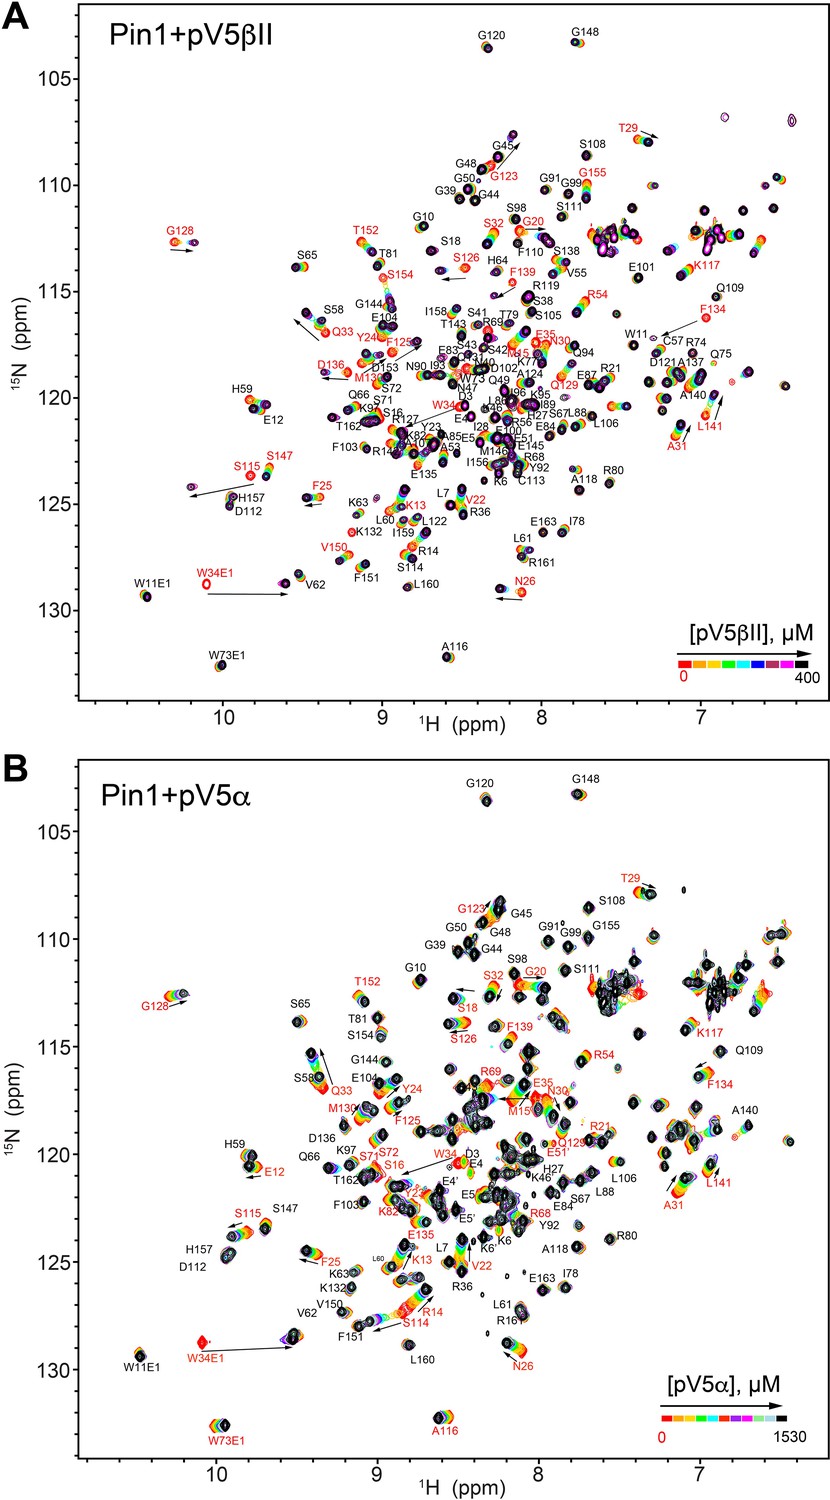
NMR-detected binding of the fully phosphorylated C-term regions pV5βII (A) and pV5α (B) to full-length Pin1.
The protein concentration was 100 μM, and the pV5 concentration varied from 0 μM to 375 μM in case of pV5βII, and from 0 μM to 1530 μM in case of pV5α. The binding kinetics is in the intermediate-to-fast (pV5βII) and fast (pV5α) exchange regimes (Supplementary file 2, binding experiments #14 and #15).
Figure 4—figure supplement 2
Unidirectional bivalent binding mode of the C-terminal PKCα region to Pin1.
Comparison of the chemical shift perturbation (CSP) plots of Pin1 obtained at maximum concentrations of pV5α (A) and those of isolated domains, WWiso and PPIaseiso, at maximum concentrations of pTMα and pHMα (B), respectively. The similarity of CSP patterns in (A) and (B) indicates that the C-term region of PKCα binds to Pin1 in a unidirectional bivalent mode. The turn motif (TM) and hydrophobic motif (HM) binding sites reside on the WW and PPIase domains, respectively. The protein concentration was 100 μM. Other details are given in Supplementary file 2, binding experiments #4, 6, and 14.
Figure 4—figure supplement 3
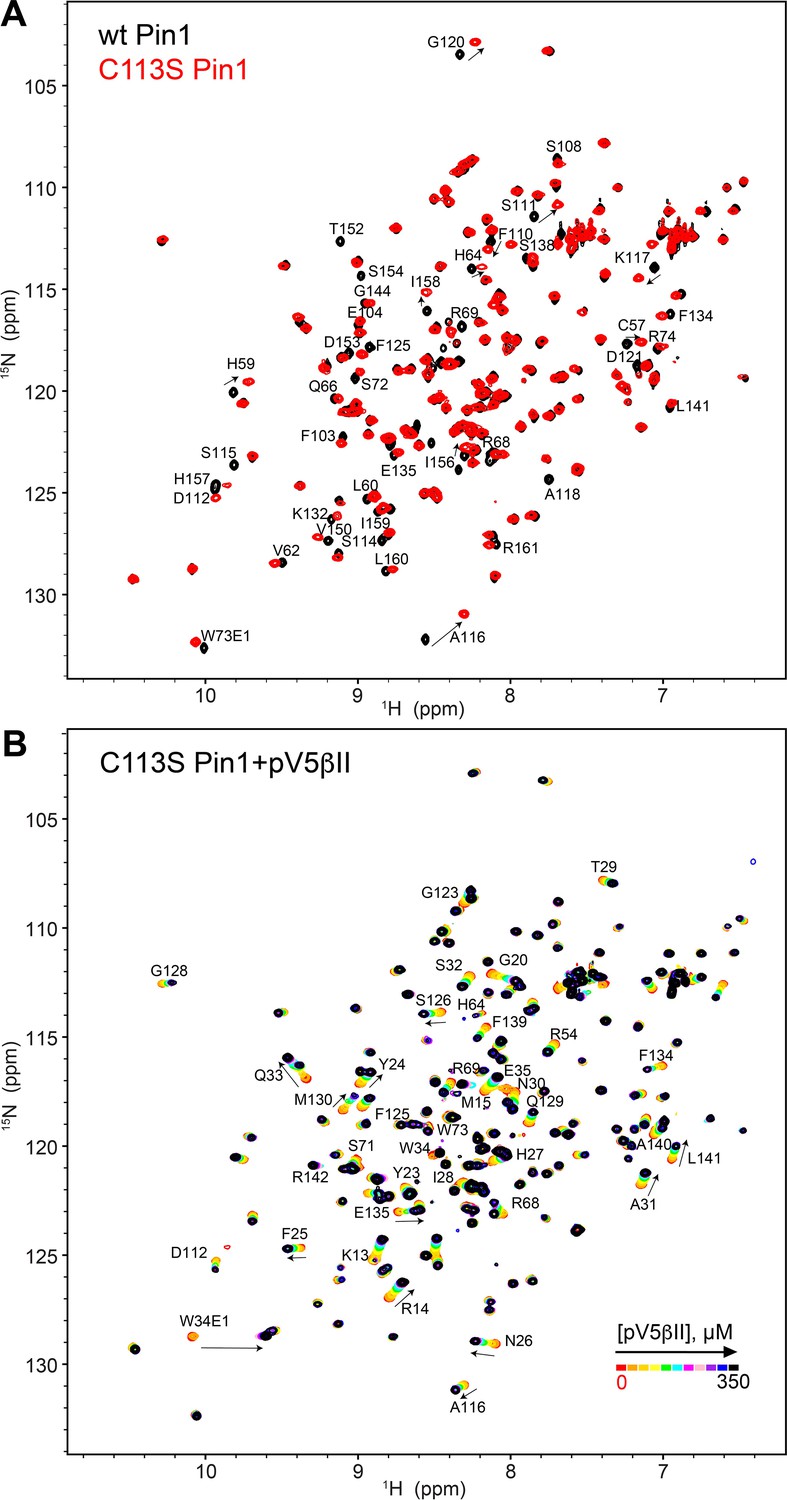
The C-term region of PKCβII binds to the catalytically deficient C113S Pin1 variant.
(A) The C113S Pin1 spectrum (red) shows minimum chemical shift perturbations compared to that of the wild-type (WT) Pin1 (black). (B) The C-term region pV5βII binds to C113S Pin1, evidenced by the chemical shift changes upon addition of increasing amounts of pV5βII. The chemical exchange regime is identical to that observed for the WT Pin1 in Figure 4—figure supplement 1A. The protein concentration was 100 μM, and the pV5βII concentration varies from 0 μM to 350 μM (Supplementary file 2, binding experiment ID #19).
Figure 4—figure supplement 4
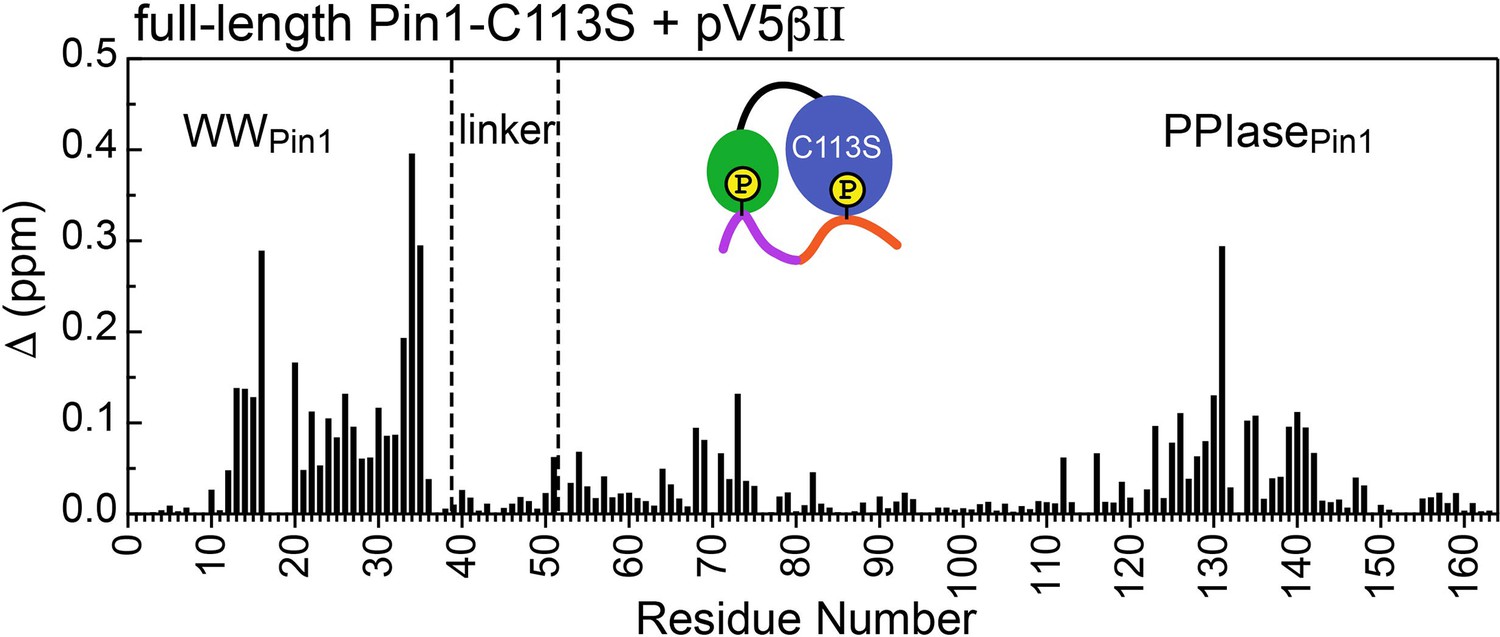
Unidirectional bivalent binding mode of the C-terminal PKCβII region to C113S Pin1.
The chemical shift perturbation (CSP) plot was constructed using the chemical shifts of the apo and pV5βII-bound C113S Pin1. The similarity of CSP patterns between the pV5βII-complexed wild-type (Figure 4A of the main manuscript) and C113S Pin1 indicates that the binding mode of the PKCβII C-term region does not change as a result of the mutation. The protein concentration in the C113S Pin1 experiments was 100 μM and the maximum concentration of pV5βII was 350 μM (Supplementary file 2, binding experiment #19).
Figure 4—figure supplement 5
Thermodynamic benefits of bivalent of Pin1-C-term PKCα interactions.
Kd values for the monovalent interactions of the hydrophobic and turn motifs with isolated Pin1 domains and full-length Pin1 are contrasted with the Kd value for the bivalent Pin1-pV5α interactions. ~3-fold enhancement for the pTM binding to the WW domain and ~60-fold enhancement of the pHM binding to the PPIase domain are attributed to bivalency. The Kd values used for this plot were obtained in the NMR-detected binding experiments #3, 4, 6, 7, and 14 (Supplementary file 2).
Figure 5 with 2 supplements

Phosphorylation state of the conserved C-term motifs defines the C-term interaction mode with Pin1.
(A) Chemical shift perturbation (CSP) pattern of full-length Pin1 due to interactions with the monophosphorylated V5βII-pTM-HM region. The concentrations of Pin1 and V5βII-pTM-HM are 100 μM and 0.46 mM, respectively. (B) Chemical shift correlation plots between the Pin1::pV5βII and Pin1::V5βII-pTM-HM complexes, plotted separately for the WW (green) and the PPIase (blue) domains. pTM interacts exclusively with the WW domain and thereby imposes a unidirectional bivalent mode. The differences in the PPIase CSPs are due to the differences in the HM phosphorylation state between pV5βII and V5βII-pTM-HM. (C) CSP pattern of full-length Pin1 due to interactions with the monophosphorylated V5βII-TM-pHM region. The concentrations of Pin1 and V5βII-TM-pHM are 100 μM and 1.64 mM, respectively. (D) Chemical shift correlation plots between the Pin1::pHMβII and Pin1::V5βII-TM-pHM complexes, plotted separately for the WW (green) and the PPIase (blue) domains. High similarity of chemical shifts indicates that pHMβII and V5βII-TM-pHM binding modes are identical. (E–H) CSPs of full-length Pin1 due to interactions with the C-term PKC regions mapped onto the extended NMR structure of apo Pin1 (1nmv). The similarity of the Pin1 CSP patterns due to α and βII C-term binding suggest similar Pin1 interaction modes with PKCβII and PKCα isoforms. Phosphorylation of TM imposes a unidirectional bivalent mode irrespective of the phosphorylation state of the HM (E, F). Phosphorylation of HM directs HM to its binding sites on the WW and PPIase domains but does not impose a bivalent interaction mode (G). (H) Pin1 interactions with unphosphorylated C-term are only detectable for the C-term of PKCβII. (I) Dissociation constants of the Pin1::C-term(βII) complexes illustrating the enhancement of binding affinity due to phosphorylation. The data for the V5-TM-pHM binding to WW and PPIase are color-coded green and blue, respectively. The protein concentration is 100 μM. Other details are given in Supplementary file 2, binding experiment IDs #11, 13, 15, and 16. (J) 2D [15N-1H] heteronuclear single-quantum coherence (HSQC) spectra of the arginine sidechains in apo Pin1 (black) and Pin1::pV5βII complex (maroon). Cross-peaks that are exchanged-broadened in apo Pin1 but reappear upon pV5βII binding belong to the Arg residues in the phosphate binding sites of WW (green) and PPIase (blue). TM, turn motif; HM, hydrophobic motif.
Figure 5—figure supplement 1
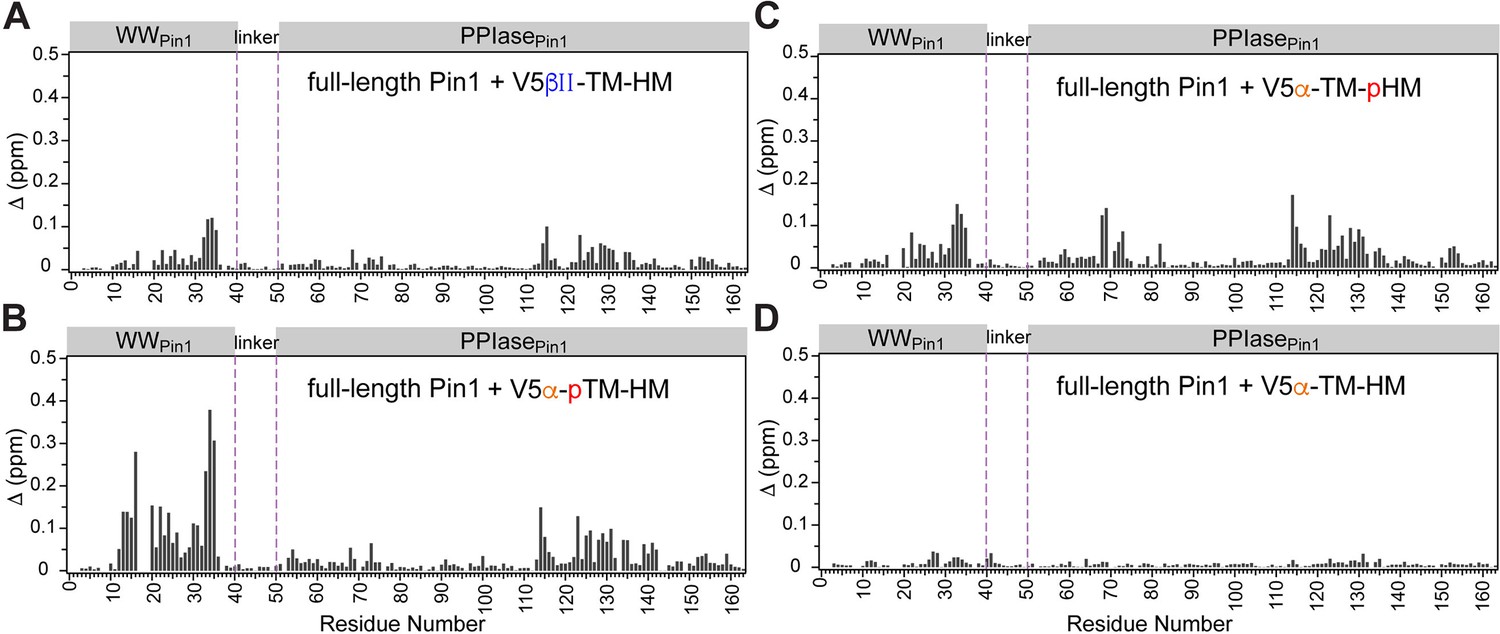
Pin1 chemical shift perturbation (CSP) plots of Pin1 obtained at maximum concentrations of V5βII-TM-HM (A), V5α-pTM-HM (B), V5α-TM-pHM (C), and V5α-TM-HM (D).
The protein concentration was 100 μM. Other details are given in Supplementary file 2. TM, turn motif; HM, hydrophobic motif.
Figure 5—figure supplement 2
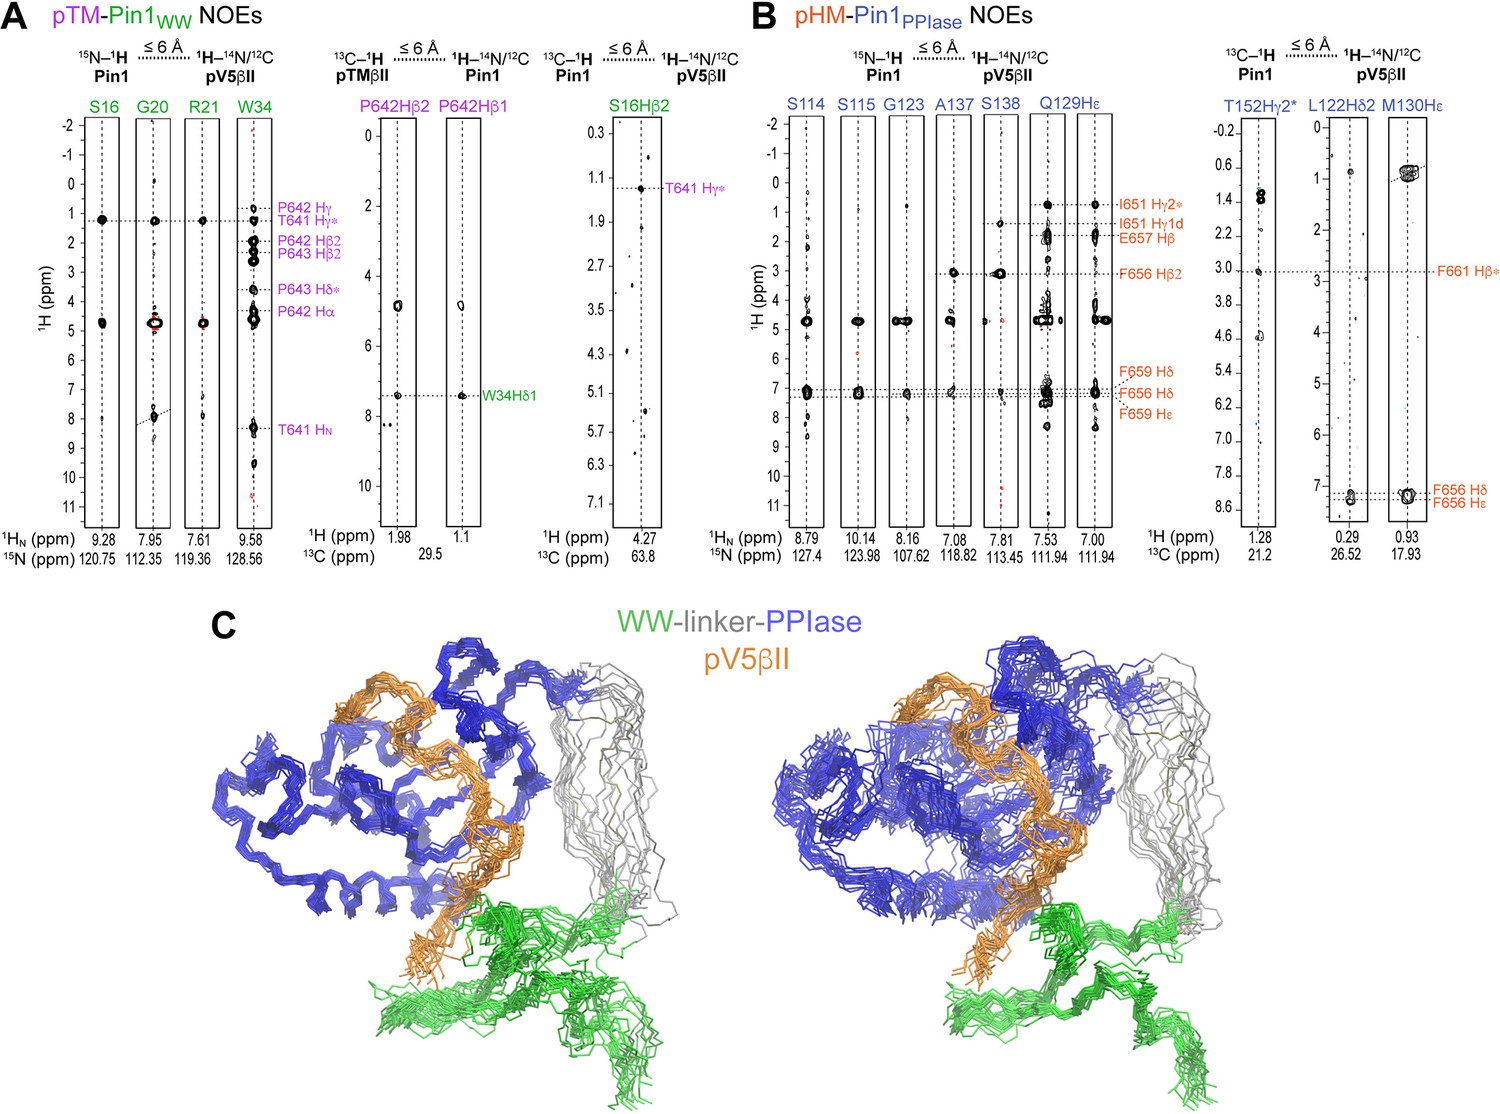
Representative inter-molecular 1H-1H NOEs between the pTM-WWPin1 (A) and pHM-PPIasePin1 (B).
The assignment labels are color-coded according to the Pin1 domain/C-terminal PKCβII region. (C) NMR ensemble of the Pin1::pV5βII complex (PDB ID 8SG2) reveals a novel Pin1 substrate-binding mode. 20 lowest-energy structures of the Pin1::pV5βII ensemble superimposed using either the PPIase domain (left panel) or WW domain (right panel).
Figure 6 with 5 supplements

Structure of the Pin1::pV5βII complex reveals the bivalent recognition mode.
(A) The lowest-energy NMR structure showing the pV5βII backbone (tan) forms an extensive binding interface with the WW (green) and PPIase (blue) domains of the full-length Pin1. pV5βII is broken into four segments, S1-S4, to facilitate the structural analysis. The phosphorylated Ser of the hydrophobic motif (HM) and Thr of the turn motif (TM) are shown in van der Waals representation. (B) Overlay of the crystal structure of the Pin1-AlaPro complex (1pin) and the NMR structure of the Pin1-pV5βII complex (8SG2, this work), illustrating the 70° rotation of the WW domain, along with the displacement of the α4 helix and the α4-β2 loop. (C) The ‘pTM anchor’ segment is positioned at the interface between WW and PPIase domains. The phosphate group of pThr641 forms a salt bridge with Arg17. (D) The ‘turn’ segment is stabilized by intramolecular hydrogen bonds and is wedged between the WW and PPIase domains. (E) The ‘groove’ segment is threaded between the α4 helix and the β3-β4 hairpin of PPIase. (F) The ‘pHM anchor’ segment occupies the catalytic site of the PPIase domain. Residues forming the site are color-coded according to amphiphilicity. The phosphate group of pSer660 forms salt bridges with the Arg68 and Arg69 residues of the catalytic loop. Hydrogen bonds and salt bridges are shown with black dashed lines.
Figure 6—figure supplement 1
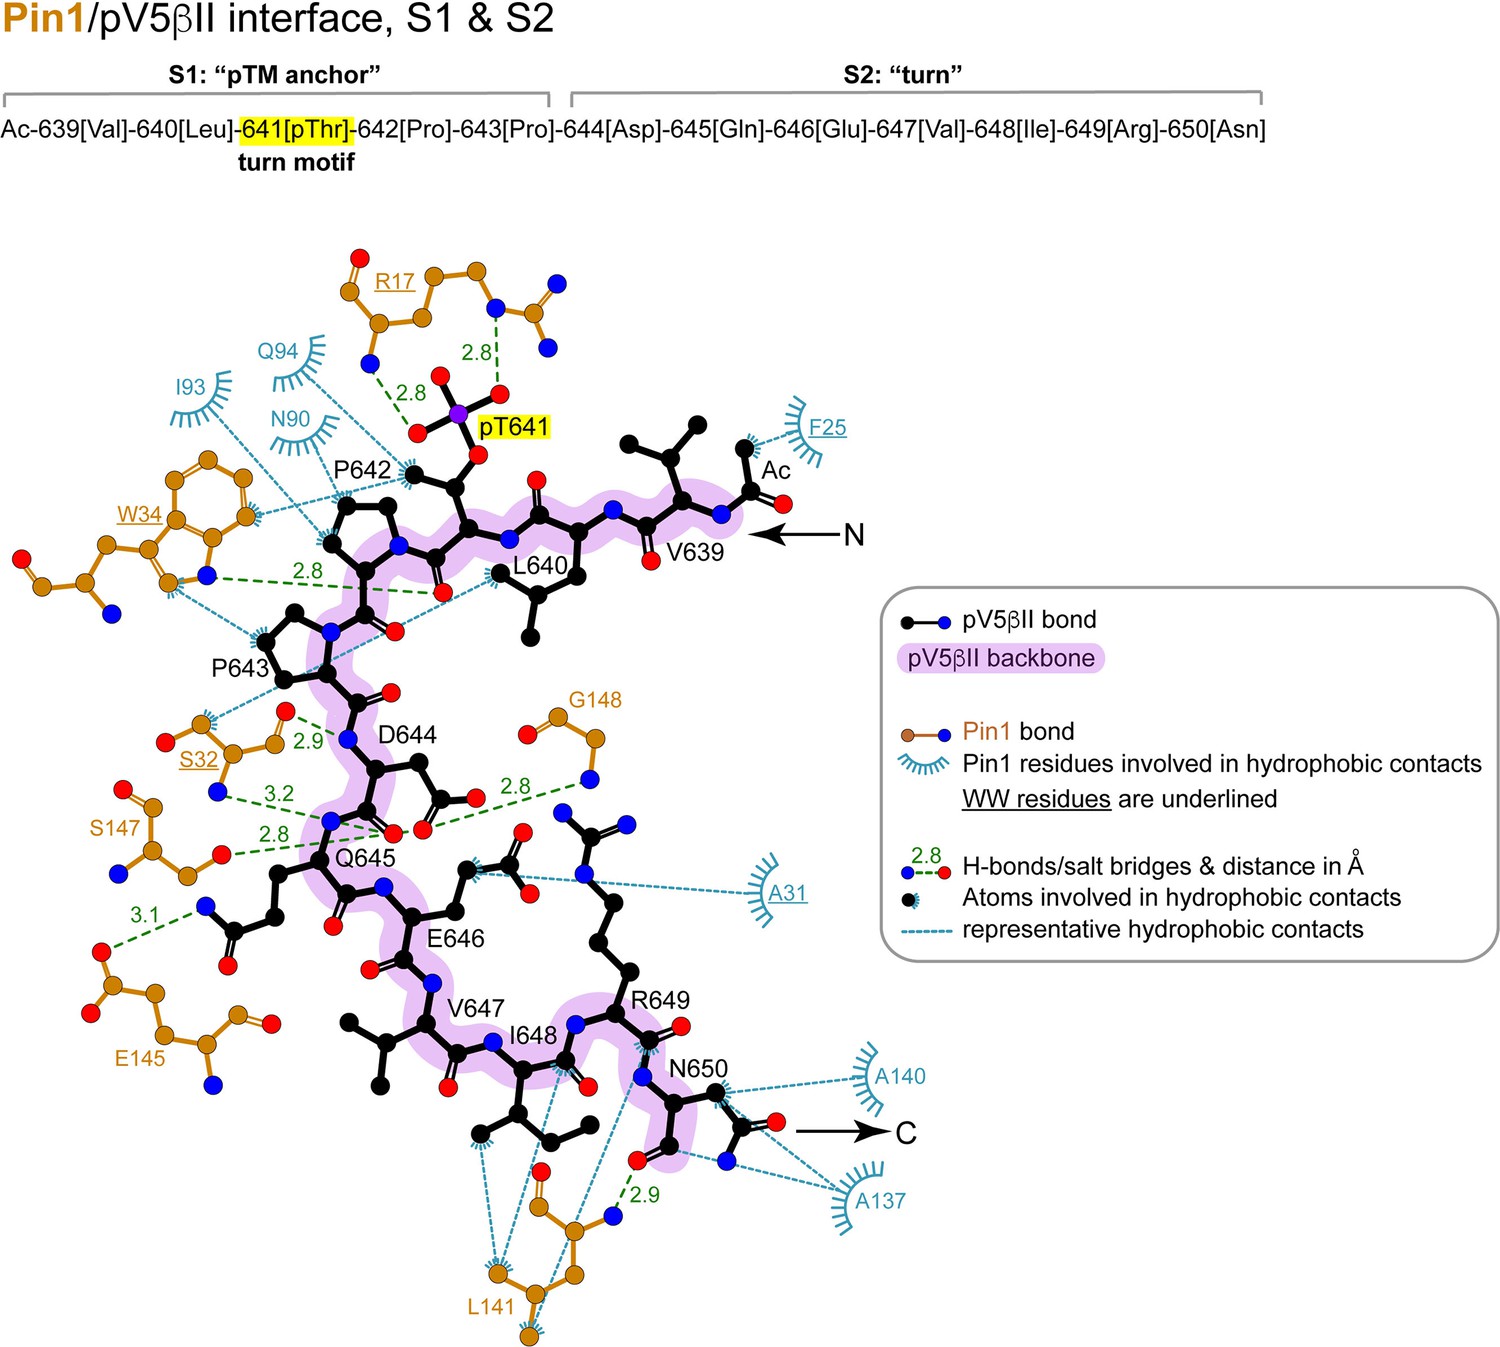
2D LigPlot+ diagram of representative Pin1 interactions with residues 639–650 (‘pTM anchor’ and ‘turn’) of pV5βII.
The lowest-energy structure of the Pin1::pV5βII complex was used to generate the diagram. The contact cutoff for hydrophobic contacts is 4.0 Å. The turn motif is highlighted in yellow.
Figure 6—figure supplement 2
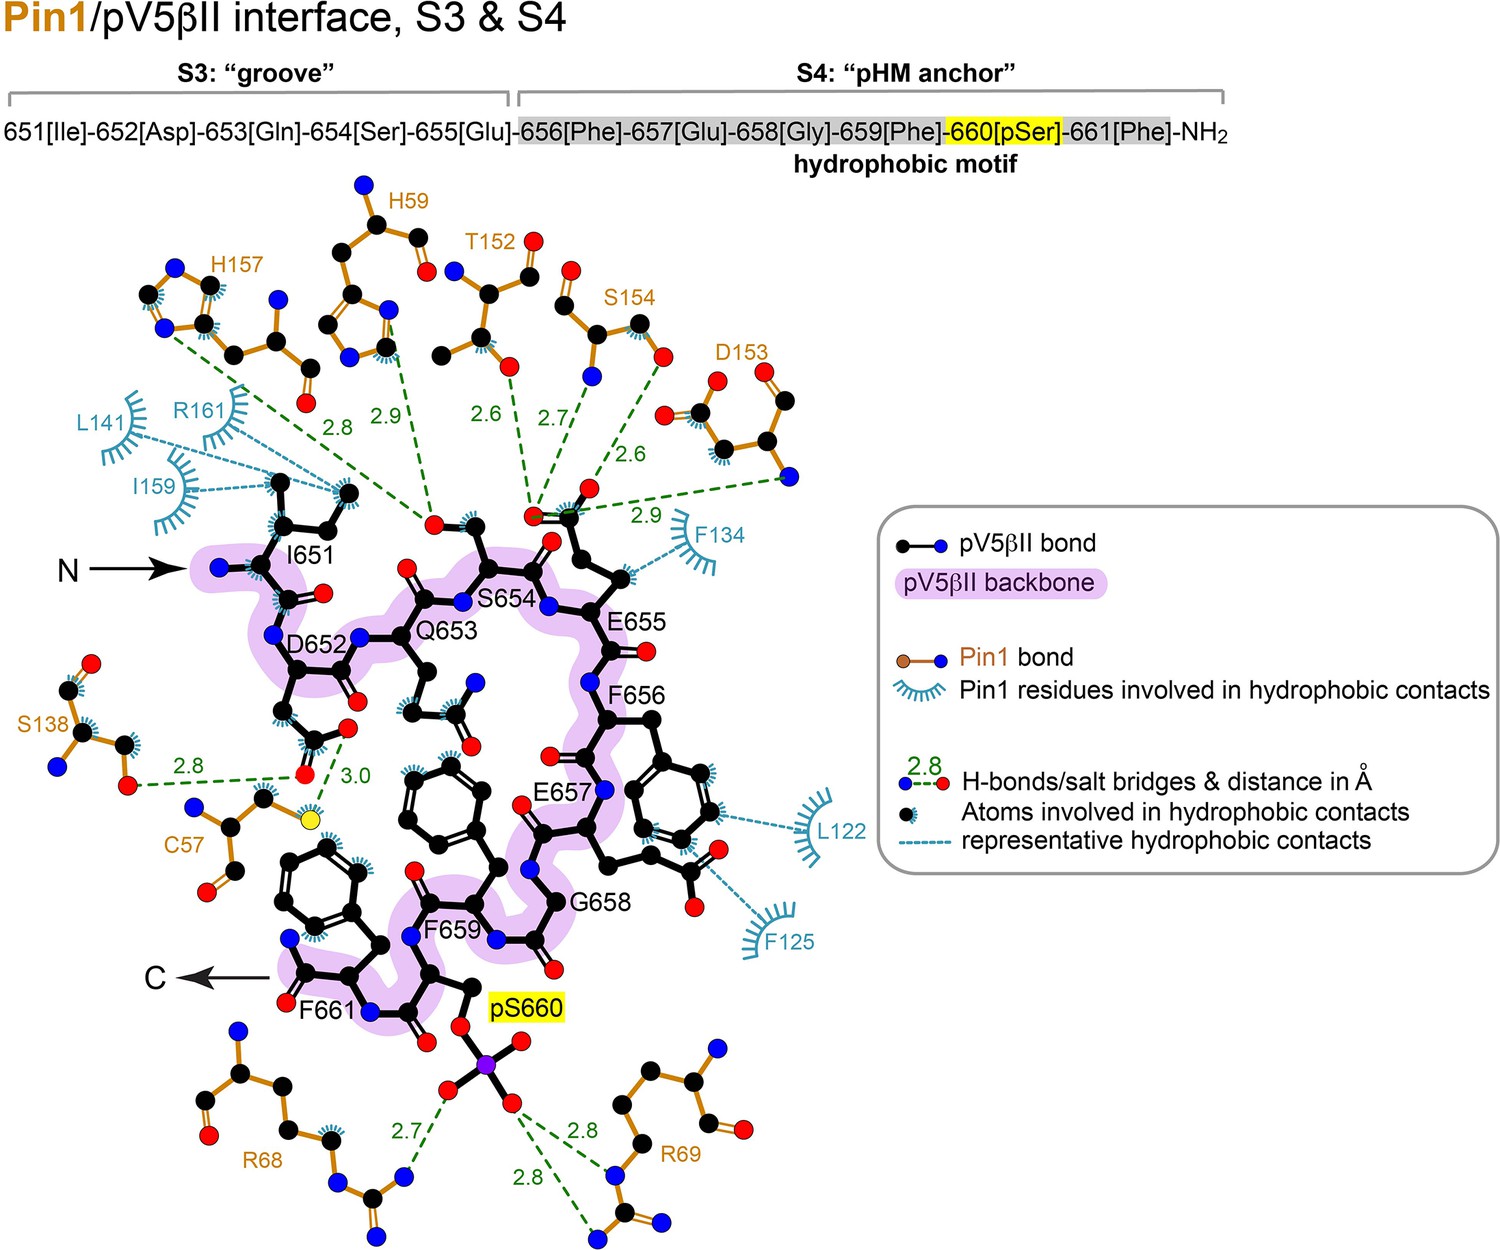
2D LigPlot+ diagram of representative Pin1 interactions with residues 651–661 (‘groove’ and ‘pHM anchor’ segments) of pV5βII.
The lowest-energy structure of the Pin1::pV5βII complex was used to generate the diagram. The contact cutoff for hydrophobic contacts is 4.0 Å. The hydrophobic motif is highlighted in gray.
Figure 6—figure supplement 3
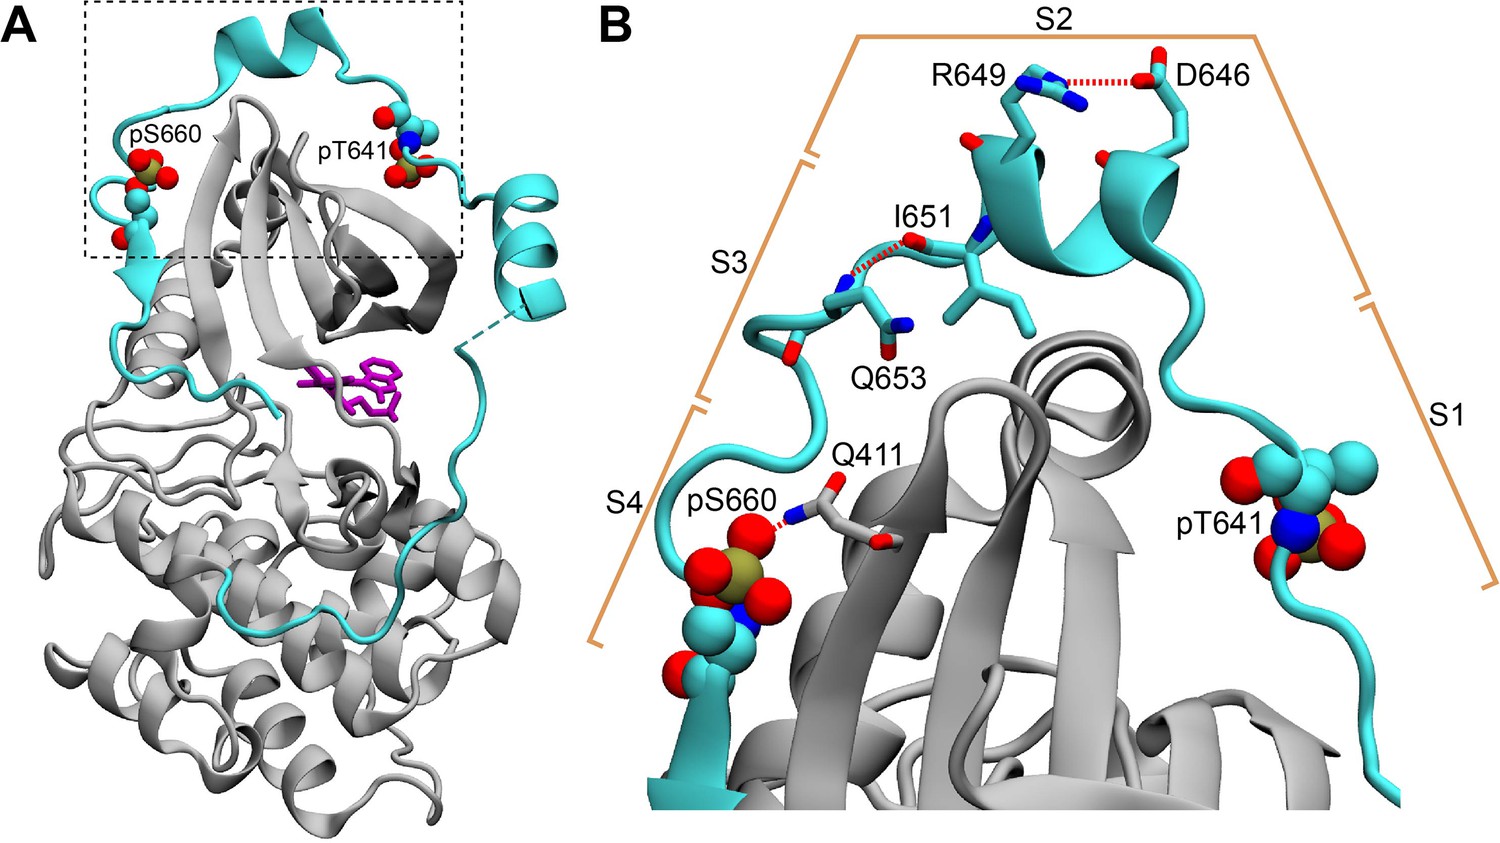
The C-terminal tail in the structure of the PKCβII catalytic domain (PDB ID 2I0E).
(A) The C-terminal V5 domain (cyan) has elevated B-factors and peripherally interacts with the N-lobe of the catalytic domain (gray). (B) The intra-V5 R649-D646 salt bridge and the Q653(N-HN)-(O=C)I651 H-bond that are also present in the Pin1-bound pV5βII are labeled. The S1-S4 segment notation that we used to analyze the Pin1::pV5βII complex is shown in the context of the catalytic domain structure.
Figure 6—figure supplement 4
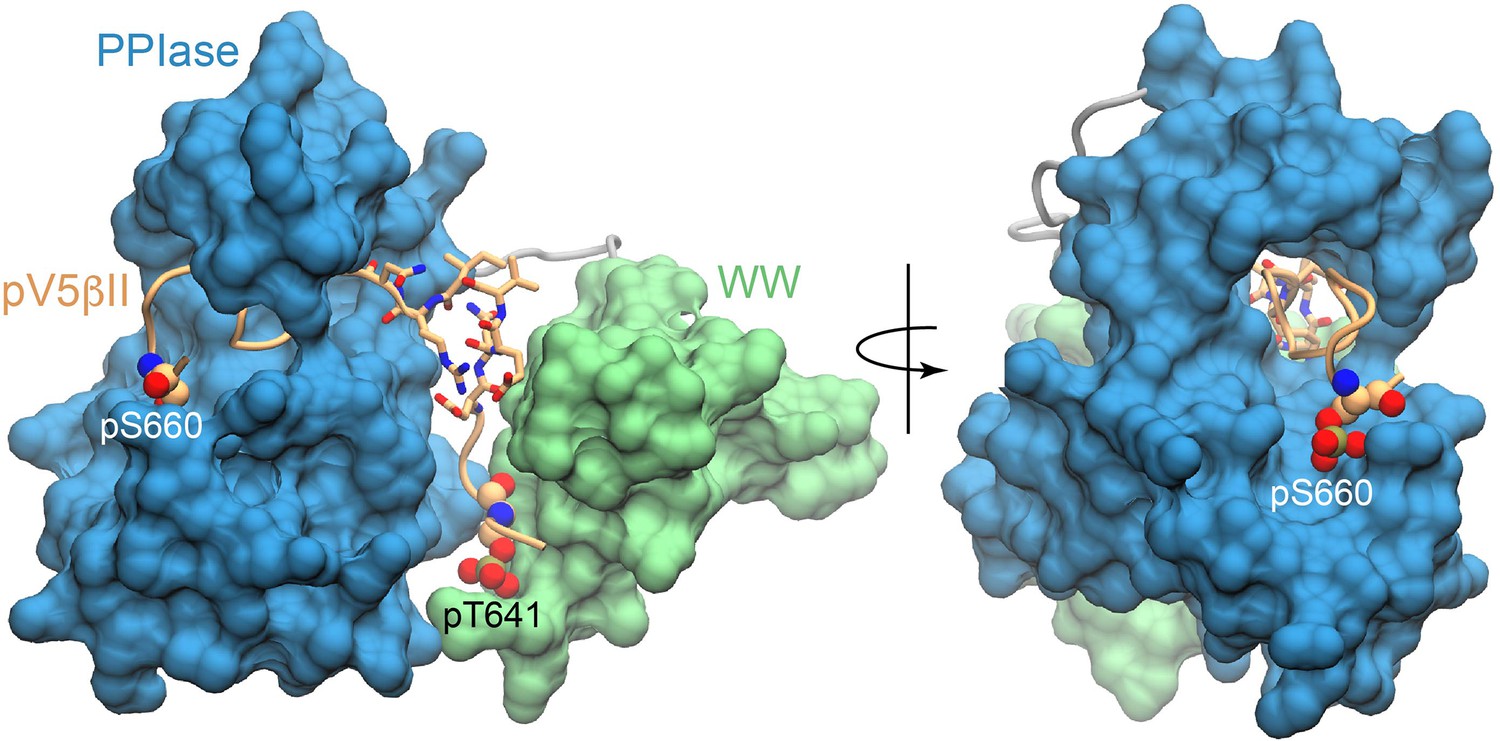
The C-terminal part of pV5βII is threaded through the PPIase groove.
Space-filling representation showing the threading of pV5βII through the PPIase domain and its anchoring by the phosphate group of pS660. The ‘turn’ segment is shown in licorice representation. The figures were prepared using the lowest-energy Pin1::pV5βII structure.
Figure 6—figure supplement 5
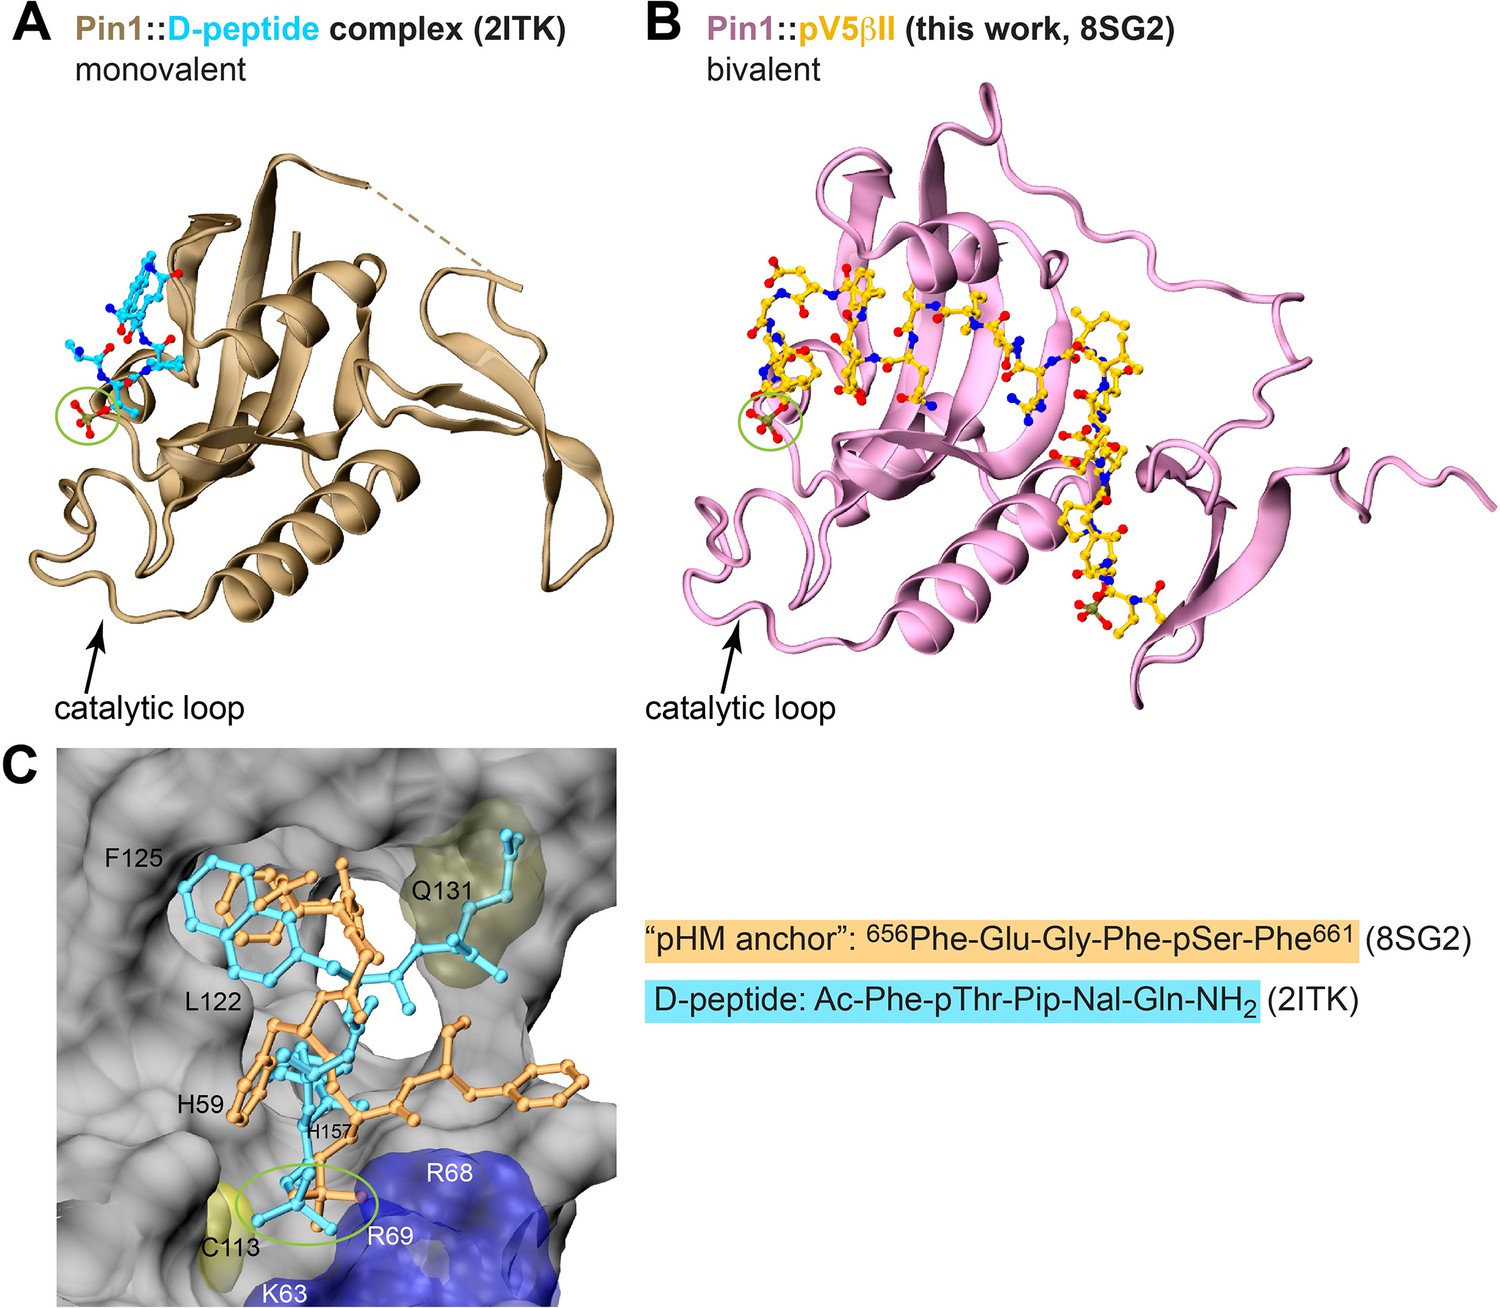
Comparison of the binding poses between the D-peptide, a potent unnatural peptide inhibitor of Pin1, and the ‘pHM anchor’ segment of pV5βII.
Crystal structure of the monovalent Pin1::D-peptide complex (A) and the lowest-energy NMR structure of the bivalent Pin1::pV5βII complex (B). The phosphate group interacting with the catalytic loop is highlighted with a green circle. (C) The binding poses of the ‘pHM anchor’ (dark yellow) and the D-peptide (cyan) in the catalytic site of Pin1. The Gln sidechain of the D-peptide occupies the space that is taken up by the Pin1 Gln131 sidechain in the Pin1::pV5βII complex.
Figure 7 with 1 supplement
Regulation of PKCα homeostasis by Pin1 in HEK293T cells.
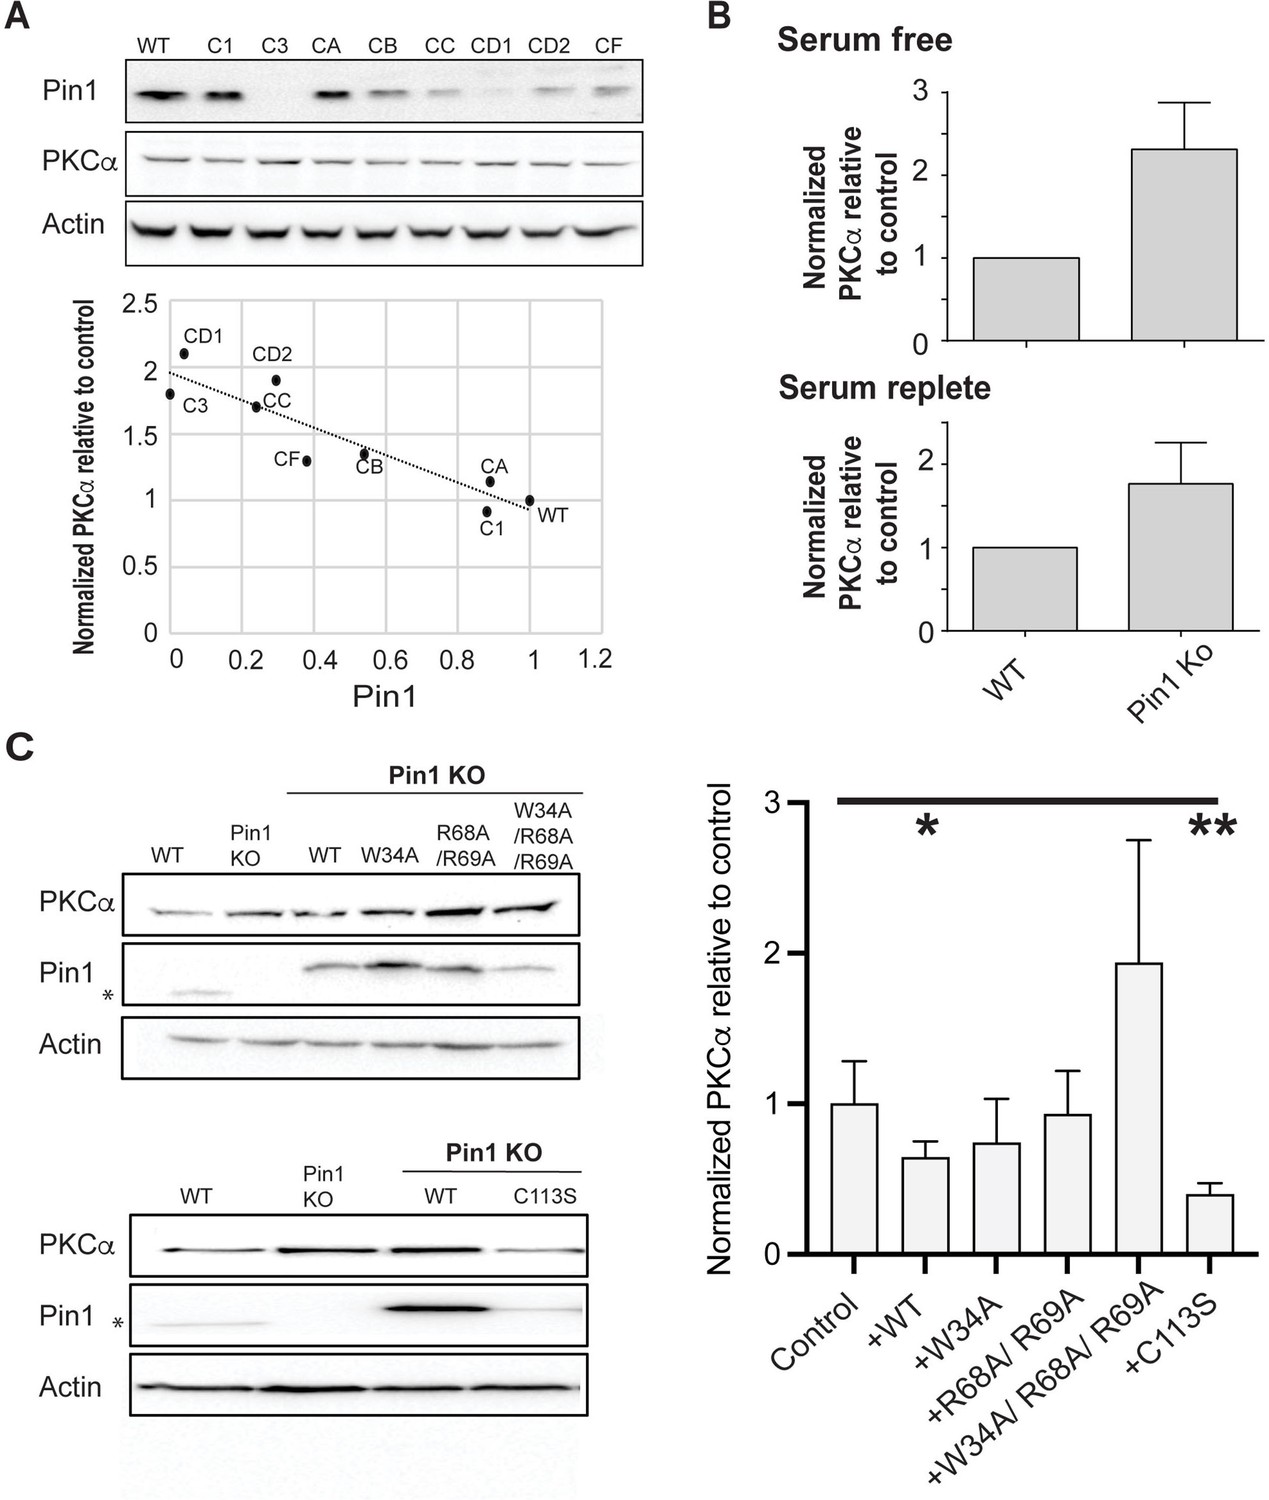
(A) PKCα protein levels at steady-state are inversely proportional to Pin1 levels. HEK293T cells were transfected with CRISPR/Cas9 plasmids encoding Pin1 guide RNAs and clonal lines were generated. Lysates of the clonally derived cell lines were resolved by SDS-PAGE, transferred to nitrocellulose, and immunoblots developed to visualize PKCα, Pin1, and actin. Blot profiles are shown at top. Bottom panel relates steady-state PKCα protein levels to Pin1 steady-state levels. Actin was used to normalize the PKCα and Pin1 profiles for each cell line and the PKCα/actin ratio was set as 1.0 for parental wild-type (WT) Pin1 cells. Clone 3 (C3) expressed no detectable Pin1 antigen and was selected for further study. (B) Pin1 null HEK293T cells exhibit elevated steady-state PKCα protein levels when cells are incubated under serum-free (upper panel; 2.3 ± 0.2; n=7; p<0.0001, two-tailed t-test) and serum-replete conditions (lower panel; 2.3 ± 0.3; n=12; p<0.0002, two-tailed t-test). Actin was used to normalize the PKCα and Pin1 immunoblot profiles for each cell line and the PKCα/actin ratios were set as 1.0 for parental WT Pin1 cells. (C) PKCα regulation by Pin1 derivatives with defined biochemical defects. Left panels: At top are shown representative PKCα, Pin1, and actin immunoblot profiles for WT HEK293T cells, Pin1 KO cells (C3), and Pin1 KO cells stably expressing the indicated mutant Pin1 proteins defective in PKCα binding. At bottom are shown representative PKCα. Pin1 and actin immunoblot profiles for WT HEK293T cells, Pin1 KO cells (C3), and Pin1 KO cells stably expressing the ‘catalytic-dead’ Pin1C113S mutant. In both panels the asterisk denotes endogenous Pin1 as the ectopically expressed Pin1 proteins are 3.6 kDa larger in molecular mass due to the myc and DDK epitopes with which these are tagged at their C-termini (Pin1-TRTRPLEQKLISEEDLAANDILDYKDDDDKV). Right panel: Quantification of PKCα steady-state levels in Pin1 null cells (control) and Pin1 null cells reconstituted for expression of the indicated mutant Pin1 proteins as indicated at bottom. For quantification, actin was used to normalize the PKCα and Pin1 profiles for each cell line and the PKCα/actin ratios were set as 1.0 for control Pin1 KO cells. Data represent the averages of five independent biological replicates ± standard deviation. Values were related to Pin1 KO control using an unpaired two-tailed t-test (* p<0.05; **p<0.01). The uncropped immunoblots are provided as source data.
-
Figure 7—source data 1
Original uncropped immunoblots for data in Figure 7A.
- https://cdn.elifesciences.org/articles/92884/elife-92884-fig7-data1-v1.zip
-
Figure 7—source data 2
Original uncropped immunoblots for data in Figure 7C.
- https://cdn.elifesciences.org/articles/92884/elife-92884-fig7-data2-v1.zip
Figure 7—figure supplement 1
PKCα levels in cells with reduced Pin1 function.
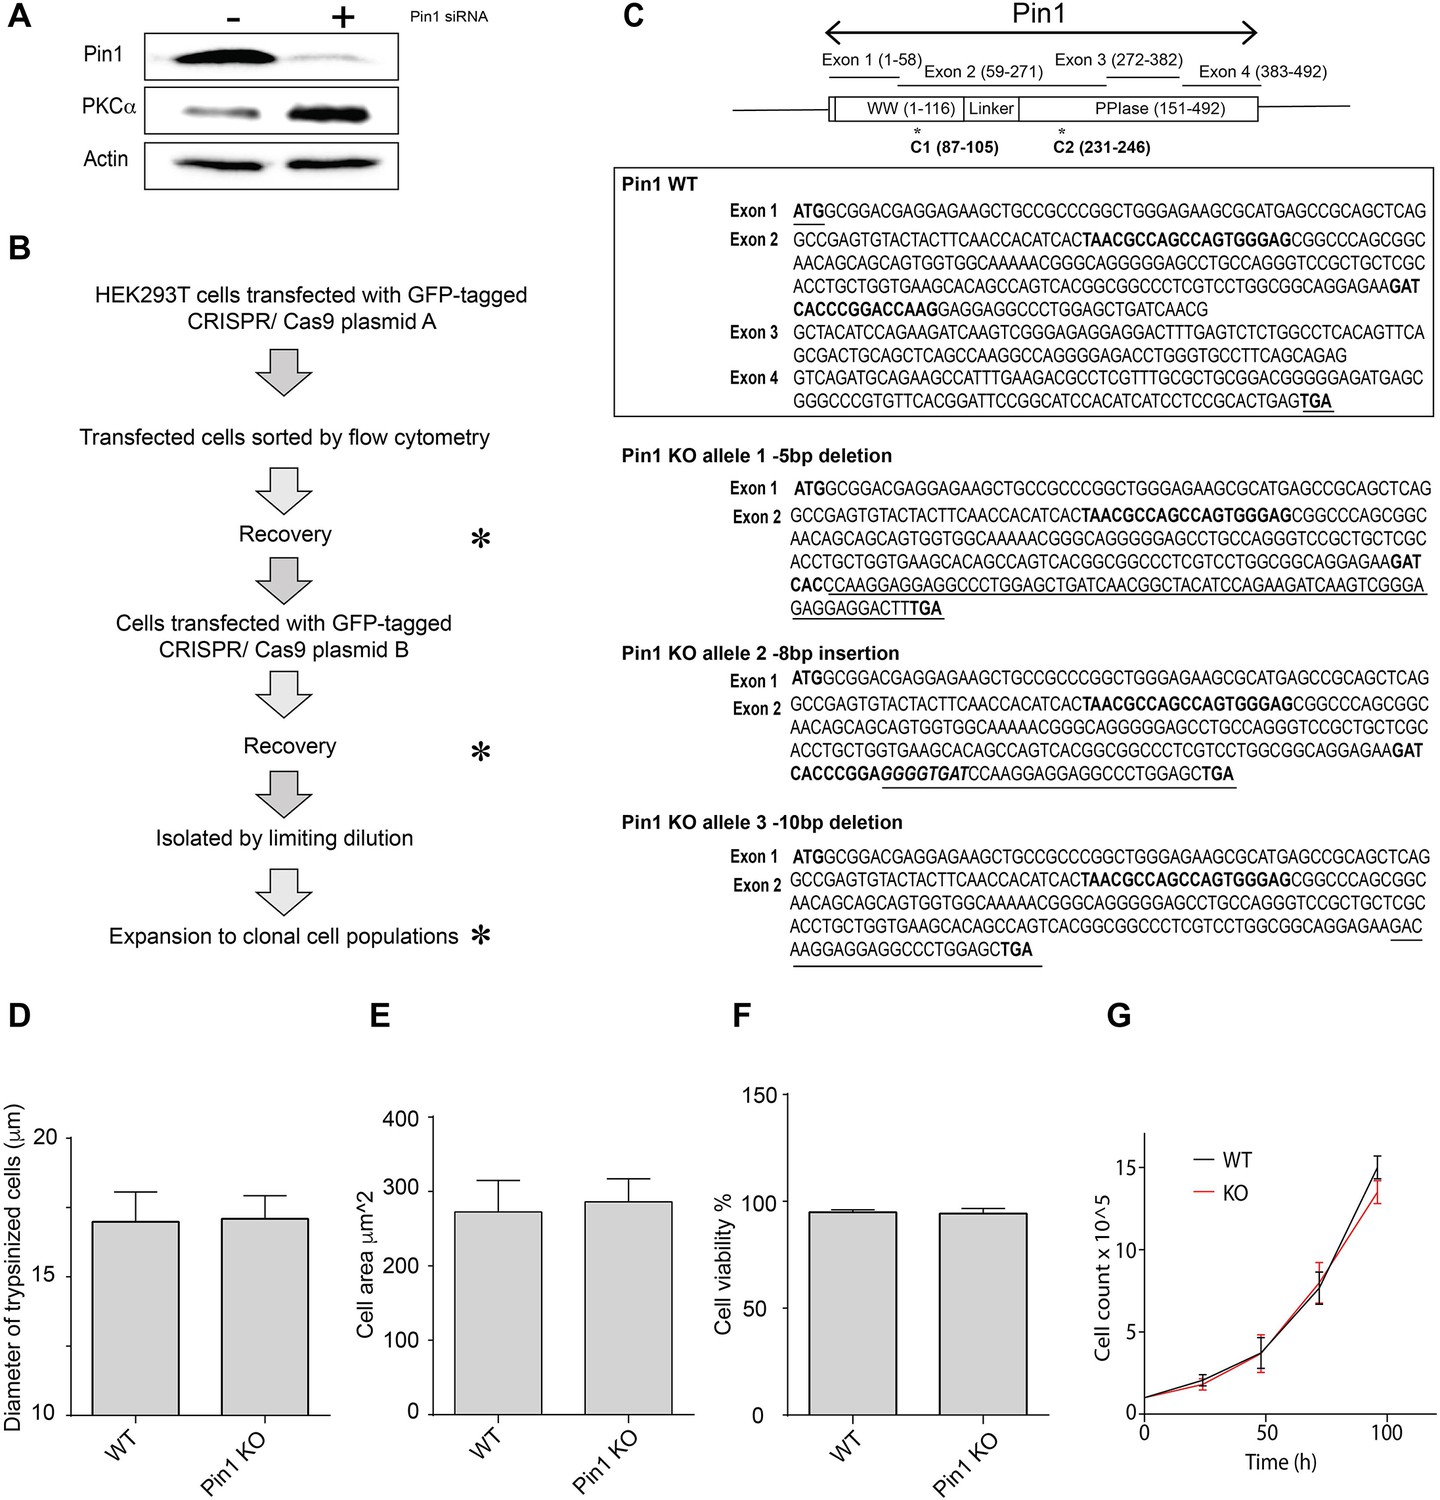
(A) HEK293T cells were transfected with mock or Pin1 siRNA as indicated at top, incubated for 72 hr in serum-replete medium, and cell lysates were prepared and analyzed by immunoblotting. Immunoblot profiles for Pin1, PKCα, and actin are shown. Actin provides a normalizing signal. Pin1 knockdown (~90%) resulted in a significant elevation of PKCα levels. The uncropped immunoblots are provided as source data. (B) Diagram outlining the workflow for generating clonally derived Pin1 null HEK293T cells using CRISPR/Cas9. (C) At top is illustrated the Pin1 gene organization with codons present in each exon shown in parentheses. Domain organization of the Pin1 protein is shown at bottom. Middle panel shows the exon coding sequences for Pin1. The start and stop codons are highlighted (underlined, bold) as are the CRISPR/Cas9 targeting sequences in exon 2 (bold). Bottom panel shows the open reading frames of each of the three Pin1 null alleles identified in clone C3. The natural start codon and the CRISPR/Cas9 targeting sequences in exon 2 are highlighted in bold. The short open reading frame extensions that lie downstream of each frameshift allele are underlined and the nonsense codons that terminate translation are indicated in bold. (D) The diameters (µm) of trypsinized wild-type or Pin1 KO HEK293T cells were determined using a Countess automated cell counter. 1-5 x10⁴ cells were counted in each of 14 independent biological replicates and data are presented as average diameters ± standard deviation. Values were related to Pin1 WT control using an unpaired two-tailed t-test (no significant difference). (E) Cell areas (µm2) of trypsinized wild-type or Pin1 KO HEK293T cells were determined by flow cytometry. 1 x10⁴ cells were analyzed in each of 3 independent biological replicates. Data are presented as average cell areas ± standard deviation. Values were related to Pin1 WT control using an unpaired two-tailed t-test (no significant difference). (F) Viabilities of trypsinized wild-type or Pin1 KO HEK293T cells were assessed by trypan blue staining coupled to imaging with a Countess automated cell counter. 1-5 x10⁴ cells were counted in each of 10 independent biological replicates, data are expressed as average percentages of viable cells ± standard deviation, and values were related to Pin1 WT control using an unpaired two-tailed t-test (no significant difference). (G) Growth rates of wild-type and Pin1 KO HEK293T cells were followed in a 96 hr window with an initial count of 1×10⁵ cells (n=3). Similar data showing no difference between wild-type and KO cell growth rates were also observed when the initial count was reduced to 5×10⁴ cells (data not shown).
-
Figure 7—figure supplement 1—source data 1
Original uncropped immunoblots for data in Figure 7—figure supplement 1A.
- https://cdn.elifesciences.org/articles/92884/elife-92884-fig7-figsupp1-data1-v1.zip
Figure 8

Non-catalytic role for Pin1.
(A) Non-isomerizable pSer/Thr-Pro-Pro turn motifs separated by <25 residues from the hydrophobic motifs are present in the C-term tails of other AGC kinases, such as AKT and PKN. (B) A possible model for Pin1-mediated downregulation of PKCα and βII isoforms. In the compact autoinhibited state, the pseudosubstrate (PS) blocks the catalytic site of the kinase and the C-terminal tail is not accessible. PKC activation involves Ca2+-dependent recruitment to the membranes where the regulatory domains, C1 through C2, bind diacylglycerol (DAG), phosphatidylserine (PtdSer), and phosphatidylinositol 4,5-bisphosphate (PtdIns(4,5)P2) and thereby trigger the release of autoinhibitory interactions. The activated open PKC conformation exposes the C-terminal V5 domain that is then engaged by Pin1 via bivalent binding to the phosphorylated turn motif (TM) and hydrophobic motif (HM). Pin1 might facilitate the recruitment of phosphatases to PKC by stabilizing the PKC open form. This promotes dephosphorylation of the C-term motifs and subsequent ubiquitination and degradation of the kinase.
Videos
Video 1
Visualization of the lowest energy structure of the Pin1::pV5βII NMR ensemble.
Additional files
-
Supplementary file 1
Properties of the 18 PKC C-terminal-derived peptides used in this study.
All peptides have acetylated N-termini and amidated C-termini. TM and HM stand for the turn and hydrophobic motifs, respectively. The phosphorylated Thr of the TM and phosphorylated Ser of the HM are shown in red. Peptides having ‘V5’ in their name contain both TM and HM. Peptides starting with ‘p’ indicate that the peptide is phosphorylated at either one or both motifs, the latter only for the ‘V5’ peptides.
- https://cdn.elifesciences.org/articles/92884/elife-92884-supp1-v1.docx
-
Supplementary file 2
List of binding experiments carried out in this study, with the corresponding values of the dissociation constants Kd obtained from the chemical shift binding curves and/or lineshape analysis.
- https://cdn.elifesciences.org/articles/92884/elife-92884-supp2-v1.docx
-
Supplementary file 3
List of the NMR samples and experiments for the structure determination of the complex.
Sample 2* was prepared in the buffer containing 100% D2O.
- https://cdn.elifesciences.org/articles/92884/elife-92884-supp3-v1.docx
-
Supplementary file 4
NMR restraints statistics for the CYANA structure calculation.
- https://cdn.elifesciences.org/articles/92884/elife-92884-supp4-v1.docx
-
MDAR checklist
- https://cdn.elifesciences.org/articles/92884/elife-92884-mdarchecklist1-v1.pdf
Download links
A two-part list of links to download the article, or parts of the article, in various formats.
Downloads (link to download the article as PDF)
Open citations (links to open the citations from this article in various online reference manager services)
Cite this article (links to download the citations from this article in formats compatible with various reference manager tools)
A novel bivalent interaction mode underlies a non-catalytic mechanism for Pin1-mediated protein kinase C regulation
eLife 13:e92884.
https://doi.org/10.7554/eLife.92884


