Spatiotemporal dissection of the Golgi apparatus and the ER-Golgi intermediate compartment in budding yeast
- Live Cell Super-Resolution Imaging Research Team, RIKEN Center for Advanced Photonics, Japan
- Laboratory of Molecular Cell Biology, Faculty of Medicine, University of Tsukuba, Japan
Figures
Figure 1 with 2 supplements
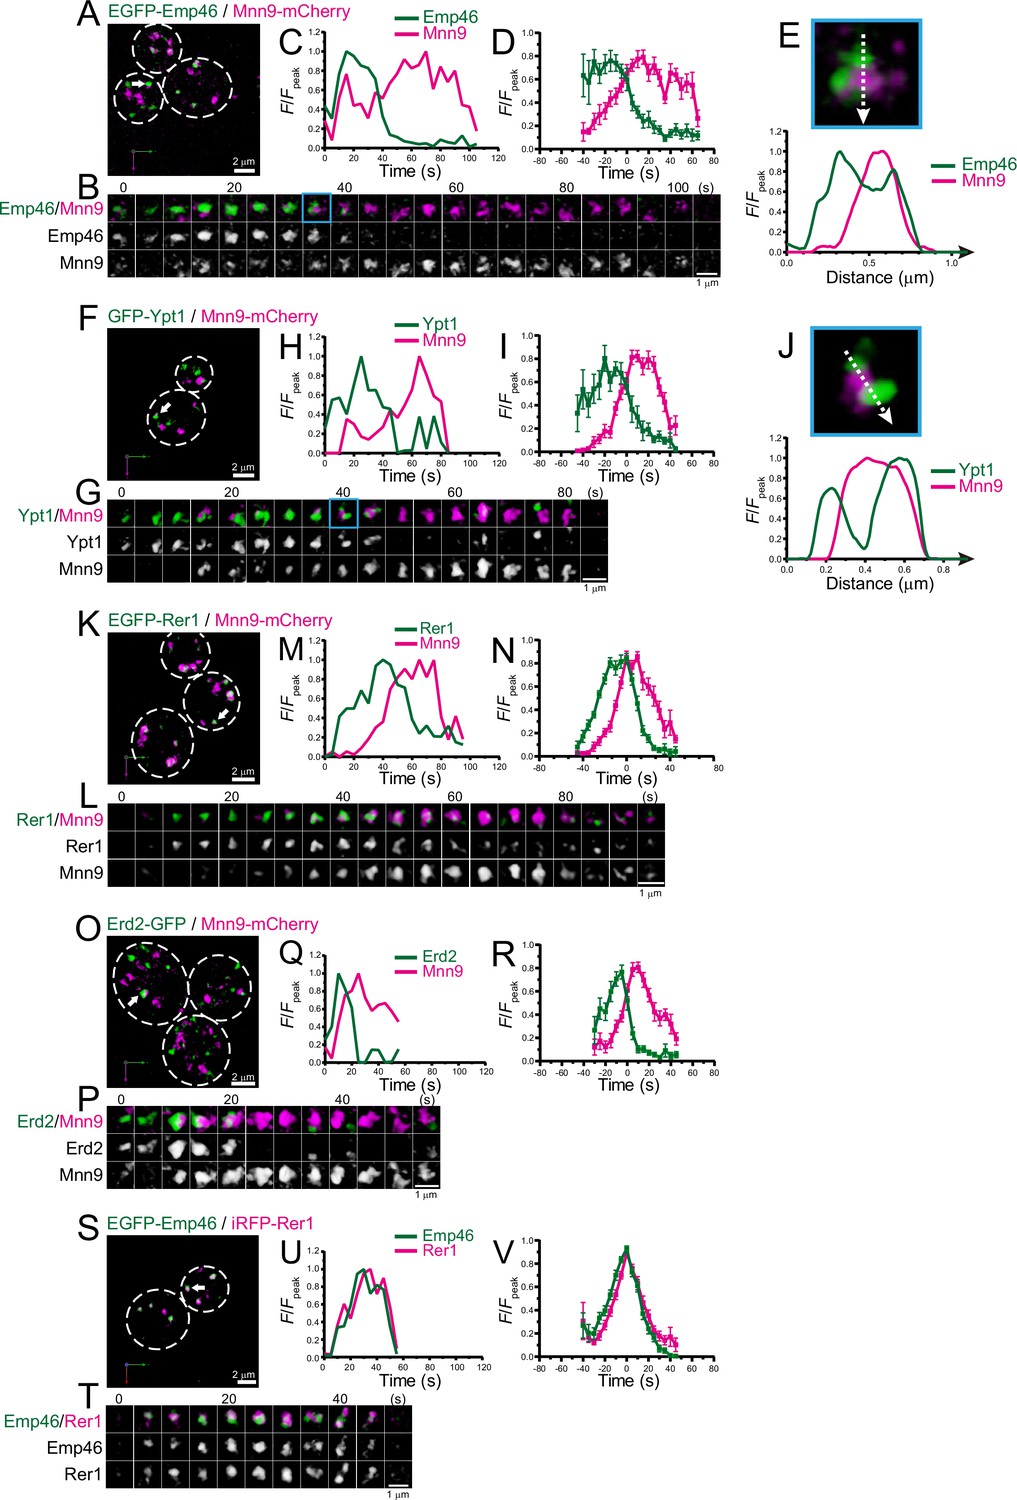
Four-dimensional (4D) dynamics of Emp46, Ypt1, Rer1, and Erd2.
Dual-color 4D super-resolution confocal live imaging microscopy (SCLIM) imaging of yeast cells expressing EGFP-Emp46 and Mnn9-mCherry (A–E), GFP-Ypt1 and Mnn9-mCherry (F–J), EGFP-Rer1 and Mnn9-mCherry (K–N), Erd2-GFP and Mnn9-mCherry (O–R), and EGFP-Emp46 and Rer1-iRFP (S–V). (A, F, K, O, and S) Low-magnification images of the cells. The white broken lines indicate the edge of the cells. (B, G, L, P, and T) Time-lapse images of the single cisternae (white arrows in A, F, K, O, and S, respectively) in the cells. (C, H, M, Q, and U) Time course changes in relative fluorescence intensities (F/Fpeak) of green and red channels in B, F, J, M, and P, respectively. (D, I, N, R, and V) Averaged time course changes in F/Fpeak of green and red channels (mean ± SEM). Time 0 was set as the midpoint between the green and red fluorescence peaks of each cisterna (n=10, 10, 14, 18, and 31 cisternae for D, I, N, R, and V, respectively). (E and J) Magnified images and their line scan analyses of EGFP-Emp46 and Mnn9-mCherry signals (E), and GFP-Ypt1 and Mnn9-mCherry signals (J) in the single maturing cisternae (blue rectangles in B and G). The F/Fpeak values (green and red channels) along the white broken lines in the upper panels are profiled in the graphs below. Scale bars: 2 μm (A, F, K, O, and S) and 1 μm (B, G, L, P, and T).
-
Figure 1—source data 1
Data used for graphs presented in Figure 1D, I, N, R, and V.
- https://cdn.elifesciences.org/articles/92900/elife-92900-fig1-data1-v1.xlsx
Figure 1—figure supplement 1
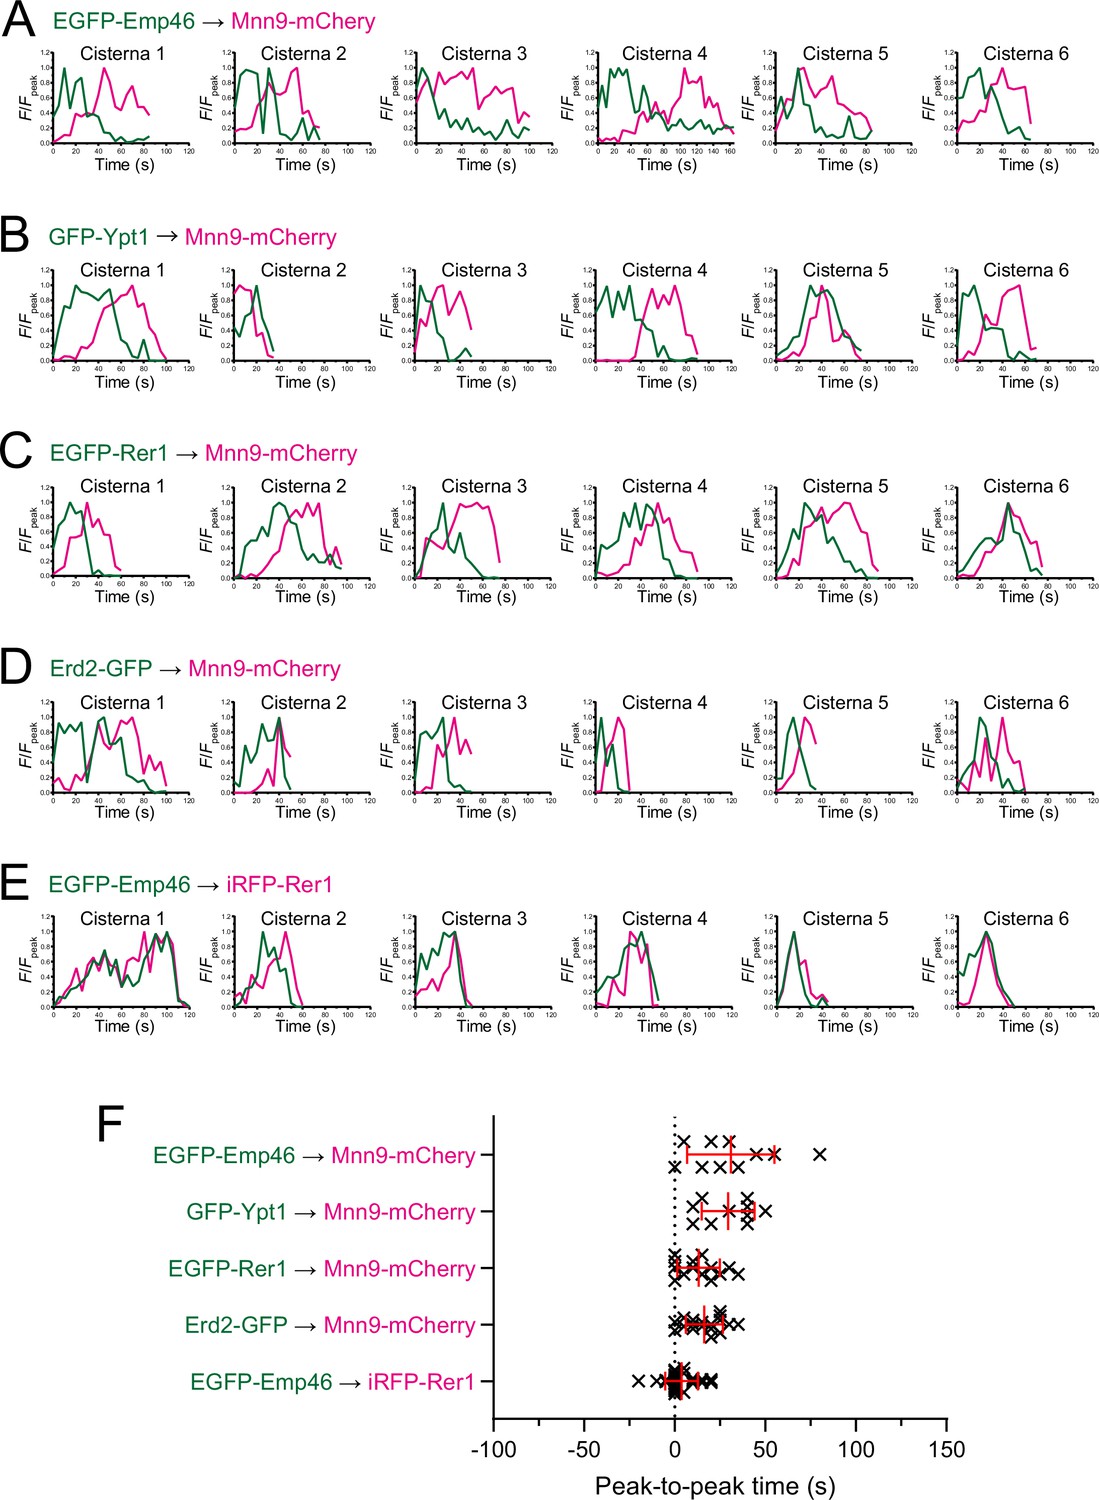
Individual data of fluorescence time courses and peak-to-peak times shown in Figure 1.
(A–E) Time course changes in relative fluorescence intensities (F/Fpeak) of green and red channels in six representative cisternae (cisterna 1–6) expressing EGFP-Emp46 and Mnn9-mCherry (A), GFP-Ypt1 and Mnn9-mCherry (B), EGFP-Rer1 and Mnn9-mCherry (C), Erd2-GFP and Mnn9-mCherry (D), and EGFP-Emp46 and Rer1-iRFP (E). (F) Scatter plots of the peak-to-peak times (s). Red lines with error bars indicate mean ± SEM.
Figure 1—figure supplement 2
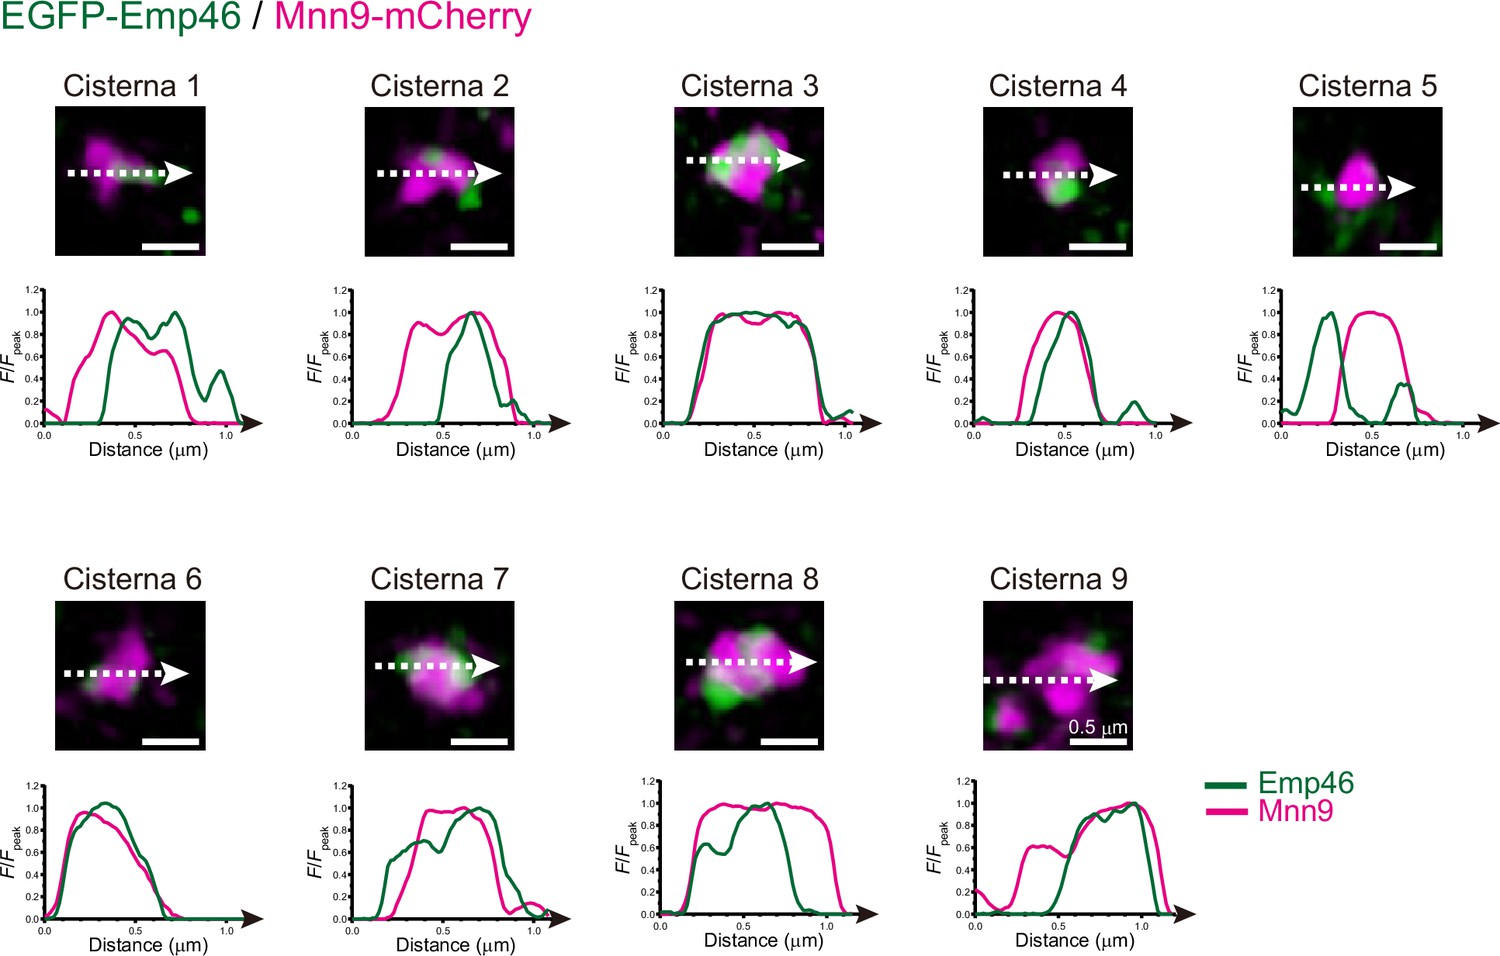
Spatial distribution of Emp46 and Mnn9 within maturing cisterna.
Magnified images and line scan analyses of EGFP-Emp46 and Mnn9-mCherry signals in nine single maturing cisternae (cisterna 1–9). The F/Fpeak values (green and red channels) along the white broken lines are profiled. Scale bars: 0.5 μm.
Figure 2 with 1 supplement
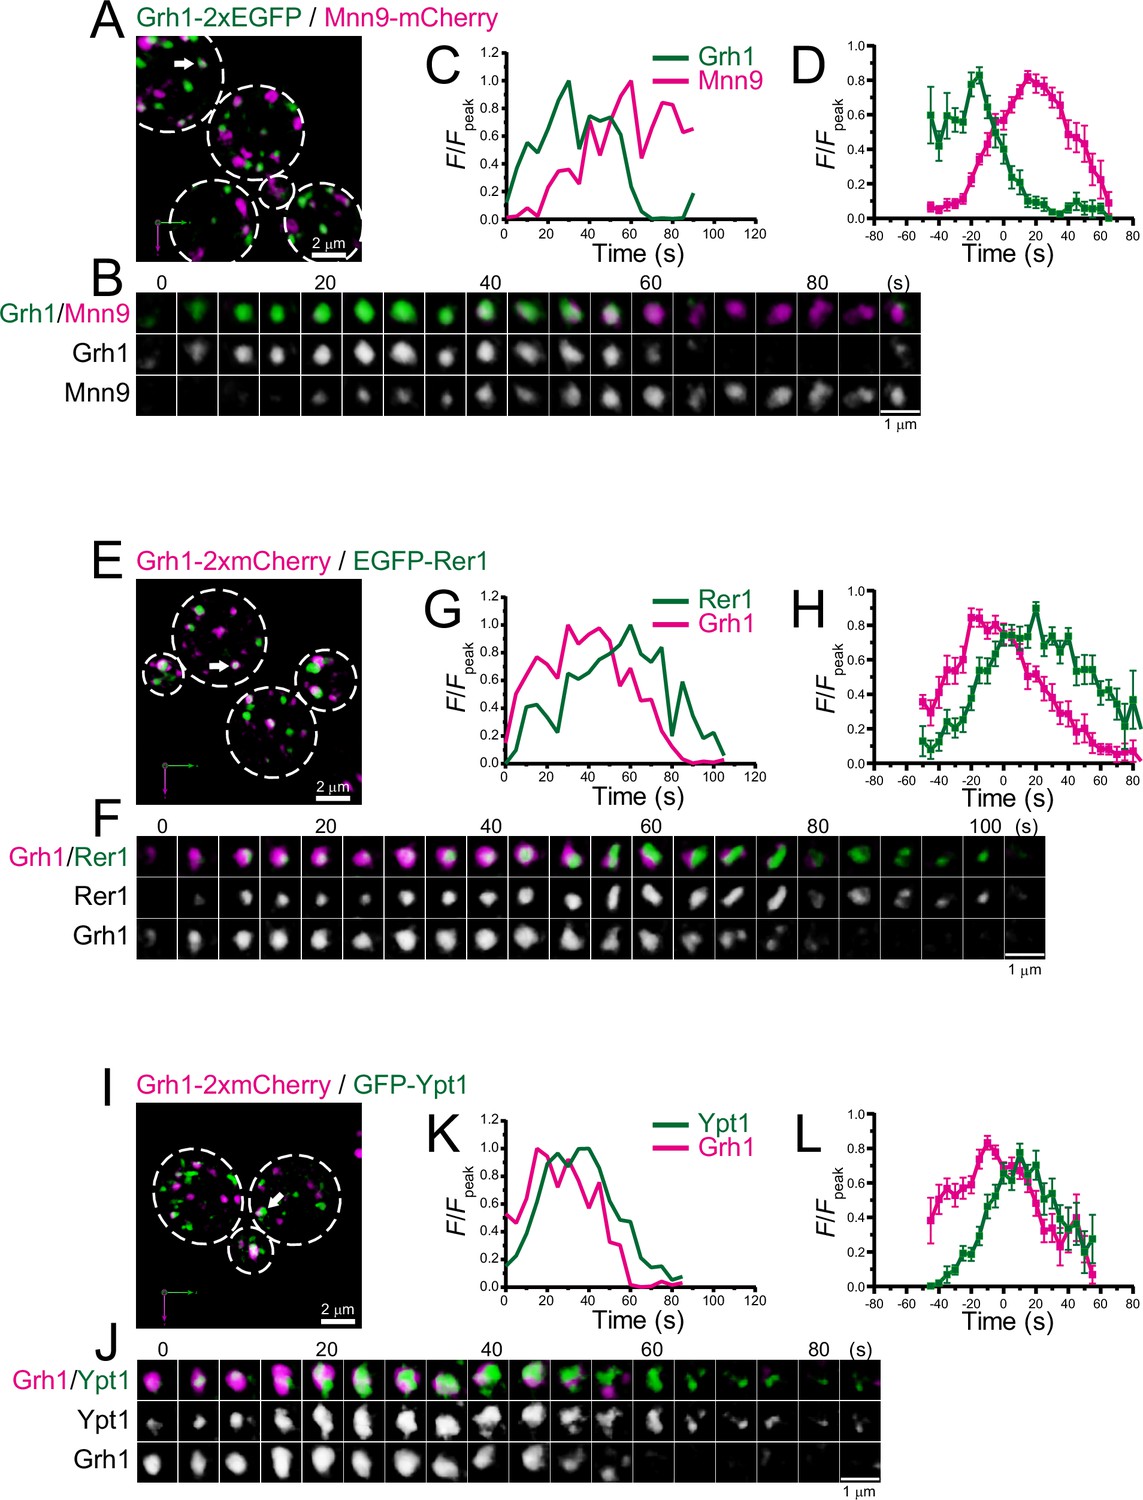
Four-dimensional (4D) dynamics of Grh1.
Dual-color 4D super-resolution confocal live imaging microscopy (SCLIM) imaging of yeast cells expressing Grh1-2xEGFP and Mnn9-mCherry (A–D), Grh1-2xmCherry and EGFP-Rer1 (E–H), and Grh1-2xmCherry and GFP-Ypt1 (I–L). (A, E, and I) Low-magnification images of the cells. The white broken lines indicate the edge of the cells. (B, F, and J) Time-lapse images of the single cisternae (white arrows in A, E, and I, respectively) in the cells. (C, G, and K) Time course changes in relative fluorescence intensities (F/Fpeak) of green and red channels in B, F, and J, respectively. (D, H, and L) Averaged time course changes in F/Fpeak of green and red channels (mean ± SEM). Time 0 was set as the midpoint between the green and red fluorescence peaks of each cisterna (n=14, 13, and 18 cisternae for D, H, and L, respectively). Scale bars: 2 μm (A, E, and I) and 1 μm (B, F, and J).
-
Figure 2—source data 1
Data used for graphs presented in Figure 2D, H, and L.
- https://cdn.elifesciences.org/articles/92900/elife-92900-fig2-data1-v1.xlsx
Figure 2—figure supplement 1
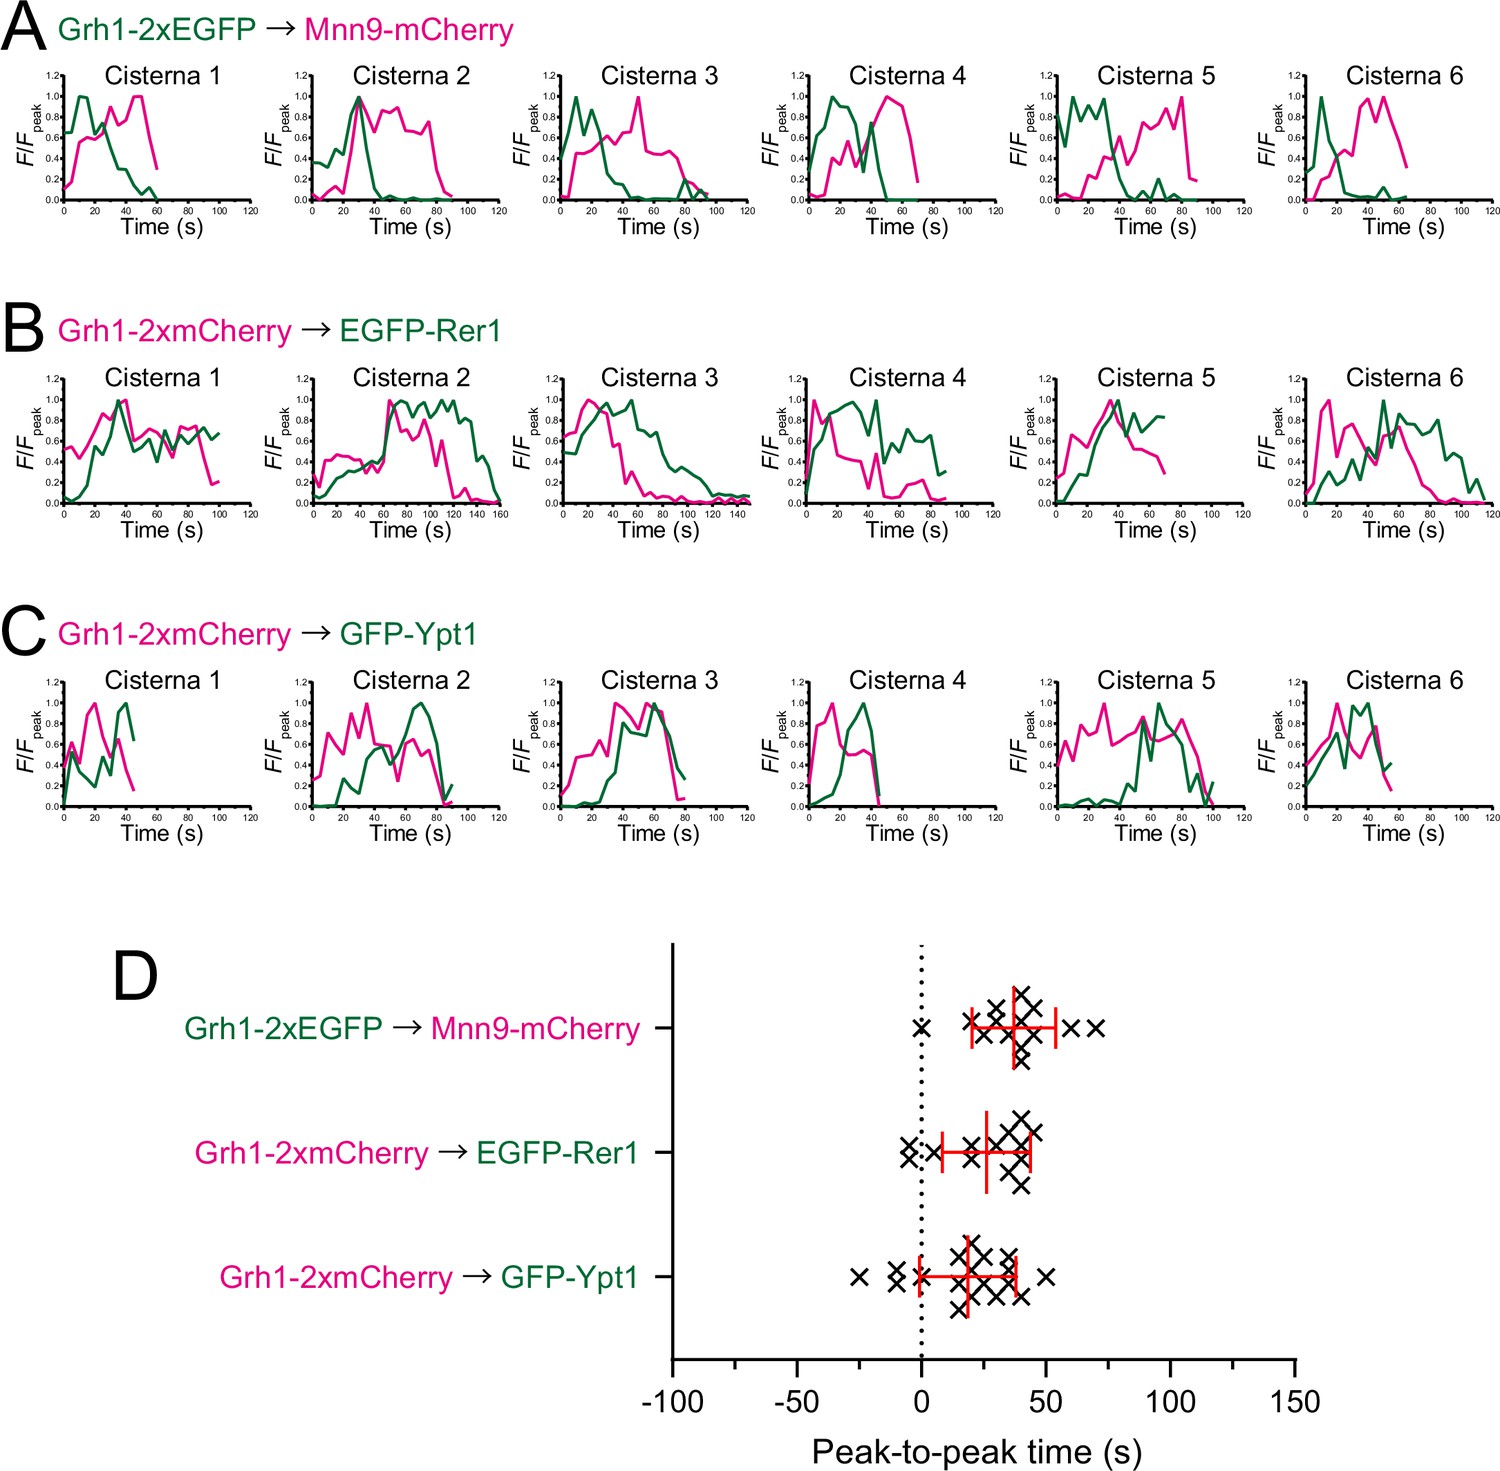
Individual data of fluorescence time courses and peak-to-peak times shown in Figure 2.
(A–C) Time course changes in relative fluorescence intensities (F/Fpeak) of green and red channels in six representative cisternae (cisterna 1–6) expressing Grh1-2xEGFP and Mnn9-mCherry (A), Grh1-2xmCherry and EGFP-Rer1 (B), and Grh1-2xmCherry and GFP-Ypt1 (C). (D) Scatter plots of the peak-to-peak times (s). Red lines with error bars indicate mean ± SEM.
Figure 3 with 1 supplement
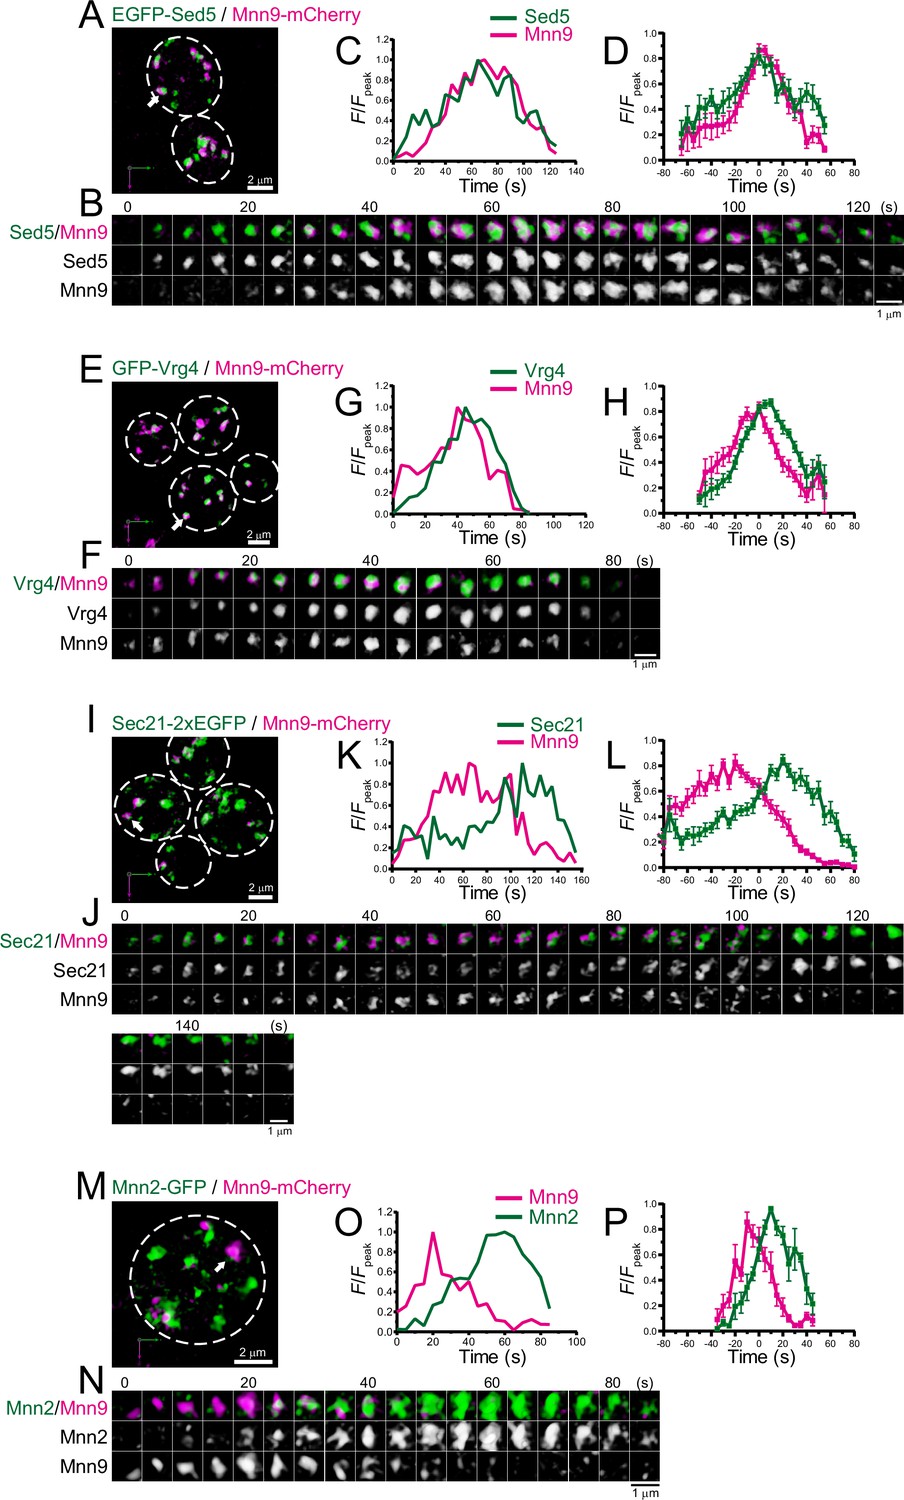
Four-dimensional (4D) dynamics of Sed5, Vrg4, Sec21, and Mnn2.
Dual-color 4D super-resolution confocal live imaging microscopy (SCLIM) imaging of yeast cells expressing EGFP-Sed5 and Mnn9-mCherry (A–D), GFP-Vrg4 and Mnn9-mCherry (E–H), Sec21-2xEGFP and Mnn9-mCherry (I–L), and Mnn2-GFP and Mnn9-mCherry (M–P). (A, E, I, and M) Low-magnification images of the cells. The white broken lines indicate the edge of the cells. (B, F, J, and N) Time-lapse images of the single cisternae (white arrows in A, E, I, and M, respectively) in the cells. (C, G, K, and O) Time course changes in relative fluorescence intensities (F/Fpeak) of green and red channels in B, F, J, and N, respectively. (D, H, L, and P) Averaged time course changes in F/Fpeak of green and red channels (mean ± SEM). Time 0 was set as the midpoint between the green and red fluorescence peaks of each cisterna (n=13, 18, 17, and 6 cisternae for D, H, L, and P, respectively). Scale bars: 2 μm (A, E, I, and M) and 1 μm (B, F, J, and N).
-
Figure 3—source data 1
Data used for graphs presented in Figure 3C, H, L, and P.
- https://cdn.elifesciences.org/articles/92900/elife-92900-fig3-data1-v1.xlsx
Figure 3—figure supplement 1
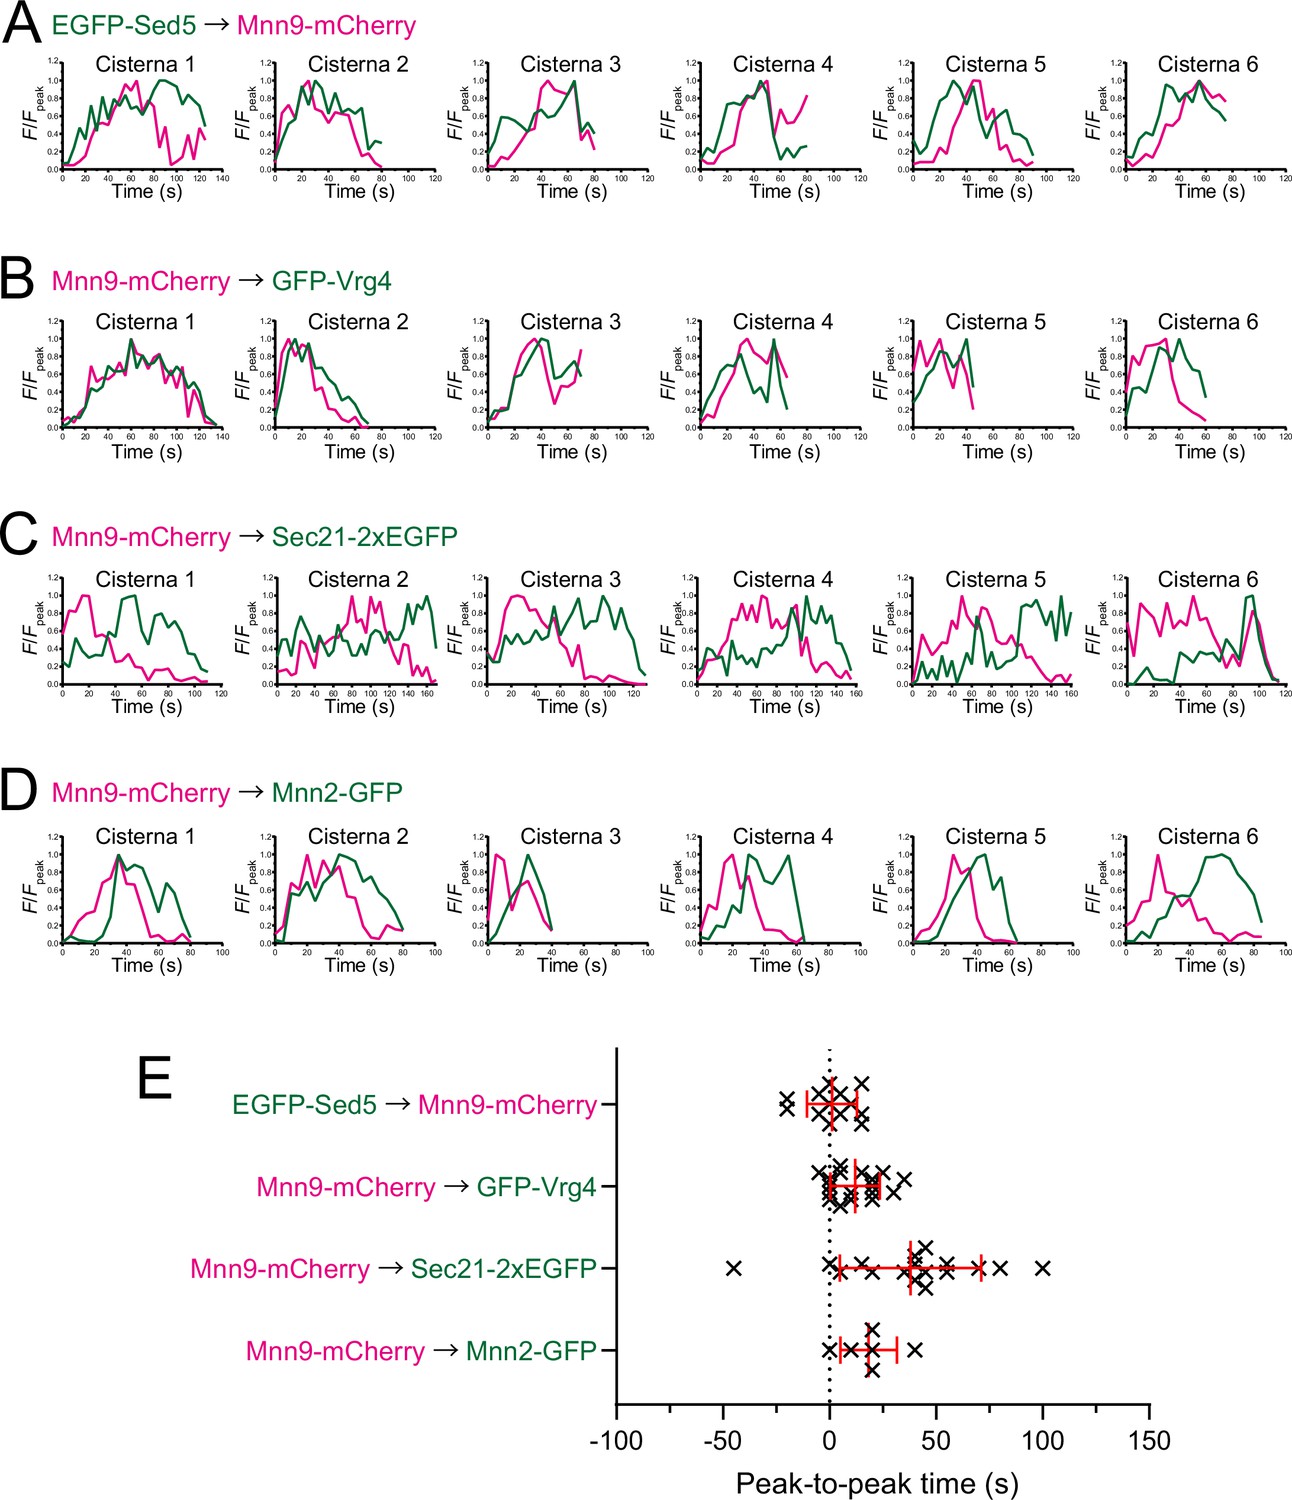
Individual data of fluorescence time courses and peak-to-peak times shown in Figure 3.
(A–D) Time course changes in relative fluorescence intensities (F/Fpeak) of green and red channels in six representative cisternae (cisterna 1–6) expressing EGFP-Sed5 and Mnn9-mCherry (A), Mnn9-mCherry and GFP-Vrg4 (B), Mnn9-mCherry and Sec21-2xEGFP (C), and Mnn9-mCherry and Mnn2-GFP (D). (E) Scatter plots of the peak-to-peak times (s). Red lines with error bars indicate mean ± SEM.
Figure 4
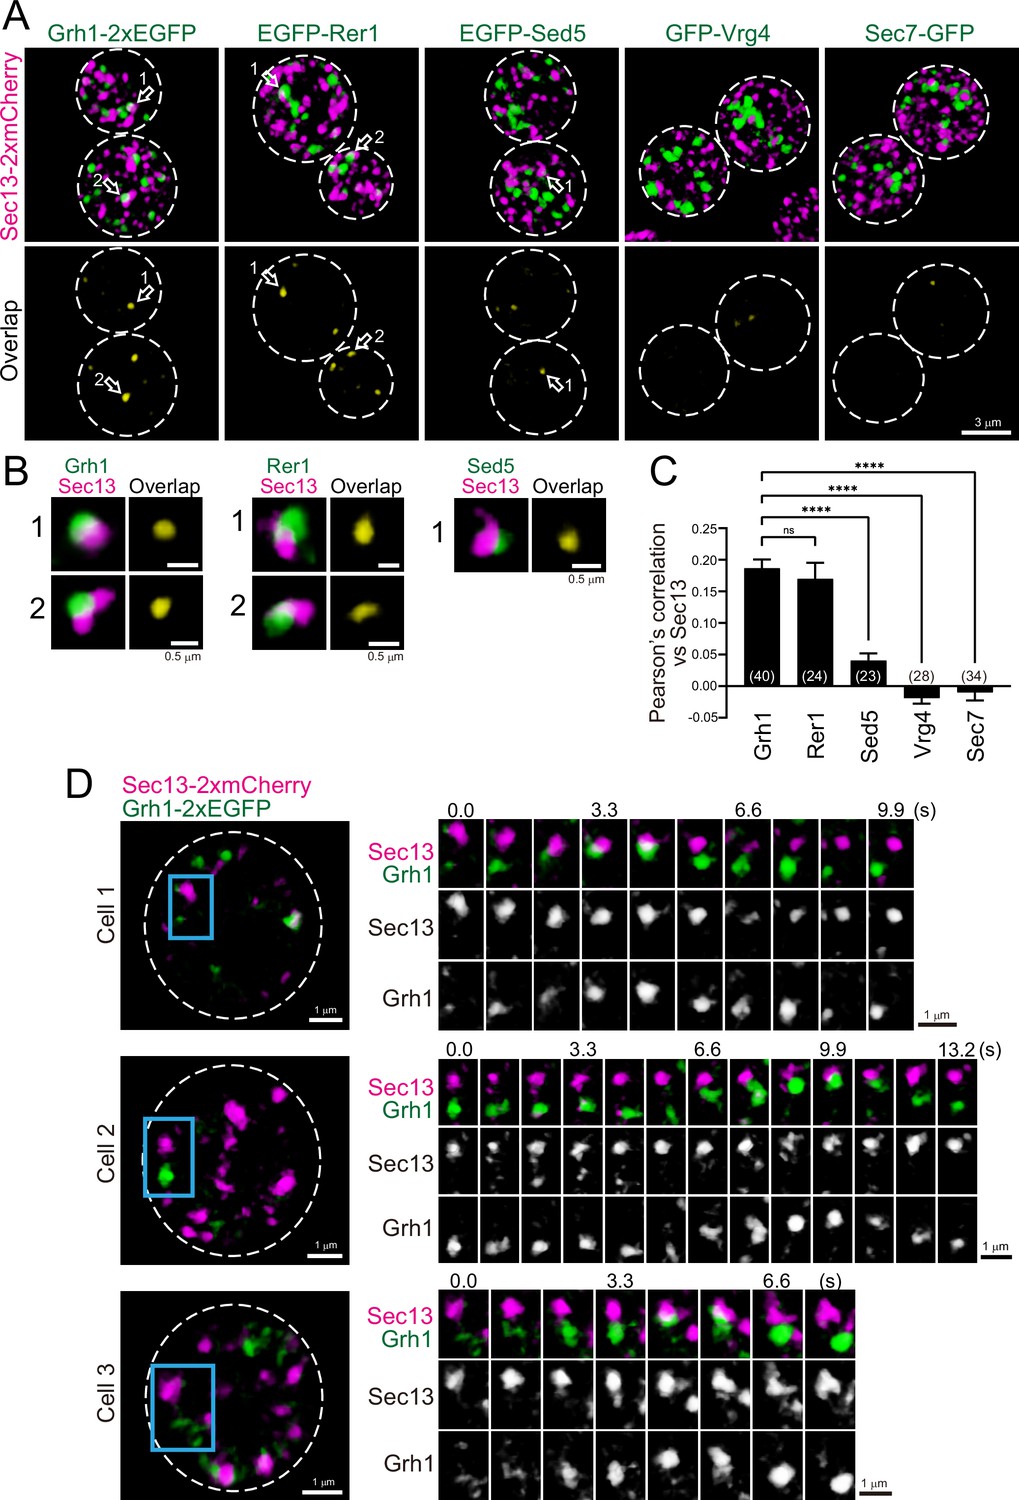
Three-dimensional (3D) distribution and 4D dynamics of endoplasmic reticulum exit sites (ERES) and ER-Golgi intermediate compartment (ERGIC) proteins.
(A) Sec13-2xmCherry (ERES marker) was co-expressed with Grh1-2xEGFP, EGFP-Rer1, EGFP-Sed5, GFP-Vrg4, or Sec7-GFP and imaged by dual-color 3D super-resolution confocal live imaging microscopy (SCLIM). Upper panels show both red and green channels and lower panels show overlapping area only (yellow). Scale bar: 3 μm. (B) Zoom-up images of the overlapping areas of puncta indicated by arrows in A. Scale bars: 0.5 μm. (C) Pearson’s correlation coefficient (r) for co-localization of the indicated proteins versus Sec13. Numbers in parentheses indicate the number of cells examined. Each value represents mean ± SEM. ns, not significant; ****p<0.0001, Dunnett’s multiple comparison test. (D) Dual-color 4D SCLIM imaging of yeast cells expressing Sec13-2xmCherry and Grh1-2xEGFP. Three representative examples are shown (cells 1–3). The white broken lines in the left panels indicate the edge of the cells. The right panels show time-lapse images of the area covered by the blue rectangles in the left panels. Scale bars: 1 μm.
-
Figure 4—source data 1
Data used for the graph presented in Figure 4C.
- https://cdn.elifesciences.org/articles/92900/elife-92900-fig4-data1-v1.xlsx
Figure 5 with 1 supplement
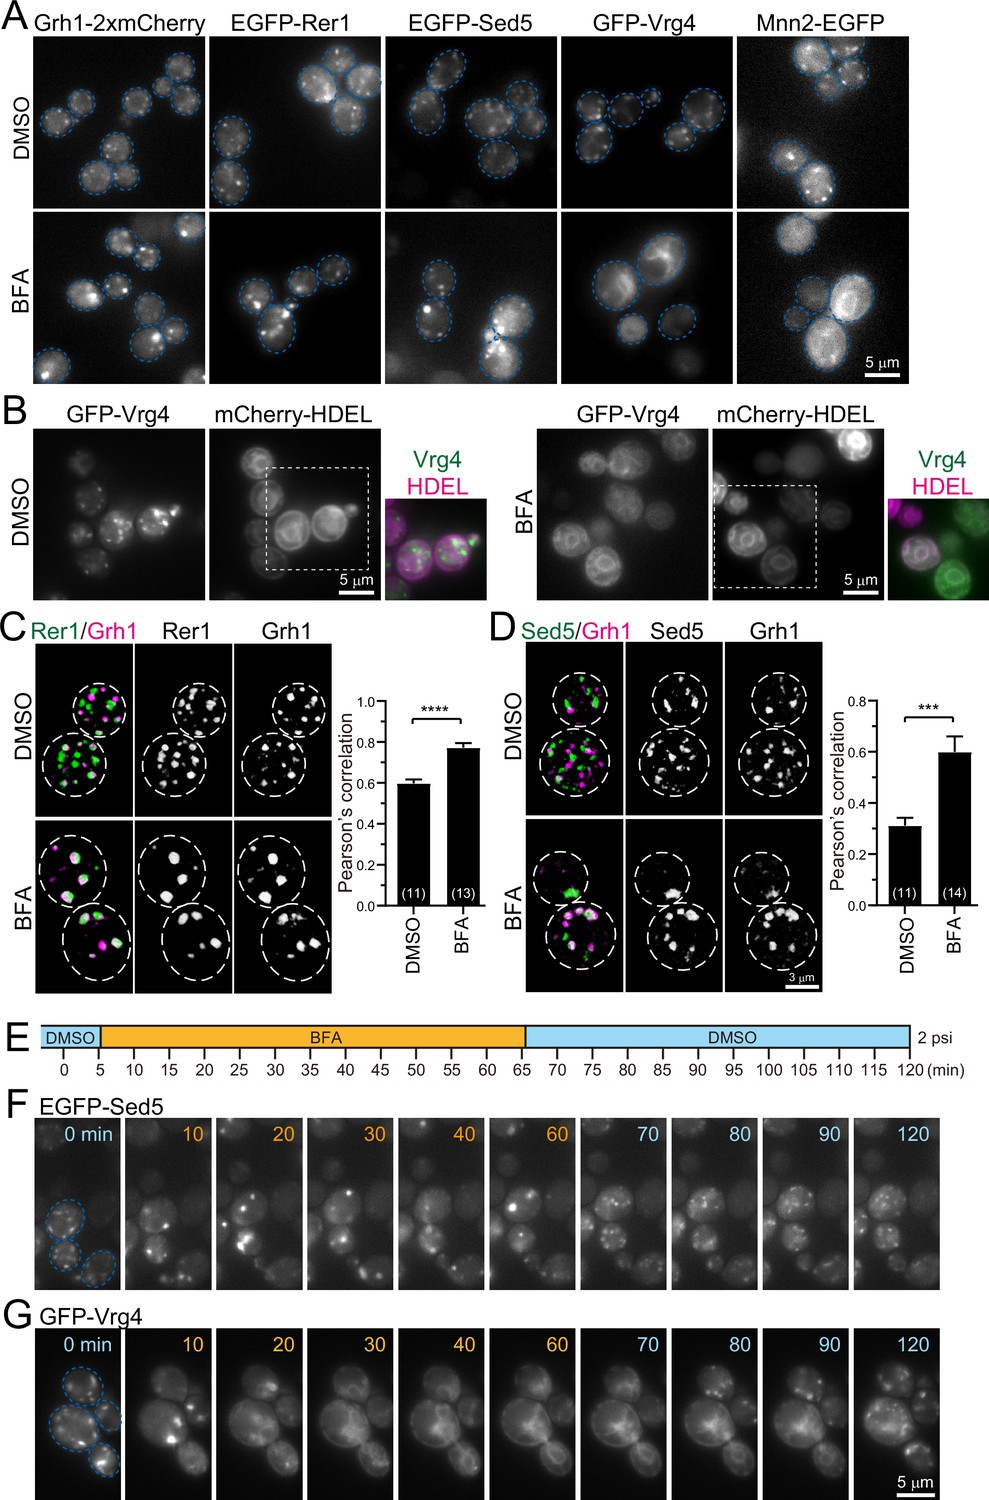
Effect of brefeldin A (BFA) on endoplasmic reticulum-Golgi intermediate compartment (ERGIC) and Golgi proteins.
(A) Epifluorescence images of yeast cells expressing Grh1-2xmCherry, EGFP-Rer1, EGFP-Sed5, GFP-Vrg4, or Mnn2-EGFP treated with 0.4% dimethyl sulfoxide (DMSO) (control) (upper panels) or 200 μM BFA (lower panels). The blue broken lines indicate the edge of the cells. (B) Epifluorescence images of yeast cells co-expressing GFP-Vrg4 and mCherry-HDEL treated with 0.4% DMSO (left panels) or 200 μM BFA (right panels). Insets: merged images in the white dashed boxes. (C and D) Dual-color 3D SCLIM images of yeast cells co-expressing EGFP-Rer1 and Grh1-2xmCherry (C) or EGFP-Sed5 and Grh1-2xmCherry (D) treated with DMSO or BFA. Left, center, and right panels show merged, green, and red channels, respectively. The white broken lines indicate the edge of the cells. The graphs show Pearson’s correlation coefficient (r) for co-localization. Numbers in parentheses indicate the number of cells examined. Each value represents mean ± SEM. ****p<0.0001; ***p<0.0005, unpaired t-test with Welch’s correction. (E–G) BFA perfusion experiments. (E) Time schedule of drug perfusion. Time 0 indicates the onset of time-lapse imaging. The cells were originally exposed to 0.4% DMSO (light blue) solution in a perfusion chamber with a flow pressure of 2 psi. The perfusion solution was changed to 200 μM BFA (orange) at 5 min, and then returned to 0.4% DMSO (light blue) at 65 min to wash out BFA. (F and G) Time-lapse epifluorescence images of yeast cells expressing EGFP-Sed5 (F) or GFP-Vrg4 (G) treated sequentially with DMSO (0 min), BFA (10–60 min), and then DMSO again (70–120 min). The blue broken lines indicate the edge of the cells. Scale bars: 5 μm (A, B, and G) and 3 μm (D).
-
Figure 5—source data 1
Data used for graphs presented in Figure 5C, D, and Figure 5-supplement 1B.
- https://cdn.elifesciences.org/articles/92900/elife-92900-fig5-data1-v1.xlsx
Figure 5—figure supplement 1
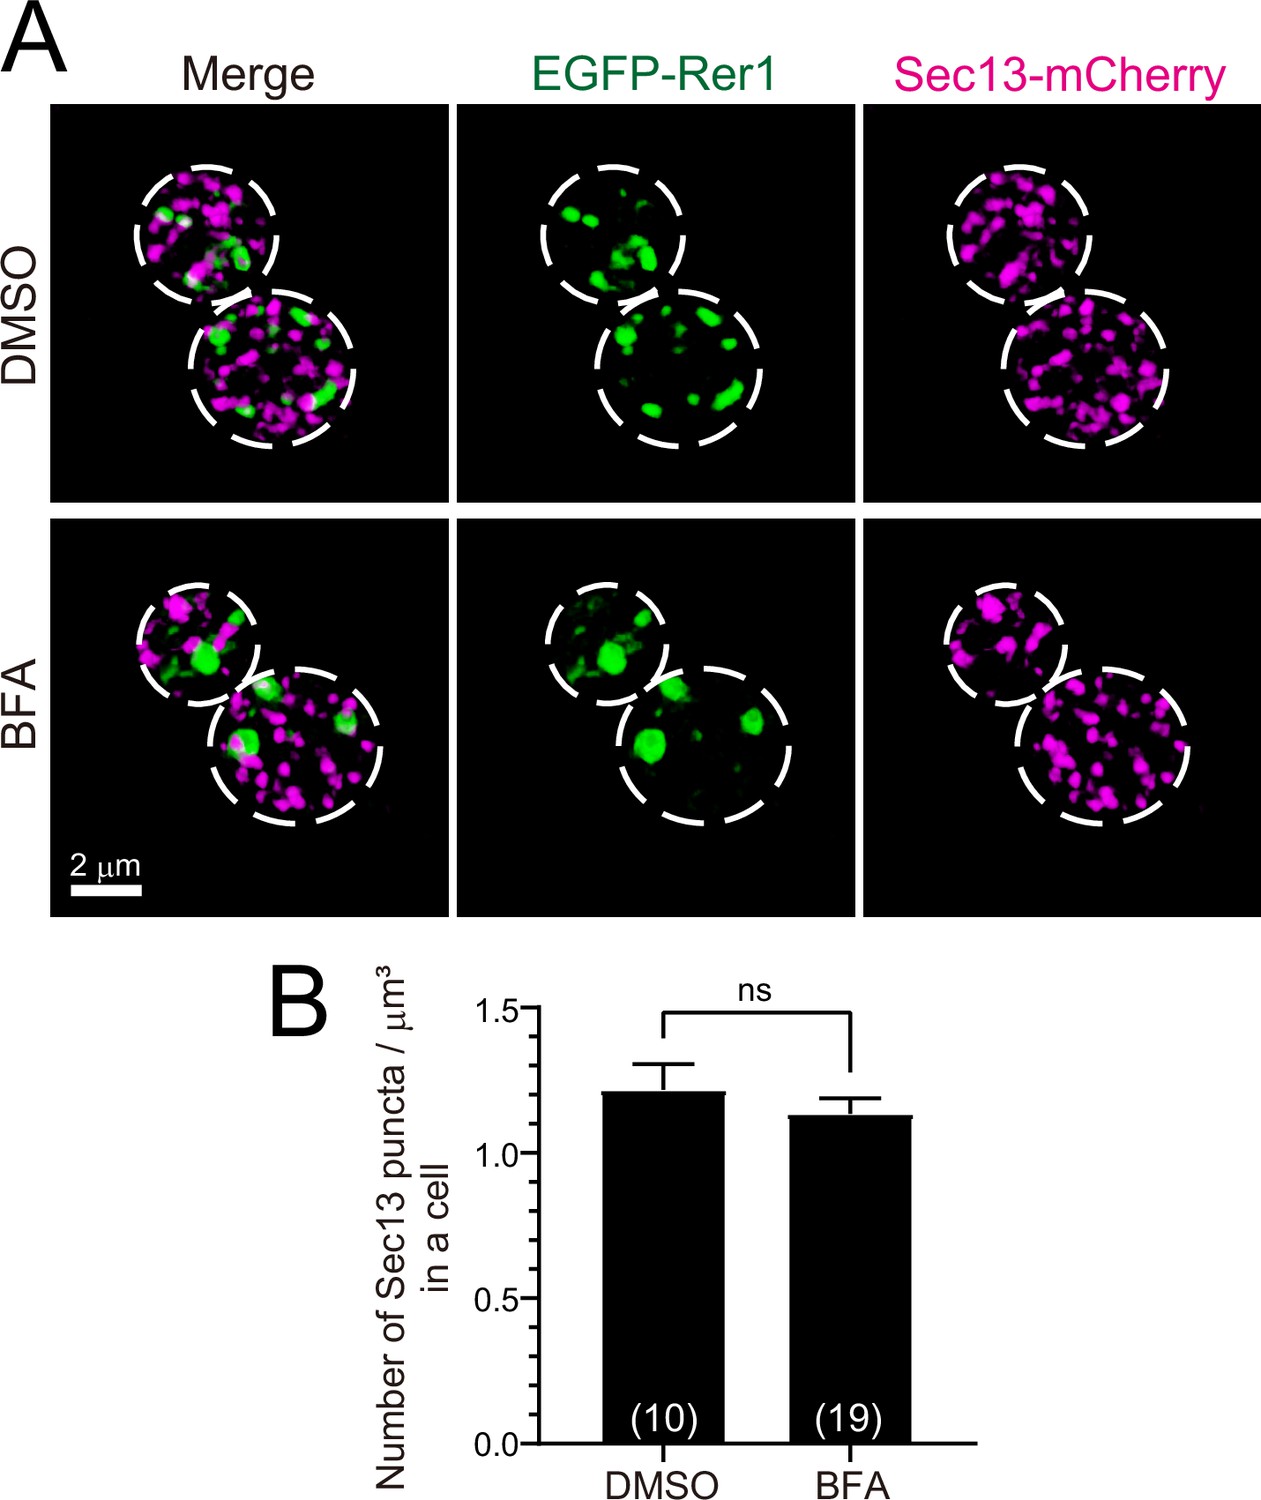
Effect of brefeldin A (BFA) on endoplasmic reticulum exit sites (ERES).
(A) Dual-color three-dimensional (3D) super-resolution confocal live imaging microscopy (SCLIM) images of yeast cells co-expressing EGFP-Rer1 and Sec13-mCherry treated with dimethyl sulfoxide (DMSO) (upper panels) or BFA (lower panels). Left, center, and right panels show merged, green, and red channels, respectively. The white broken lines indicate the edge of the cells. (B) Averaged number of Sec13-positive puncta in a cell. Each value was normalized by cell volume (μm3). Numbers in parentheses indicate the number of cells examined. Each value represents mean ± SEM. ns, not significant, unpaired t-test with Welch’s correction.
Figure 6 with 1 supplement
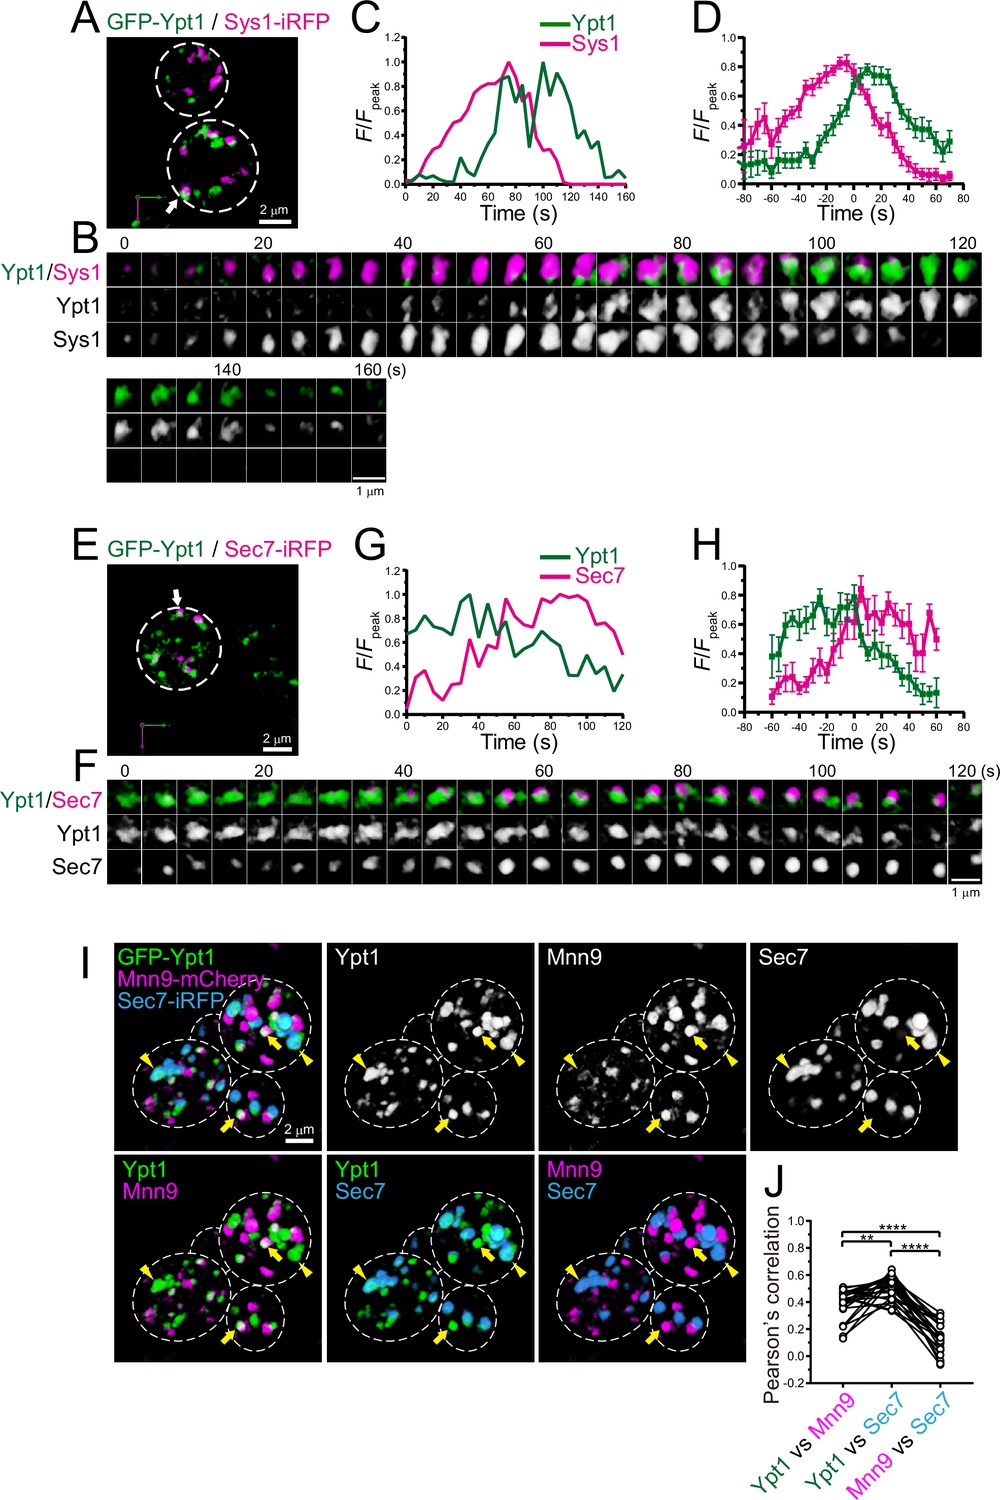
Four-dimensional (4D) dynamics and 3D distribution of Ypt1.
(A–H) Dual-color 4D super-resolution confocal live imaging microscopy (SCLIM) imaging of yeast cells expressing GFP-Ypt1 and Sys1-iRFP (A–D), and GFP-Ypt1 and Sec7-iRFP (E–H). (A and E) Low-magnification images of the cells. The white broken lines indicate the edge of the cells. (B and F) Time-lapse images of the single cisternae (white arrows in A and E, respectively) in the cells. (C and G) Time course changes in relative fluorescence intensities (F/Fpeak) of green and red channels in B and F, respectively. (D and H) Averaged time course changes in F/Fpeak of green and red channels (mean ± SEM). Time 0 was set as the midpoint between the green and red fluorescence peaks of each cisterna (n=18 and 7 cisternae for D and H, respectively). Scale bars: 2 μm (A, E) and 1 μm (B, F). (I and J) Triple-color 3D co-localization analyses of yeast cells expressing GFP-Ypt1, Mnn9-mCherry, and Sec7-iRFP. Upper left-most panel shows triple-merged image. Upper right three panels show individual single-channel images (Ypt1, Mnn9, and Sec7). Lower panels show dual-merged images. Yellow arrows indicate cisternae that contain Ypt1 and Mnn9, but not Sec7. Yellow arrowheads indicate cisternae that contain Ypt1 and Sec7, but not Mnn9. (J) Pearson’s correlation coefficient (r) for co-localization of the indicated pair of proteins. **p<0.01; ****p<0.0001, Tukey’s multiple comparison test (n=25 cells).
-
Figure 6—source data 1
Data used for graphs presented in Figure 6D, H, and J.
- https://cdn.elifesciences.org/articles/92900/elife-92900-fig6-data1-v1.xlsx
Figure 6—figure supplement 1
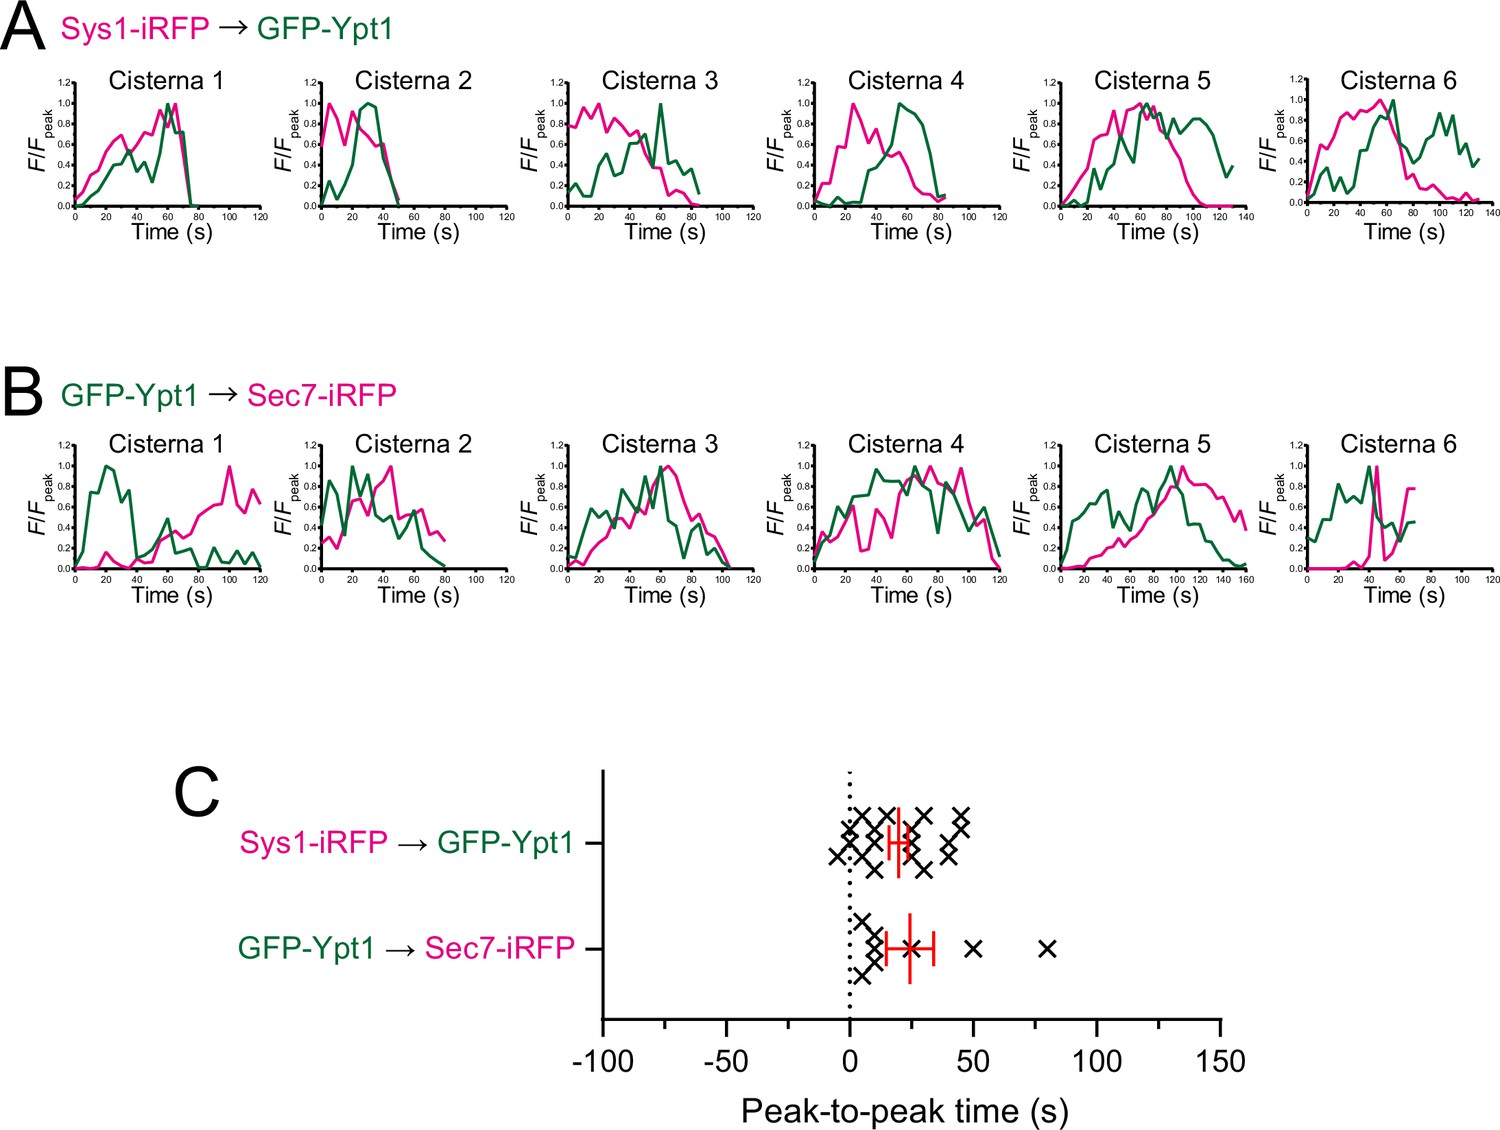
Individual data of fluorescence time courses and peak-to-peak times shown in Figure 6.
(A, B) Time course changes in relative fluorescence intensities (F/Fpeak) of green and red channels in six representative cisternae (cisterna 1–6) expressing Sys1-iRFP and GFP-Ypt1 (A), and GFP-Ypt1 and Sec7-iRFP (B). (C) Scatter plots of the peak-to-peak times (s). Red lines with error bars indicate mean ± SEM.
Figure 7 with 1 supplement
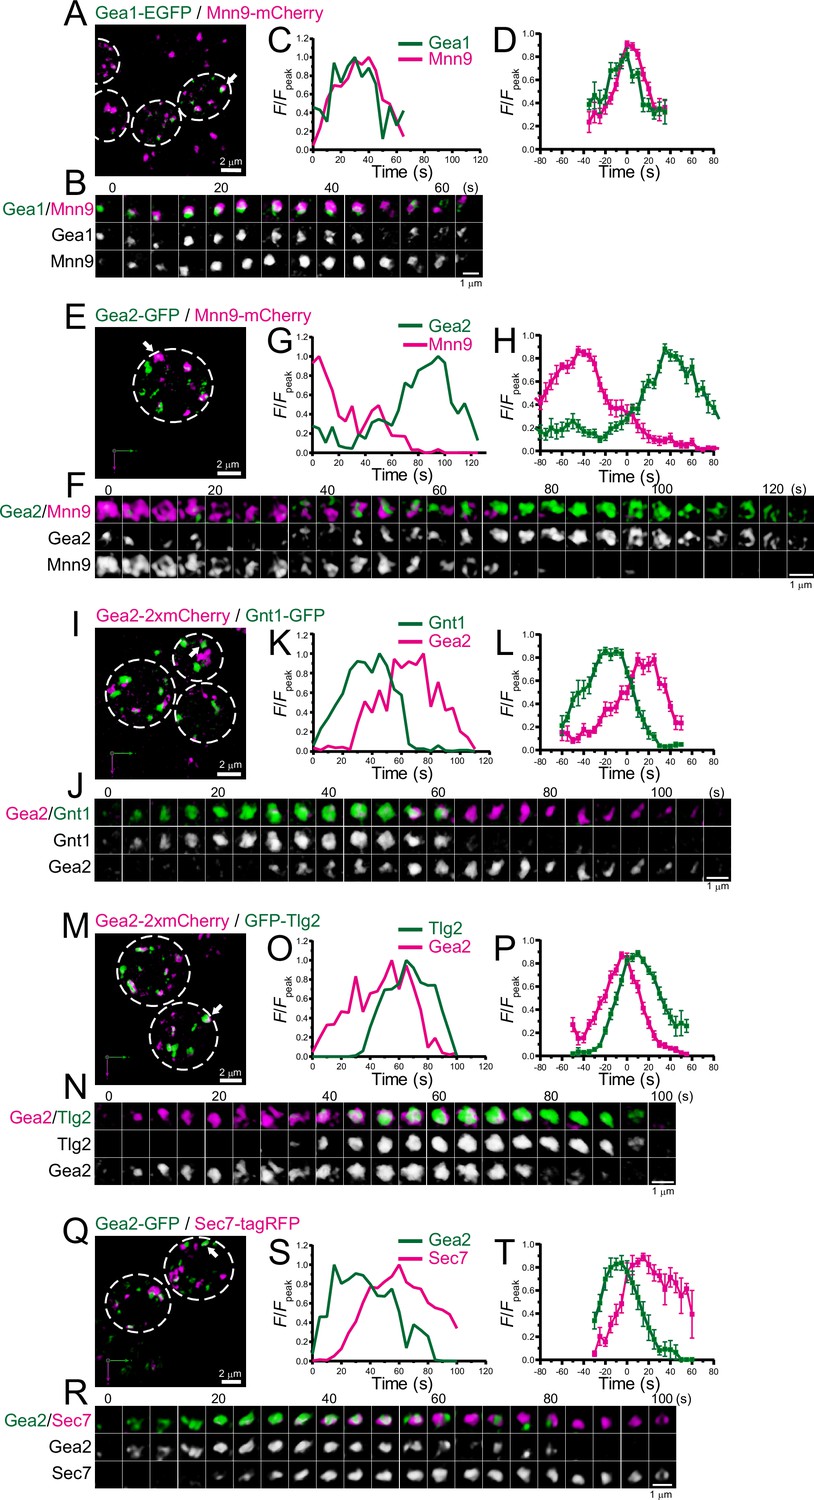
Four-dimensional (4D) dynamics of Gea1 and Gea2.
Dual-color 4D super-resolution confocal live imaging microscopy (SCLIM) imaging of yeast cells expressing Gea1-EGFP and Mnn9-mCherry (A–D), Gea2-GFP and Mnn9-mCherry (E–H), Gea2-2xmCherry and Gnt1-GFP (I–L), Gea2-2xmCherry and GFP-Tlg2 (M–P), and Gea2-GFP and Sec7-tagRFP (Q–T). (A, E, I, M, and Q) Low-magnification images of the cells. The white broken lines indicate the edge of the cells. (B, F, J, N, and R) Time-lapse images of the single cisternae (white arrows in A, E, I, M, and Q, respectively) in the cells. (C, G, K, O, and S) Time course changes in relative fluorescence intensities (F/Fpeak) of green and red channels in B, F, J, N, and R, respectively. (D, H, L, P, and T) Averaged time course changes in F/Fpeak of green and red channels (mean ± SEM). Time 0 was set as the midpoint between the green and red fluorescence peaks of each cisterna (n=15, 13, 15, 21, and 7 cisternae for D, H, L, P, and T, respectively). Scale bars: 2 μm (A, E, I, M, and Q) and 1 μm (B, F, J, N, and R).
-
Figure 7—source data 1
Data used for graphs presented in Figure 7D, H, L, P, and T.
- https://cdn.elifesciences.org/articles/92900/elife-92900-fig7-data1-v1.xlsx
Figure 7—figure supplement 1
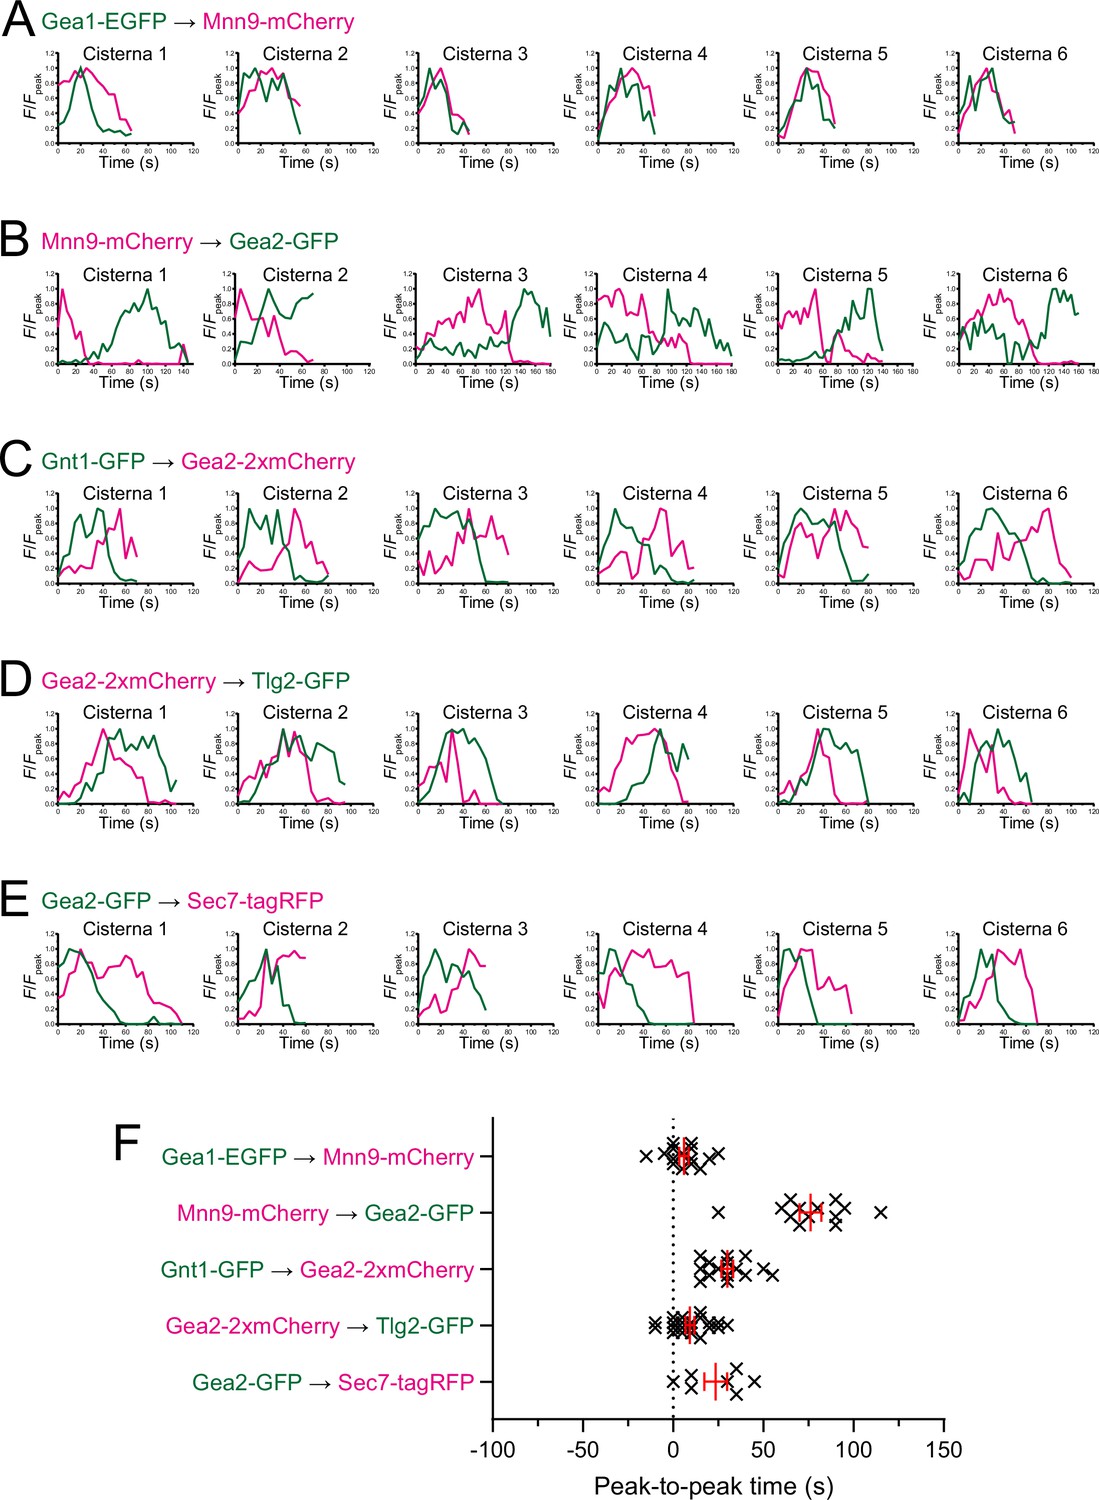
Individual data of fluorescence time courses and peak-to-peak times shown in Figure 7.
(A–E) Time course changes in relative fluorescence intensities (F/Fpeak) of green and red channels in six representative cisternae (cisterna 1–6) expressing Gea1-EGFP and Mnn9-mCherry (A), Mnn9-mCherry and Gea2-GFP (B), Gnt1-GFP and Gea2-2xmCherry (C), Gea2-2xmCherry and Tlg2-GFP (D), and Gea2-GFP and Sec7-tagRFP (E). (F) Scatter plots of the peak-to-peak times (s). Red lines with error bars indicate mean ± SEM.
Figure 8 with 2 supplements
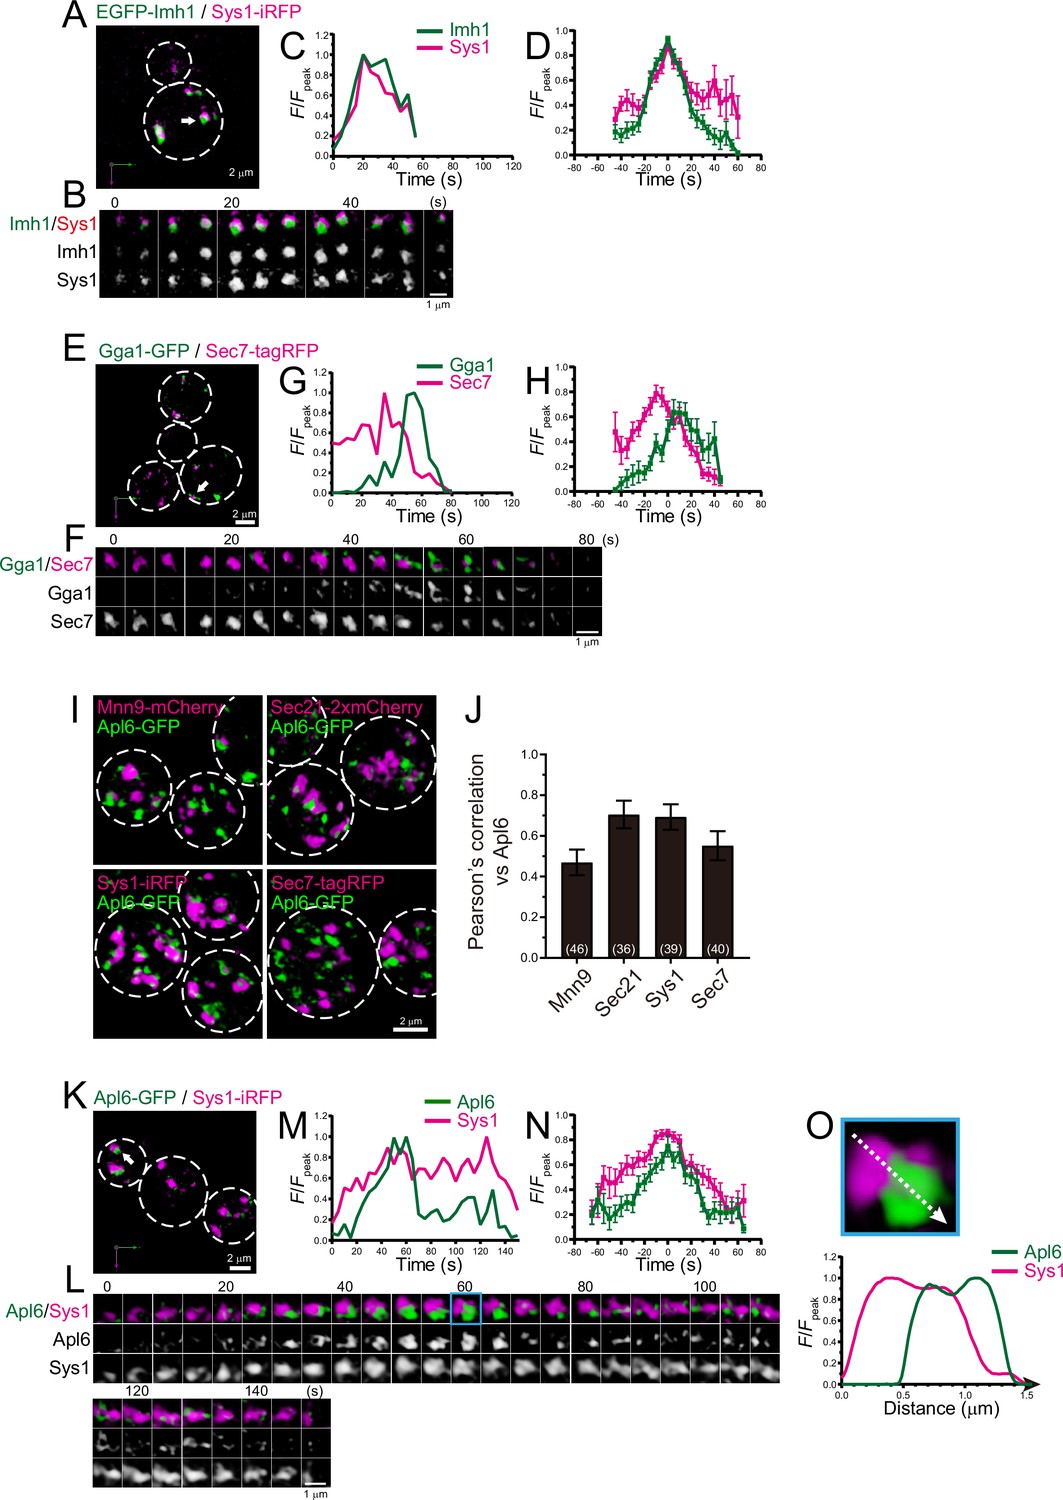
Four-dimensional (4D) dynamics and 3D distribution of Imh1, Gga1, and Apl6.
(A–H) Dual-color 4D super-resolution confocal live imaging microscopy (SCLIM) imaging of yeast cells expressing EGFP-Imh1 and Sys1-iRFP (A–D), and Gga1-GFP and Sec7-tagRFP (E–H). (A and E) Low-magnification images of the cells. The white broken lines indicate the edge of the cells. (B and F) Time-lapse images of the single cisternae (white arrows in A and D, respectively) in the cells. (C and G) Time course changes in relative fluorescence intensities (F/Fpeak) of green and red channels in B and E, respectively. (D and H) Averaged time course changes in F/Fpeak of green and red channels (mean ± SEM). Time 0 was set as the midpoint between the green and red fluorescence peaks of each cisterna (n=16 and 13 cisternae for D and H, respectively). (I and J) 3D co-localization analyses of Apl6 versus Golgi/trans-Golgi network (TGN) marker proteins. (I) GFP-Apl6 was co-expressed with Mnn9-mCherry (cis-Golgi), Sec21-2xmCherry (cis/medial-Golgi), Sys1-iRFP (trans-Golgi), and Sec7-tagRFP (TGN) and imaged by dual-color 3D SCLIM. (J) Pearson’s correlation coefficient (r) for co-localization of the indicated proteins versus Apl6. Numbers in parentheses indicate the number of cells examined. Each value represents mean ± SD. (K–O) Dual-color time-lapse SCLIM imaging of yeast cells expressing Apl6-GFP and Sys1-iRFP. (K) Low-magnification image of the cells. The white broken lines indicate the edge of the cells. (L) Time-lapse images of the single cisterna (white arrows in K) in the cell. (M) Time course changes in relative fluorescence intensities (F/Fpeak) of green and red channels in L. (N) Averaged time course changes in F/Fpeak of green and red channels (mean ± SEM). Time 0 was set as the midpoint between the green and red fluorescence peaks of each cisterna (n=13 cisternae). (O) Magnified image and line scan analyses of Apl6-GFP and Sys1-iRFP signals in the single maturing cisterna (blue rectangle in L). The F/Fpeak values (green and red channels) along the white broken lines in the upper panels are profiled in the graphs below. Scale bars: 2 μm (A, E, I, and L) and 1 μm (B, F, and L).
-
Figure 8—source data 1
Data used for graphs presented in Figure 8D, H, J, and N.
- https://cdn.elifesciences.org/articles/92900/elife-92900-fig8-data1-v1.xlsx
Figure 8—figure supplement 1
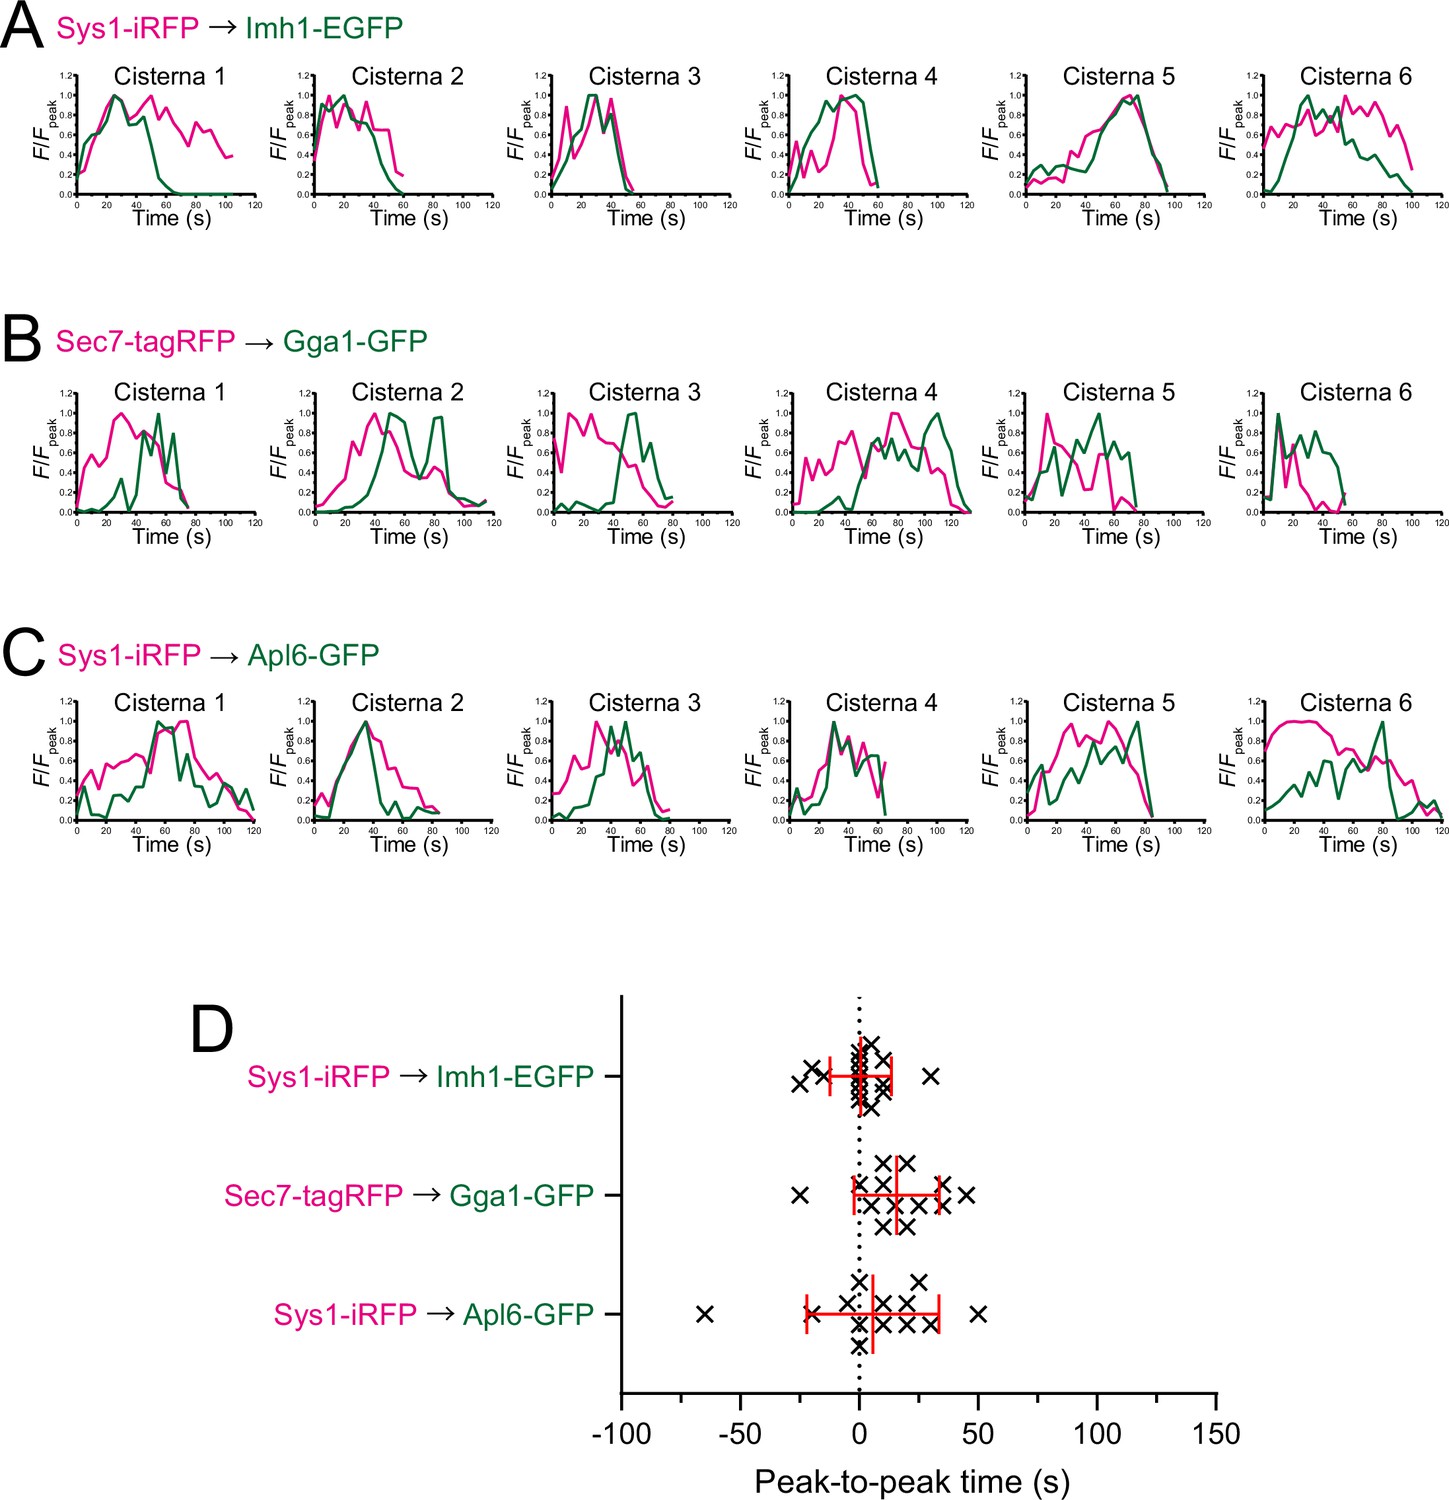
Individual data of fluorescence time courses and peak-to-peak times shown in Figure 8.
(A–C) Time course changes in relative fluorescence intensities (F/Fpeak) of green and red channels in six representative cisternae (cisterna 1–6) expressing Sys1-iRFP and Imh1-EGFP (A), Sec7-tagRFP and Gga1-GFP (B), and Sys1-iRFP and Apl6-GFP (C). (D) Scatter plots of the peak-to-peak times (s). Red lines with error bars indicate mean ± SEM.
Figure 8—figure supplement 2
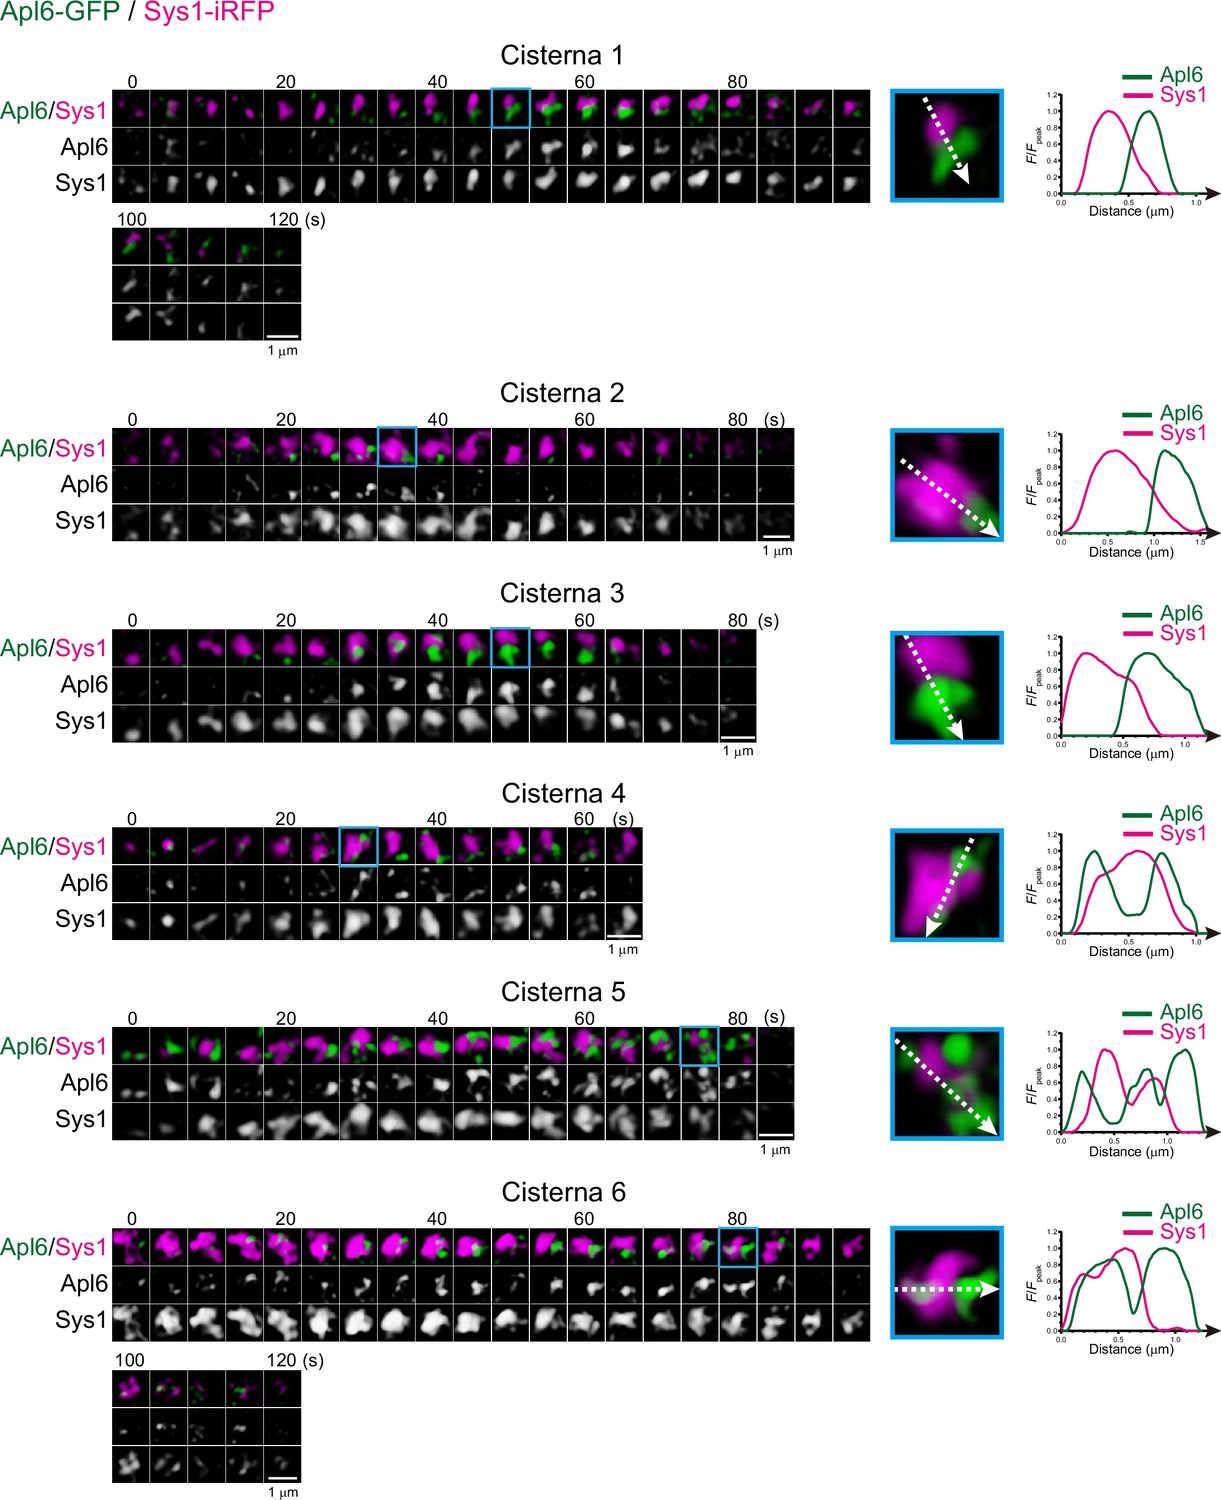
Spatial distribution of Apl6 and Sys1 within maturing cisterna.
Left panels show time-lapse super-resolution confocal live imaging microscopy (SCLIM) images of six representative cisternae (cisterna 1–6) expressing Apl6-GFP and Sys1-iRFP. Scale bars: 1 μm. Magnified images (blue rectangles) and their line scan analyses are shown in the right panels. The F/Fpeak values (green and red channels) along the white broken lines are profiled.
Figure 9
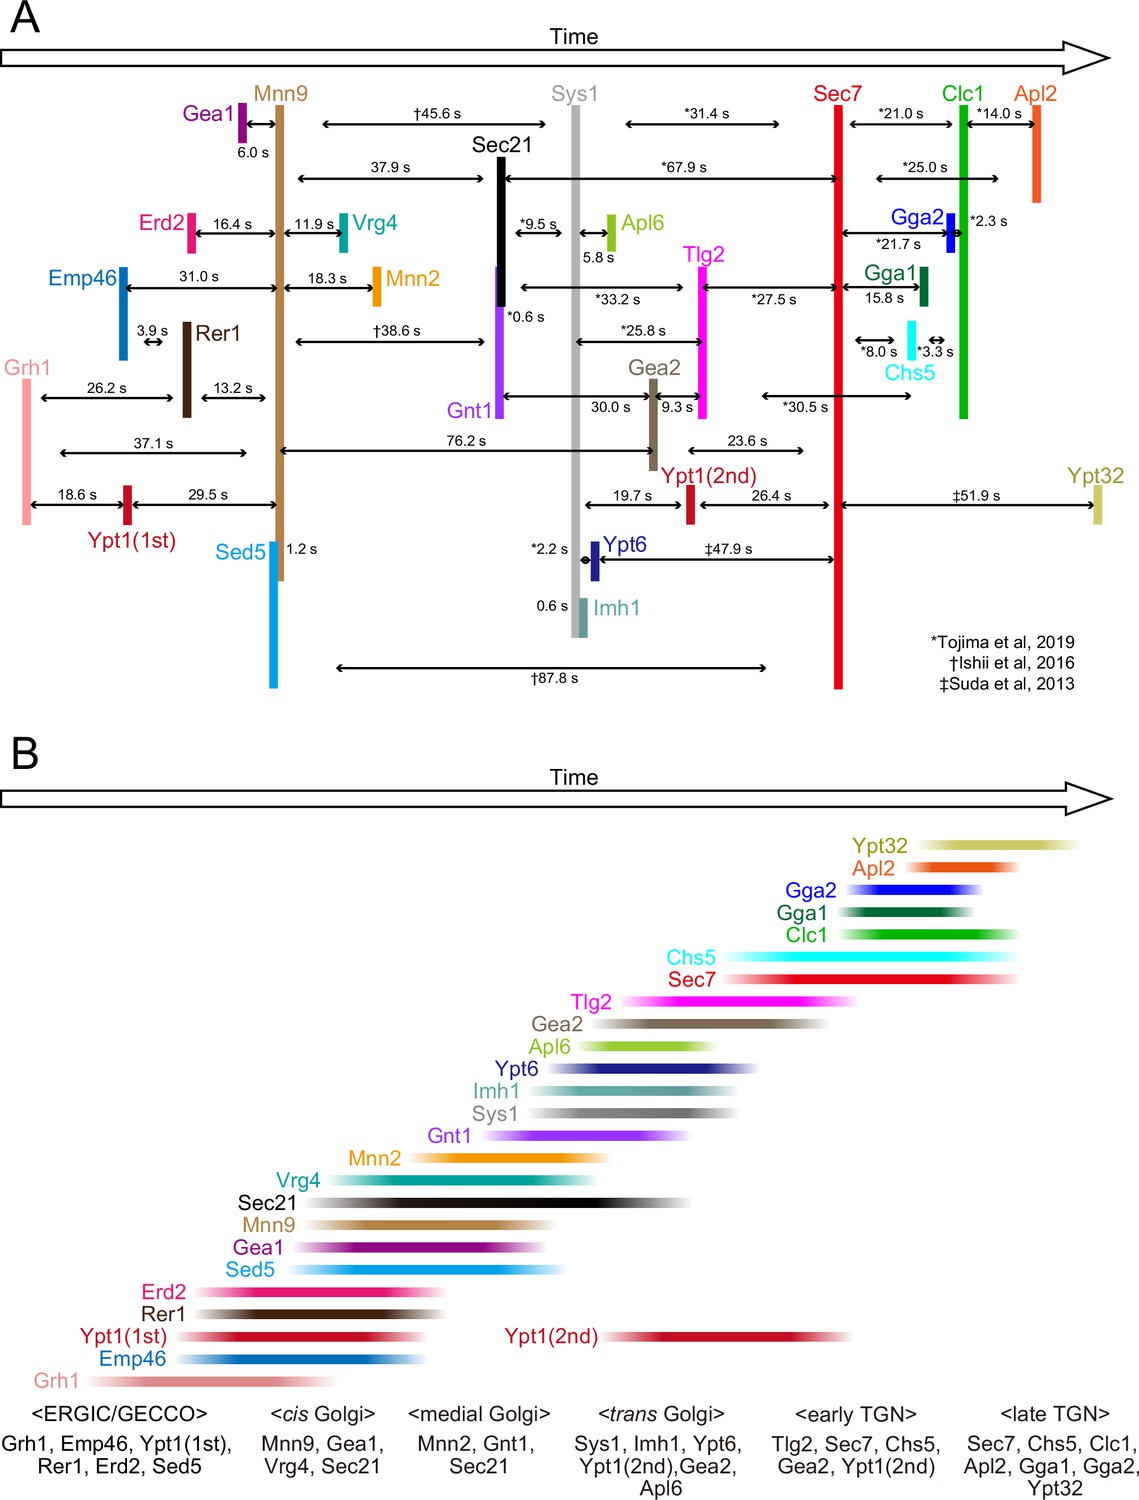
Temporal order of all the proteins examined in the present and previous studies.
(A) Peak-to-peak duration times obtained in our previous (Ishii et al., 2016; Suda et al., 2013; Tojima et al., 2019) and present studies. Time flows from left to right. The lengths of the black horizontal lines with arrows reflect the peak-to-peak times (s). (B) The colored lines show the residence periods of the indicated proteins at a single ERGIC/Golgi/trans-Golgi network (TGN) cisterna. We propose that the endoplasmic reticulum Golgi intermediate compartment (ERGIC)-Golgi maturation process can be divided into following successive stages: the ‘ERGIC/Golgi entry core compartment (GECCO)’ stage, which is defined by the presence of Grh1, Emp46, Ypt1 (first appearance), Rer1, Erd2, and Sed5, the ‘cis-Golgi’ stage, defined by the presence of Mnn9, Gea1, Vrg4, and Sec21, the ‘medial-Golgi‘ stage, defined by the presence of Mnn2, Gnt1, and Sec21, and the ‘trans-Golgi‘ stage, defined by the presence of Sys1, Imh1, Ypt6, Ypt1 (second appearance), Gea2, and Apl6. In addition, we previously defined the ‘early TGN stage’ and the ‘late TGN stage’ (Tojima et al., 2019).
Figure 10
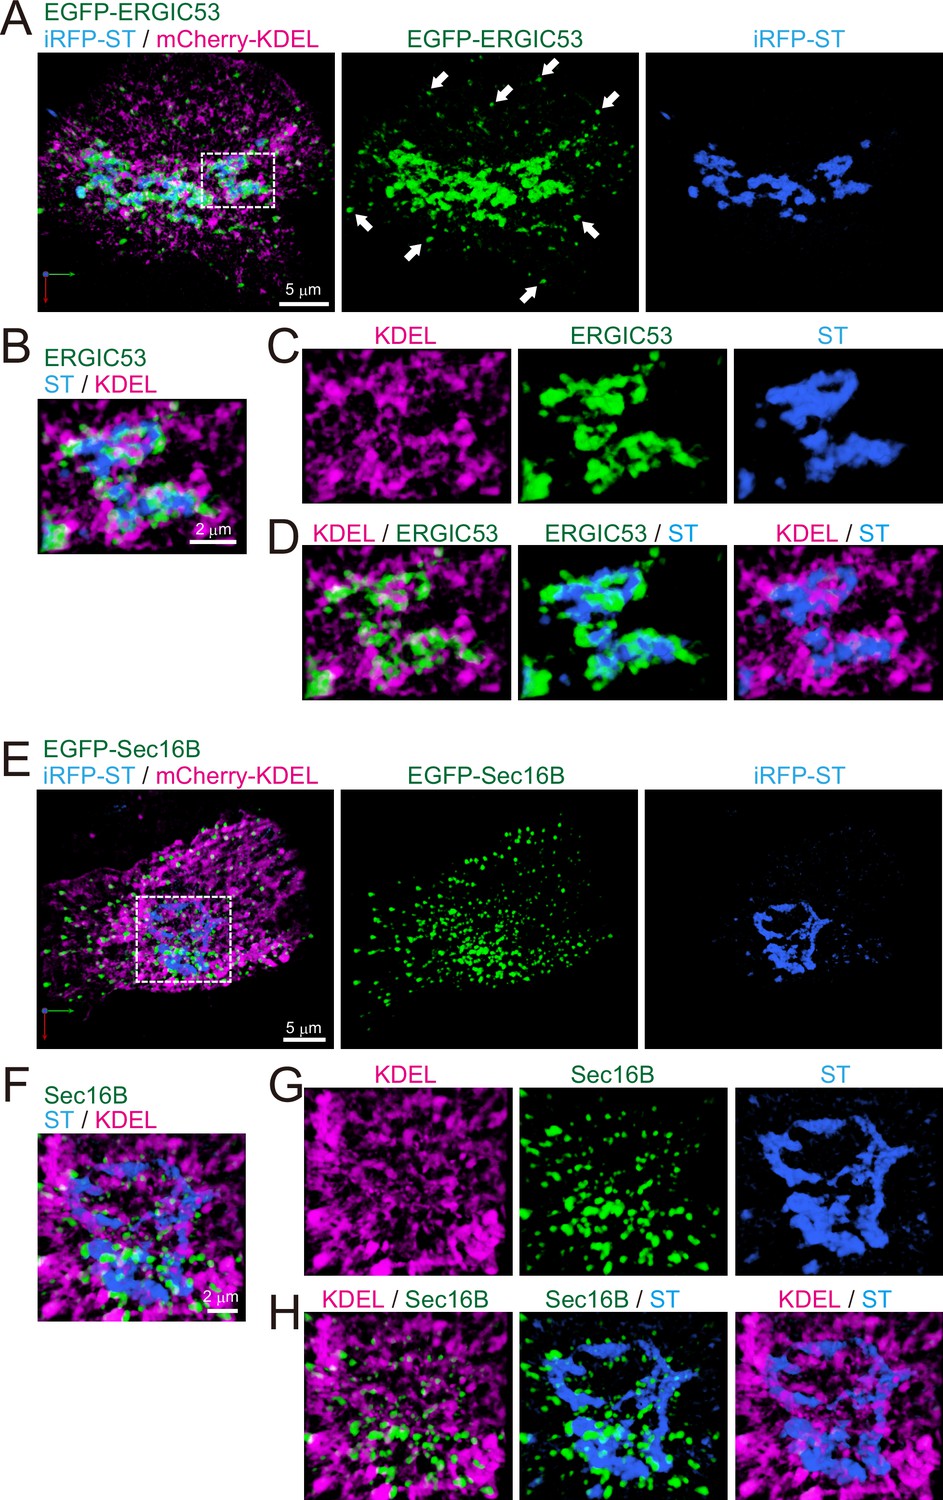
Distribution of endoplasmic reticulum-Golgi intermediate compartment (ERGIC), ER exit sites (ERES), Golgi, and ER in HeLa cells.
(A–D) Triple-color three-dimensional (3D) super-resolution confocal live imaging microscopy (SCLIM) images of the Golgi ribbon area of a HeLa cell expressing EGFP-ERGIC53 (ERGIC marker, green), iRFP-ST (Golgi marker, blue), and mCherry-KDEL (ER marker, magenta). (E–H) Triple-color 3D SCLIM images of the Golgi ribbon area of a HeLa cell expressing EGFP-Sec16B (ERES marker, green), iRFP-ST (blue), and mCherry-KDEL (magenta). (A and E) Images of the whole Golgi ribbon. The left panels show merged images. The center and right panels show EGFP and iRFP fluorescence signals, respectively. (B–D and F–H) Zoom-up images of a portion of the Golgi ribbon in the white dashed squares shown in (A) and (E). (B and F) Triple-merged images. (C and G) Single-channel images. (D and H) Dual-merged images. Arrows in (A): EGFP-ERGIC53-positive puncta distributed away from the Golgi ribbon. Scale bars: 5 μm (A and E) and 2 μm (B and F).
Figure 11
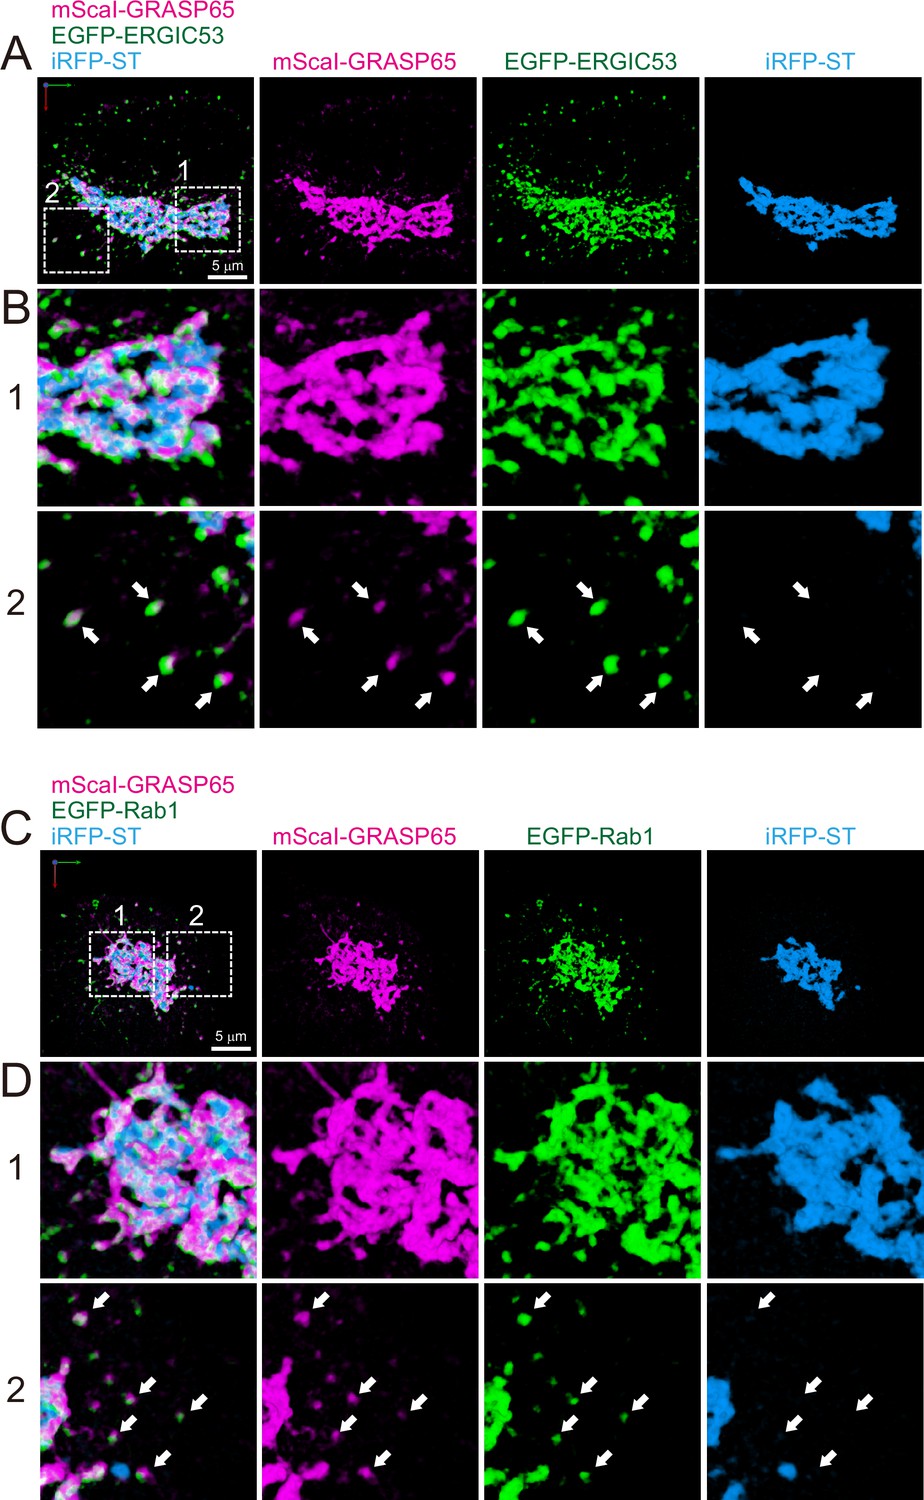
Distribution of endoplasmic reticulum-Golgi intermediate compartment (ERGIC) proteins (GRASP65, ERGIC53, and Rab1) in HeLa cells.
(A and B) Triple-color three-dimensional (3D) super-resolution confocal live imaging microscopy (SCLIM) images of the Golgi ribbon area of a HeLa cell expressing mScarlet-I (mScaI)-GRASP65 (magenta), EGFP-ERGIC53 (green), and iRFP-ST (Golgi marker, blue). (C and D) Triple-color 3D SCLIM images of the Golgi ribbon area of a HeLa cell expressing mScaI-GRASP65 (magenta), EGFP-Rab1 (green), and iRFP-ST (blue). Scale bars: 5 μm. (A and C) Images of the whole Golgi ribbon. The left-most panels show merged images. The right panels show mScaI, EGFP, and iRFP fluorescence signals, respectively. (B and D) Zoom-up images in the white dashed squares (1 and 2) shown in (A) and (C). Arrows indicate that mScaI-GRASP65 and EGFP-ERGIC53/Rab1 double positive but iRFP-ST-negative puncta distributed away from the Golgi ribbon.
Author response image 1
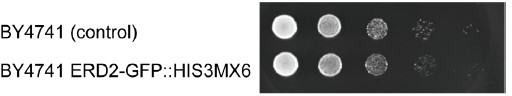
C-terminal GFP tagging of Erd2 in genome had no effect on yeast growth.
Growth assay of serially diluted yeast cells. Cells were incubated overnight at 30°C on a YPD plate.
Author response image 2
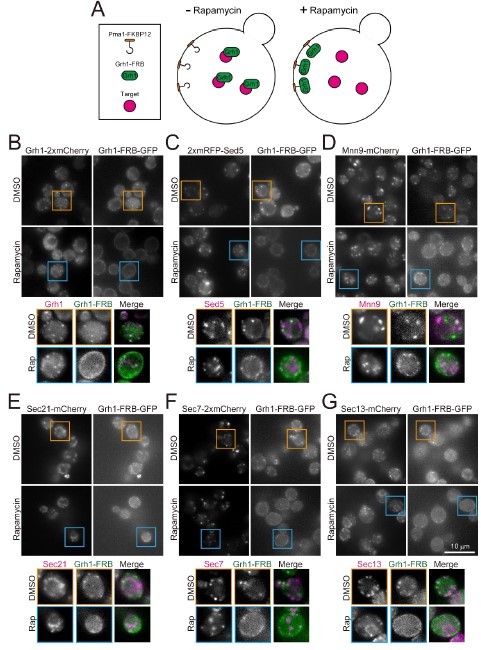
FKBP12/FRB-induced trapping experiments.
(A) The strategy of the experiments. We made rapamycin-resistant yeast strains in which FRB-GFP is fused to Grh1 (an ERGIC protein), FKBP12 is fused to Pma1 (a plasma membrane protein), and red fluorescent protein (mCherry or mRFP) is fused to a target protein. If the Grh1-FRB-GFP is recruited to the plasma membrane (where Pma1-FKBP12 is localized) together with the target protein after treatment with rapamycin, this suggests that they were in the same membrane compartment. (B) Control experiment. Upon treatment with rapamycin, Grh1-FRB-GFP was recruited to the plasma membrane, but Grh1-mCherry was not. (C-G) Sed5 (another ERGIC protein), Mnn9 (a cis-Golgi protein), Sec21 (a medial Golgi protein), Sec7 (a TGN protein), and Sec13 (an ERES protein) were also not recruited to the plasma membrane. These results suggest that, at least in this experimental system, when Grh1-FRB-GFP is captured at the plasma membrane by rapamycin treatment, the membrane compartment on which Grh1 rode does not migrate together with it.
Tables
Table 1
Peak-to-peak duration time between the maximum fluorescence intensities of the two proteins at single cisterna.
-
*
Number of puncta and cells used for the calculation of peak-to-peak duration. In each cell, 1–4 puncta were selected for the calculation.
-
†
Suda, Y., Kurokawa, K., Hirata, R., and Nakano, A. 2013. Rab GAP cascade regulates dynamics of Ypt6 in the Golgi traffic. Proc. Natl. Acad. Sci. U.S A. 110:18976–18981.
Additional files
-
Supplementary file 1
Alignment of amino acid sequences of yeast Emp46/47 and human ERGIC-53.
- https://cdn.elifesciences.org/articles/92900/elife-92900-supp1-v1.pdf
-
Supplementary file 2
Yeast strains used in this study.
- https://cdn.elifesciences.org/articles/92900/elife-92900-supp2-v1.xlsx
-
Supplementary file 3
Yeast plasmids used in this study.
- https://cdn.elifesciences.org/articles/92900/elife-92900-supp3-v1.xlsx
-
Supplementary file 4
Yeast strains and plasmids used in each experiment.
- https://cdn.elifesciences.org/articles/92900/elife-92900-supp4-v1.xlsx
-
MDAR checklist
- https://cdn.elifesciences.org/articles/92900/elife-92900-mdarchecklist1-v1.docx
Download links
A two-part list of links to download the article, or parts of the article, in various formats.
Downloads (link to download the article as PDF)
Open citations (links to open the citations from this article in various online reference manager services)
Cite this article (links to download the citations from this article in formats compatible with various reference manager tools)
Spatiotemporal dissection of the Golgi apparatus and the ER-Golgi intermediate compartment in budding yeast
eLife 13:e92900.
https://doi.org/10.7554/eLife.92900


