Neural interactions in the human frontal cortex dissociate reward and punishment learning
- Institut de Neurosciences de La Timone, UMR 7289, CNRS, Aix-Marseille Université, France
- Univ. Grenoble Alpes, Inserm, U1216, Grenoble Institut Neurosciences, France
- Department of Functional Neurology and Epileptology, Hospices Civils de Lyon and University of Lyon, France
- Univ. Grenoble Alpes, Inserm, U1216, CHU Grenoble Alpes, Grenoble Institut Neurosciences, France
Figures
Figure 1 with 2 supplements
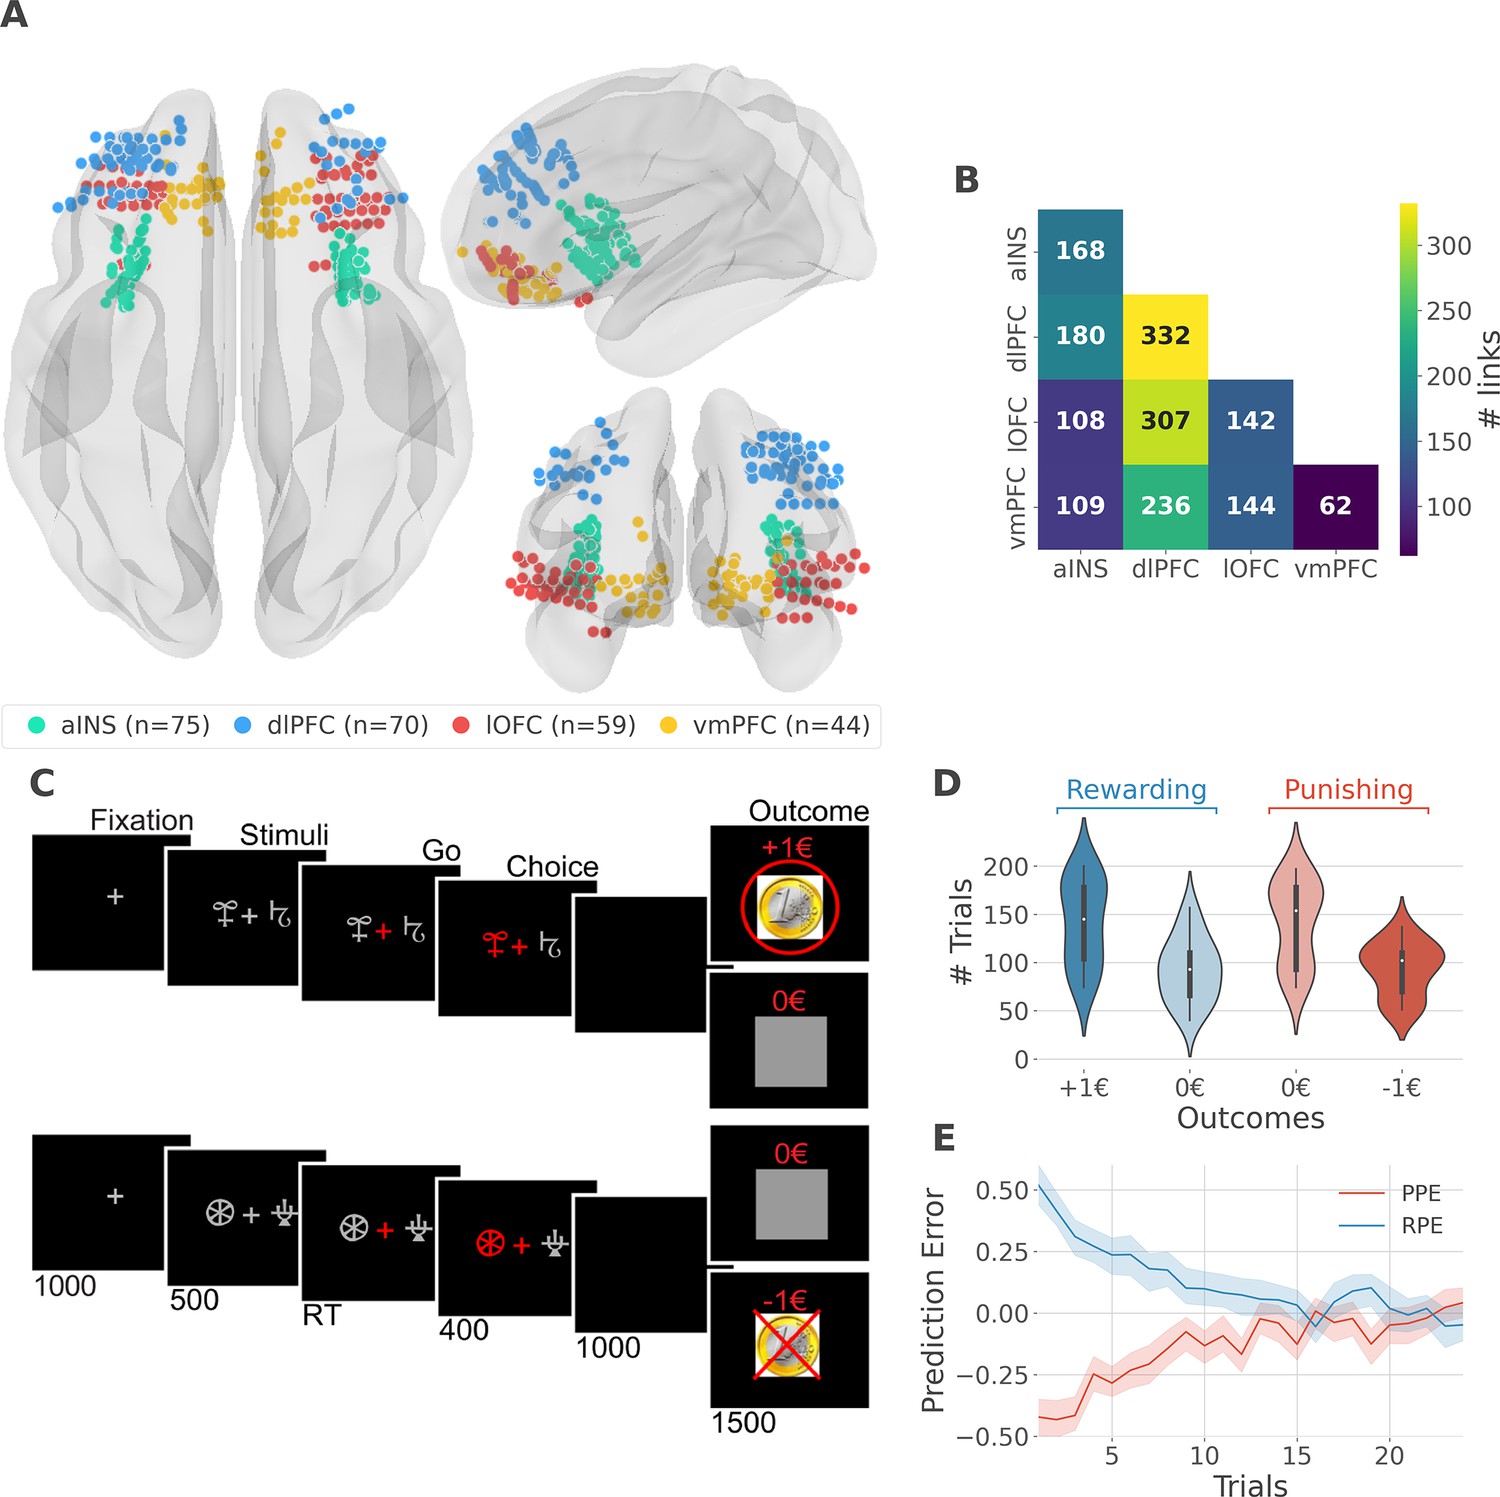
intracerebral EEG (iEEG) implantation, behavioral task, and computational modeling.
(A) Anatomical location of intracerebral electrodes across the 16 epileptic patients. Anterior insula (aINS, n=75), dorsolateral prefrontal cortex (dlPFC, n=70), lateral orbitofrontal cortex (lOFC, n=59), ventromedial prefrontal cortex (vmPFC, n=44), (B) Number of pairwise connectivity links (i.e. within patients) within and across regions, (C) Example of a typical trial in the reward (top) and punishment (bottom) conditions. Participants had to select one abstract visual cue among the two presented on each side of a central visual fixation cross and subsequently observed the outcome. Duration is given in milliseconds, (D) Number of trials where participants received outcomes +1€ (142±44, mean ± std) vs. 0€ (93±33) in the rewarding condition (blue) and outcomes 0€ (141±42) to –1€ (93±27) in the punishment condition (red), (E) Across participants trial-wise reward prediction error (PE) (Reward prediction error, RPE - blue) and punishment PE (PPE - red), ±95% confidence interval.
Figure 1—figure supplement 1
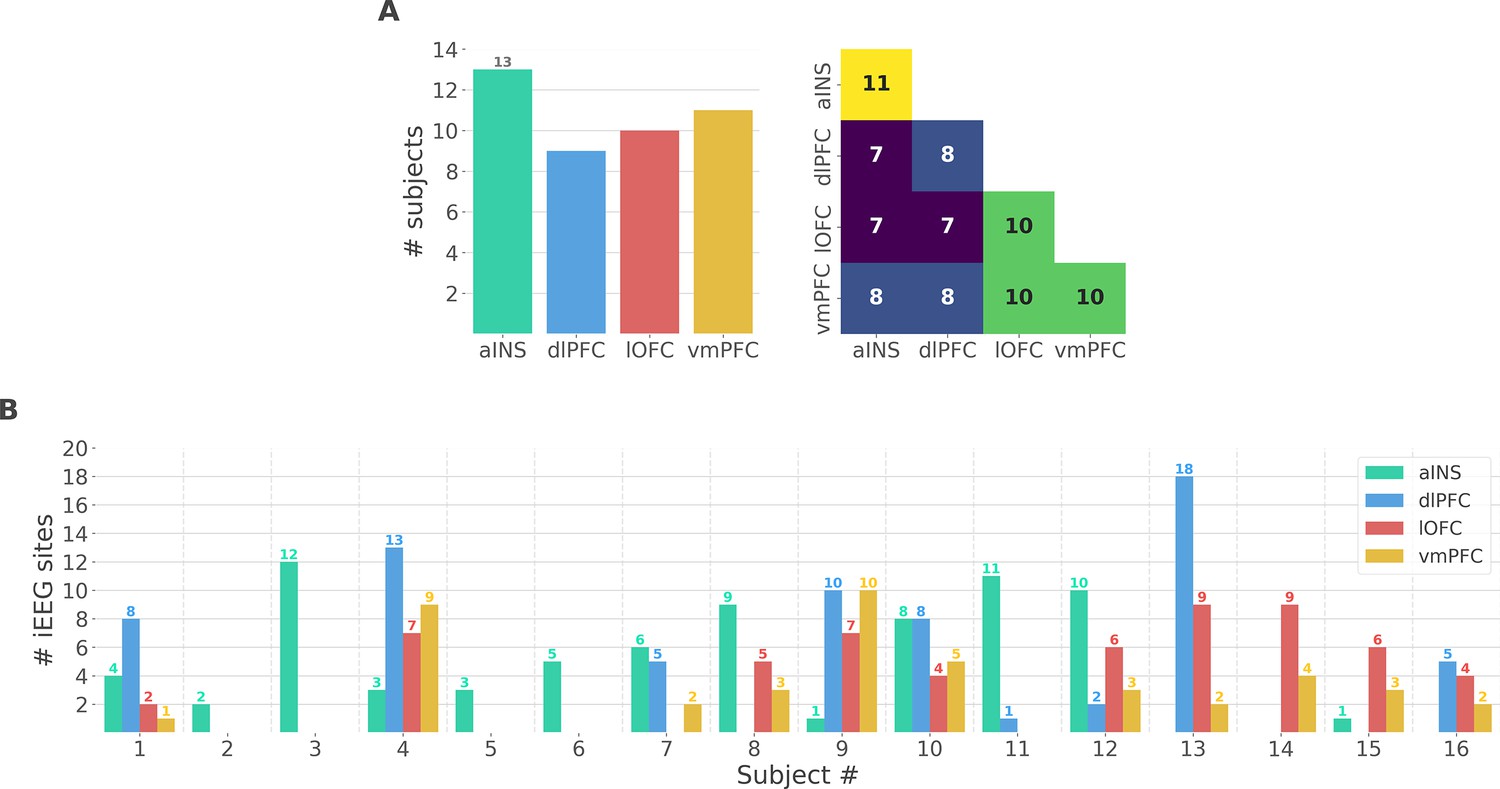
Single subject anatomical repartition.
(A) Number of unique subjects per brain region and per pair of brain regions (B) Number of bipolar derivations per subject and per brain region.
Figure 1—figure supplement 2
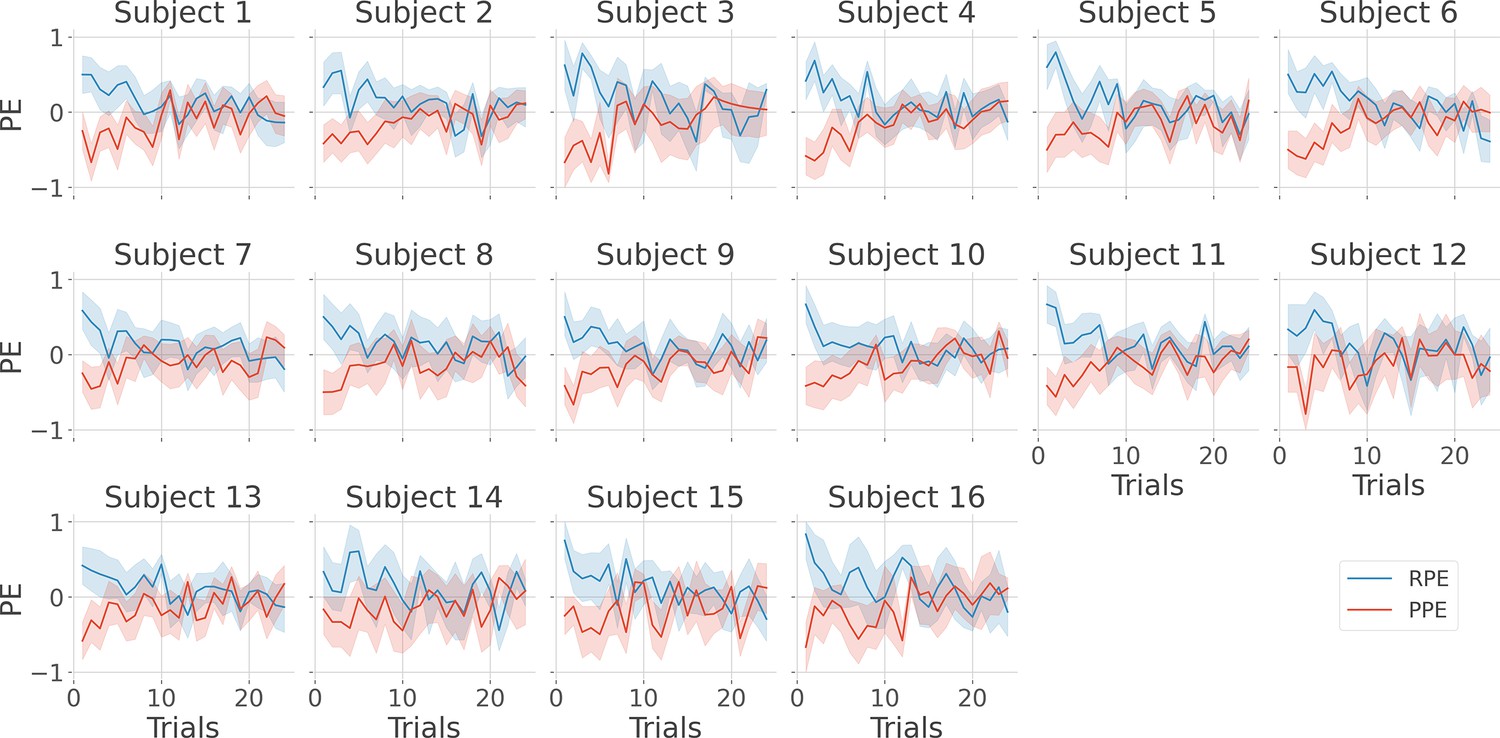
Single-subject estimation of prediction errors.
Single-subject trial-wise reward prediction error (PE) (Reward prediction error, RPE - blue) and punishment PE (PPE - red), ±95% confidence interval.
Figure 2 with 2 supplements
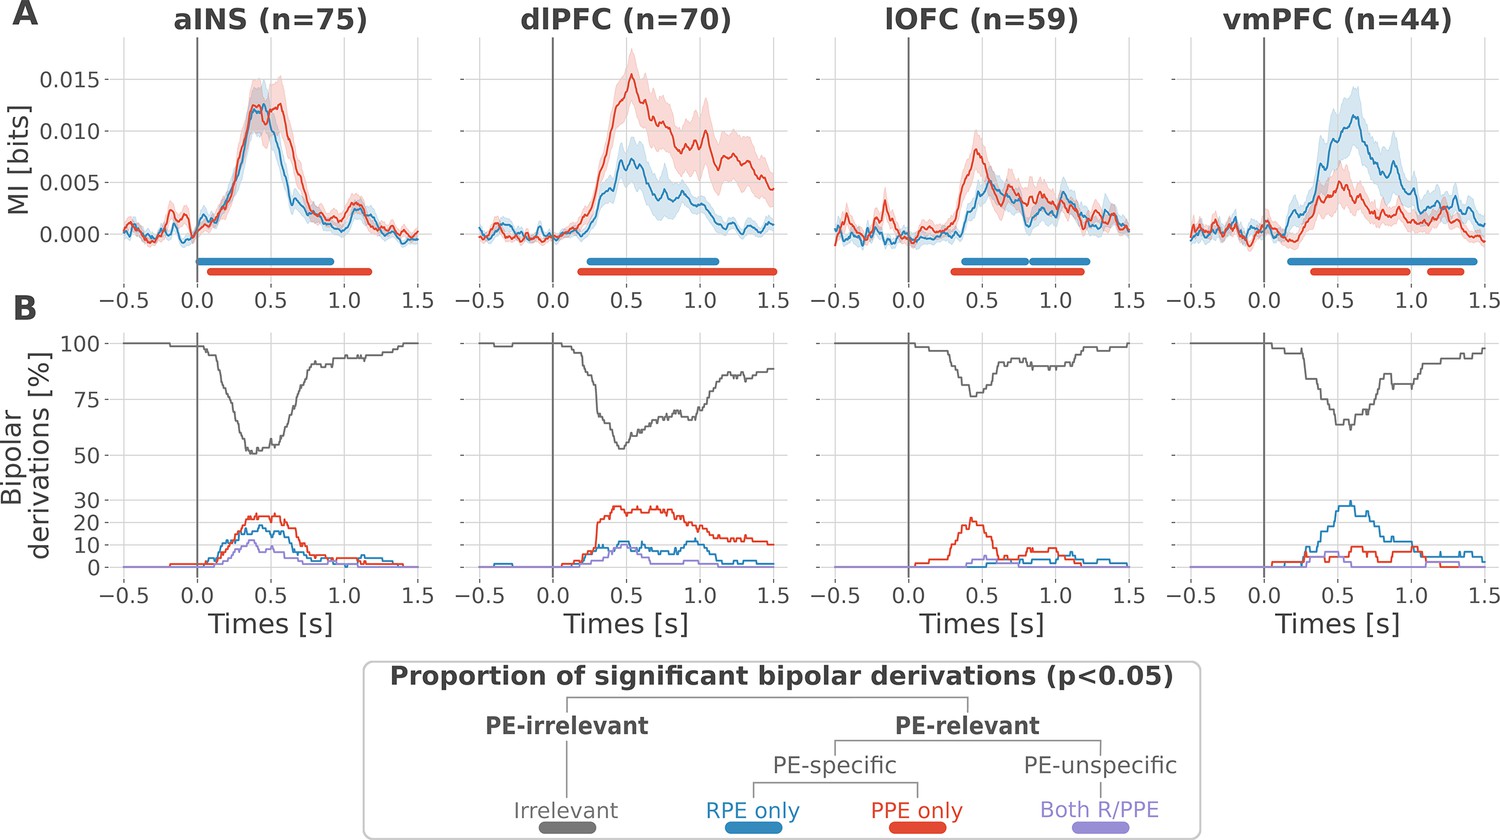
Local mixed encoding of reward and punishment prediction error signals.
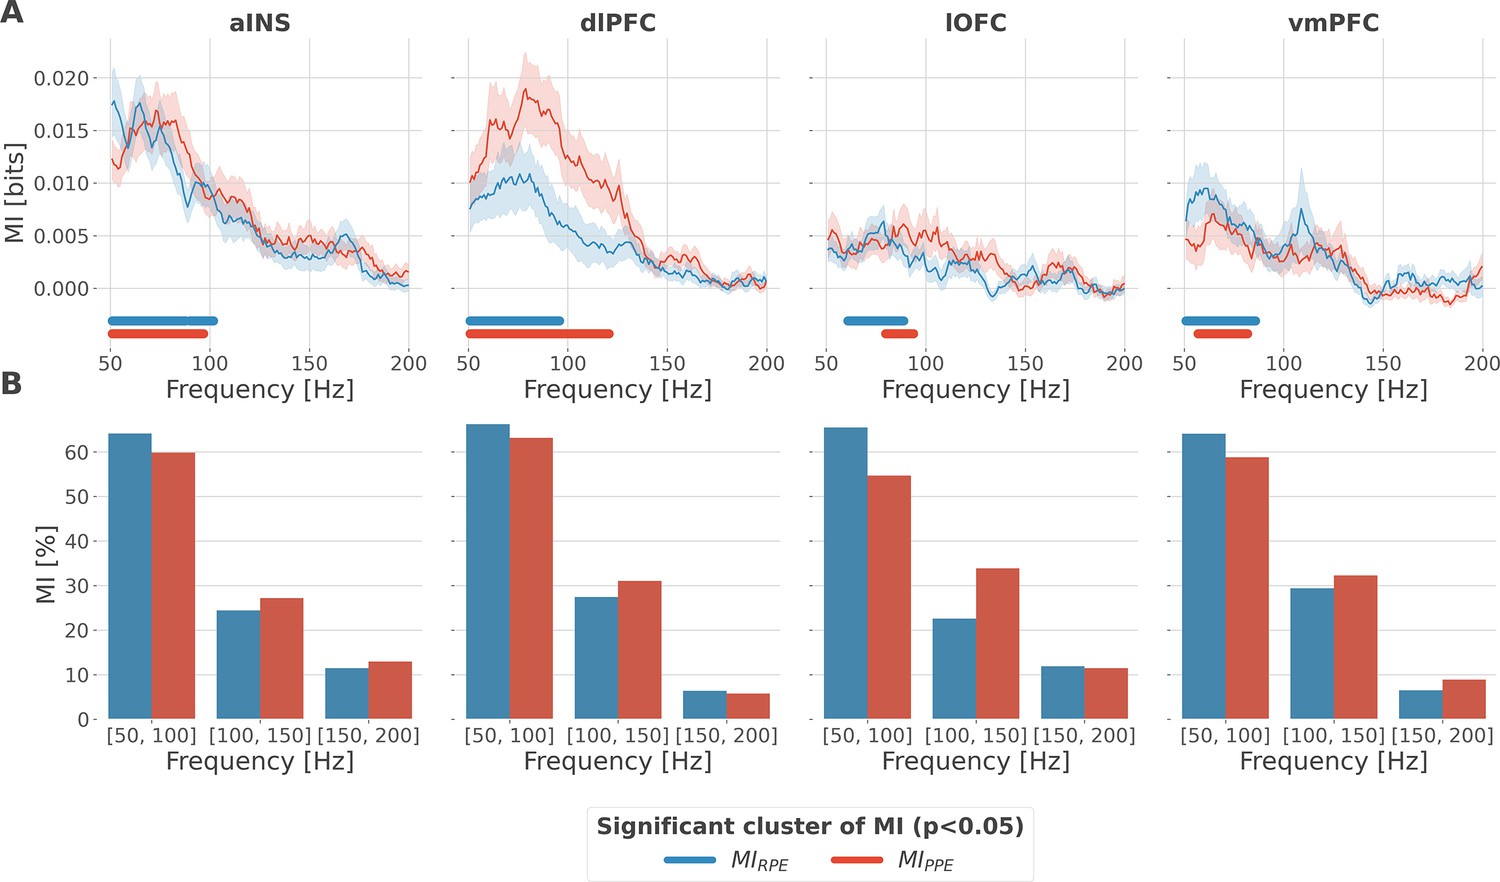
(A) Time-courses of mutual information (MI in bits) estimated between the gamma power and the reward (blue) and punishment (red) prediction error (PE) signals. The solid line and the shaded area represent the mean and SEM of the across-contacts MI. Significant clusters of MI at the group level are plotted with horizontal bold lines (p<0.05, cluster-based correction, non-parametric randomization across epochs), (B) Instantaneous proportions of task-irrelevant (gray) and task-relevant bipolar derivations presenting a significant relation with either the reward prediction error (RPE) (blue), the punishment prediction error (PPE) (red) or with both RPE and PPE (purple). Data is aligned to the outcome presentation (vertical line at 0 s).
Figure 2—figure supplement 1
Local encoding of prediction error signals within the gamma band.
(A) Distribution of information in the anterior insula (aINS), dorsolateral prefrontal cortex (dlPFC), lateral orbitofrontal cortex (lOFC), and vmPFC about the R/punishment prediction error (PPE) in the frequency domain. The solid line and the shaded area respectively represent the mean and SEM of the across-contacts mutual information (MI). Horizontal thick lines represent significant clusters of information (p<0.05, cluster-based correction, non-parametric randomization across epochs). (B) Density of information in the [50, 100] Hz, [100, 150] Hz, and [150, 200] Hz bins.
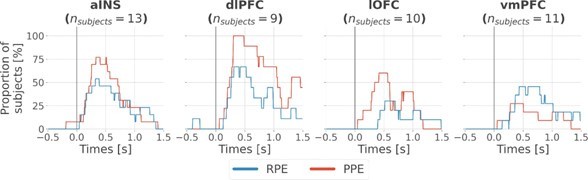
Figure 2—figure supplement 2
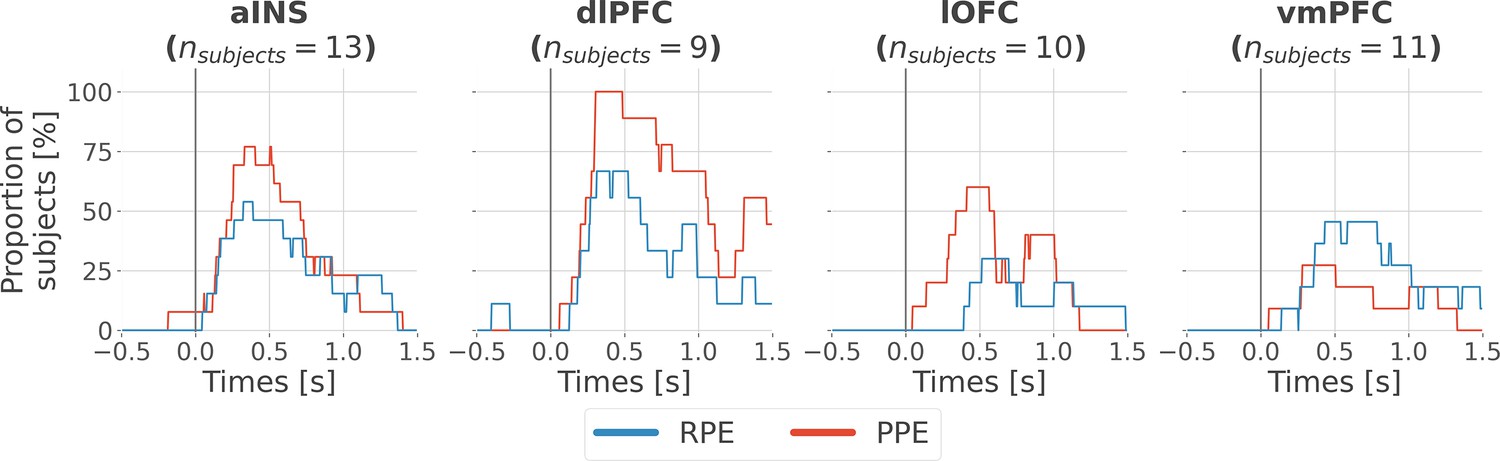
Inter-subjects reproducibility of local encoding of prediction error (PE) signals.
Time-courses of the proportion of unique subjects having at least one bipolar derivation with a significant encoding (p<0.05, cluster-based correction, non-parametric randomization across epochs) of reward prediction error (RPE) (blue) or punishment prediction error (PPE) (red). Data is aligned to the outcome presentation (vertical line at 0 s).
Figure 3 with 1 supplement
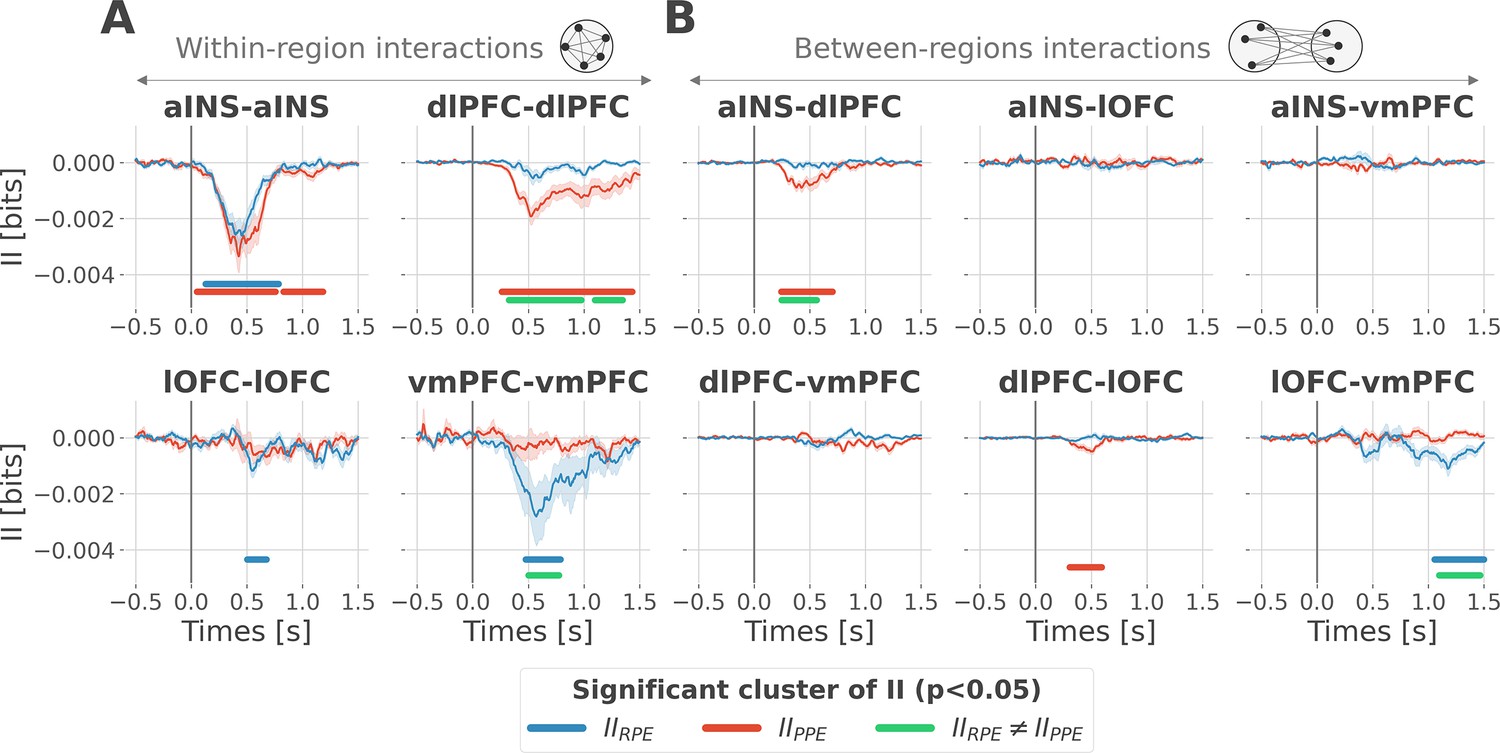
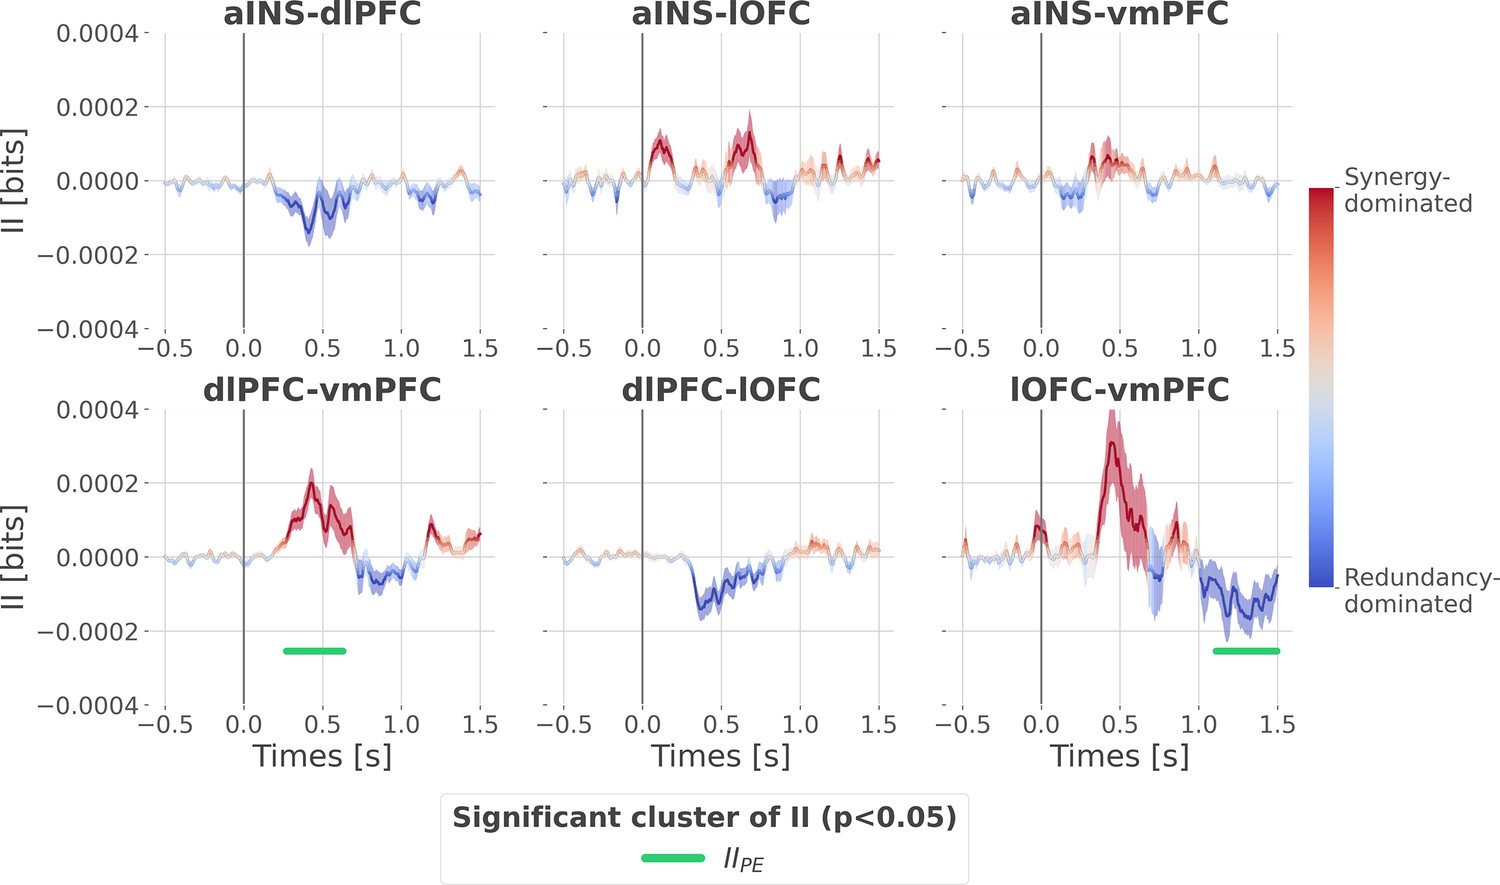
Encoding of prediction error (PE) signals occurs with redundancy-dominated subsystems.
Dynamic interaction information (II in bits) within- (A) and between-regions (B) about the RPE (IIRPE) and PPE (IIPPE) are plotted in blue and red. Significant clusters of IIRPE and IIPPE are displayed with horizontal bold blue and red lines (p<0.05, cluster-based correction, non-parametric randomization across epochs). Significant differences between IIRPE and IIPPE are displayed in green. Shaded areas represent the SEM. The vertical gray line at 0 s represents the outcome presentation.
Figure 3—figure supplement 1
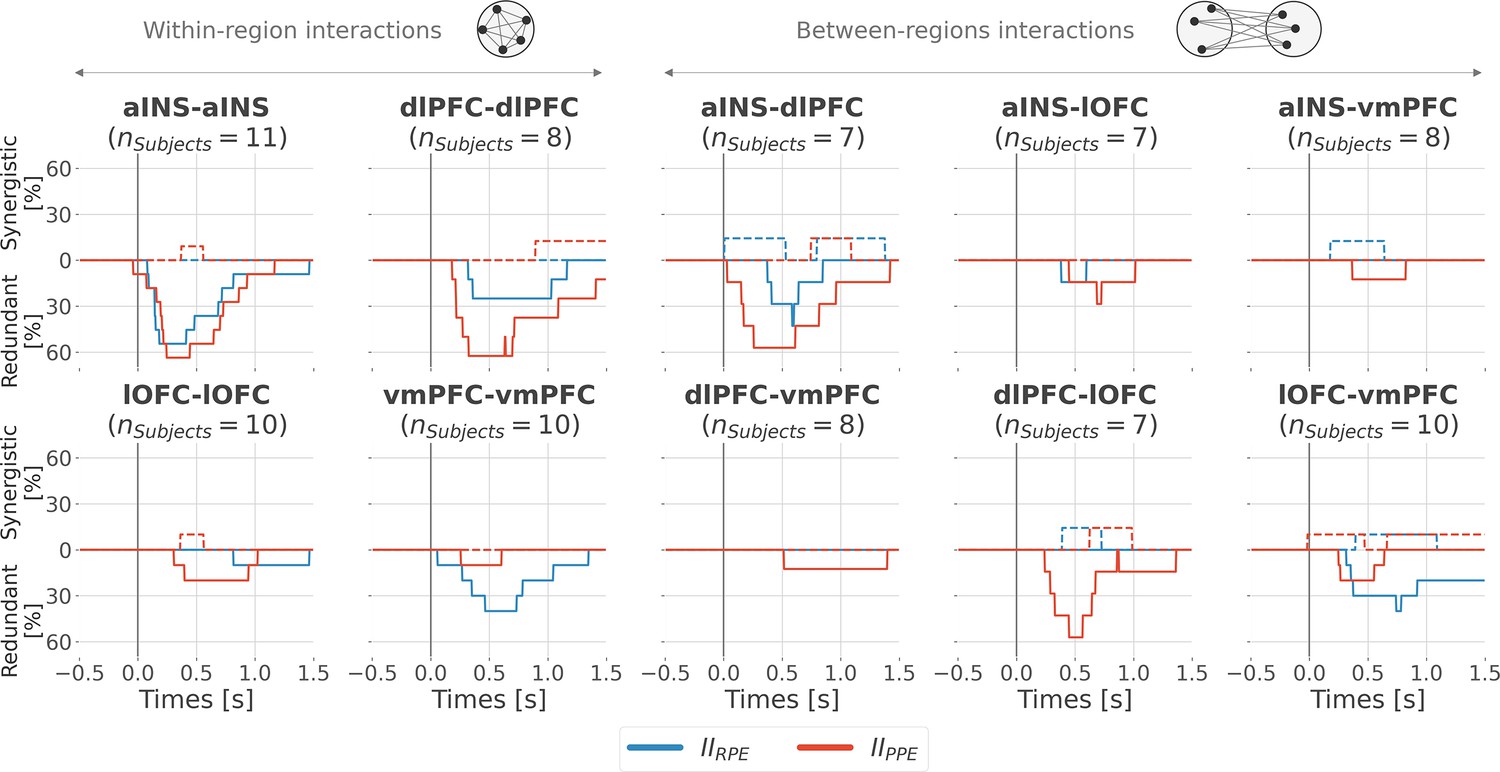
Inter-subjects reproducibility of redundant interactions about prediction error (PE) signals.
Time-courses of the proportion of unique subjects having at least one pair of bipolar derivation with significant interaction information (p<0.05, cluster-based correction, non-parametric randomization across epochs) about the reward prediction error (RPE) (blue) or punishment prediction error (PPE) (red). Data is aligned to the outcome presentation (vertical line at 0 s). Proportion of subjects with redundant (solid) and synergistic (dashed) interactions are respectively going downward and upward.
Figure 4 with 2 supplements
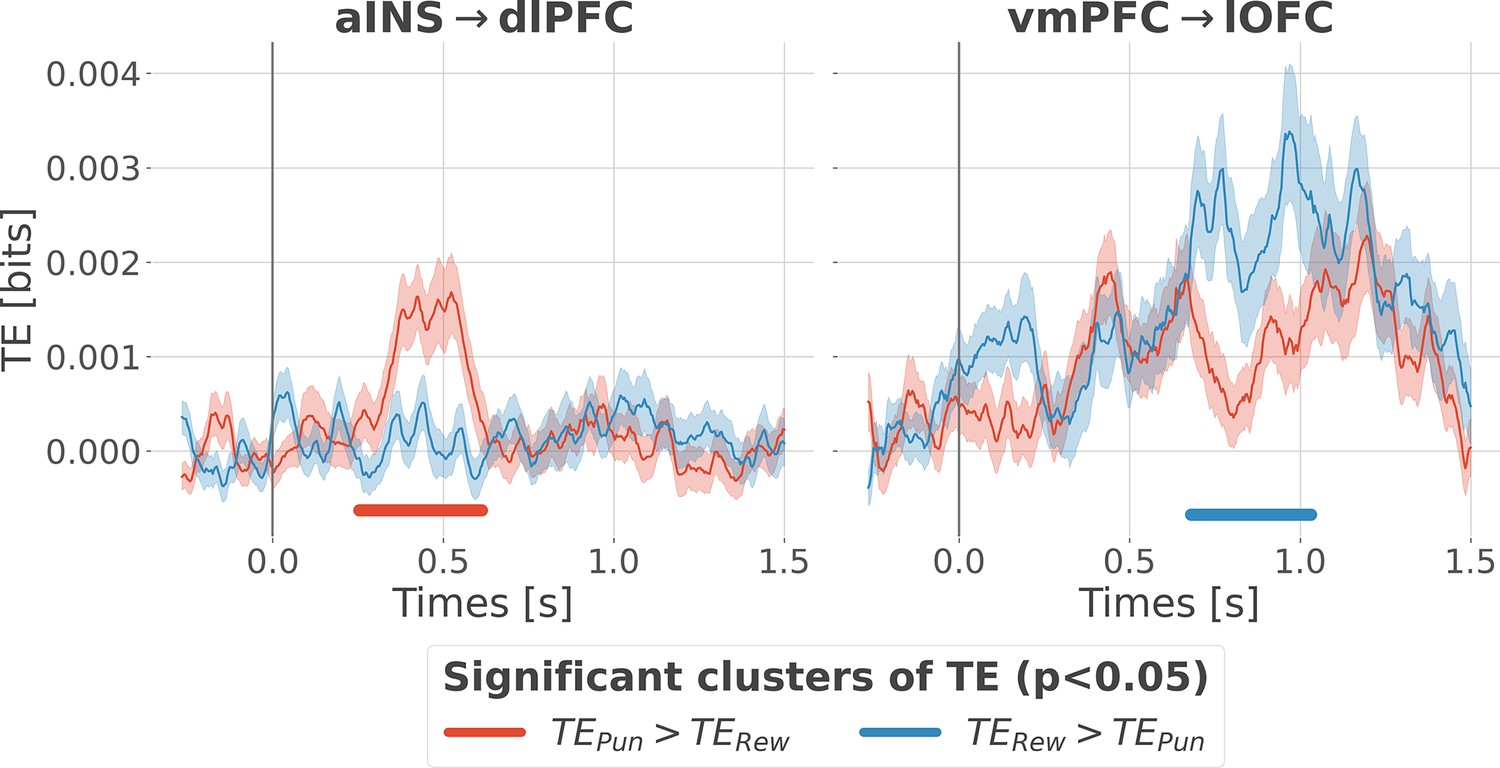
Contextual modulation of information transfer.
Time courses of transfer entropy (TE, in bits) from the anterior insula (aINS) to the dorsolateral prefrontal cortex (dlPFC) (aINS→dlPFC) and from the vmPFC to the lateral orbitofrontal cortex (lOFC) (vmPFC→lOFC), estimated during the rewarding condition (TERew in blue) and punishing condition (TEPun in red). Significant differences (p<0.05, cluster-based correction, non-parametric randomization across epochs) of TE between conditions are displayed with horizontal bold lines (blue for TERew >TEPun and red for TEPun >TERew). Shaded areas represent the SEM. The vertical gray line at 0 s represents the outcome presentation.
Figure 4—figure supplement 1
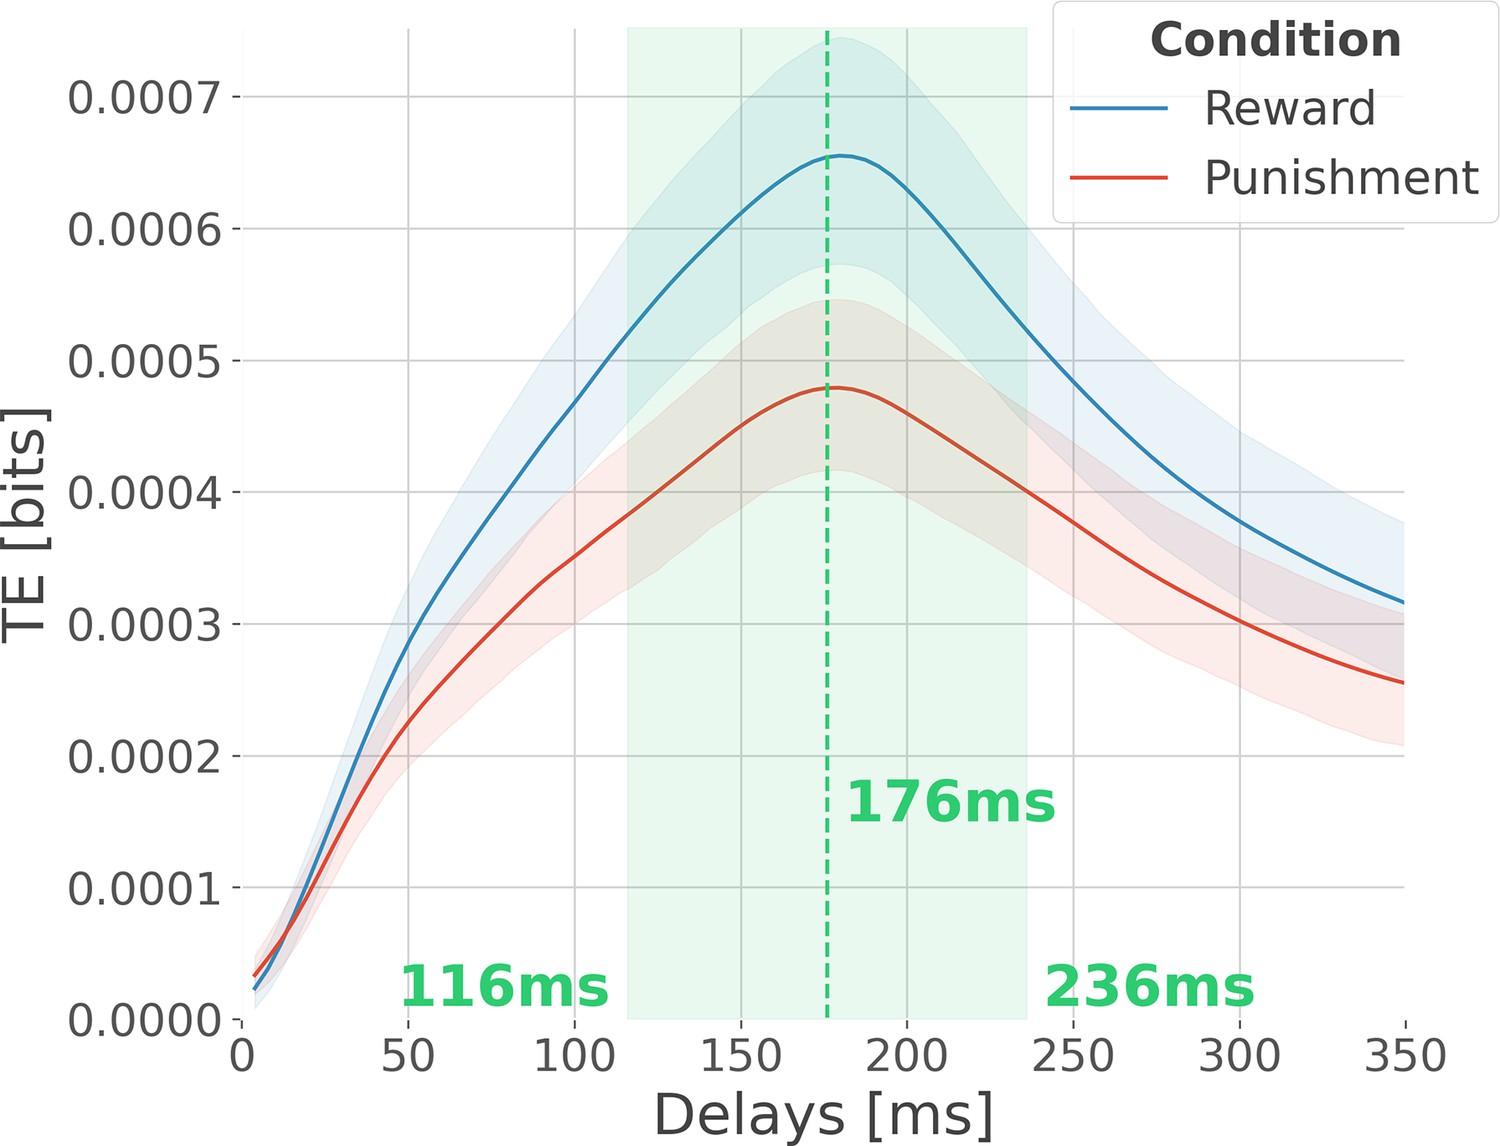
Optimal delay interval for maximizing information transfer.
Modulation of transfer entropy (TE in bits), estimated across all pairs of contacts per participant, as a function of the delay between source and target areas. The delay represents the number of time points in the past of the target to use for conditioning. An information flow from source X to target Y exists because the inclusion of the past of X reduces the uncertainty about the future of Y, given its own past. In blue, the TE is computed across rewarding trials, and in red, the TE is computed across punishing trials. Shaded areas surrounding the time courses represent the 95% confidence interval estimated using a bootstrapping strategy. We observed a maximum information flow for delays up to 176 ms.
Figure 4—figure supplement 2
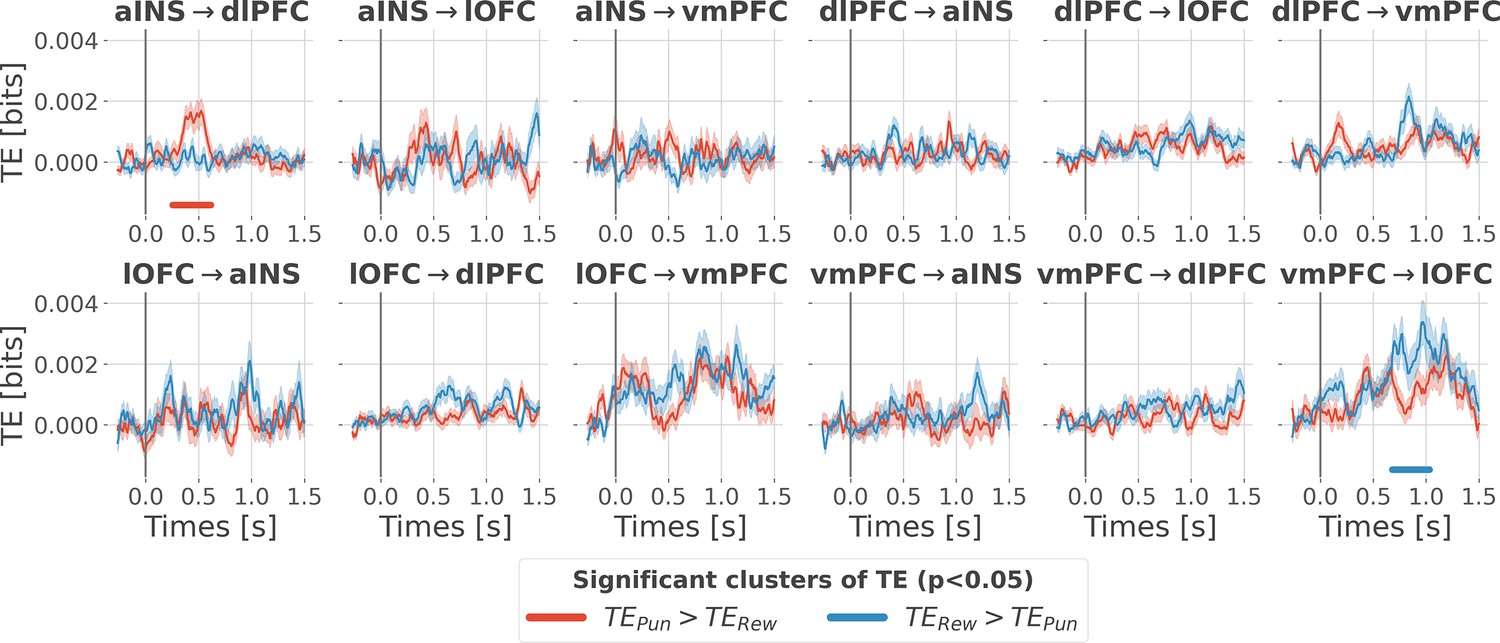
Contextual modulation of the information transfer.
Time courses of transfer entropy (TE, in bits) are estimated during the rewarding condition (TERew in blue) and punishing condition (TEPun in red). Significant differences (p<0.05, cluster-based correction, non-parametric randomization across epochs) of TE between conditions are displayed with horizontal bold lines (blue for TERew >TEPun and red for TEPun >TERew). Shaded areas represent the SEM. The vertical gray line at 0 s represents the outcome presentation.
Figure 5 with 3 supplements
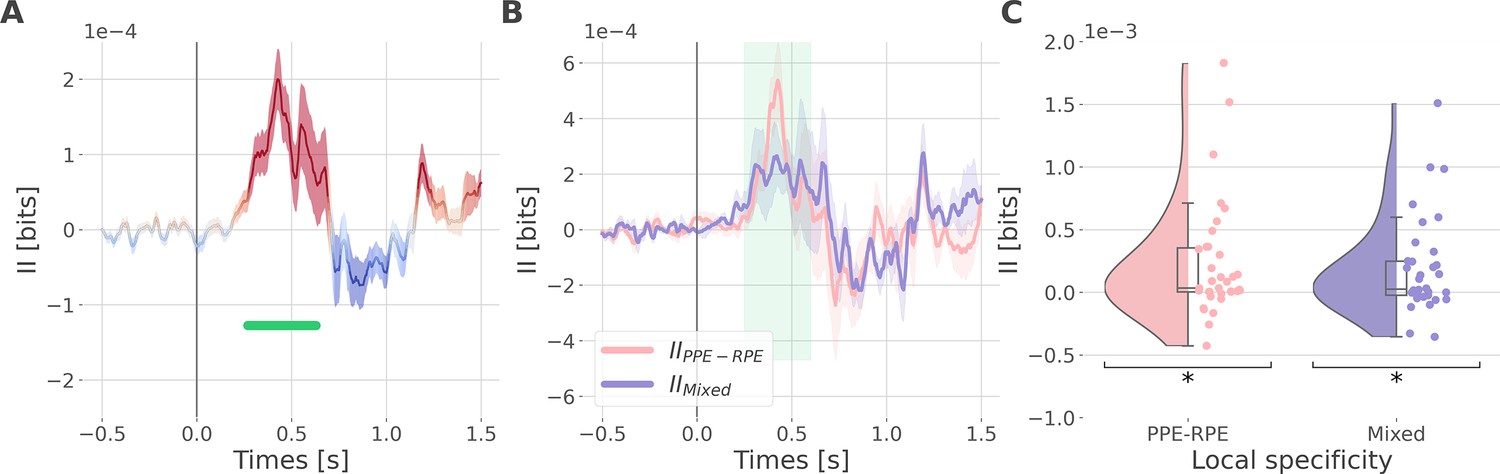
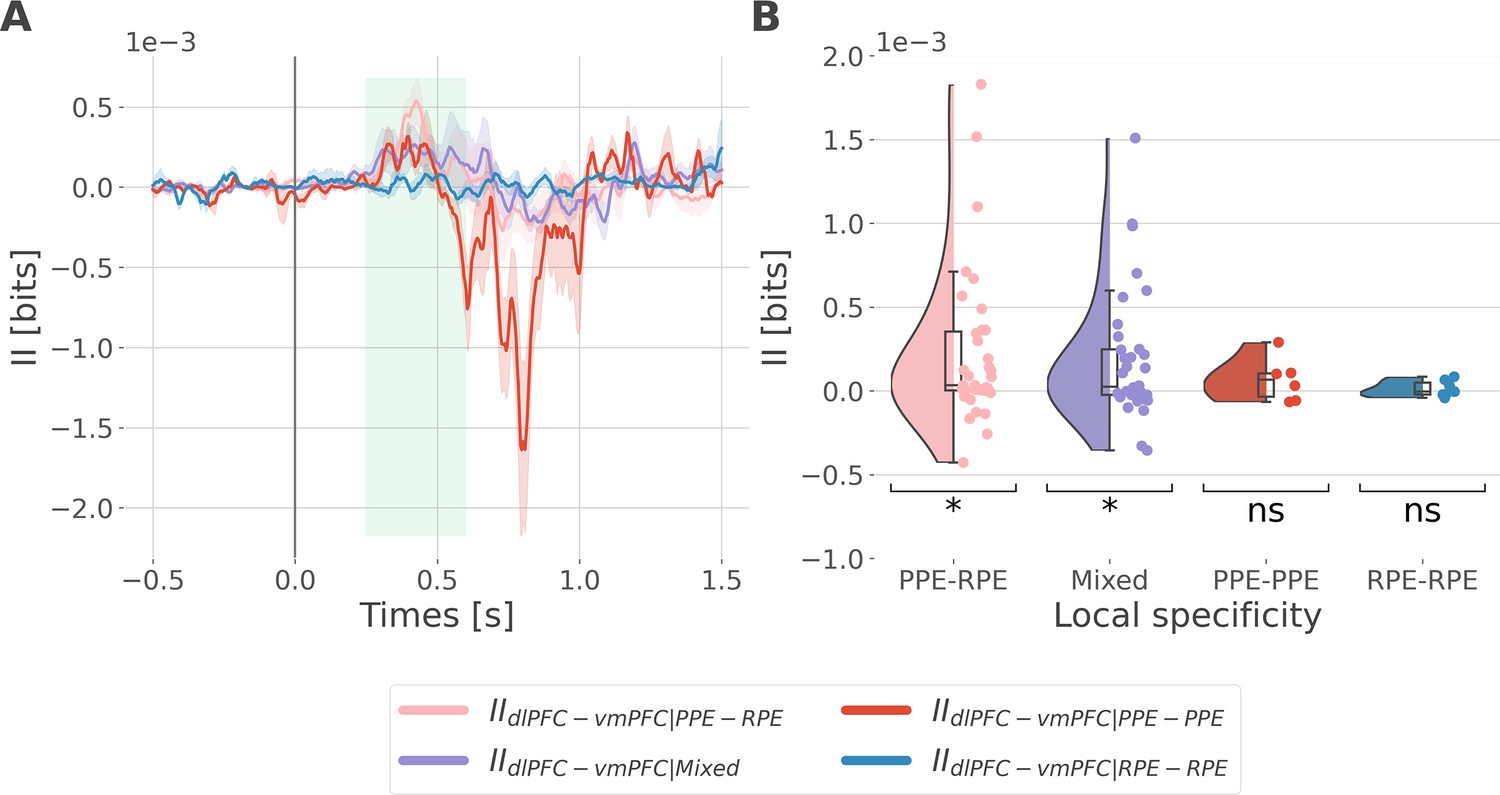
Synergistic interactions about the full prediction error (PE) signals between recordings of the dlPFC and vmPFC.
(A) Dynamic interaction information (II in bits) between the dorsolateral prefrontal cortex (dlPFC) and vmPFC about the full prediction error (IIdlPFC-vmPFC). Hot and cold colors indicate synergy- and redundancy-dominated II about the full PE. Significant clusters of II are displayed with a horizontal bold green line (p<0.05, cluster-based correction, non-parametric randomization across epochs). Shaded areas represent the SEM. The vertical gray line at 0 s represents the outcome presentation. (B) Dynamic IIdlPFC-vmPFC binned according to the local specificity PPE-RPE (IIPPE-RPE in pink) or mixed (IIMixed in purple) (C) Distributions of the mean of the IIPPE-RPE and IIMixed for each pair of recordings (IIPPE-RPE: one-sample t-test against 0; dof = 34; P fdr-corrected=0.015*; T=2.86; CI(95%)=[6.5e-5, 3.9e-4]; IIMixed: dof = 33; P fdr-corrected=0.015*; T=2.84; CI(95%)=[5.4e-5, 3.3e-4]).
Figure 5—figure supplement 1
Cortico-cortical interactions about the full prediction error (PE) signals.
Dynamic interaction information (II in bits) between-regions about the full prediction error (IIPE). Hot and cold colors indicate synergy- and redundancy-dominated interactions about the full PE. Significant clusters of IIPE are displayed with a horizontal bold green line (p<0.05, cluster-based correction, non-parametric randomization across epochs). Shaded areas represent the SEM. The vertical gray line at 0 s represents the outcome presentation.
Figure 5—figure supplement 2
Interaction information is binned according to the local specificity.
We binned the II about the full prediction error (PE) (i.e. by concatenating the reward prediction error, RPE and punishment prediction error, PPE) according to the local specificity of the bipolar derivations in the dorsolateral prefrontal cortex (dlPFC) and vmPFC i.e., contacts with gamma activity modulated according to the RPE only, to the PPE only or to both RPE and PPE (see Figure 2B). As a result, we binned the II into four categories: the IIRPE-RPE and IIPPE-PPE respectively reflecting the II estimated between recordings specific to the RPE and PPE, the IIPPE-RPE between recordings PPE and RPE specific and the IIMixed for the remaining possibilities (i.e. RPE-Both, PPE-Both and Both-Both). (A) Dynamic interaction information (II in bits) between the dlPFC and vmPFC (IIdlPFC-vmPFC) binned according to the local specificity toward the RPE and PPE. Shaded areas represent the SEM. The vertical gray line at 0 srepresents the outcome presentation. (B) Mean II between time points from 250 to 600 ms after outcome presentation per category of local specificity. Each individual point represents one pair of recordings from the dlPFC and vmPFC. Statistical significance was assessed using a one-sample t-test against 0 (Table 1).
Figure 5—figure supplement 3
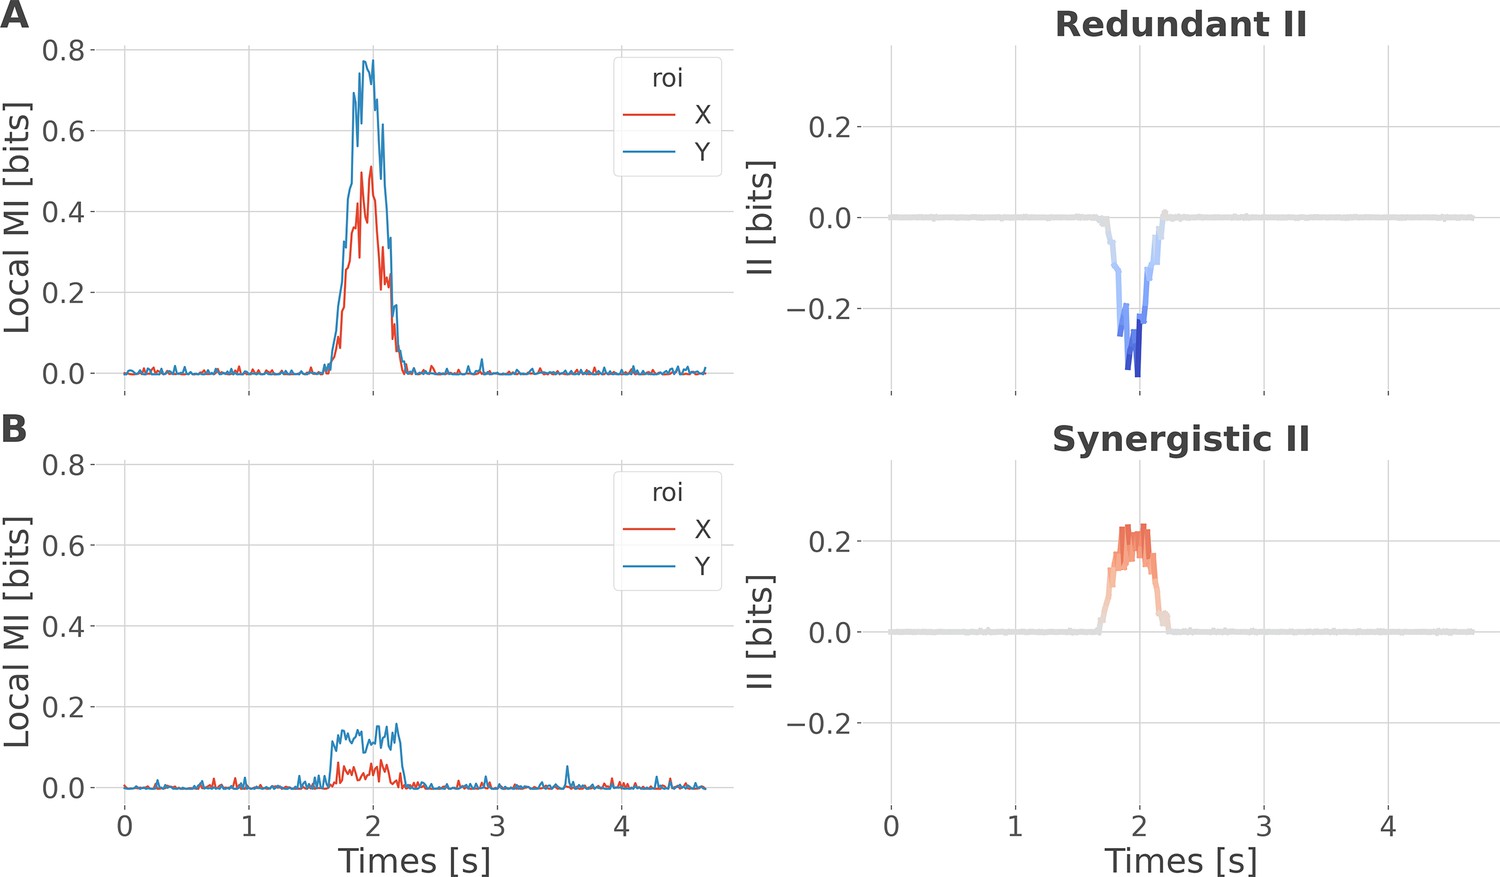
Local specificity does not fully determine the type of interactions.
We performed a simulation to demonstrate that synergistic interactions can emerge between two regions with the same specificity. For example, consider one region that locally encodes early trials of reward prediction error (RPE) and a second region that encodes late trials of RPE. Combining the two using the interaction information (II) measure would lead to synergistic interactions, as each region carries information that is not carried by the other. To simulate this scenario, we initialized data for two brain regions, X and Y, and a 200-trial prediction error vector, all using random noise sampled from a uniform distribution. To simulate redundant interactions, both X and Y received a copy of the prediction error (one-to-all). To simulate synergy, X and Y received early and late prediction error trials, respectively (all-to-one). Local mutual information (MI) encoding the prediction error (PE) increased for regions X and Y around 1.5 s both for redundant (A) and synergistic (B) encoding of the Y variable. However, in the first case, it led to negative II (redundancy), while in the second case, it led to positive II (synergy). This toy example illustrates that local specificity is not the only factor determining the type of interactions between regions.
Figure 6
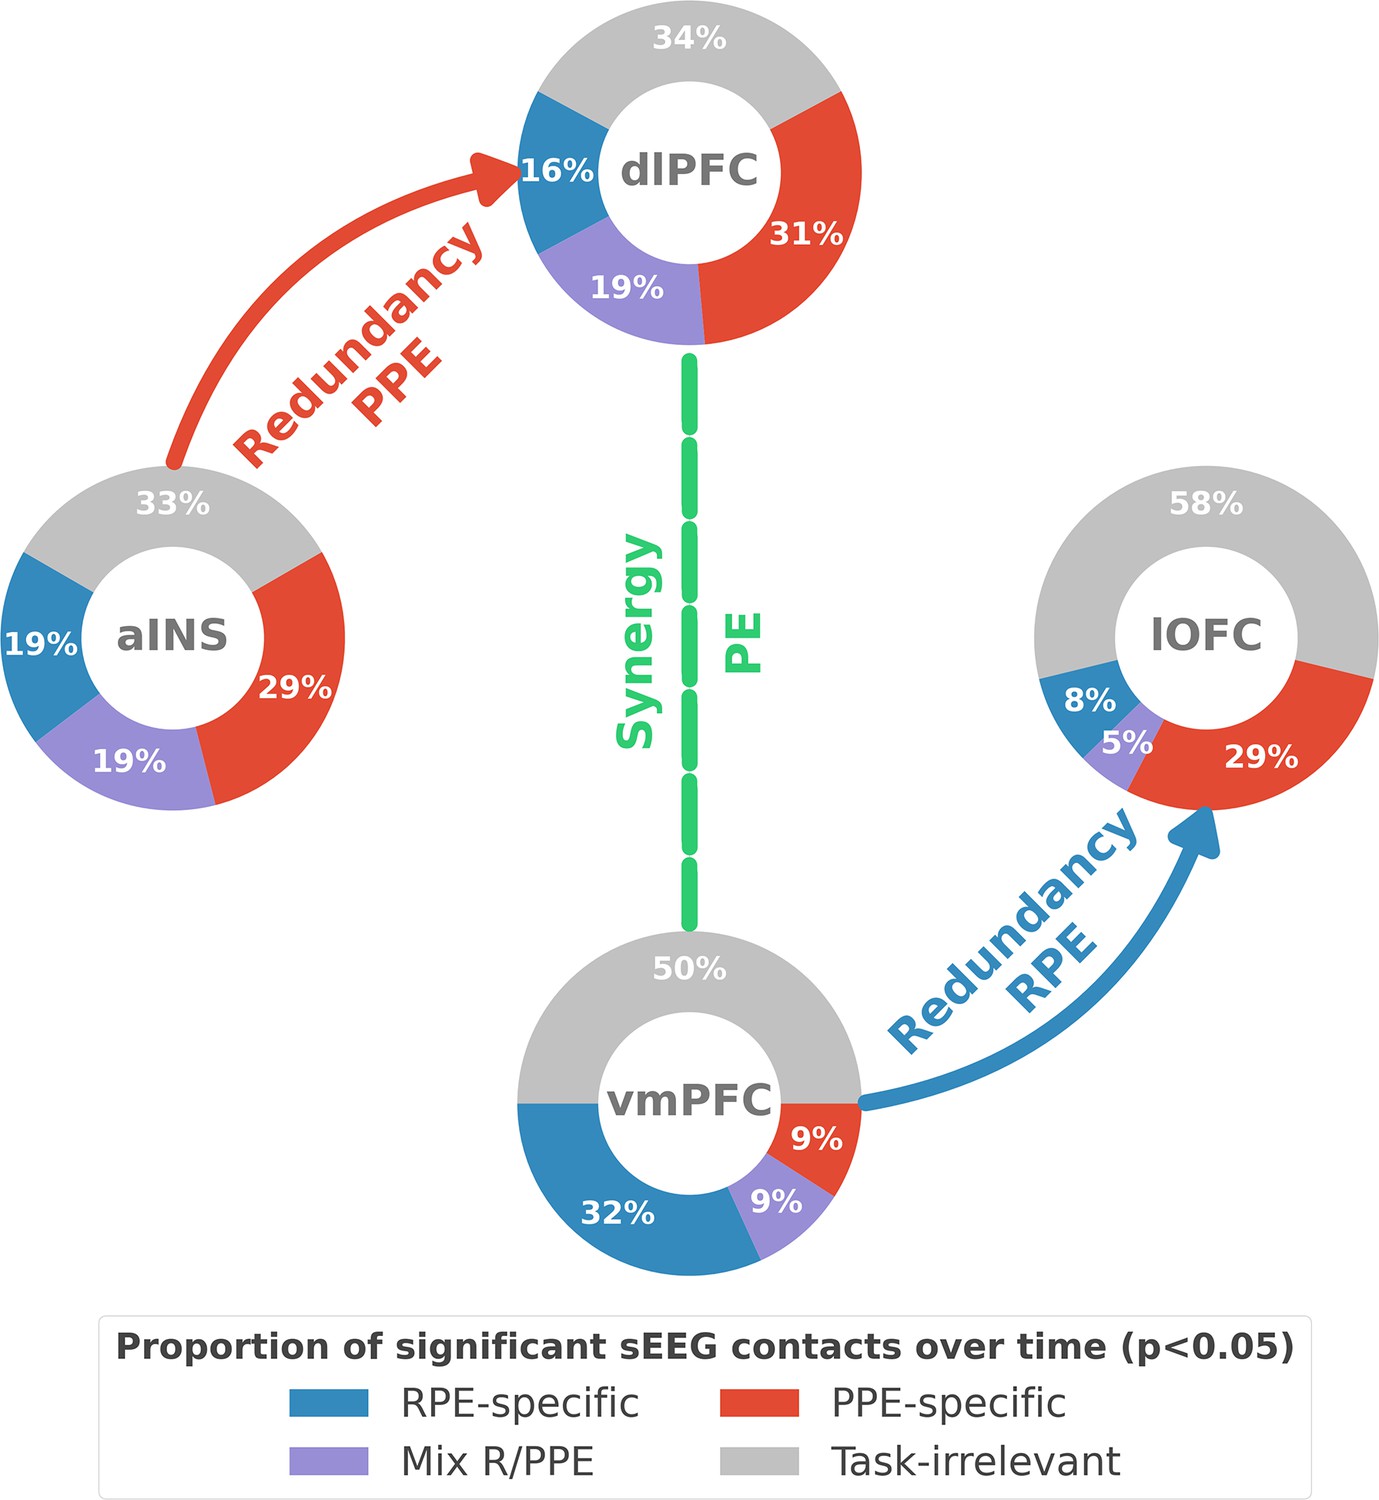
Summary of findings.
The four nodes represent the investigated regions, namely the anterior insula (aINS), the dorsolateral and ventromedial parts of the prefrontal cortex (dlPFC and vmPFC, and the lateral orbitofrontal cortex lOFC). The outer disc represents the local mixed encoding i.e., the different proportions of contacts over time having a significant relationship between the gamma power and PE signals. In blue, is the proportion of contacts with a significant relation with the PE across rewarding trials (RPE-specific). Conversely, in red for punishment trials (PPE-specific). In purple, the proportion of contacts with a significant relationship with both the reward prediction error (RPE) and punishment prediction error (PPE). In gray, is the remaining proportion of non-significant contacts. Regarding interactions, we found that information transfer between aINS and dlPFC carried redundant information about PPE only and information transfer between vmPFC and lOFC about RPE only. This information transfer occurred with a leading role of the aINS in the punishment context and the vmPFC in the rewarding context. Finally, we found synergistic interactions between the dlPFC and the vmPFC about the full PE, without splitting into rewarding and punishing conditions.
Author response image 1

Single subject anatomical repartition.
(A) Number of unique subject per brain region and per pair of brain regions. (B) Number of bipolar derivations per subject and per brain region.
Author response image 2

Single-subject estimation of predictions errors.
Single-subject trial-wise reward PE (RPE - blue) and punishment PE (PPE - red), ± 95% confidence interval.
Author response image 3
Author response image 4

Local specificity does not fully determine the type of interactions.
Within-area local encoding of PE using the mutual information (MI, in bits) for regions X and Y and between-area interaction information (II, in bits) leading to (A) redundant interactions and (B) synergistic interactions about the PE.
Author response image 5

Single-subject estimation of predictions errors.
Single-subject trial-wise reward PE (RPE - blue) and punishment PE (PPE - red), ± 95% confidence interval.
Author response image 6

Single-subject estimation of predictions errors per pair of stimuli.
Single-subject trial-wise reward PE (RPE - blue) and punishment PE (PPE - red).
Author response image 7

MI between gamma activity and R/PPE using early and late trials.
Time courses of MI estimated between the gamma power and both RPE (blue) and PPE (red) using either early or late trials (first and second row, respectively). Horizontal thick lines represent significant clusters of information (p<0.05, cluster-based correction, non-parametric randomization across epochs).
Author response image 8

Single subject anatomical repartition.
(A) Number of unique subject per brain region and per pair of brain regions. (B) Number of bipolar derivations per subject and per brain region.
Author response image 9

Author response image 10

Inter-subjects reproducibility of redundant interactions about PE signals.
Time-courses of proportion of subjects having at least one pair of bipolar derivation with a significant interaction information (p<0.05, cluster-based correction, non-parametric randomization across epochs) about the RPE (blue) or PPE (red). Data are aligned to the outcome presentation (vertical line at 0 seconds). Proportion of subjects with redundant (solid) and synergistic (dashed) interactions are respectively going downward and upward.
Tables
Table 1
Results of the one-sample t-test performed against 0.
| T-value | p-value | p-value(FDR corrected) | dof | CI 95% | |
|---|---|---|---|---|---|
| IIPPE-RPE | 2859 | 0.007** | 0.015* | 34 | [6.5e-05, 3.9e-04] |
| IIMixed | 2841 | 0.008** | 0.015* | 33 | [5.4e-05, 3.3e-04] |
| IIPPE-PPE | 1,25 | 0.2667 | 0.3556 | 5 | [–7.1e-05, 2.1e-04] |
| IIRPE-RPE | 0733 | 0.4912 | 0.4912 | 6 | [–3.1e-05, 5.8e-05] |
Additional files
Download links
A two-part list of links to download the article, or parts of the article, in various formats.
Downloads (link to download the article as PDF)
Open citations (links to open the citations from this article in various online reference manager services)
Cite this article (links to download the citations from this article in formats compatible with various reference manager tools)
Neural interactions in the human frontal cortex dissociate reward and punishment learning
eLife 12:RP92938.
https://doi.org/10.7554/eLife.92938.3


