G protein subunit Gγ13-mediated signaling pathway is critical to the inflammation resolution and functional recovery of severely injured lungs
- College of Life Sciences, Zhejiang University, China
- Zhejiang Provincial Key Laboratory of Precision Diagnosis and Therapy for Major Gynecological Diseases, Women’s Hospital, Zhejiang University School of Medicine, China
- Institute of Genetics, Zhejiang University School of Medicine, China
- Cancer Center, Zhejiang University, China
- Institute of Immunology and Sir Run Run Shaw Hospital, Zhejiang University School of Medicine, China
- Zhejiang University Shanghai Institute for Advanced Study, Shanghai, China
- Monell Chemical Senses Center, United States
Figures
Figure 1 with 1 supplement
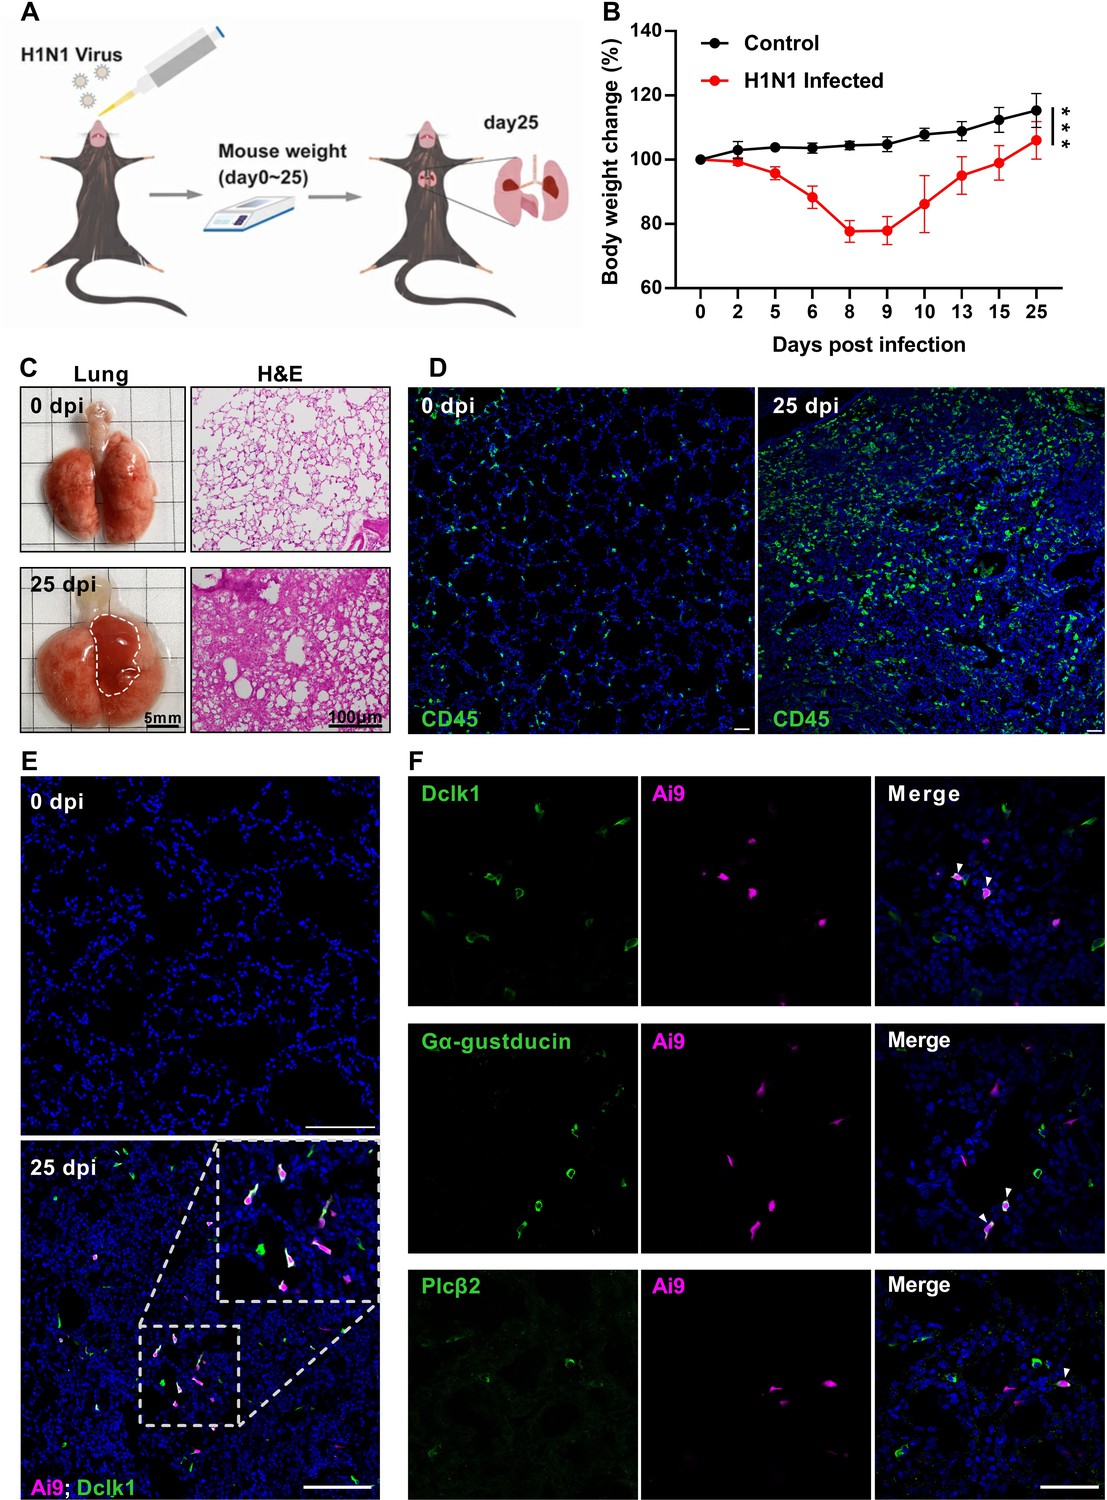
H1N1 infection causes severe damage to mouse lung.
(A) Schematic of H1N1 intranasal inoculation procedure. (B) Bodyweight changes of uninfected control and H1N1-infected mice over 25 days post infection. Data are presented as means ± SD (n=6). Unpaired two-tailed student t-tests were performed. (C) Representative images of lungs at 0 and 25 dpi, and their hematoxylin and eosin (H&E) tissue sections (Bars: 5 mm in the whole lung images and 100 µm in the lung section images). (D) Immunostaining images of lung sections of 0 and 25 dpi with an antibody to CD45. (E) Immunostaining of the Chat-Cre: Ai9 lung sections of 0 and 25 dpi with the antibody to the tuft cell marker Dclk1 (green), and Ai9 (red tdTomato). (F) Immunostaining of the Chat-Cre: Ai9 lung sections of 25 dpi with antibodies to Dclk1 (green), Gα-gustducin (green) or Plcβ2 (green) and Ai9 (red tdTomato). Scale bars in (D, E, F): 50 µm. ***p<0.001.
-
Figure 1—source data 1
Mouse bodyweight loss following H1N1 infection.
- https://cdn.elifesciences.org/articles/92956/elife-92956-fig1-data1-v1.xlsx
Figure 1—figure supplement 1
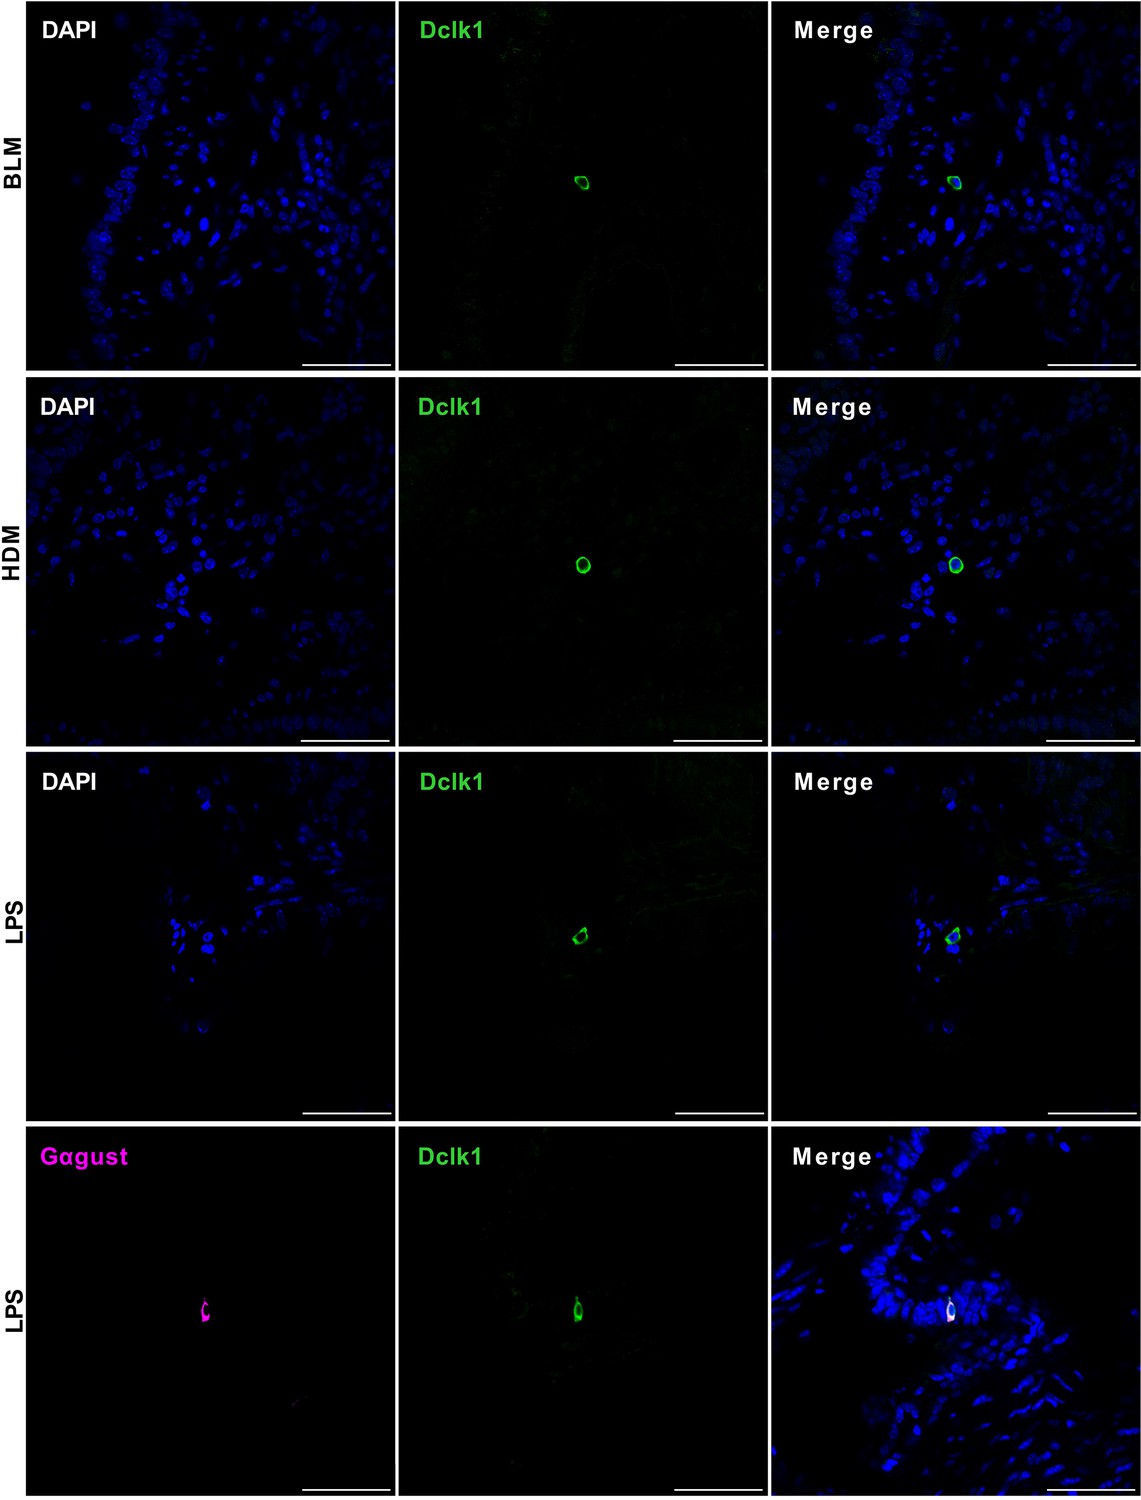
Chemically induced severe injury also engenders ectopic formation of lung tuft cells.
Top three rows: Immunostaining with an antibody to Dclk1 (green) on the tissue sections of the injured lungs induced by bleomycin (BLM), extract of house dust mite (HDM), or lipopolysaccharides (LPS), respectively. Bottom row: double-immunostaining an LPS-injured lung section with antibodies to Dclk1 and Gαgust (Gα-gustducin). Scale bars: 50 μm.
Figure 2 with 2 supplements
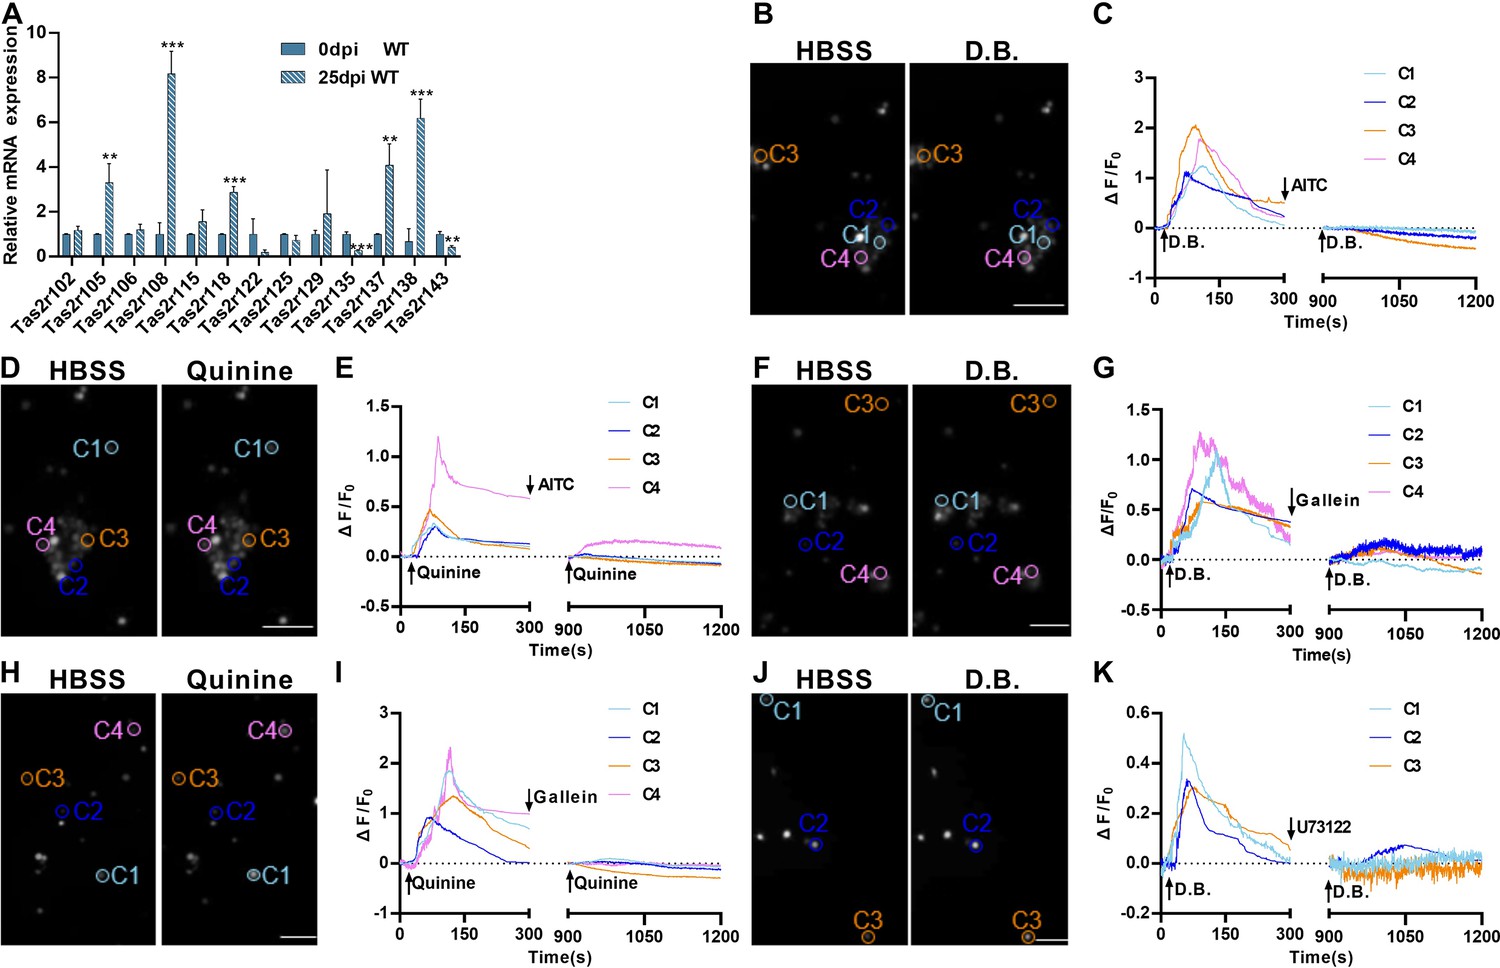
Expression and functional responses of bitter taste receptors.
(A) Quantitative RT-PCR analysis of bitter taste receptor expression in the lung tissues at 0 dpi versus 25 dpi. Expression of Tas2r105, Tas2r108, Tas2r118, Tas2r137, and Tas2r138 was upregulated whereas Tas2r135 and Tas2r143 were downregulated at 25 dpi. Data are presented as means ± SD (n=3). Unpaired two-tailed student t-tests were performed. (B–K) Calcium imaging and response traces of FACs-sorted tuft cells isolated from H1N1-infected lungs at 25 dpi. (B, D, F, H, and J) Left panels are gray images of tuft cells at rest in the HBSS buffer whereas the right panels are gray images of the same cells after being stimulated by denatonium benzoate (D.B.) or quinine. Activated cells appeared brighter. (C, E, G, I, K) traces of calcium responses of tuft cells on the left. Some tuft cells responded to D.B, which was inhibited by allyl isothiocyanate (AITC) (B, C), gallein (F, G), or U73122 (J, K) whereas others responded to quinine, which was also inhibited by AITC (D, E), or gallein (H, I). Scale bars: 50 µm. **p<0.01, ***p<0.001.
-
Figure 2—source data 1
Tas2r expression in the lungs and intracellular calcium responses of tuft cells to bitter substances.
- https://cdn.elifesciences.org/articles/92956/elife-92956-fig2-data1-v1.xlsx
Figure 2—figure supplement 1
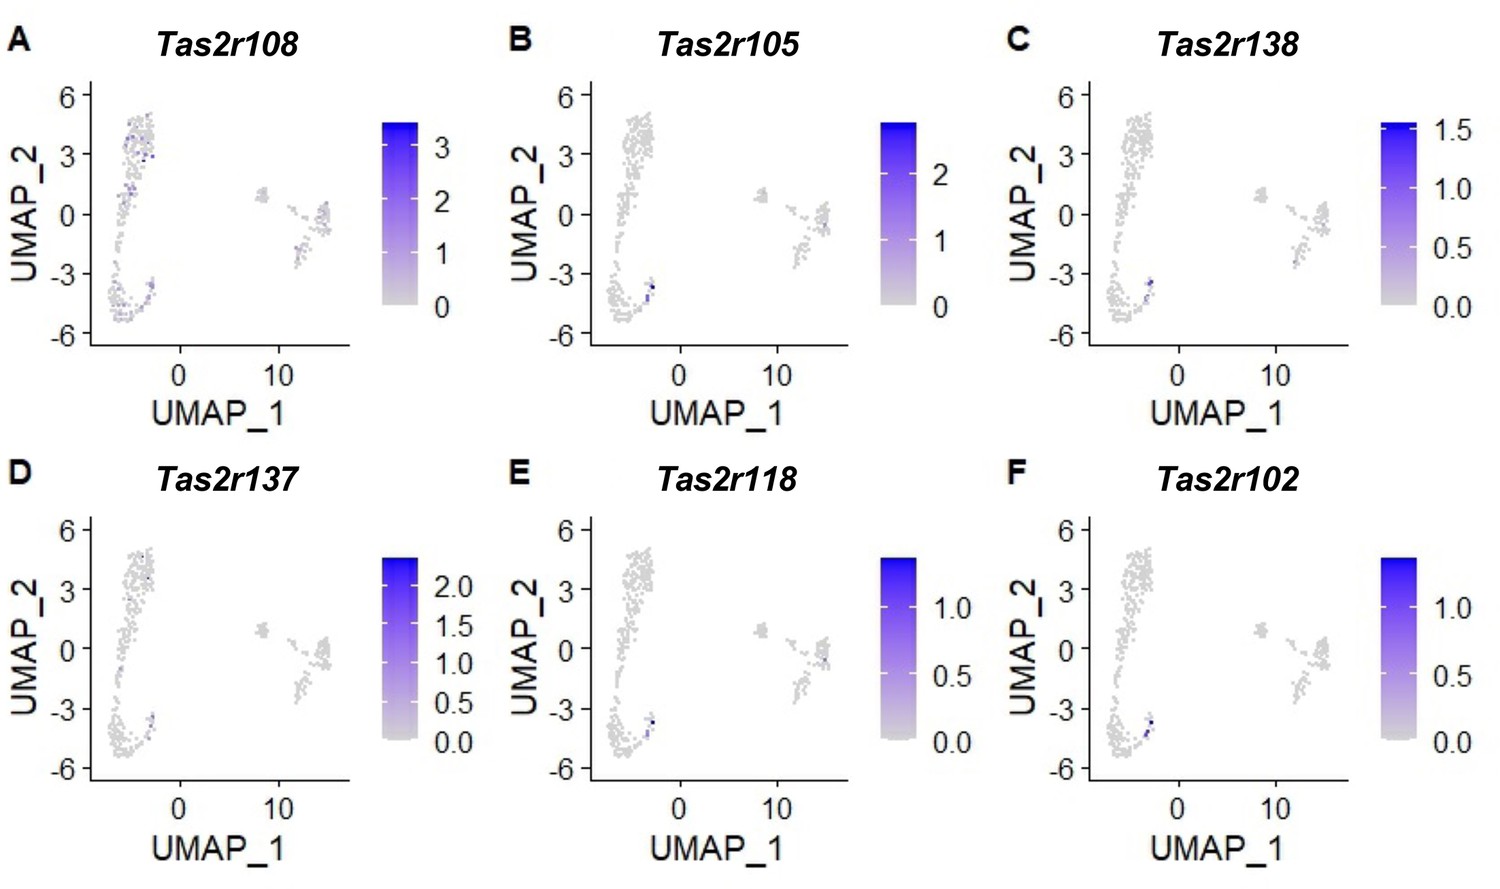
Expression of bitter taste receptors in tuft cell clusters.
Reanalysis of the single-cell RNA sequencing data GSE197163 (Barr et al., 2022) using the Uniform manifold approximation and projection (UMAP) method. Among 613 Trpm5-GFP+ tuft cells, Tas2r108 was expressed in the greatest number of cells, i.e., 67 cells, followed by Tas2r105, Tas2R138, Tas2r137, Tas2r118, and Tas2r102, which were detected in 11,10, 10, 5 and 4 cells, respectively. The clustering analysis results also indicate that different cells may express a different subset of Tas2rs.
Figure 2—figure supplement 2
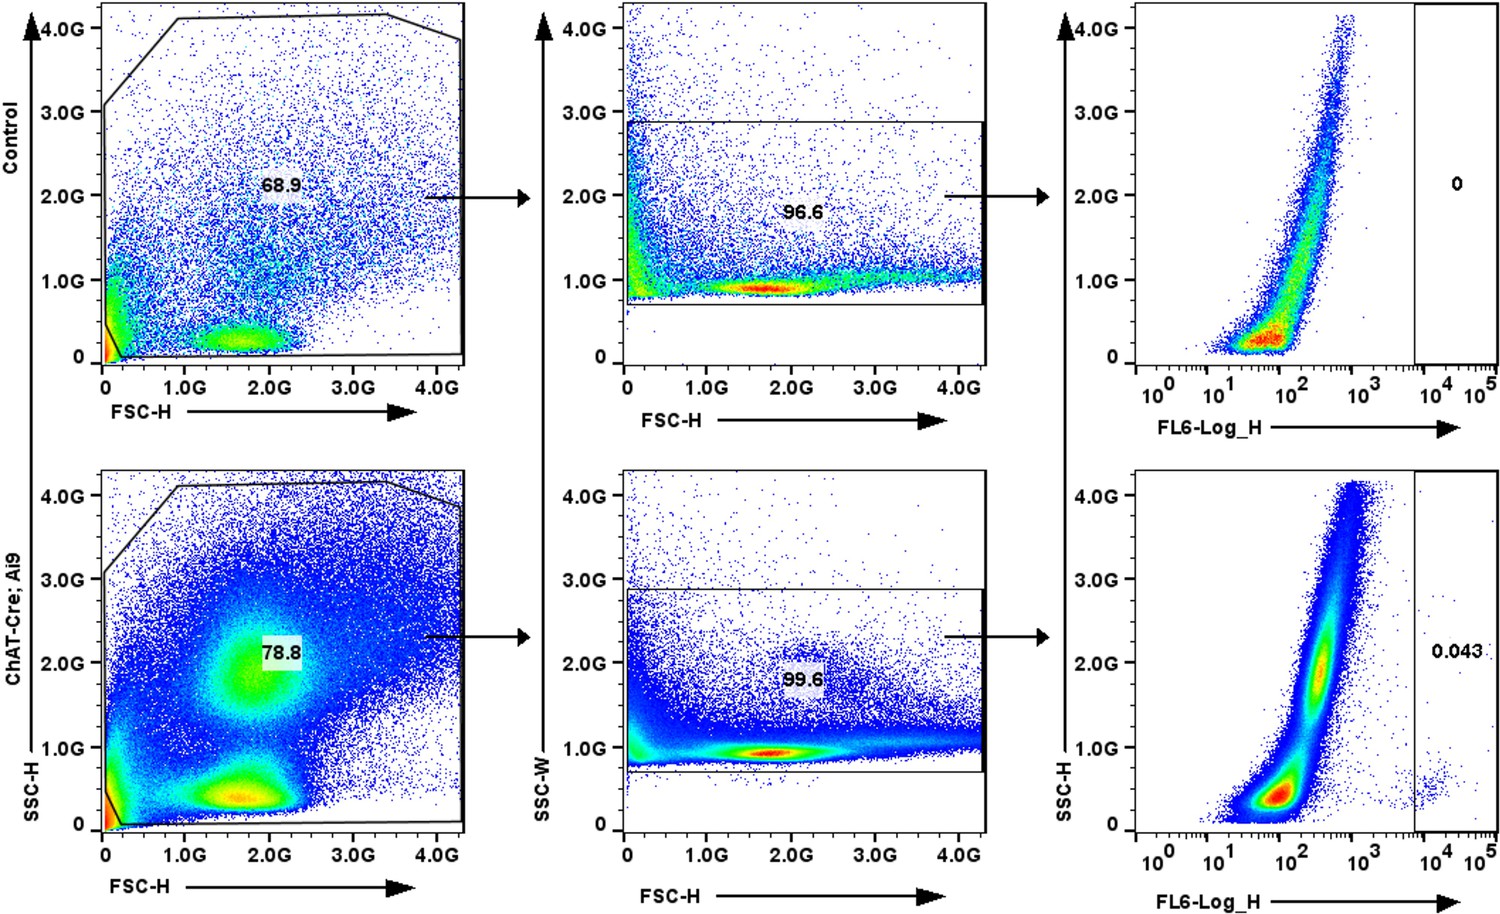
Fluorescence-activated cell sorting (FACs) sorting of ectopic tuft cells.
ChAT-tdTomato reporter expression in live lung epithelial cells post-influenza via FACs.
Figure 3 with 2 supplements
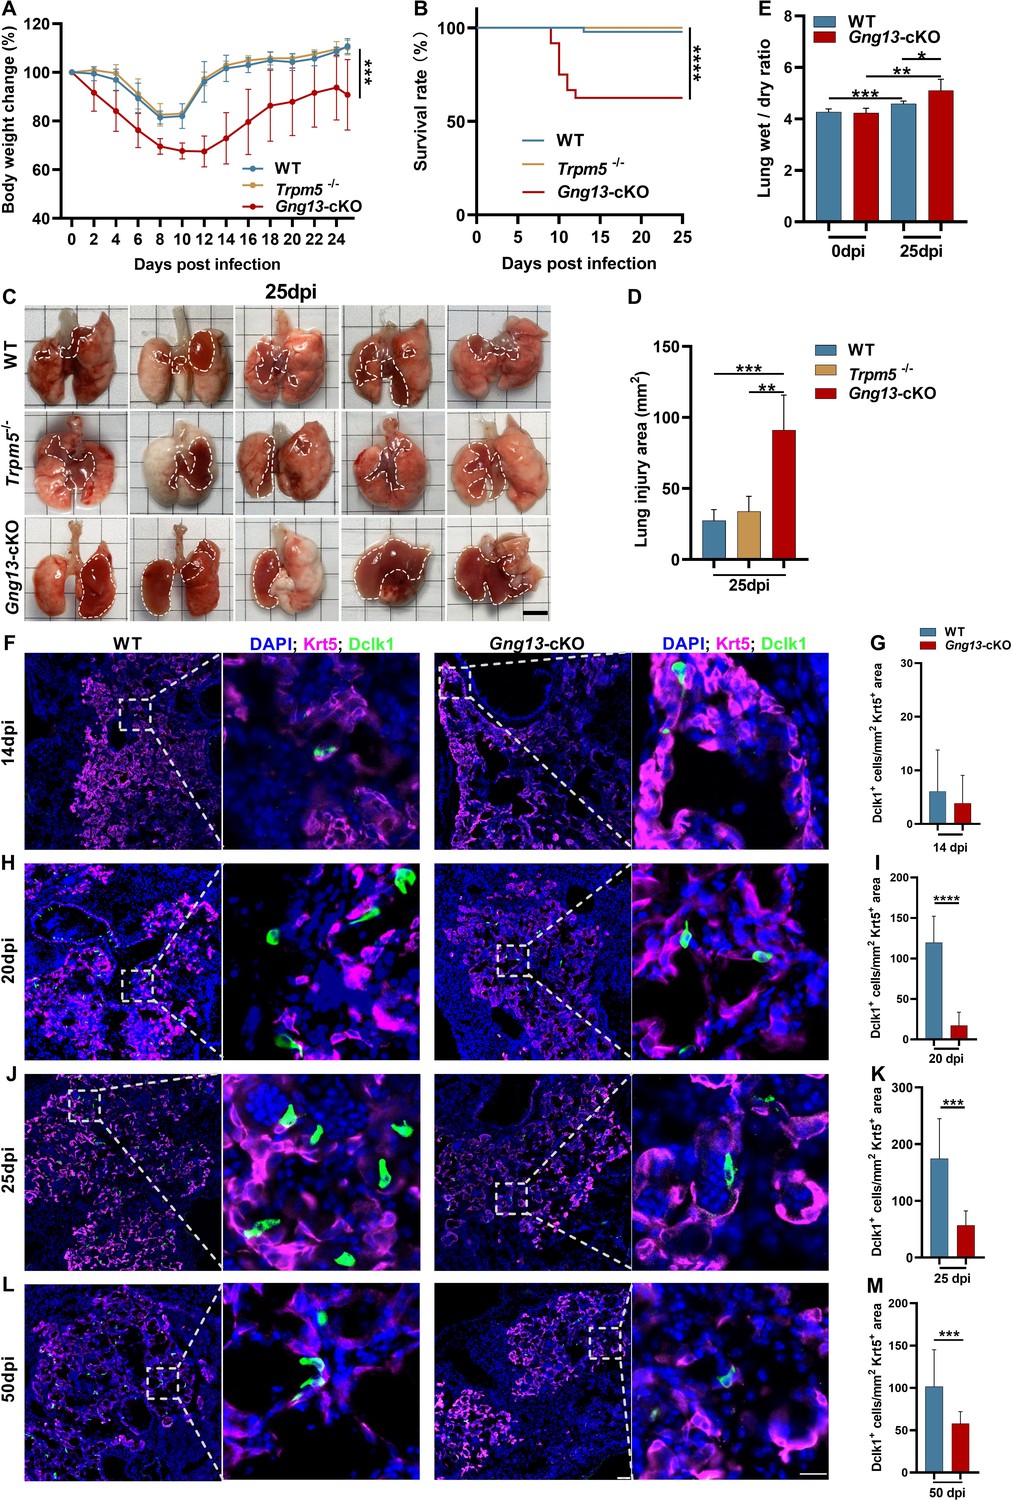
H1N1 infection inflicts differential lung injury and tuft cell dysplasia on wild-type (WT) versus mutant mice.
(A) Gng13-cKO mice showed greater bodyweight loss than WT or Trpm5-/- mice over days post-infection. Data are presented as means ± SD (n=6). Unpaired two-tailed t-tests were performed. (B) Kaplan-Meier survival curves of WT, Trpm5-/- and Gng13-cKO mice following H1N1 inoculation. A significant number of Gng13-cKO mice died between 9 and 12 dpi (i.e., 2, 4, 2 mice, and 1 mouse died at 9, 10, 11, 12 dpi, respectively), reducing the overall survival rate to 62.5%, significantly lower than those of Trpm5-/- or WT mice, of which nearly all survived. Data are presented as means ± SEM (n=44, 17 and 14 for WT, Trpm5-/-, and Gng13-cKO mice, respectively). The curves were determined by a log-rank test. (C, D) Images and statistical analysis of the injured areas on the lungs of WT, Trpm5-/-, and Gng13-cKO mice at 25 dpi. The injured areas that are marked by dashed lines were significantly greater in the Gng13-cKO mice than in Trpm5-/- or WT mice while no significant difference was found between the latter two. Data are presented as means ± SD (n=5), and unpaired two-tailed student t-tests were performed. Scale bar: 5 mm. (E) Comparative analysis of wet-to-dry weight ratios of WT and Gng13-cKO lungs at 0 and 25 dpi. While no difference in the ratio was found between WT and Gng13-cKO mice at 0 dpi, the ratios of these mice at 25 dpi were significantly greater than their corresponding ones at 0 dpi. However, the Gng13-cKO ratio was even greater than the WT ratio at 25 dpi. Data are presented as means ± SD (n=6), and unpaired two-tailed student t-tests were performed. (F–M) Identification of tuft cells in the Krt5-expressing tissue areas of H1N1-injured lungs of WT and Gng13-cKO mice at 14, 20, 25, and 50 dpi using antibodies to Krt5 and to the tuft cell marker Dclk1. The densities of tuft cells were significantly higher in WT than in Gng13-cKO lungs at 20, 25, and 50 dpi, but not at an earlier time point of 14 dpi. Data are presented as means ± SD (n=3), and unpaired two-tailed student t-tests were performed. Scale bars in (L): 50 µm and 15 µm. *p<0.05, **p<0.01, ***p<0.001, ****p<0.0001.
-
Figure 3—source data 1
Bodyweight changes, survival rates, lung injury areas and volumes, lung wet/dry ratios, and the number of tuft cells in the injured areas of WT, Trpm5-/-, and Gng13-cKO mice.
- https://cdn.elifesciences.org/articles/92956/elife-92956-fig3-data1-v1.xlsx
Figure 3—figure supplement 1
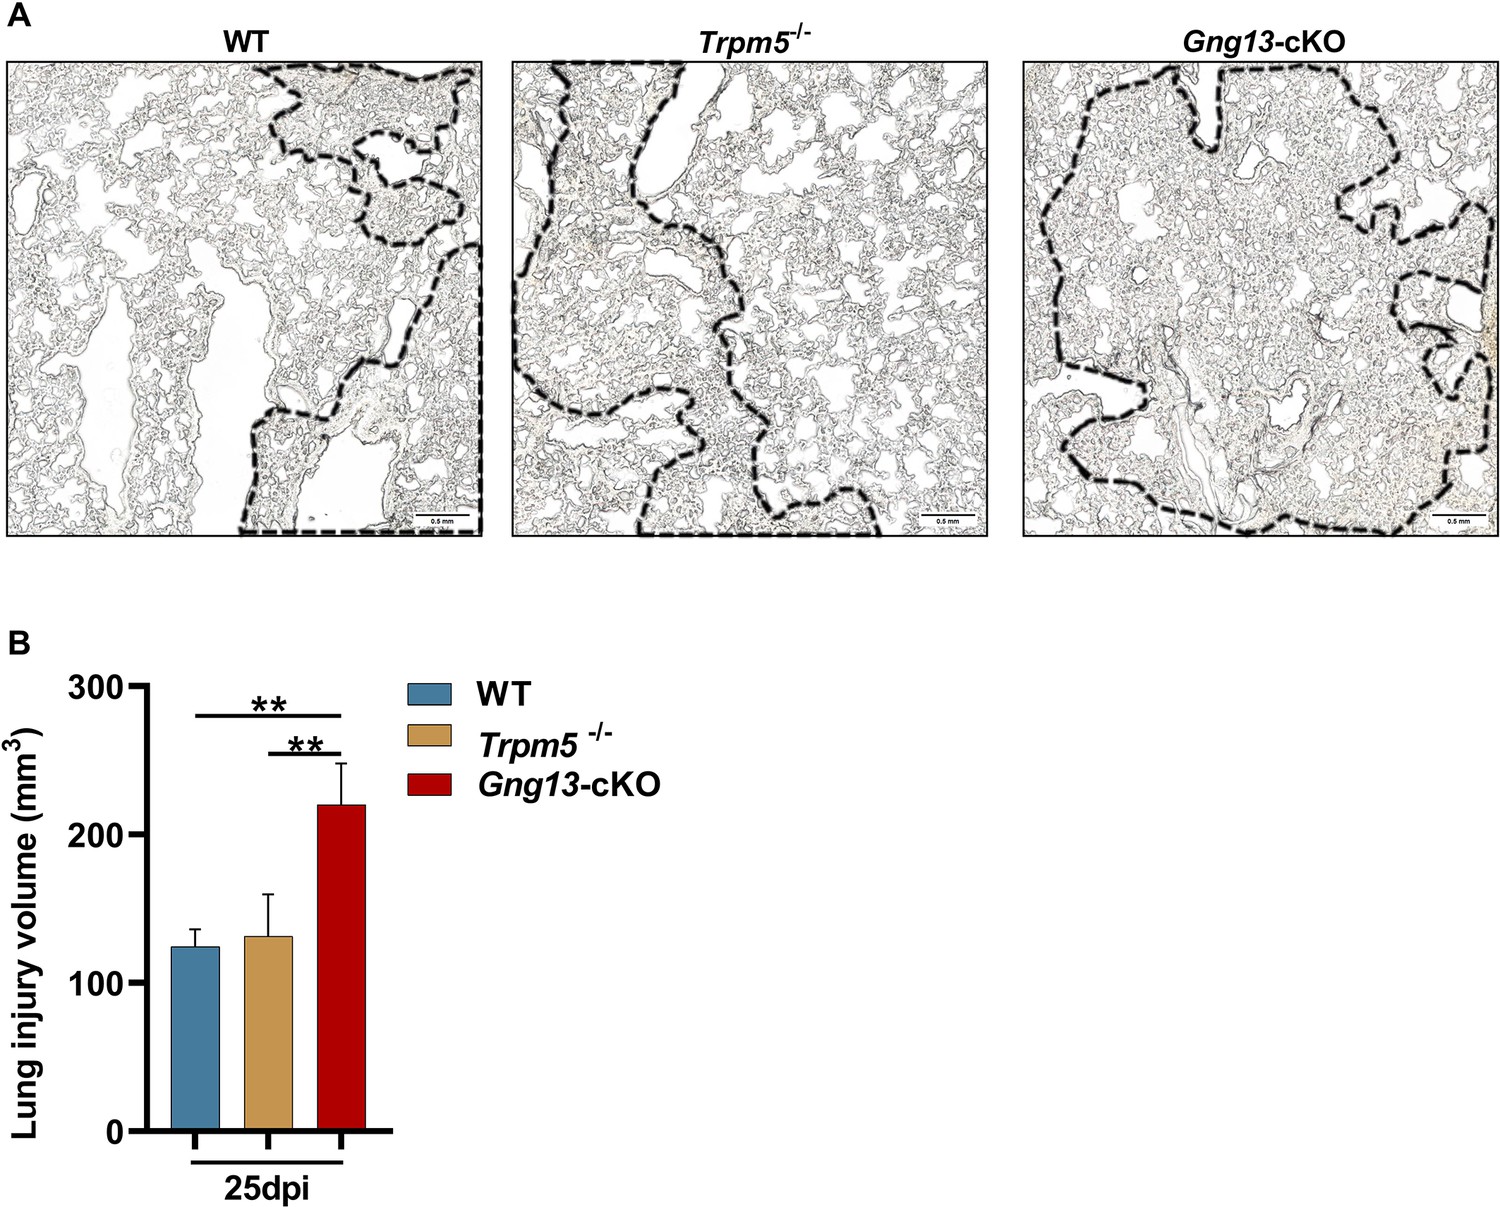
Statistical analysis of the injured tissue volumes on the lungs of wild-type (WT), Trpm5-/-, and Gng13-cKO mice at 25 dpi.
(A) Sections of WT, Trpm5-/-, and Gng13-cKO mice at 25 dpi. Areas inside the dotted lines were determined as the severely damaged area. Scale bars: 0.5 mm. (B) Statistical analysis of the injured tissue volumes on the lungs of WT, Trpm5-/-, and Gng13-cKO mice at 25 dpi. The thickness of each section was 12 μm, and the area of lung injury in each section was determined using imageJ. The volume of the lung injury in each section was the area of the lung injury area multiplied by the section thickness. Each section of lung tissue was collected, and the sum of the lung injury volumes of all sections was the final volume for the whole lung. Data are presented as means ± SD (n=3), and unpaired two-tailed student t-tests were performed. **p<0.01.
-
Figure 3—figure supplement 1—source data 1
Lung injury volumes of wild-type (WT), Trpm5-/-, and Gng13-cKO mice.
- https://cdn.elifesciences.org/articles/92956/elife-92956-fig3-figsupp1-data1-v1.xlsx
Figure 3—figure supplement 2
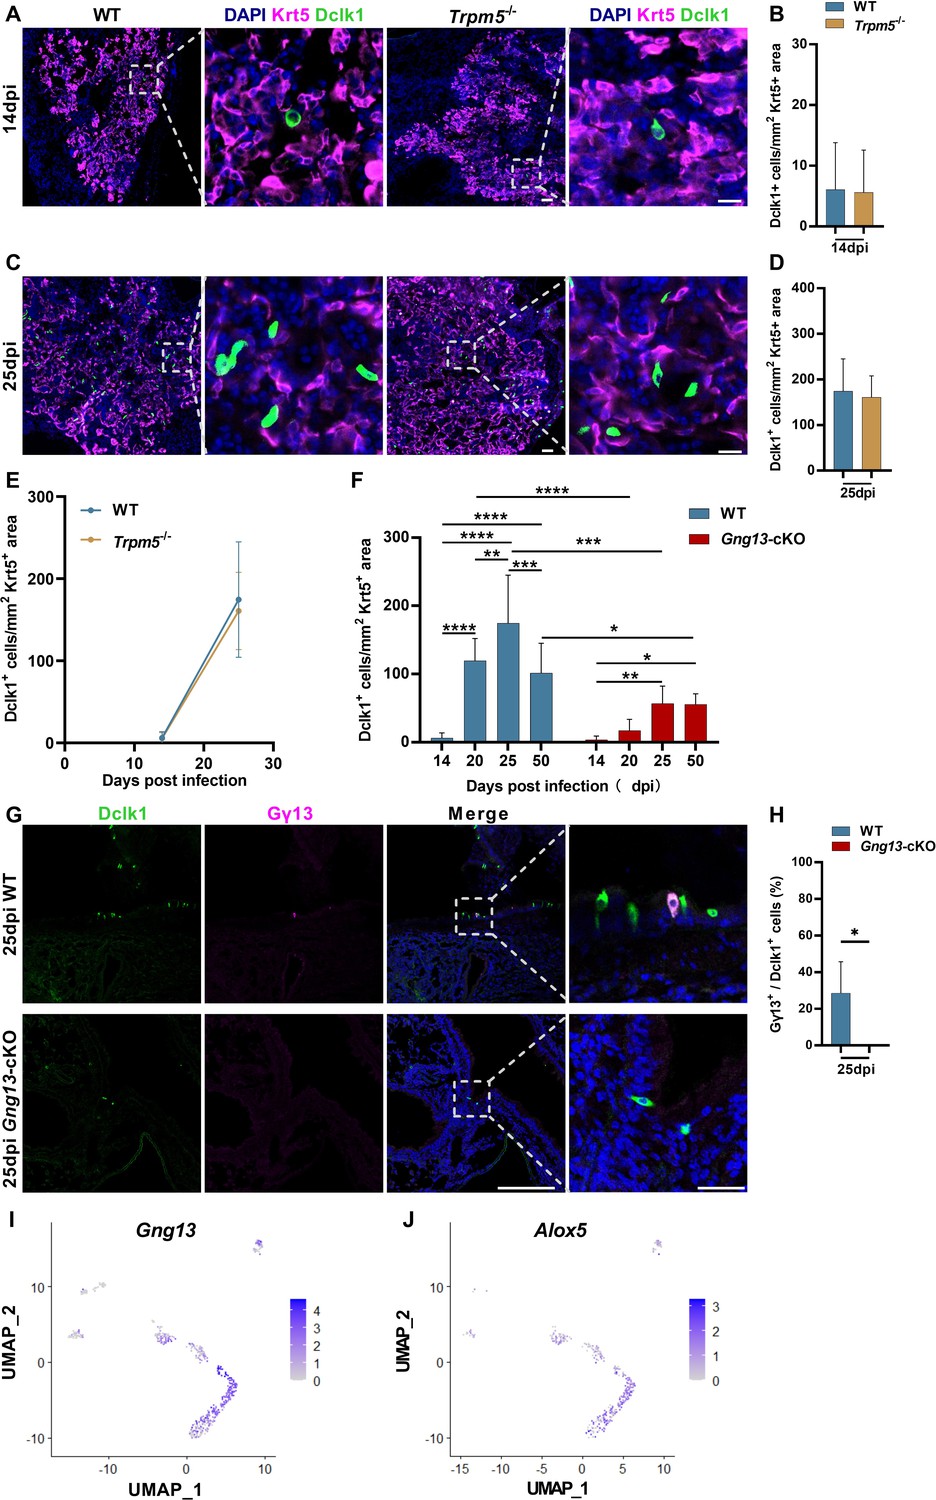
Ectopic generation of tuft cells in wild-type (WT), Trpm5-/-, and Gng13-cKO mice over days post H1N1 infection.
(A, B, C, D, E) Immunostaining and quantitative analyses of the abundance of Dclk1+ tuft cells in the Krt5+ regions of the injured lung tissues at 14 and 25 dpi, respectively. Data are presented as means ± SD (n=3), and unpaired two-tailed student t-tests were performed. Scale bars in (A, C): 50 µm. (F) Comparative analysis of Dclk1+ tuft cell numbers in the Krt5+ regions of WT versus Gng13-cKO over days post-infection. Data are presented as means ± SD (n=3), and unpaired two-tailed student t-tests were performed. (G,H) Double immunostaining of lung tissue sections of 25 dpi with antibodies to Dclk1 and Gγ13 shows a subset of Dclk1+ tuft cells expressing Gγ13 in WT but not in Gng13-cKO mice. Data are presented as means ± SD (n=3), and unpaired two-tailed student t-tests were performed. Scale bars: 50 µm and 15 µm. (I) Uniform manifold approximation and projection (UMAP) analyses of the single-cell RNAseq dataset GSE197163 (Barr et al., 2022) indicate that out of 613 Trpm5-GFP+ tuft cells, 350, i.e., 57% of them, expressed Gγ13. (J) UMAP analyses of the single-cell RNAseq dataset GSE197163 (Barr et al., 2022) indicate that out of 350 Gγ13+ tuft cells, 277, i.e., 79% of them expressed Alox5. *p<0.05, **p<0.01, ***p<0.001, ****p<0.0001.
-
Figure 3—figure supplement 2—source data 1
The numbers of tuft cells in the injured areas of WT, Trpm5 and Gng13-cKO mice, and gene expression analyses of a single tuft cell RNAseq dataset.
- https://cdn.elifesciences.org/articles/92956/elife-92956-fig3-figsupp2-data1-v1.xlsx
Figure 4 with 1 supplement
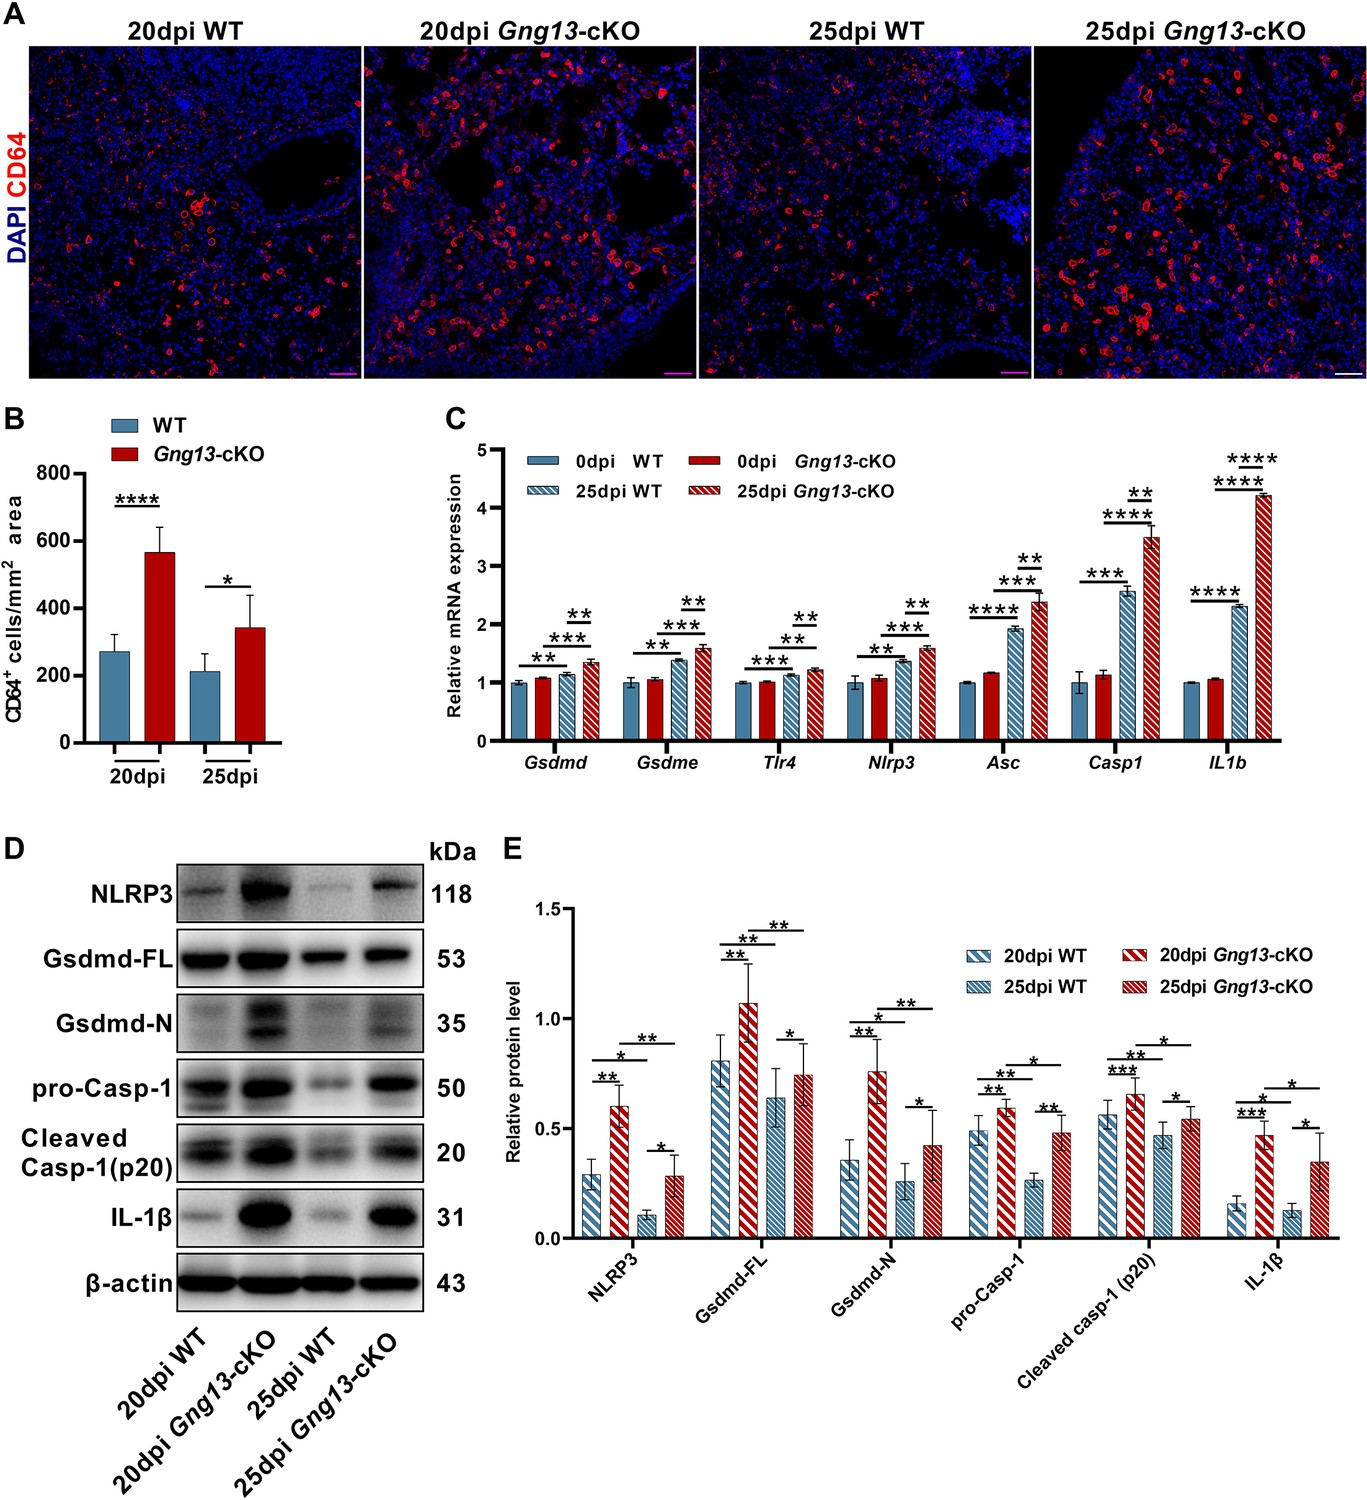
Stronger inflammatory response and upregulated expression of pyroptotic genes in the H1N1-infected Gng13-cKO lungs.
(A, B) Immunostaining of wild-type (WT) and Gng13-cKO lung tissue sections with an antibody to the immune cell marker CD64 indicates significantly more immune cells in the mutant lung than in WT at both 20 and 25 dpi. Scale bar: 50 µm. Data are presented as means ± SD (n=3), and unpaired two-tailed student t tests were performed. (C) qRT-PCR indicates that expression levels of gasdermin D and E (Gsdmd, Gsdme) and other proteins of the pyroptosis pathway: Tlr4, Nlpr3, Asc, Casp1, and Il1b were significantly upregulated in both WT and Gng13-cKO lungs at 25 dpi compared with those at 0 dpi. Furthermore, the expression levels of these genes in Gng13-cKO were significantly higher than in WT at 25 dpi. Data are presented as means ± SD (n=3). Unpaired two-tailed student t-tests were performed. (D, E) Western blot analysis shows that the protein levels of NLRP3, full-length Gasdermin D (Gsdmd-FL), N-terminal fragment of Gasdermin D (Gsdmd-N), pro-caspase 1 (pro-Casp1), cleaved caspase 1 (Cleaved Casp-1 (p20)), and IL-1β in the Gng13-cKO lungs were significantly higher than the corresponding levels of WT at both 20 and 25 dpi (β-actin as an internal control). And over this phase, the expression levels of these proteins were reduced at 25 dpi in comparison with those at 20 dpi in both genotypes. Data are presented as means ± SD (n=4), and unpaired two-tailed t-tests were performed. *p<0.05, **p<0.01, ***p<0.001, ****p<0.0001.
-
Figure 4—source data 1
CD64+ cell densities and pyroptosis-related gene expression in the control and injured lungs of wild-type(WT) and Gng13-cKO mice.
- https://cdn.elifesciences.org/articles/92956/elife-92956-fig4-data1-v1.xlsx
-
Figure 4—source data 2
Original file for the protein expression levels of pyroptotic genes in wild-type (WT) and Gng13-cKO mice.
- https://cdn.elifesciences.org/articles/92956/elife-92956-fig4-data2-v1.zip
-
Figure 4—source data 3
Labeled file for the protein expression levels of pyroptotic genes in wild-type (WT) and Gng13-cKO mice.
- https://cdn.elifesciences.org/articles/92956/elife-92956-fig4-data3-v1.zip
Figure 4—figure supplement 1
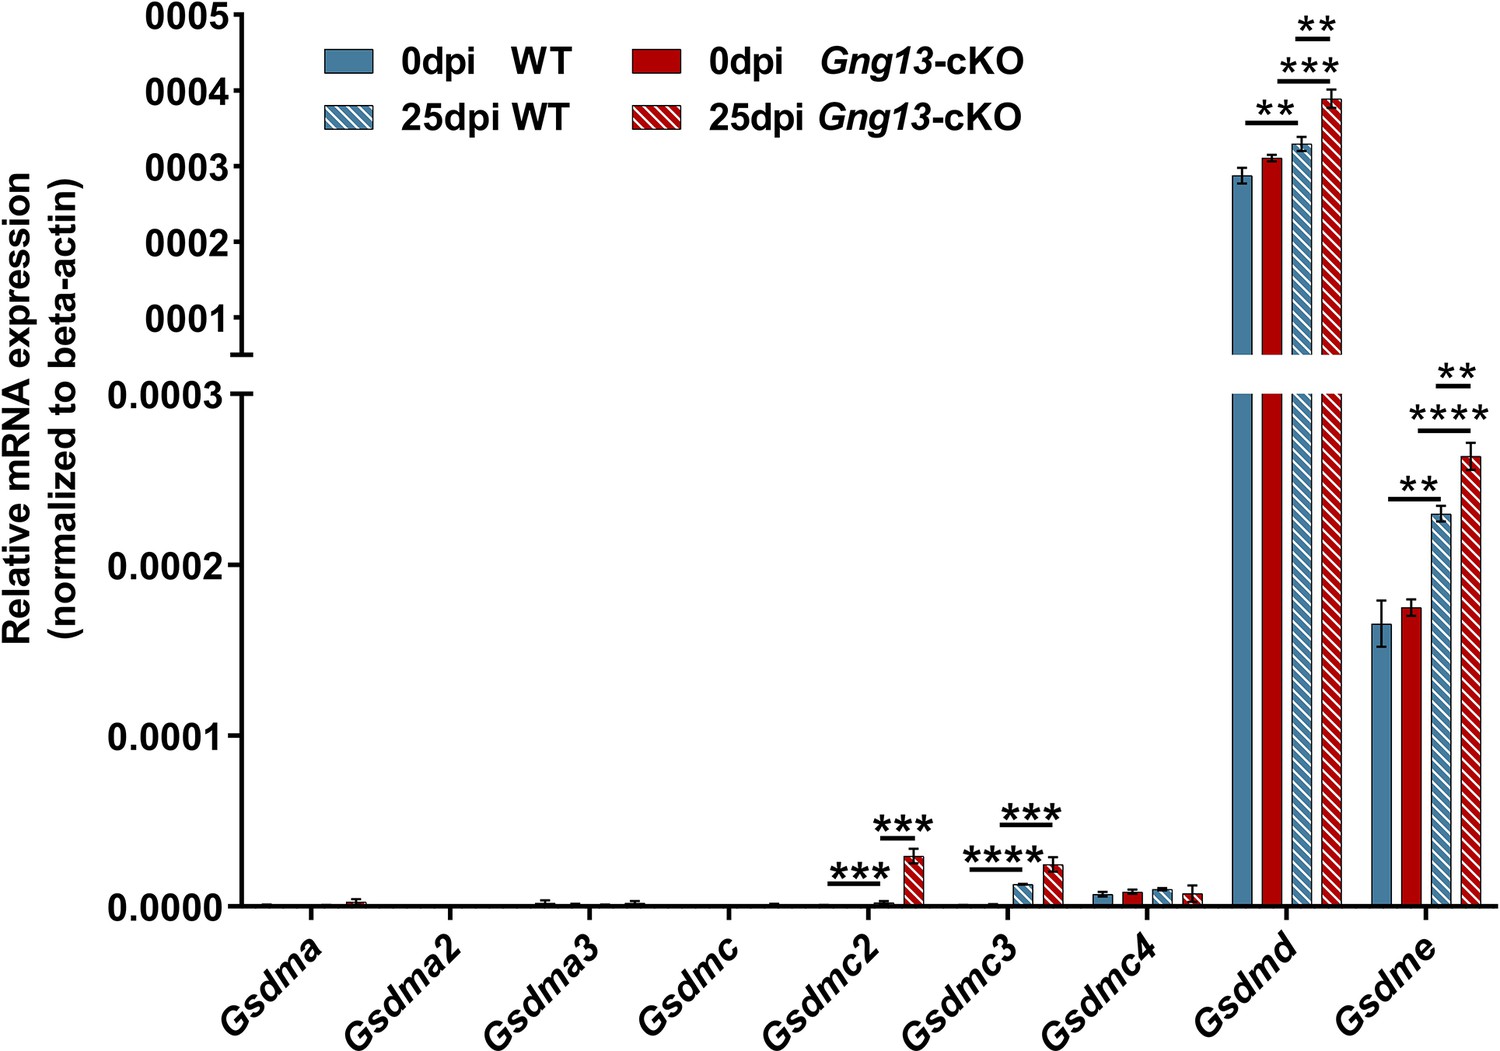
Quantitative reverse transcription-PCR (qRT-PCR) analysis of gasdermin gene expression in wild-type (WT) and Gng13-cKO lungs.
Quantitative RT-PCR analysis of gasdermin gene expression in the lung tissues at 0 and 25 dpi in WT and Gng13-cKO. Data are presented as means ± SD (n=3). Unpaired two-tailed student t tests were performed. **p<0.01, ***p<0.001, ****p<0.0001.
-
Figure 4—figure supplement 1—source data 1
Pyroptosis-related gene expression in the control and injured lungs of wild-type (WT) and Gng13-cKO mice.
- https://cdn.elifesciences.org/articles/92956/elife-92956-fig4-figsupp1-data1-v1.xlsx
Figure 5 with 2 supplements
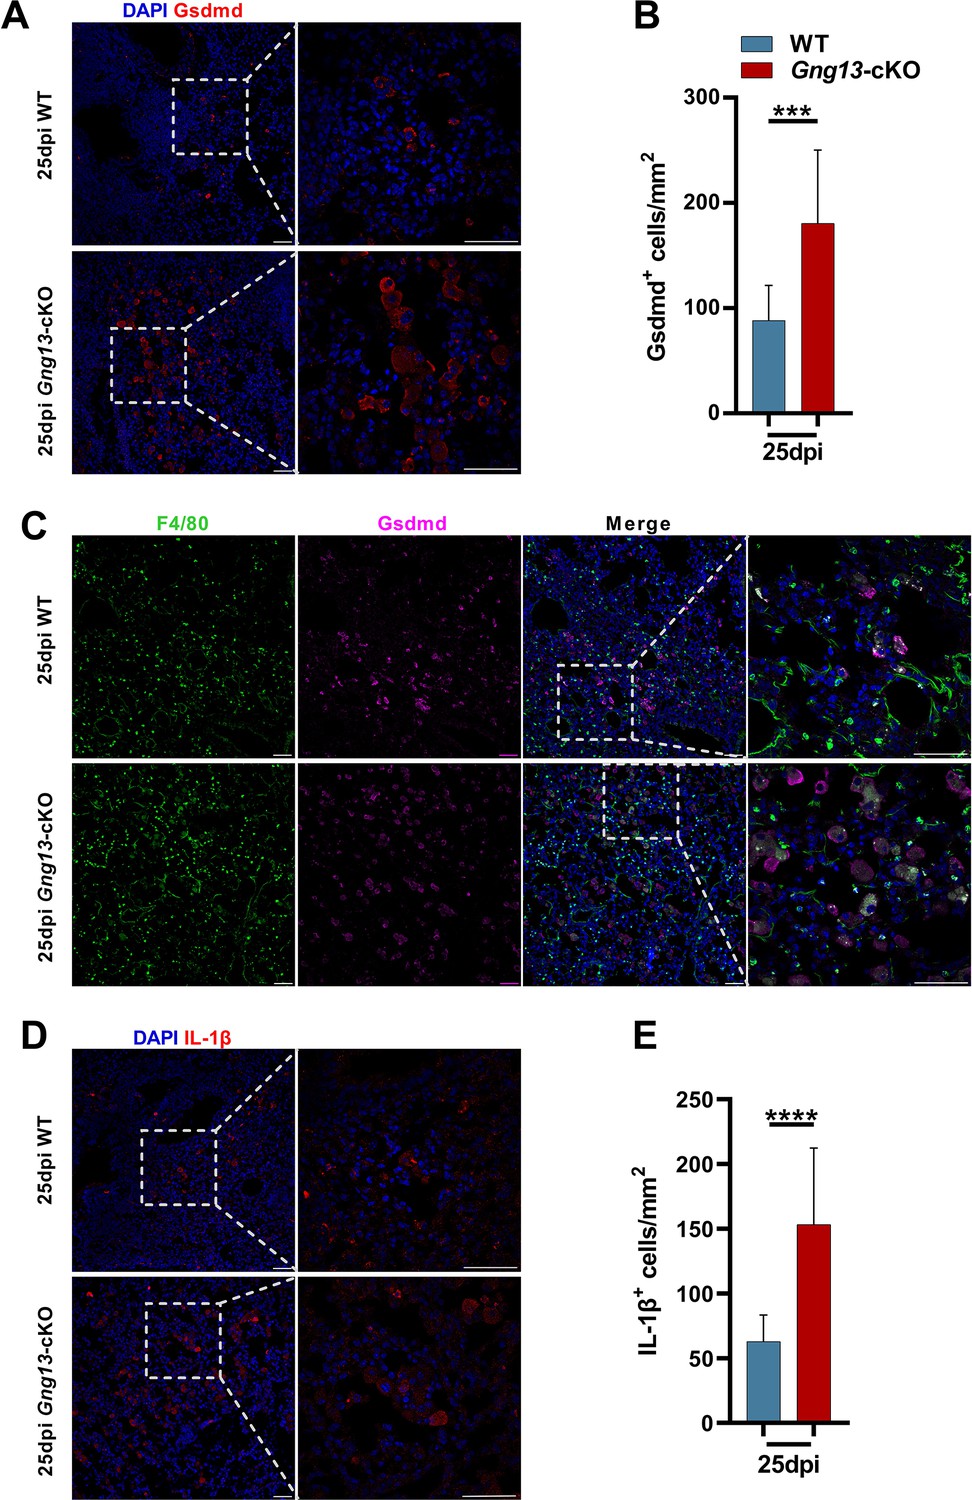
Immunohistochemical analyses of gasdermin D and IL-1β expressing cells.
(A, B) Immunostaining of H1N1-infected lung sections antibody to gasdermin D (Gsdmd) indicates significantly more gasdermin D-expressing cells in the Gng13-cKO sections than in wild-type (WT). Data are presented as means ± SD (n=3), and unpaired two-tailed student t-tests were performed. (C) Co-immunostaining shows that nearly the same percentage, i.e., 98.5% and 95.5% of Gsdmd+ cells in WT and Gng13-cKO, respectively, were F4/80+. (D) Immunostaining of H1N1-infected lung sections at 25 dpi with an antibody to IL-1β indicate significantly more IL-1β-expressing cells in the Gng13-cKO sections than in WT. Data are presented as means ± SD (n=4), and unpaired two-tailed t-tests were performed. Scale bars: 50 µm. ***p<0.001, ****p<0.0001.
-
Figure 5—source data 1
The densities of Gsdmd+, IL-1β+ cells in the injured lung tissues of wild-type (WT) and Gng13-cKO mice.
- https://cdn.elifesciences.org/articles/92956/elife-92956-fig5-data1-v1.xlsx
Figure 5—figure supplement 1
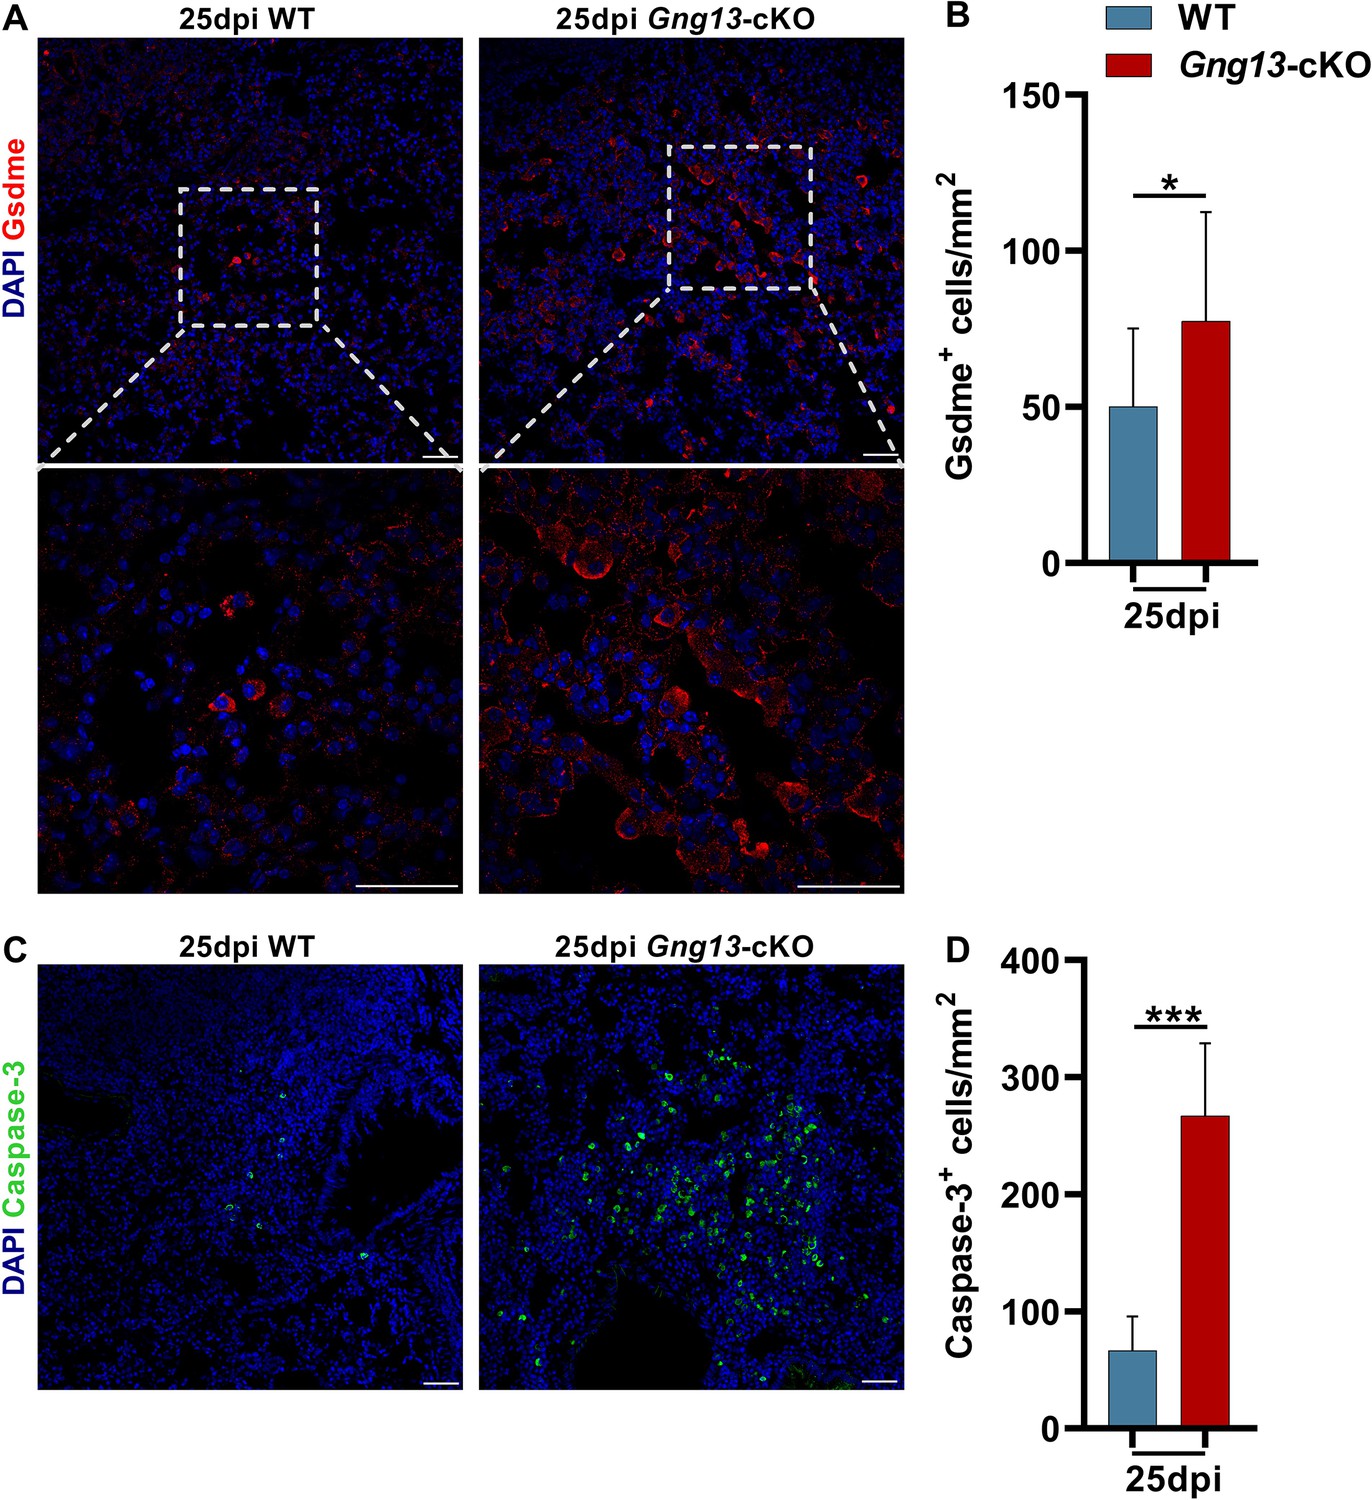
Expression of gasdermin E and caspase 3 in the H1N1-injured lungs.
(A, B) Immunostaining of WT and Gng13-cKO lung tissue sections with anti-Gsdme in WT and Gng13-cKO at 25 dpi. Data are presented as means ± SD (n=3). Unpaired two-tailed student t tests were performed. (C, D) Immunostaining of WT and Gng13-cKO lung tissue sections with anti-Caspase-3 in WT and Gng13-cKO at 25 dpi. Data are presented as means ± SD (n=3). Unpaired two-tailed student t tests were performed. Scale bars: 50 μm. *p<0.05, ***p<0.001.
-
Figure 5—figure supplement 1—source data 1
The densities of gasdermin E (Gsdme) and Caspase-3+ cells in the injured lung tissues of wild-type (WT) and Gng13-cKO mice.
- https://cdn.elifesciences.org/articles/92956/elife-92956-fig5-figsupp1-data1-v1.xlsx
Figure 5—figure supplement 2
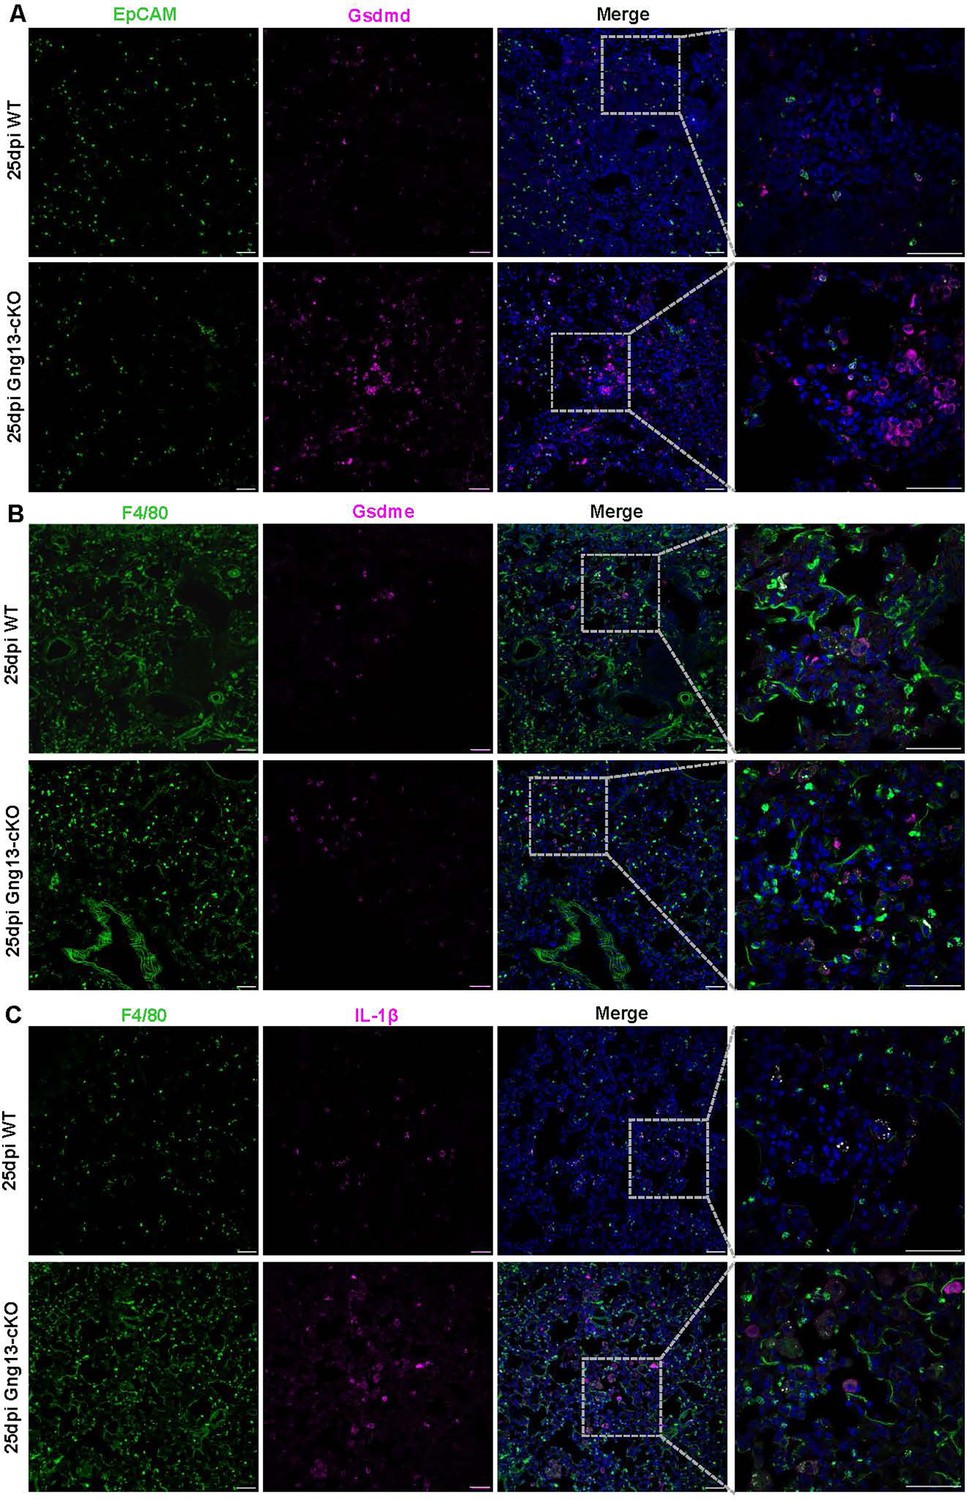
Partial colocalization of gasdermin D, E, and IL-1β to epithelial cells and macrophages.
(A) Immunostaining of WT and Gng13-cKO lung tissue sections with anti-EpCAM and anti-Gsdmd in WT and Gng13-cKO at 25 dpi. (B) Immunostaining of WT and Gng13-cKO lung tissue sections with anti-F4/80 and anti-Gsdme in WT and Gng13-cKO at 25 dpi. (C) Immunostaining of WT and Gng13-cKO lung tissue sections with anti-F4/80 and anti-IL-1β in WT and Gng13-cKO at 25 dpi. Scale bars: 50 μm.
Figure 6
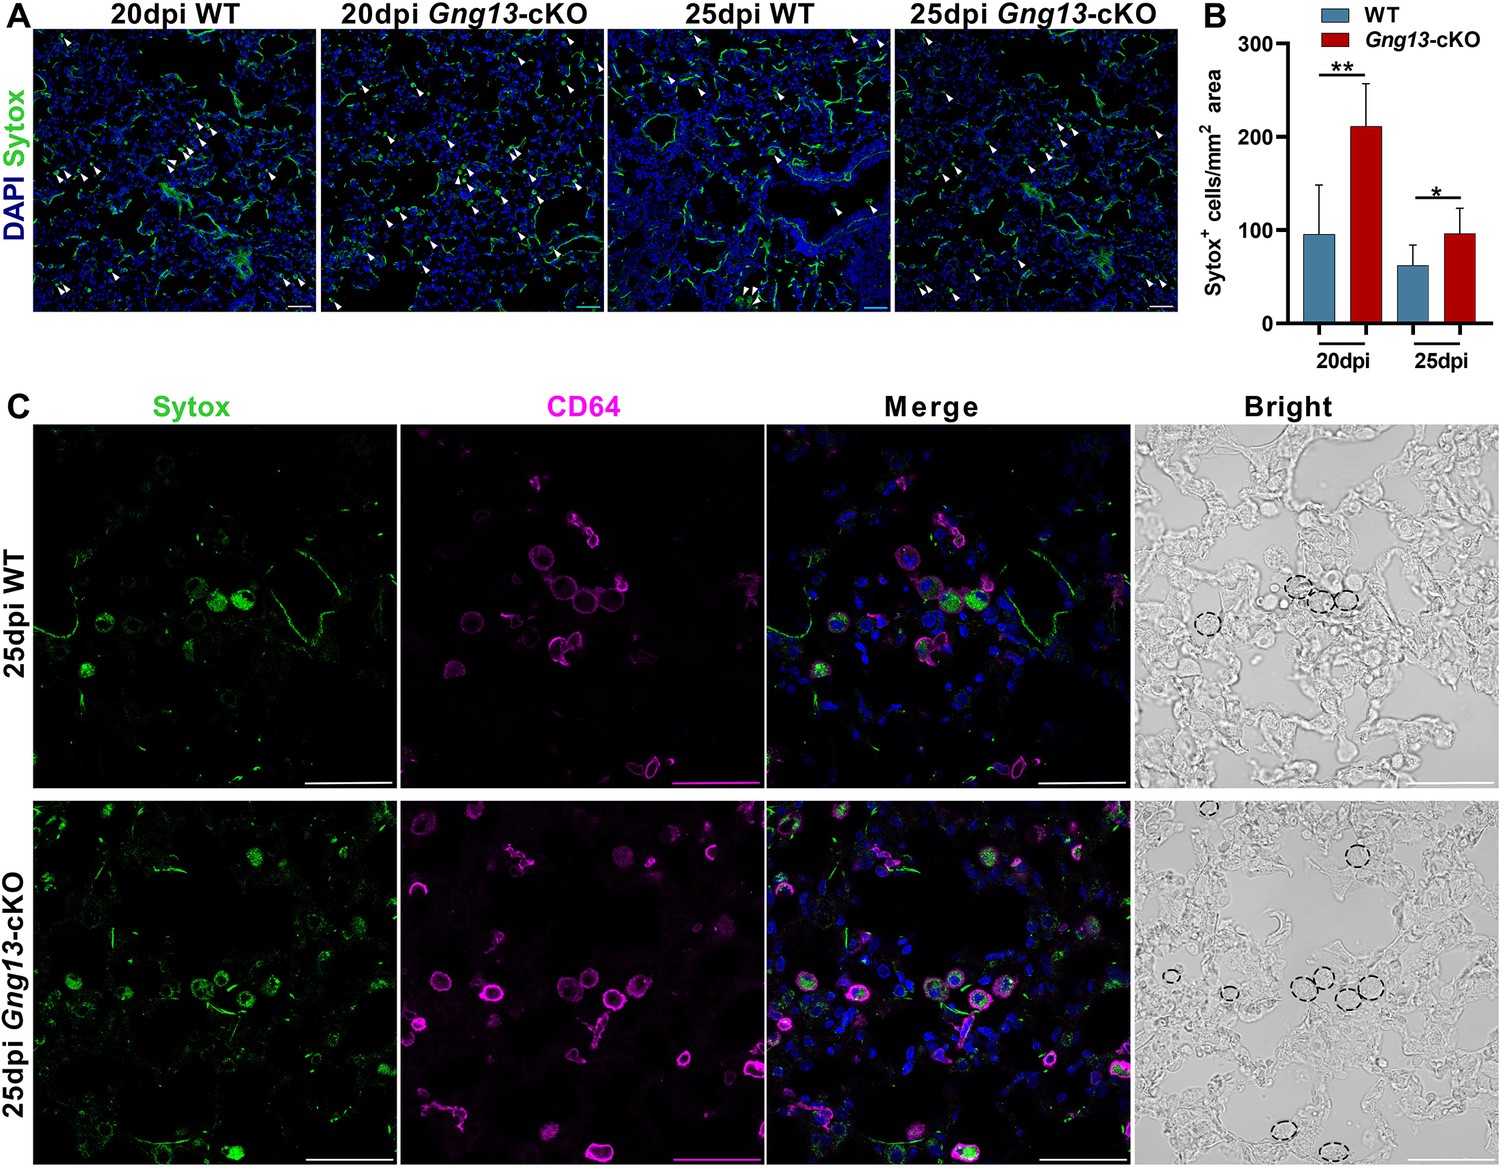
Gng13 conditional nullification leads to more pyroptotic cells in the injured lungs.
(A, B) Histological analysis of lung tissue sections following Sytox administration reveals that significantly more Sytox+ cells were found in the mutant lung sections than the corresponding wild-type (WT) tissues at both 20 and 25 dpi while in both types of mice the numbers of the Sytox+ cells at 25 dpi seemed to be fewer than that at 20 dpi. (C) Immunostaining with an antibody to the macrophage marker CD64 indicates that most of the Sytox+ cells were macrophages in both WT and Gng13-cKO mice (circled by dashed lines in the bright field images on the far right). Data are presented as means ± SD (n=3), and unpaired two-tailed student t-tests were performed. Scale bars: 50 µm. *p<0.05, **p<0.01.
-
Figure 6—source data 1
Sytox+ cell densities in the injured lung tissues of wild-type (WT) and Gng13-cKO mice.
- https://cdn.elifesciences.org/articles/92956/elife-92956-fig6-data1-v1.xlsx
Figure 7
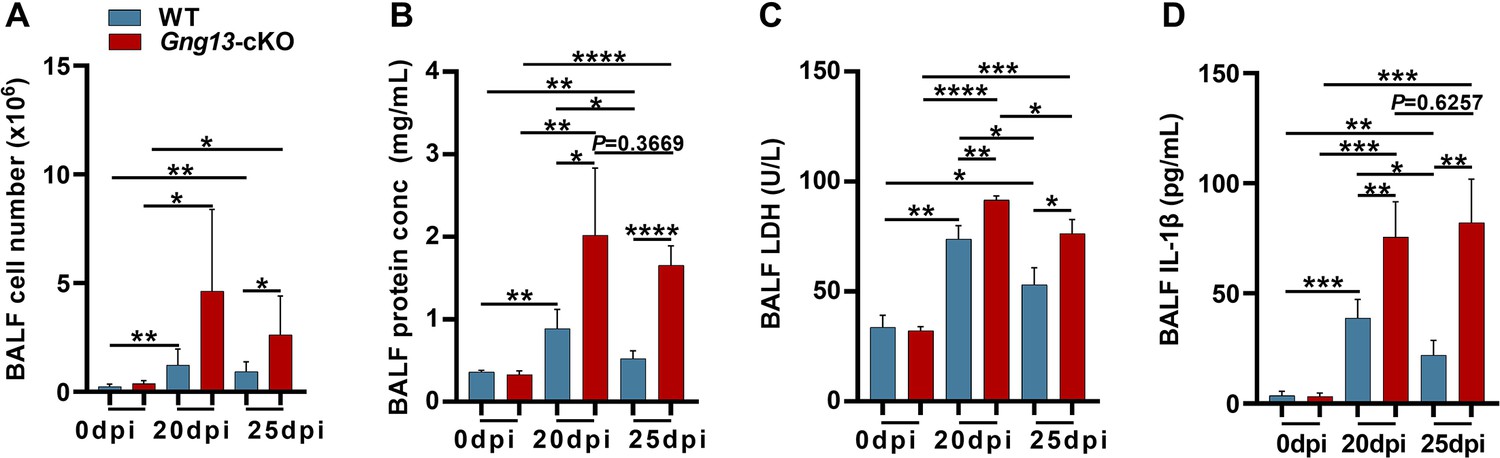
Bronchoalveolar lavage fluid (BALF) assays.
(A) Average numbers of cells per mouse found in both WT and Gng13-cKO BALFs at both 20 and 25 dpi were significantly more than those at 0 dpi while those of the Gng13-cKO BALF were even more than those of wild-type (WT) at both 20 and 25 dpi. Data are presented as means ± SD (n=6), and unpaired two-tailed student t-tests were performed. (B) The protein contents of both WT BALF and Gng13-cKO BALF at 20 dpi and 25 dpi were significantly more than their corresponding ones at 0 dpi, but the Gng13-cKO BALF had significantly more proteins than WT at both 20 and 25 dpi. And in WT, the protein content was significantly reduced from 20 dpi to 25 dpi, but the reduction in the Gng13-cKO was insignificant. Data are presented as means ± SD (n=5), and unpaired two-tailed student t-tests were performed. (C) Lactate dehydrogenase (LDH) activity assays showed that at both 20 and 25 dpi, LDH activities in both WT and Gng13-cKO BALF were significantly higher than their corresponding ones at 0 dpi, but the Gng13-cKO BALF at both 20 and 25 dpi showed higher activities than the corresponding WT BALF. And both WT and Gng13-cKO BALF displayed significant LDH activity reduction from 20 to 25 dpi. Data are presented as means ± SD (n=3), and unpaired two-tailed student t-tests were performed. (D) IL-1β ELISA assays showed a similar pattern to that of LDH, except that the reduction in the IL-1β concentration from 20 to 25 dpi was insignificant in the Gng13-cKO BALF. Data are presented as means ± SD (n=4), and unpaired two-tailed student t-tests were performed. *p<0.05, **p<0.01, ***p<0.001 ****p<0.0001.
-
Figure 7—source data 1
Bronchoalveolar lavage fluid (BALF) assays of wild-type (WT) and Gng13-cKO mice.
- https://cdn.elifesciences.org/articles/92956/elife-92956-fig7-data1-v1.xlsx
Figure 8
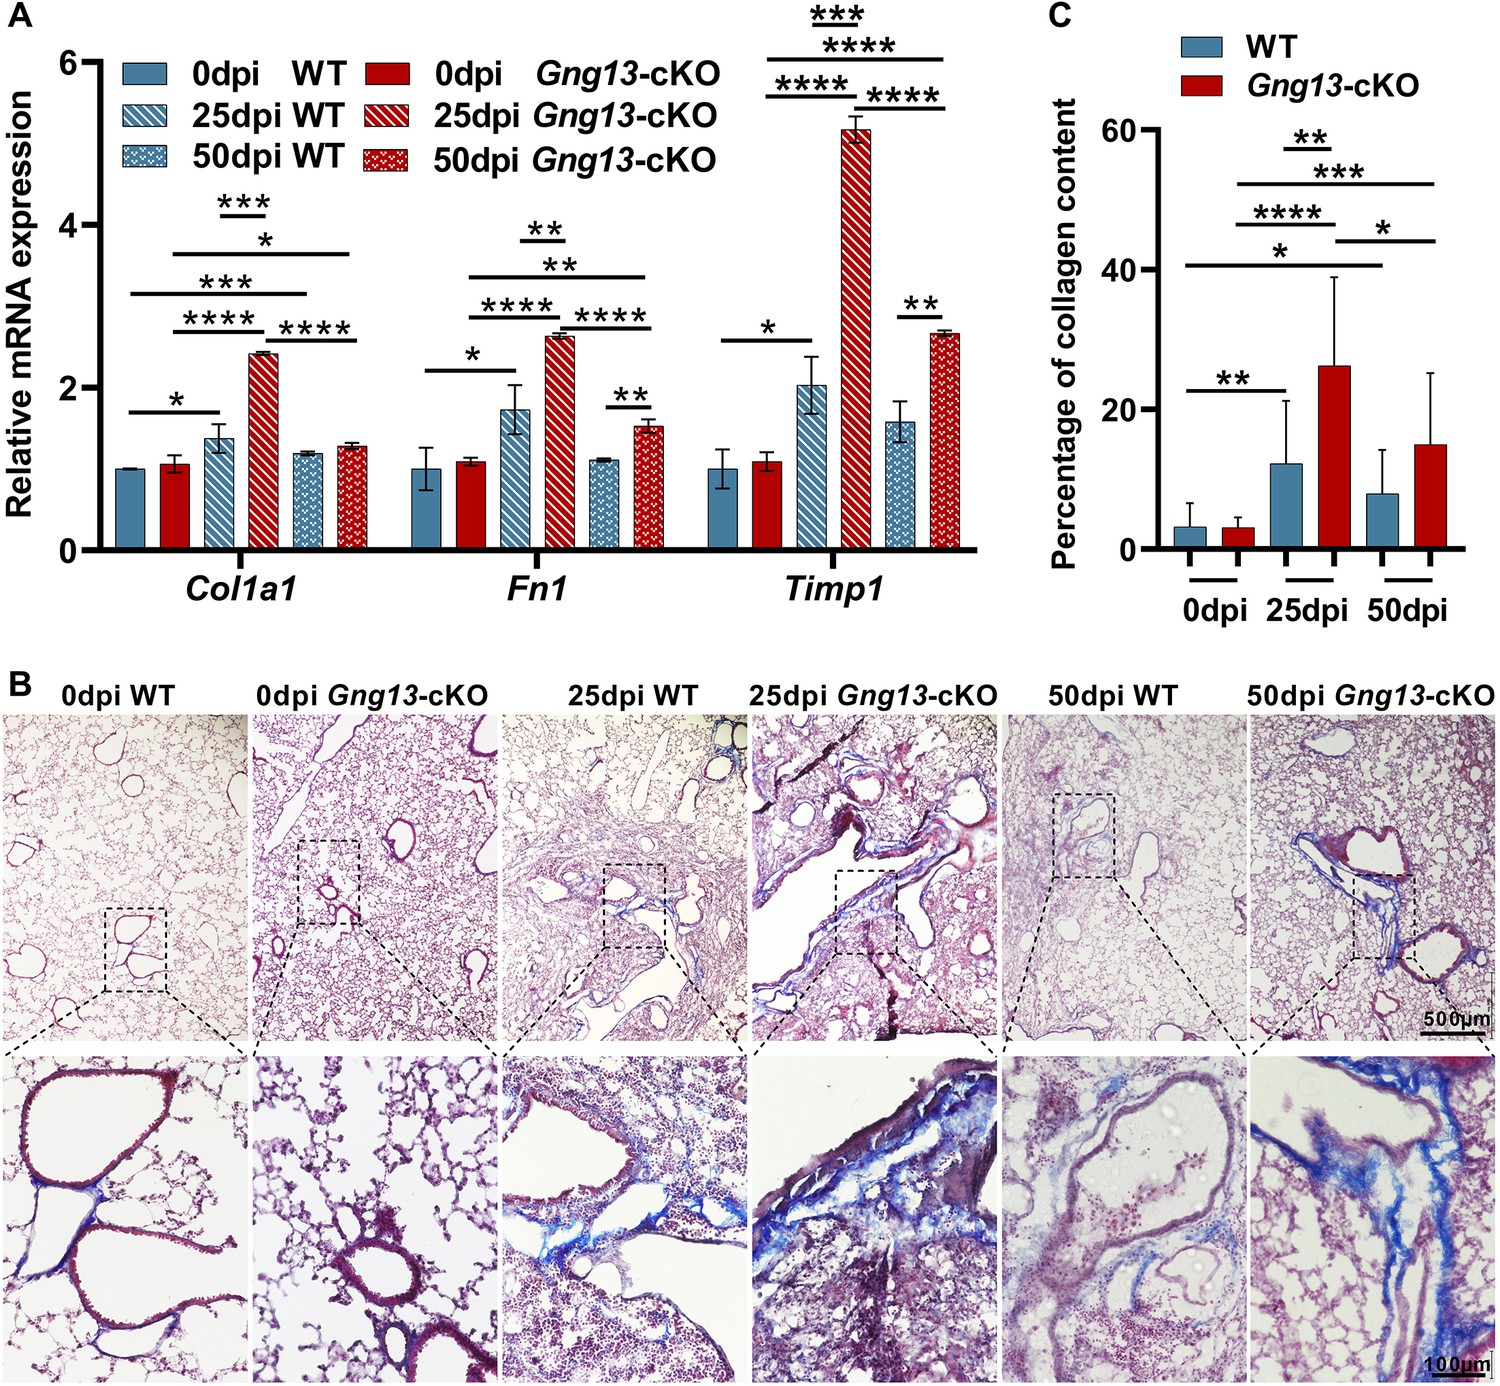
More severe fibrosis in the H1N1-infected Gng13-cKO lungs.
(A) Quantitative reverse transcription-PCR (qRT-PCR) analysis of Col1a1, Fn1, and Timp1 expression. While the expression levels of these three genes at 20 dpi in both wild-type (WT) and Gng13-cKO injured lungs were significantly greater than their corresponding ones at 0 dpi, the expression in Gng13-cKO at 25 dpi was much stronger than WT at 25 dpi. At 50 dpi, the expression levels of all these three genes were reduced compared with those at 25 dpi in both WT and Gng13-cKO mice, but those of Fn1 and Timp1 in Gng13-cKO mice at 50 dpi were still significantly higher than WT at 50 dpi. Data are presented as means ± SD (n=3), and unpaired two-tailed student t-tests were performed. (B, C) Masson’s trichrome staining showed that at 25 dpi, the fibrosis percentages in WT and Gng13-cKO were significantly more than their corresponding ones at 0 dpi, which were reduced at 50 dpi. Data are presented as means ± SD (n=3), and unpaired two-tailed student t-tests were performed. Scale bars : 500 µm and 100 µm. *p<0.05, **p<0.01, ***p<0.001, ****p<0.0001.
-
Figure 8—source data 1
Fibrosis-related gene expression and percentage of collagen content in the lungs of wild-type (WT) and Gng13-cKO mice.
- https://cdn.elifesciences.org/articles/92956/elife-92956-fig8-data1-v1.xlsx
Tables
Key resources table
| Reagent type (species) or resource | Designation | Source or reference | Identifiers | Additional information |
|---|---|---|---|---|
| Strain, strain background (Mus musculus) | Chat-IRES-Cre | The Jackson Laboratory | Cat#: 006410 | |
| Strain, strain background (Mus musculus) | Trpm5-/- | The Jackson Laboratory | Cat#: 005848 | |
| Strain, strain background (Mus musculus) | Gng13flox/flox | Li et al., 2013 | N/A | |
| Strain, strain background (Mus musculus) | Gng13-cKO | The Jackson Laboratory; Li et al., 2013 | Cat#006410 | Strain: Chat-IRES-Cre × Gng13flox/flox |
| Antibody | Anti-Dclk1 (rabbit polyclonal) | Abcam | ab31704; RRID:AB_873537 | IF (1:1,000) |
| Antibody | Anti-Dclk1-488 (rabbit monoclonal) | Abcam | ab202754 | IF (1:1,000) |
| Antibody | Anti-Gαgust (rabbit polyclonal) | Santa Cruz Biotechnology | sc-395 | IF (1:500) |
| Antibody | Anti-Plcβ2 (rabbit polyclonal) | Santa Cruz Biotechnology | sc-206 | IF (1:500) |
| Antibody | Anti-CD45 (rabbit polyclonal) | Abcam | ab10558; RRID:AB_442810 | IF (1:500) |
| Antibody | Anti-CD64 (rabbit monoclonal) | Thermo Fisher Scientific | MA5-29706; RRID:AB_2785530 | IF (1:200) |
| Antibody | Anti-Gsdmd (rabbit polyclonal) | Affinity | AF4012; RRID:AB_2846776 | IF (1:400) |
| Antibody | Anti-Gsdme (rabbit polyclonal) | Proteintech | 13075-1-AP; RRID:AB_2093053 | IF (1:500) |
| Antibody | Anti-F4/80-FITC (rabbit monoclonal) | Thermo Fisher Scientific | 11-4801-81; RRID:AB_2735037 | IF (1:500) |
| Antibody | Anti-EpCAM (rabbit monoclonal) | Thermo Fisher Scientific | 11-5791-82; RRID:AB_11151709 | IF (1:500) |
| Antibody | Anti-Krt5 (rabbit polyclonal) | BioLegend | 905504; RRID:AB_2734679 | IF (1:500) |
| Antibody | Anti-Trpm5 (rabbit polyclonal) | Sigma-aldrich | AV35242; RRID:AB_1858368 | IF (1:500) |
| Antibody | Anti-Caspase-3 (rabbit monoclonal) | Abcam | ab32351 | IF (1:500) |
| Antibody | Anti-Gγ13 (rabbit polyclonal) | Huang et al., 1999 | N/A | IF (1:200) |
| Antibody | Donkey anti-rabbit IgG H&L (Alexa Fluor488) | Abcam | ab150073; RRID:AB_2636877 | Secondary antibody IF (1:500) |
| Antibody | Donkey anti-rabbitIgG H&L (Alexa Fluor568) | Abcam | ab175470; RRID:AB_2783823 | Secondary antibody IF (1:500) |
| Antibody | Anti-NLRP3 (rabbit monoclonal) | Abcam | ab263899; RRID:AB_2889890 | WB (1:1,000) |
| Antibody | Anti-Gsdmd (rabbit monoclonal) | Abcam | ab219800; RRID:AB_2888940 | WB (1:1,000) |
| Antibody | Anti-caspase-1 (mouse monoclonal) | Santa Cruz Biotechnology | sc-56036; RRID:AB_781816 | WB (1:1,000) |
| Antibody | Anti-IL-1 (goat polychonal) | R&D Systems | AF-401-SP | WB (1:800) |
| Antibody | Anti-β-actin (mouse monoclonal) | Beyotime | AA128-1 | WB (1:1,000) |
| Antibody | Anti-rabbit (goat polychonal) | Beyotime | A0208 | HRP-conjugated secondary antibody WB (1:2,000) |
| Antibody | Anti-goat (donkey polychonal) | Beyotime | A0181 | HRP-conjugated secondary antibody WB (1:2,000) |
| Antibody | Anti-mouse (goat polychonal) | Beyotime | A0216 | HRP-conjugated secondary antibody WB (1:2,000) |
| Sequence-based reagent | PCR/ sequencing primers | This paper | N/A | Table 1 |
| Commercial assay or kit | LDH-GloTM Cytotoxicity Assay | Promega | Cat#: J2380 | |
| Commercial assay or kit | Mouse IL-1 beta DuoSet ELISA | R&D Systems | Cat#: DY401 | |
| Commercial assay or kit | Modified Masson’s Trichrome Stain Kit | absin | Cat#: abs9348 | |
| Chemical compound, drug | Bleomycin | Selleck | Cat#: s1214 | 6 mg/kg bodyweight |
| Chemical compound, drug | House dust mite extract | Biolead | Cat#: XPb70D3A2.5 | 2 mg/kg bodyweight |
| Chemical compound, drug | Lipopolysaccharide | Sigma | Cat#: L2630 | 1 mg/kg bodyweight |
| Chemical compound, drug | Denatonium benzoate | Sigma | Cat#: D5765 | 1 mM |
| Chemical compound, drug | Quinine | MedChemExpress | Cat#: HY-D0143 | 100 µM |
| Chemical compound, drug | Allylisothiocyanate | Sigma | Cat#: 36682 | 3 mM |
| Chemical compound, drug | Gallein | APExBIO | Cat#: B7271 | 100 µM |
| Chemical compound, drug | U73122 | Sigma | Cat#: U6756 | 10 µM |
| Chemical compound, drug | 1× Sytox Green | Beyotime | Cat#: C1070S | 1× |
| Software, algorithm | Graphpad Prism 9 | Graphpad | RRID:SCR_002798 | https://www.graphpad-prism.cn/?c=i&a=prism |
Table 1
Sequences of primers used for qPCR.
| Species | Gene name | Sequences (5’-3’) | Sequences (5’-3’) |
|---|---|---|---|
| Mouse | Tas2r102 | F:CTCCTGCTAATCTTCTCTTTGTG | R:GGGTCTCTGTGTCTTCTGG |
| Tas2r103 | F:AGCACAGTGGCCCACATAAA | R:TGGCCTGTGGGAAAAGCTAC | |
| Tas2r104 | F:GCAACACATCCTGGCTGAT | R:CCCCATATTGGCAAAAACAT | |
| Tas2r105 | F:CAGAAGGCATCCTCCTTTCCA | R:GCCCAGTCCATGCAGTTTAC | |
| Tas2r106 | F:AGCCACATTCTTCTCAACCT | R:AGCATGTAATGATAGCCACCA | |
| Tas2r107 | F:CTGGTTTGACAGCCACATGC | R:TGCCTTCAAAGAGGCTTGCT | |
| Tas2r108 | F:GTTTCTCCTGTTGAAACGGACT | R:GTGAGGGCTGAAATCAGAAGA | |
| Tas2r109 | F:GTCAAATTCAGGTGTTAGGAAGTC | R:CACAGGGAGAAGATGAGCAG | |
| Tas2r110 | F:AGGTCAATGCCAAACCACCT | R:CAGCAGGAAGGAGAACCCTG | |
| Tas2r113 | F:AGAATATGCAGCACACCGCC | R:CAATGATGGTTTGCAGGGCTC | |
| Tas2r114 | F:ACACATCTTGGCAGATCCACA | R:TTTGATTCCATCTGCCTGCGA | |
| Tas2r115 | F:CCTTTGGTGTATCCTTGATAGCTT | R:CTGCATCTTCCTTACATGTTTCA | |
| Tas2r116 | F:AAGGTTTGGAGTGCTCTGCT | R:AGCTGTTCTTGCAACCTGTGT | |
| Tas2r117 | F:CCCTGTGGACACATCACAAG | R:TCACAGTTTGTAGGGCTTTGAA | |
| Tas2r118 | F:CACTGGGTGCAGATGAAACA | R:CTTCAGAACAGTGAACTGAGCTTT | |
| Tas2r119 | F:TGCACAGCTGGGTCTATCCT | R:CACCAAGCCATGTGGCAAAC | |
| Tas2r120 | F:TTGGTTTGTTGTGGGCAATGT | R:TCAGTATGGTCCCCAGCCAA | |
| Tas2r121 | F:CTGGTCTTATTGGAGATGATTGTG | R:GGAGAAGATTAACAGGATGAAGGA | |
| Tas2r122 | F:GCTTATTGTGGCAAGCTCCA | R:AACCTCCACAATGACACACCA | |
| Tas2r123 | F:TTCATGCTGTGCCCACATTT | R:AAGACACCGAGGCATGTAGT | |
| Tas2r124 | F:CTACGGCCCACAGAAATGCC | R:AGCTGCCTCATTACCCAAAGA | |
| Tas2r125 | F:CTAAAGGCTCCGAAGACACCA | R:AACAGGAGAAAGGCCACTACC | |
| Tas2r126 | F:GTGTGTGGGATTGGTCAACA | R:GCTCCCGGAGTACTCAACC | |
| Tas2r129 | F:TTTAGCATGTGGCTTGCTGC | R:AGAGGCCCAAAGACATGAGC | |
| Tas2r130 | F:TGCATTCATTGCACTGGTAAA | R:GATTAAATCAATAGAGGCAATCTTCC | |
| Tas2r131 | F:TAGCCCACATTTCCCATCC | R:CAAGCACACCTCTCAATCTCC | |
| Tas2r134 | F:GCCTGGGAAGTGGTAACCTA | R:GTTGCTTAGTATCAGAATGGTGGA | |
| Tas2r135 | F:CCATCATGTCCACAGGAGAA | R:TCAGTAGTCTGACATCCAAGAACTGT | |
| Tas2r136 | F:GCAAAGAGCTTTCTCAAAGACC | R:AGGGATAGATAAACAGGGAAACACT | |
| Tas2r137 | F:CTGGCTCAAATGGAGAGCTT | R:GGTACTGACACAGGATAAGAGCAG | |
| Tas2r138 | F:CAAACCAAGTGAGCCTCTGG | R:GAGAAGCGGACAATCTTGGA | |
| Tas2r139 | F:ATGGCTCAACCCAGCAACTAC | R:ACAGCCATGACAATCCCACT | |
| Tas2r140 | F:GAAGAACATGCAACACAATGC | R:AGGGCCTTAATATGGGCTGT | |
| Tas2r143 | F:CATTGGCCTCTATGTTGCAG | R:TGTCCGGTTCCTCATCCA | |
| Tas2r144 | F:AAGCAGAAAATCATAGGGCTGA | R:TGAAGGAAACCAACACTGACA | |
| Gsdma | F:CTAGTCTGATCCTTCCCATGTGT | R:CAGTGTGGGCAGTAACGTGT | |
| Gsdma2 | F:CCCTTCCCTGGAAAATCTGGA | R:CCGGGTGACATCCTCAAACA | |
| Gsdma3 | F:ACTGAAATGCCTGCTCATCTT | R:CATCAGGAGATGGGCTTAGTGG | |
| Gsdmc | F:TCTTCCCGGTTGGCTTTGAAA | R:AGGACTTAACAAACCCTGCTTC | |
| Gsdmc2 | F:CTGTGGAATGCTTGTCCGATG | R:CCTCCAGGTCCGTTGATTGG | |
| Gsdmc3 | F:AGCCCGCCCATCTAGATTTC | R:TGCCCCAACTGACTCAACTC | |
| Gsdmc4 | F:TGAGGAGCCTGCCAATCTAAA | R:ATGTGGGGTGCTAGAATCCTT | |
| Gsdmd | F:GATCAAGGAGGTAAGCGGCA | R:CACTCCGGTTCTGGTTCTGG | |
| Gsdme | F:GTCAGCAGAGGCAAACAATCG | R:TTTCTTCGCTGTGCTGCTTG | |
| Tlr4 | F:GTTCTCTCATGGCCTCCACT | R:AGGGACTTTGCTGAGTTTCTGAT | |
| Nlrp3 | F:CCCCTTTATTTGTACCCAAGGCT | R:GCAACGGACACTCGTCATCT | |
| Asc | F:GACAGTACCAGGCAGTTCGT | R:AGTCCTTGCAGGTCAGGTTC | |
| Casp1 | F:CCGCGGTTGAATCCTTTTCAG | R:TGTGCGCATGTTTCTTTCCC | |
| Il1b | F:TGCCACCTTTTGACAGTGATG | R:AAGGTCCACGGGAAAGACAC | |
| Col1a1 | F:AGAGCGGAGAGTACTGGATCG | R:TCGAACGGGAATCCATCGGT | |
| Fn1 | F:AACAGAAATTGACAAGCCGTC | R:TCTGTTTGATCTGGACTGGCA | |
| Timp1 | F:GCAAAGAGCTTTCTCAAAGACC | R:AGGGATAGATAAACAGGGAAACACT |
Additional files
Download links
A two-part list of links to download the article, or parts of the article, in various formats.
Downloads (link to download the article as PDF)
Open citations (links to open the citations from this article in various online reference manager services)
Cite this article (links to download the citations from this article in formats compatible with various reference manager tools)
G protein subunit Gγ13-mediated signaling pathway is critical to the inflammation resolution and functional recovery of severely injured lungs
eLife 12:RP92956.
https://doi.org/10.7554/eLife.92956.3


