Hypothalamic representation of the imminence of predator threat detected by the vomeronasal organ in mice
- Neuroscience Graduate Program, University of California, Riverside, United States
- Department of Molecular, Cell and Systems Biology, University of California, Riverside, United States
Figures
Figure 1 with 3 supplements
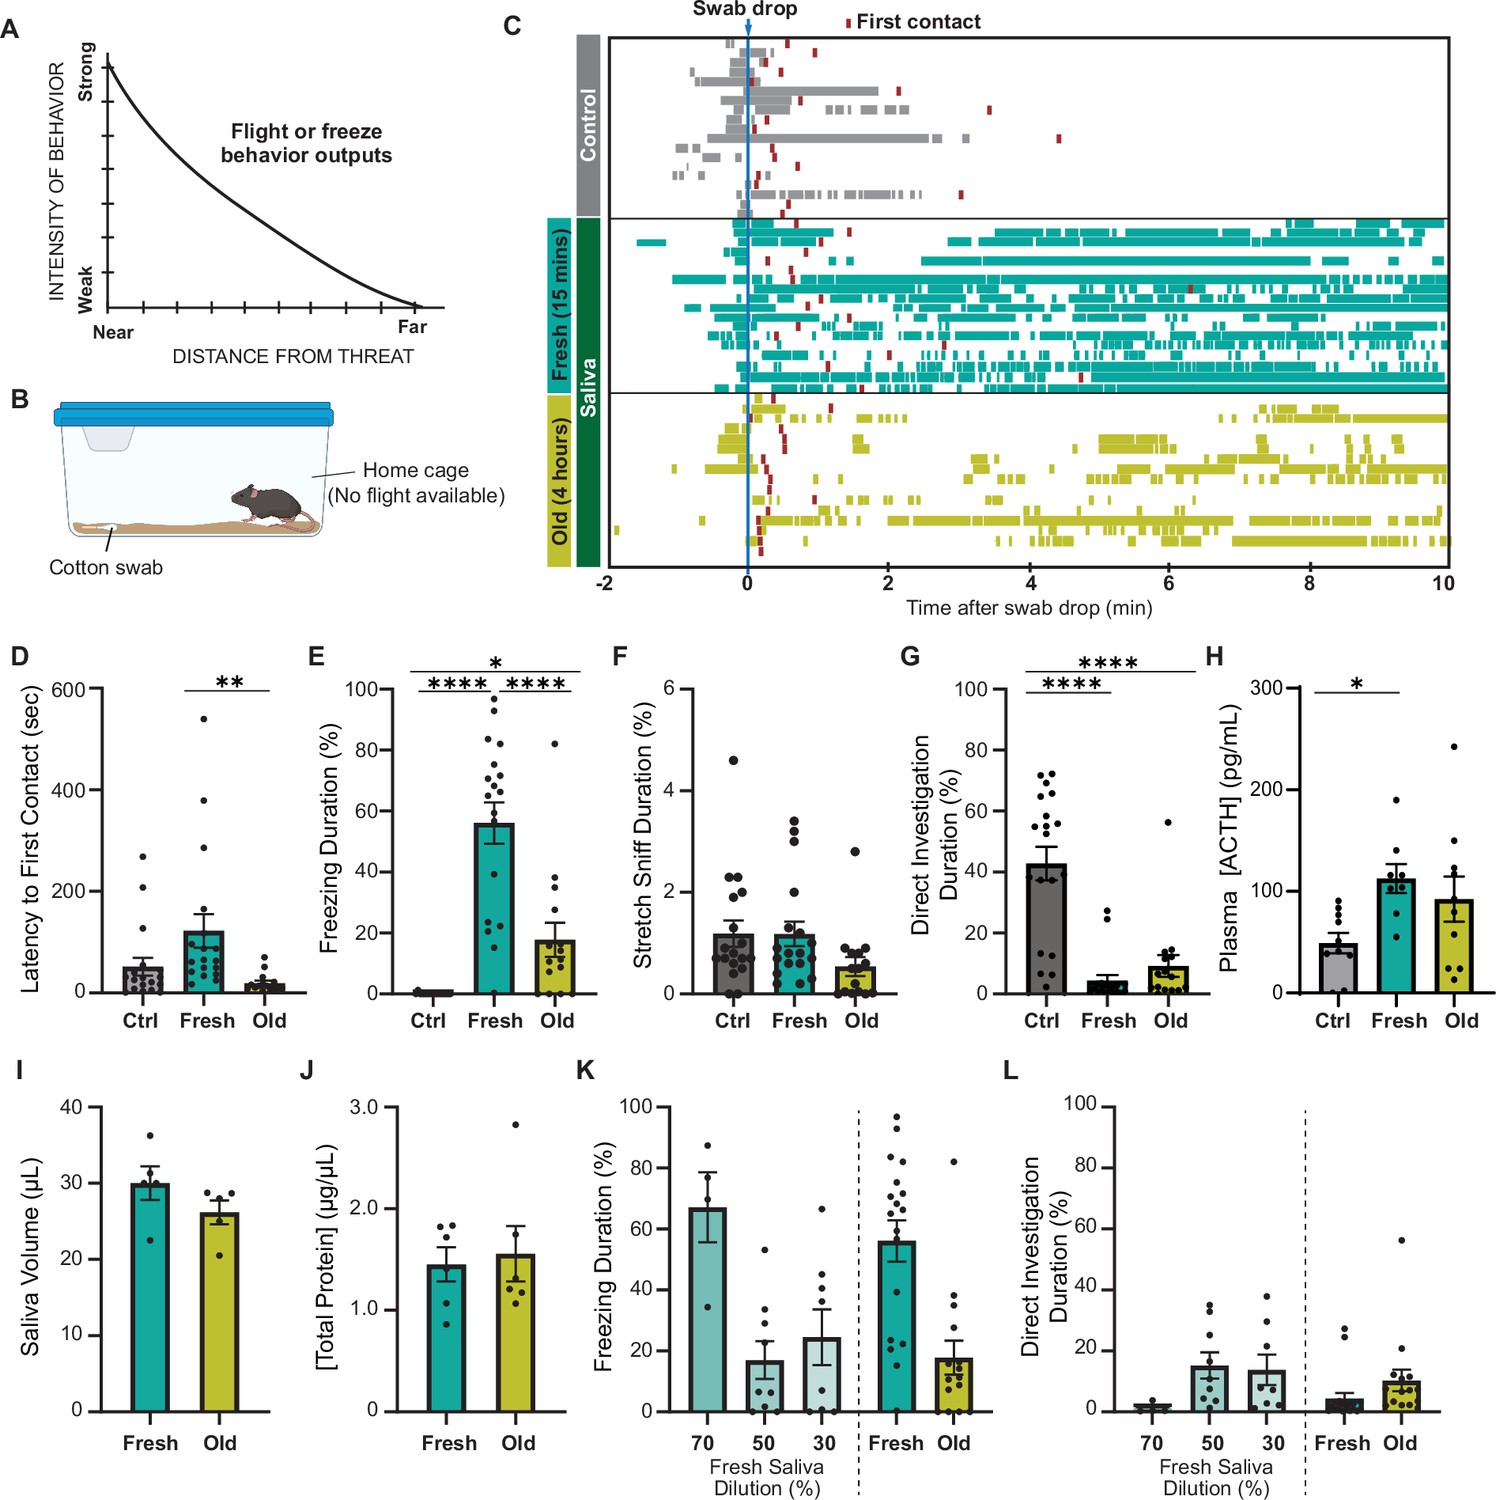
Predator cues in cat saliva induce context-dependent defensive behavior in mice.
(A) A schematic diagram illustrating the elicitation of ‘freeze’ or ‘flight’ defensive behaviors in relation to distance. Adapted with permission from Blanchard and Blanchard, 1989. (B) A schematic illustration depicting a test chamber for evaluating defensive behaviors. (C) Raster plots displaying freezing episodes of individual mice exposed to a clean control swab (gray, n = 18), fresh saliva (green, n = 18), or old saliva (yellow, n = 15). The introduction of a clean, fresh, or old saliva swab into a mouse’s cage is denoted as time 0. Red lines indicate the first contact with a swab for each mouse. (D) Latency to the first episode of contact with a swab. One-way ANOVA (F(2,48) = 5.166, p=0.0093) with Tukey’s multiple-comparisons test (Ctrl vs. Fresh, p=0.0778; Ctrl vs. Old, p=0.5907; and Fresh vs. Old, p=0.0089). (E) The percentage of total freezing episodes after the first contact. One-way ANOVA (F(2,48) = 34.16, p<0.0001) with Tukey’s multiple-comparisons test (Ctrl vs. Fresh, p<0.0001; Ctrl vs. Old, p=0.0468; and Fresh vs. Old, p<0.0001). (F) The percentage of total stretch sniff episodes. One-way ANOVA (F(2,48) = 2.307, p=0.1144). (G) The percentage of total direct investigation episodes. One-way ANOVA (F(2,48) = 25.17, p<0.0001) with Tukey’s multiple-comparisons test (Ctrl vs. Fresh, p<0.0001; Ctrl vs. Old, p<0.0001; and Fresh vs. Old, p=0.5762). (H) Plasma ACTH concentrations following exposure to clean (n = 10), fresh (n = 8), or old saliva (n = 10) swabs. One-way ANOVA (F(2,25) = 3.735, p=0.0381) with Tukey’s multiple-comparisons test (Ctrl vs. Fresh, p=0.0370; Ctrl vs. Old, p=0.1609; and Fresh vs. Old, p=0.6804). (I) Volume of saliva in individual swabs at 0 hr (Fresh) and 4 hr (Old) after collection. Two-tailed t-test (t = 1.415, df = 8, p=0.1949). (J) Concentrations of total proteins in fresh and old saliva. Two-tailed t-test (t = 0.3252, df = 10, p=0.7518). (K) The percentage of total freezing episodes induced by diluted fresh cat saliva (70%, n = 4; 50%, n = 9; 30%, n = 8), compared to the ones induced by fresh and old saliva. One-way ANOVA (F(4, 47) = 0.6604, p<0.0001) with Tukey’s multiple-comparisons test. Statistical results are reported in Supplementary file 1. (L) The percentage of total direct investigation episodes to diluted fresh cat saliva (70%, n = 4; 50%, n = 9; 30%, n = 8), compared to the ones induced by fresh and old saliva. One-way ANOVA (F(4, 49) = 2.272, p=0.0748). In (D-–L), the values are presented as means ± S.E.M., with individual dots representing individual mice. *, **, and **** denote significance levels of p<0.05, 0.01, and 0.0001, respectively. Data for fresh and old saliva in (K) and (L) are reused from (E) and (G), respectively.
-
Figure 1—source data 1
Data used to generate the graphs in Figure 1.
- https://cdn.elifesciences.org/articles/92982/elife-92982-fig1-data1-v1.xlsx
Figure 1—figure supplement 1
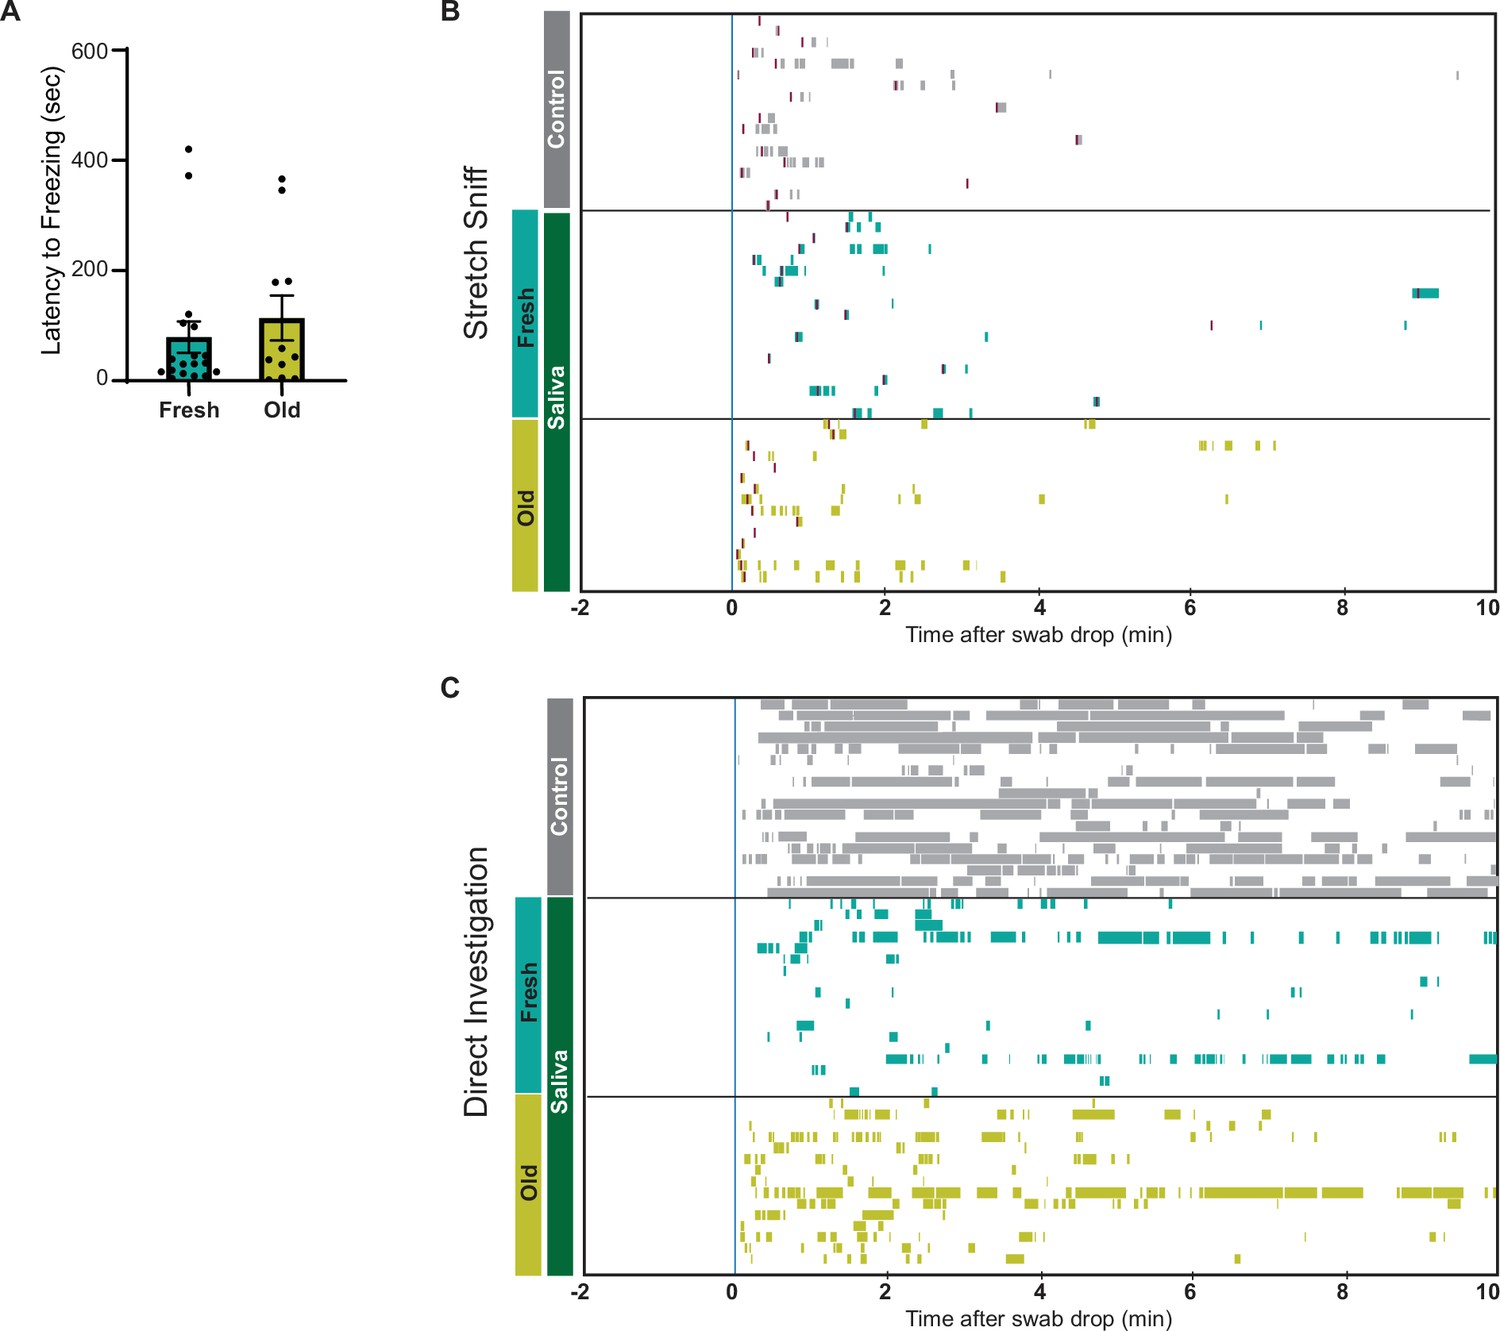
Predator cues in cat saliva induce context-dependent defensive behavior in mice.
(A) Latency to the first freezing episode in mice exhibited freezing after the first contact with a swab. Two-tailed t-test (t = 0.7172, df = 27, p=0.4794). (B, C) Raster plots displaying stretch sniffing (B) and direct investigation (C) episodes of individual mice exposed to a clean control swab (gray), fresh saliva (green), or old saliva (yellow). The introduction of a clean, fresh, or old saliva swab into a mouse’s cage is denoted as time 0. Red lines in (B) indicate the first contact with a swab for each mouse.
Figure 1—figure supplement 2
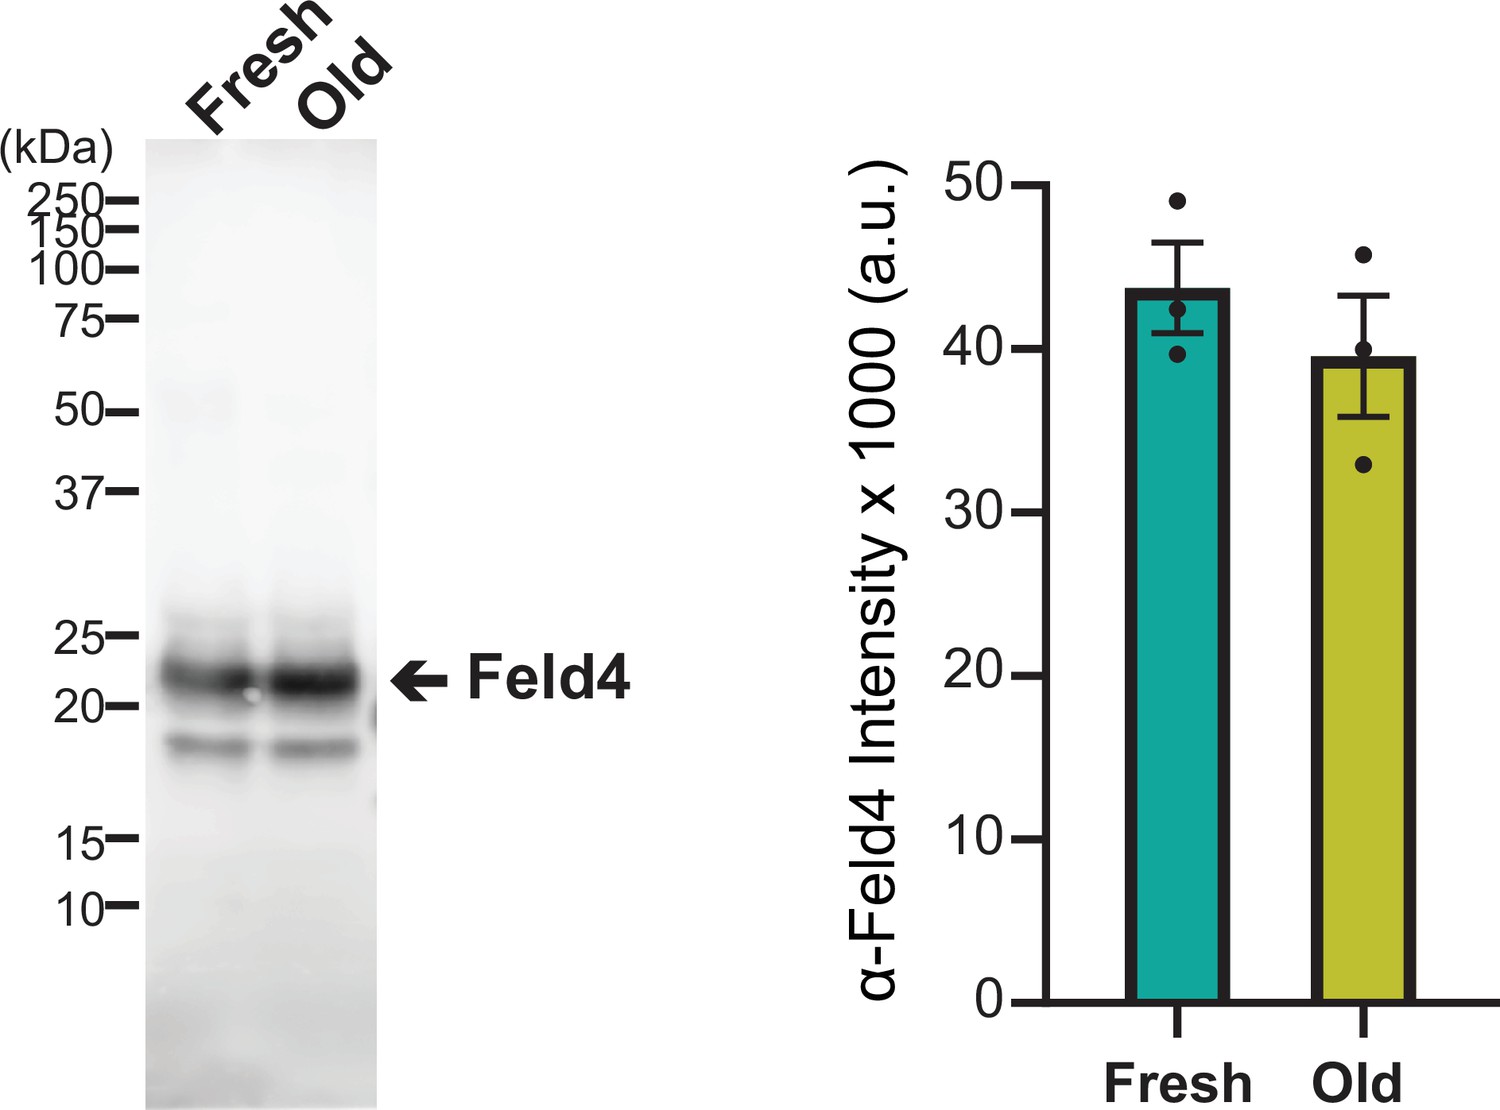
Representative western blot analysis of Fel d 4 protein bands in fresh and old saliva samples.
(Left) Immunoblot showing bands of Fel d 4 protein detected using anti-Fel d 4 antibody. Each lane was loaded with 10 μg of total protein. (Right) Quantification of Fel d 4 band intensities in fresh and old saliva samples (n = 3 each). The values are presented as means ± S.E.M., with individual dots representing individual saliva samples.
-
Figure 1—figure supplement 2—source data 1
Original file for western blot analysis displayed in Figure 1—figure supplement 2.
- https://cdn.elifesciences.org/articles/92982/elife-92982-fig1-figsupp2-data1-v1.zip
-
Figure 1—figure supplement 2—source data 2
Original file for western blot analysis displayed in Figure 1—figure supplement 2, indicating the relevant bands and sample conditions.
- https://cdn.elifesciences.org/articles/92982/elife-92982-fig1-figsupp2-data2-v1.zip
Figure 1—figure supplement 3
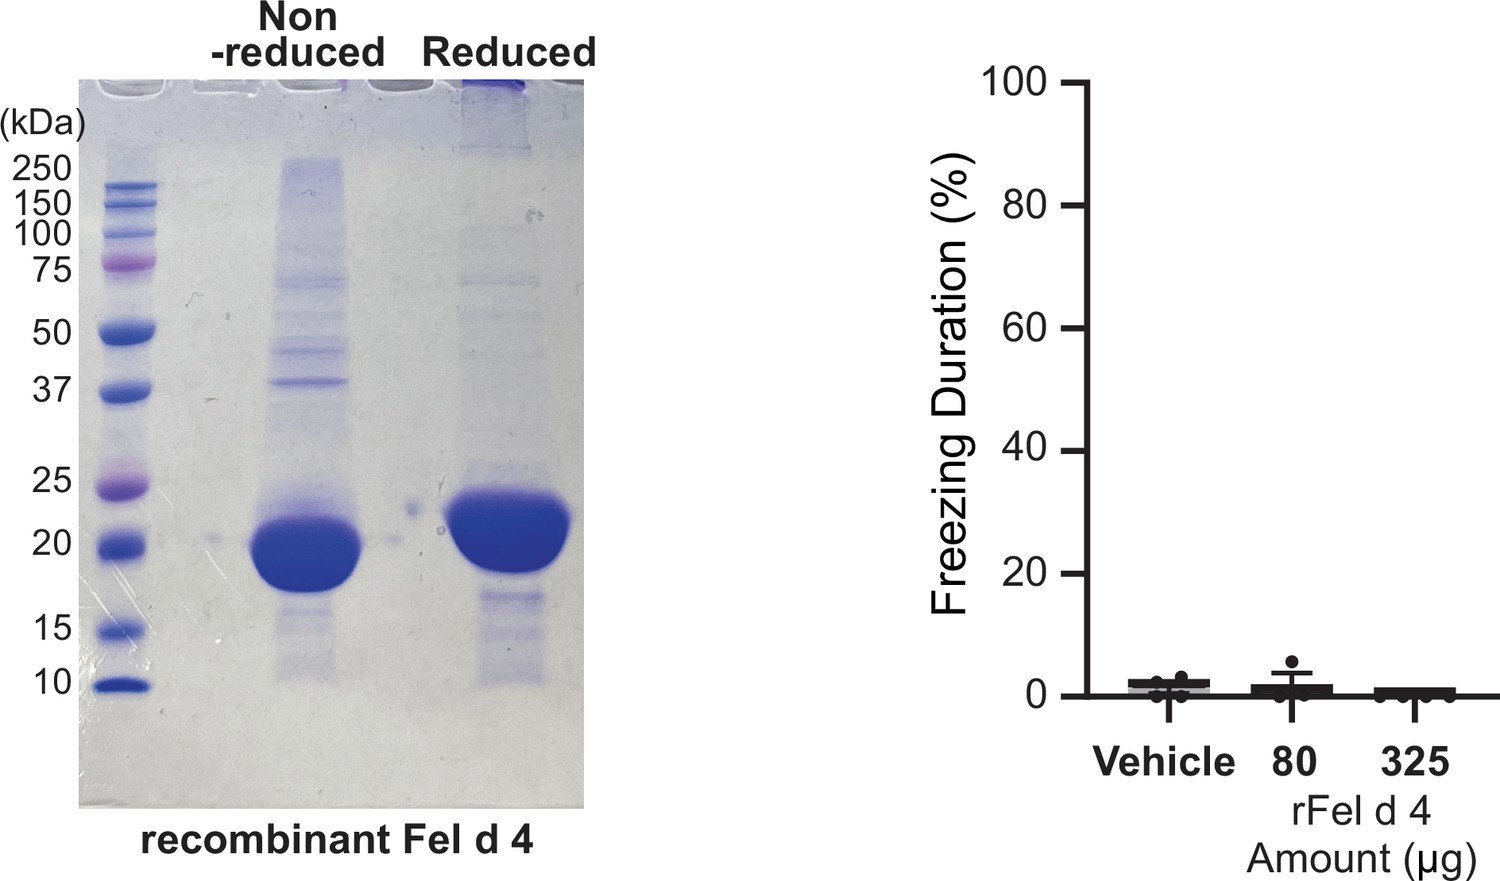
Recombinant Fel d 4 does not induce freezing behavior in mice.
(Left) SDS-PAGE gel image showing 65 μg of recombinant Fel d 4 protein in non-reduced and reduced conditions. (Right) Percentage of total freezing episodes directed toward swabs containing vehicle, 80 μg Fel d 4, or 325 μg Fel d 4. Sample sizes are as follows: Vehicle (n = 4), 80 μg Fel d 4 (n = 3), and 325 μg Fel d 4 (n = 4).
-
Figure 1—figure supplement 3—source data 1
Original file for SDS-PAGE gel displayed in Figure 1—figure supplement 3.
- https://cdn.elifesciences.org/articles/92982/elife-92982-fig1-figsupp3-data1-v1.zip
-
Figure 1—figure supplement 3—source data 2
Original file for SDS-PAGE gel displayed in Figure 1—figure supplement 3, indicating the relevant bands and sample conditions.
- https://cdn.elifesciences.org/articles/92982/elife-92982-fig1-figsupp3-data2-v1.zip
Figure 2
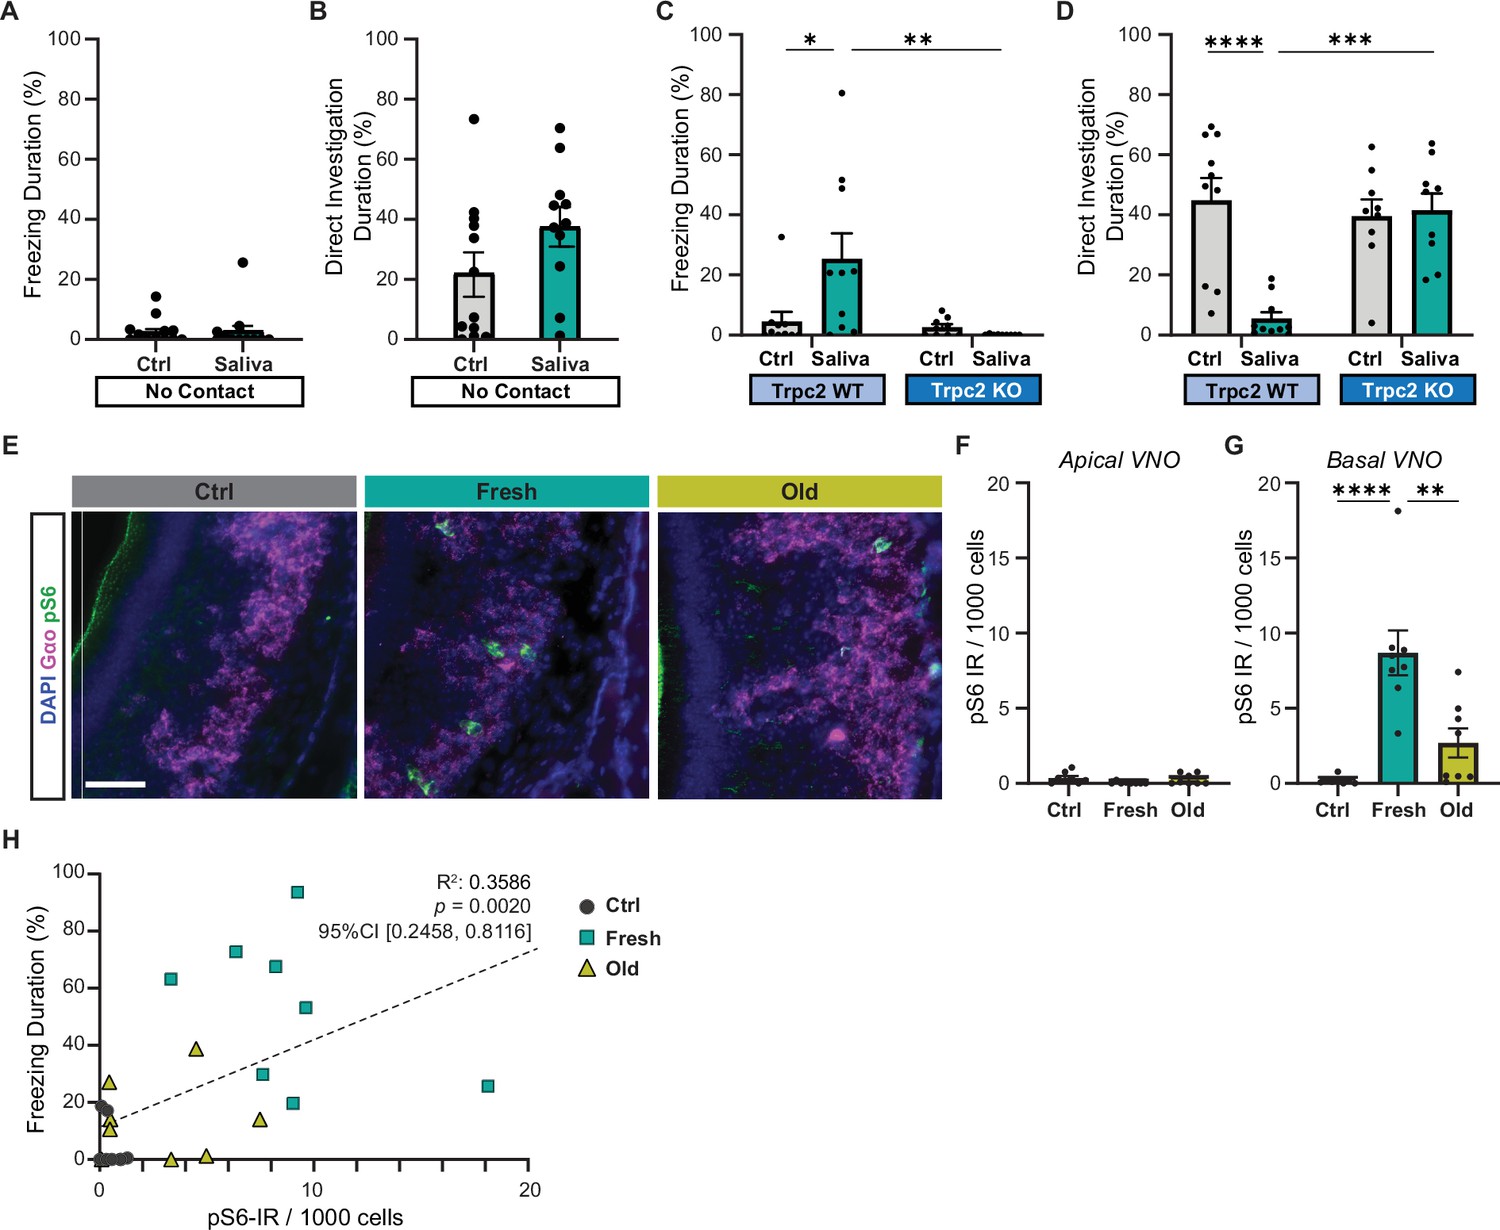
Cat saliva activates vomeronasal organ (VNO) neurons and modulates freezing behavior.
(A) The percentage of total freezing episodes directed toward control (n = 12) or fresh saliva (n = 11) swabs in cassettes that prevent direct contact with the swabs. Two-tailed t-test (t = 0.08745, df = 21, p=0.9311). (B) The percentage of total investigation episodes toward cassettes containing control or fresh saliva swabs. Two-tailed t-test (t = 1.662, df = 21, p=0.1114). (C) The percentage of total freezing episodes directed toward control or fresh saliva swabs in Trpc2-WT (n = 10) or -KO (n = 9) mice. Two-way ANOVA ([genotype] F(1, 34) = 3.662, p=0.0641, [swab type] F(1, 34) = 8.053, p=0.0076, [genotype] and [swab type] F(1, 34) = 5.963, p=0.0200) with Tukey’s multiple-comparisons test (WT-Ctrl vs. KO-Ctrl, p=0.9922; WT-Ctrl vs. WT-Saliva, p=0.0164; WT-Ctrl vs. KO-Saliva, p=0.9136; KO-Ctrl vs. WT-Saliva, p=0.0100; KO-Ctrl vs. KO-Saliva, p=0.9832; WT-Saliva vs. KO-Saliva, p=0.0037). (D) The percentage of total direct investigation episodes toward control or fresh saliva swabs in Trpc2-WT or -KO mice. Two-way ANOVA ([genotype] F(1, 34) = 11.46, p=0.0018, [swab type] F(1, 34) = 7.725, p=0.0088, [genotype] and [swab type] F(1, 34) = 13.96, p=0.0007) with Tukey’s multiple-comparisons test (WT-Ctrl vs. KO-Ctrl, p=0.9051; WT-Ctrl vs. WT-Saliva, p<0.0001; WT-Ctrl vs. KO-Saliva, p=0.9732; KO-Ctrl vs. WT-Saliva, p=0.0006; KO-Ctrl vs. KO-Saliva, p=0.9949; WT-Saliva vs. KO-Saliva, p=0.0003). (E) Representative images illustrating the expression of pS6 (green) and Gαo (magenta) in the VNO of mice exposed to control, fresh, or old saliva swabs. DAPI was used as a nuclear counterstain. Scale bar: 50 μm. (F, G) The number of pS6-IR positive cells in 1000 VNO cells in the apical (F) and basal (G) regions of the VNO neuroepithelium in mice stimulated with control (n = 8), fresh saliva (n = 8), and old saliva (n = 8) swabs. (F) One-way ANOVA (F(2, 21) = 2.562, p=0.1010). (G) One-way ANOVA (F(2, 21) = 17.90, p<0.0001) with Tukey’s multiple-comparisons test (Ctrl vs. Fresh, p<0.0001; Ctrl vs. Old, p=0.2262; and Fresh vs. Old, p=0.0014). (H) The percentage of total freezing episodes in relation to the number of pS6-positive cells in the VNO of individual mice (n = 8 per swab type). Correlation analysis was conducted using Spearman’s rank correlation coefficient as total data points did not pass Shapiro–Wilk and Kolmogorov–Smirnov normality tests. Statistical results are reported in the graph. (A–D, F, G) the values are presented as means ± S.E.M., with individual dots representing individual mice. *, **, ***, and **** denote significance levels of p<0.05, 0.01, 0.001, and 0.0001, respectively.
-
Figure 2—source data 1
Data used to generate the graphs in Figure 2.
- https://cdn.elifesciences.org/articles/92982/elife-92982-fig2-data1-v1.xlsx
Figure 3 with 1 supplement
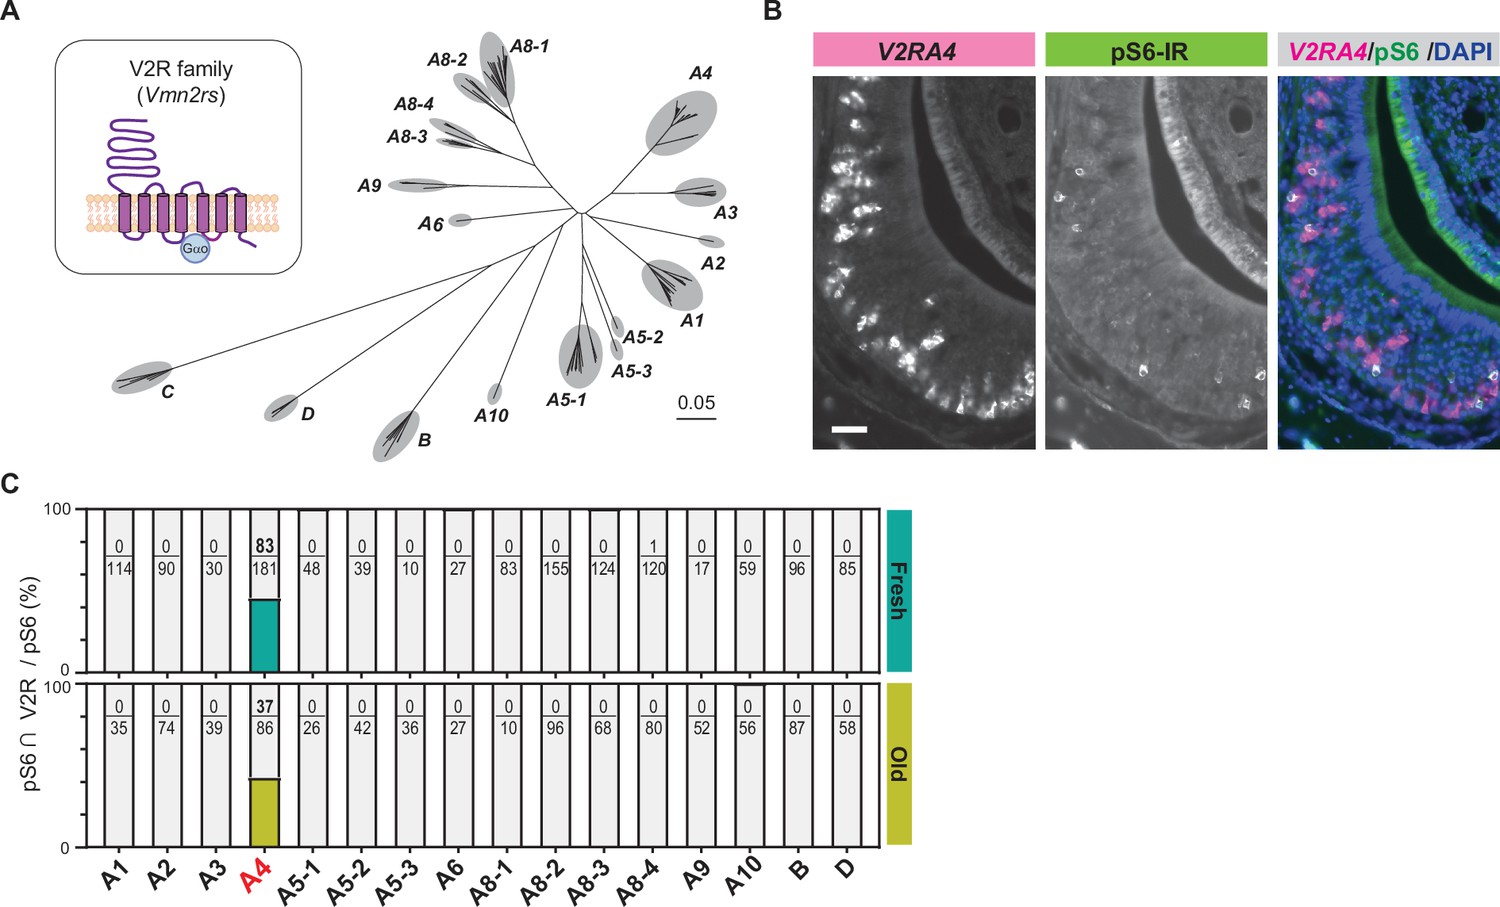
Cat saliva activates the V2R-A4 subfamily of the vomeronasal receptors.
(A) Phylogenetic tree of the V2R family and its subfamilies used for V2R cRNA probe design. (B) Representative images displaying the expression of V2RA4 (magenta) and pS6 (green) in the vomeronasal organ (VNO) of a mouse exposed to a fresh saliva swab. DAPI was utilized as a nuclear counterstain. Scale bar: 50 μm. (C) The percentage of cells co-labeled with V2R probes and anti-pS6 antibody among the total pS6-positive cells in the VNO of mice exposed to fresh saliva (top, from 3 to 6 animals) or old saliva (bottom, from 3 to 6 animals).
Figure 3—figure supplement 1
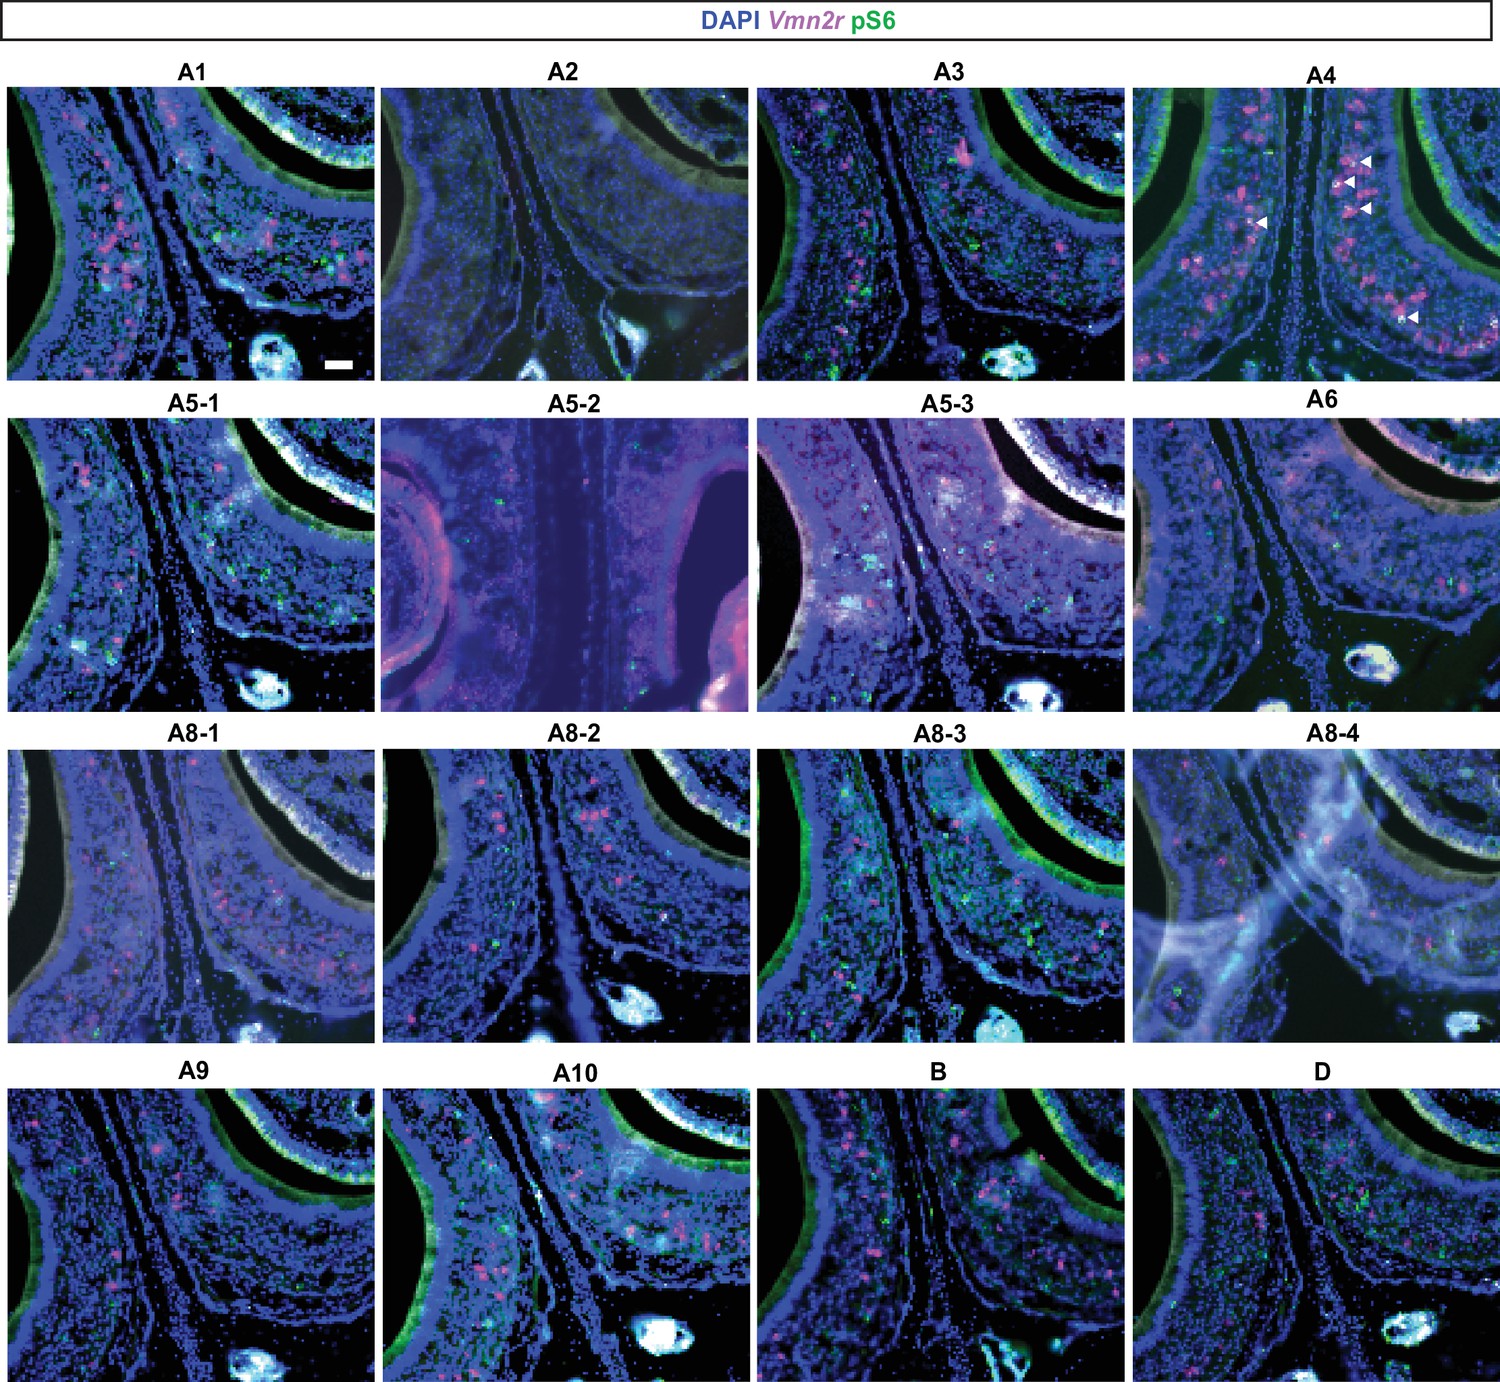
Representative images of V2R in situ hybridization and pS6 immunohistochemistry for each V2R subfamily.
Scale bar: 50 μm.
Figure 4 with 1 supplement
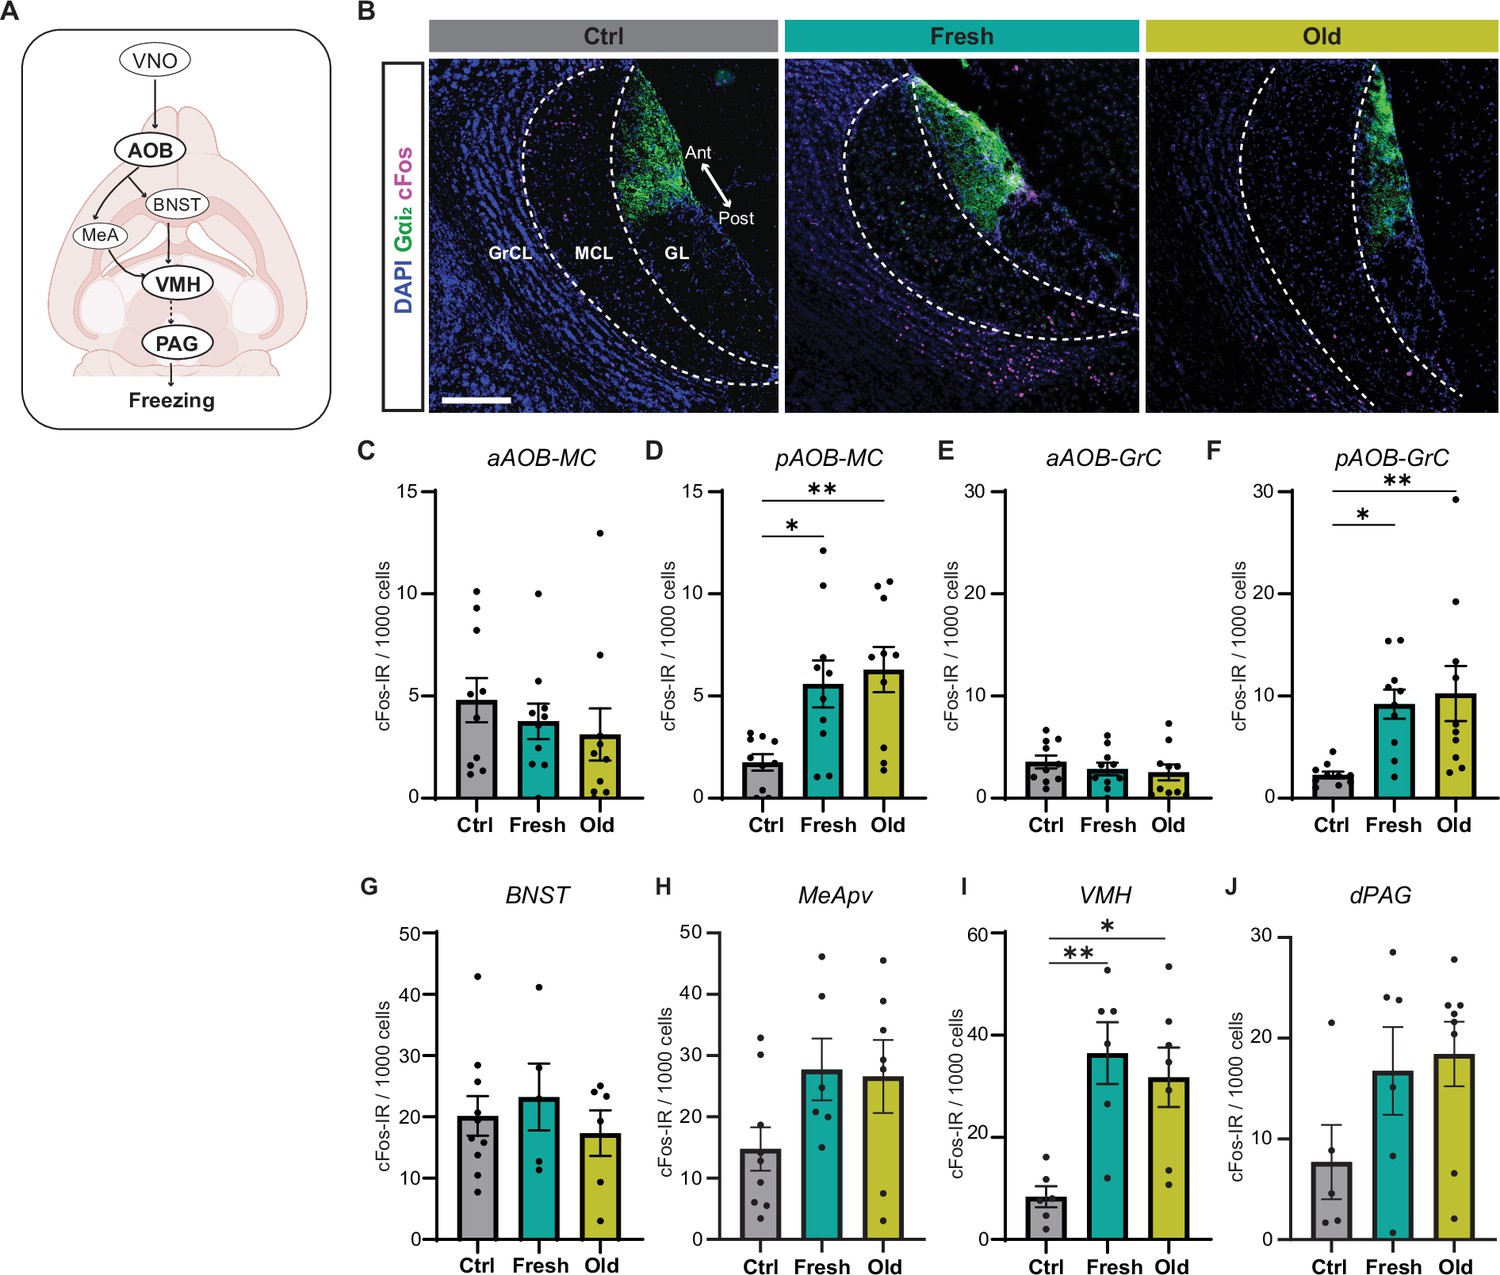
Cat saliva activates neurons in the accessory olfactory bulb (AOB) and defensive behavioral circuit.
(A) Schematic diagrams illustrating the vomeronasal organ (VNO) sensory pathway that controls defensive behaviors. (B) Representative images displaying the expression of cFos (magenta) in the mitral cell (MCL) and granule cell (GCL) layers of the AOB of mice exposed to control, fresh, or old saliva swabs. Gαi2 (green) visualizes the anterior region of the glomerular layer (GL). DAPI was utilized as a nuclear counterstain. Scale bar: 200 μm. (C, D) The number of cFos-IR positive mitral cells per 1000 mitral cells in the anterior (C) and posterior (D) regions of the AOB (n = 10 per swab type). (C) One-way ANOVA (F(2, 27) = 0.6106, p=0.5504). (D) One-way ANOVA (F(2, 27) = 6.665, p=0.0044) with Tukey’s multiple-comparisons test (Ctrl vs. Fresh, p=0.0210; Ctrl vs. Old, p=0.0059; and Fresh vs. Old, p=0.8593). (E, F) The number of cFos-IR positive granule cells per 1000 granule cells in the anterior (E) and posterior (F) regions of the AOB (n = 10 per swab type). (E) One-way ANOVA (F(2, 27) = 0.5831, p=0.5651). (F) One-way ANOVA (F(2, 27) = 5.996, p=0.0070) with Tukey’s multiple-comparisons test (Ctrl vs. Fresh, p=0.0262; Ctrl vs. Old, p=0.0099; and Fresh vs. Old, p=0.9105). (G) The number of cFos-IR positive neurons per 1000 cells in the BNST in mice stimulated with control (n = 10), fresh saliva (n = 5), and old saliva (n = 6) swabs. One-way ANOVA (F(2, 18) = 0.4375, p=0.6524). (H) The number of cFos-IR positive neurons per 1000 cells in the MeApv in mice stimulated with control (n = 9), fresh saliva (n = 6), and old saliva (n = 7) swabs. One-way ANOVA (F(2, 19) = 2.454, p=0.1128). (I) The number of cFos-IR positive neurons per 1000 cells in the VMH in mice stimulated with control (n = 6), fresh saliva (n = 6), and old saliva (n = 7) swabs. One-way ANOVA (F(2, 16) = 8.332, p=0.0033) with Tukey’s multiple-comparisons test (Ctrl vs. Fresh, p=0.0043; Ctrl vs. Old, p=0.0127; and Fresh vs. Old, p=0.7880). (J) The number of cFos-IR positive neurons per 1000 cells in the dPAG in mice stimulated with control (n = 5), fresh saliva (n = 6), and old saliva (n = 8) swabs. One-way ANOVA (F(2, 16) = 2.136, p=0.1506). (J) The number of cFos-IR positive neurons per 1000 cells in the dPAG in mice stimulated with control (n = 5), fresh saliva (n = 6), and old saliva (n = 8) swabs. One-way ANOVA (F(2, 16) = 2.136, p=0.1506). In (C–J), the values are presented as means ± S.E.M., with individual dots representing individual mice. * and ** denote significance levels of p<0.05 and 0.01, respectively.
-
Figure 4—source data 1
Data used to generate the graphs in Figure 4.
- https://cdn.elifesciences.org/articles/92982/elife-92982-fig4-data1-v1.xlsx
Figure 4—figure supplement 1
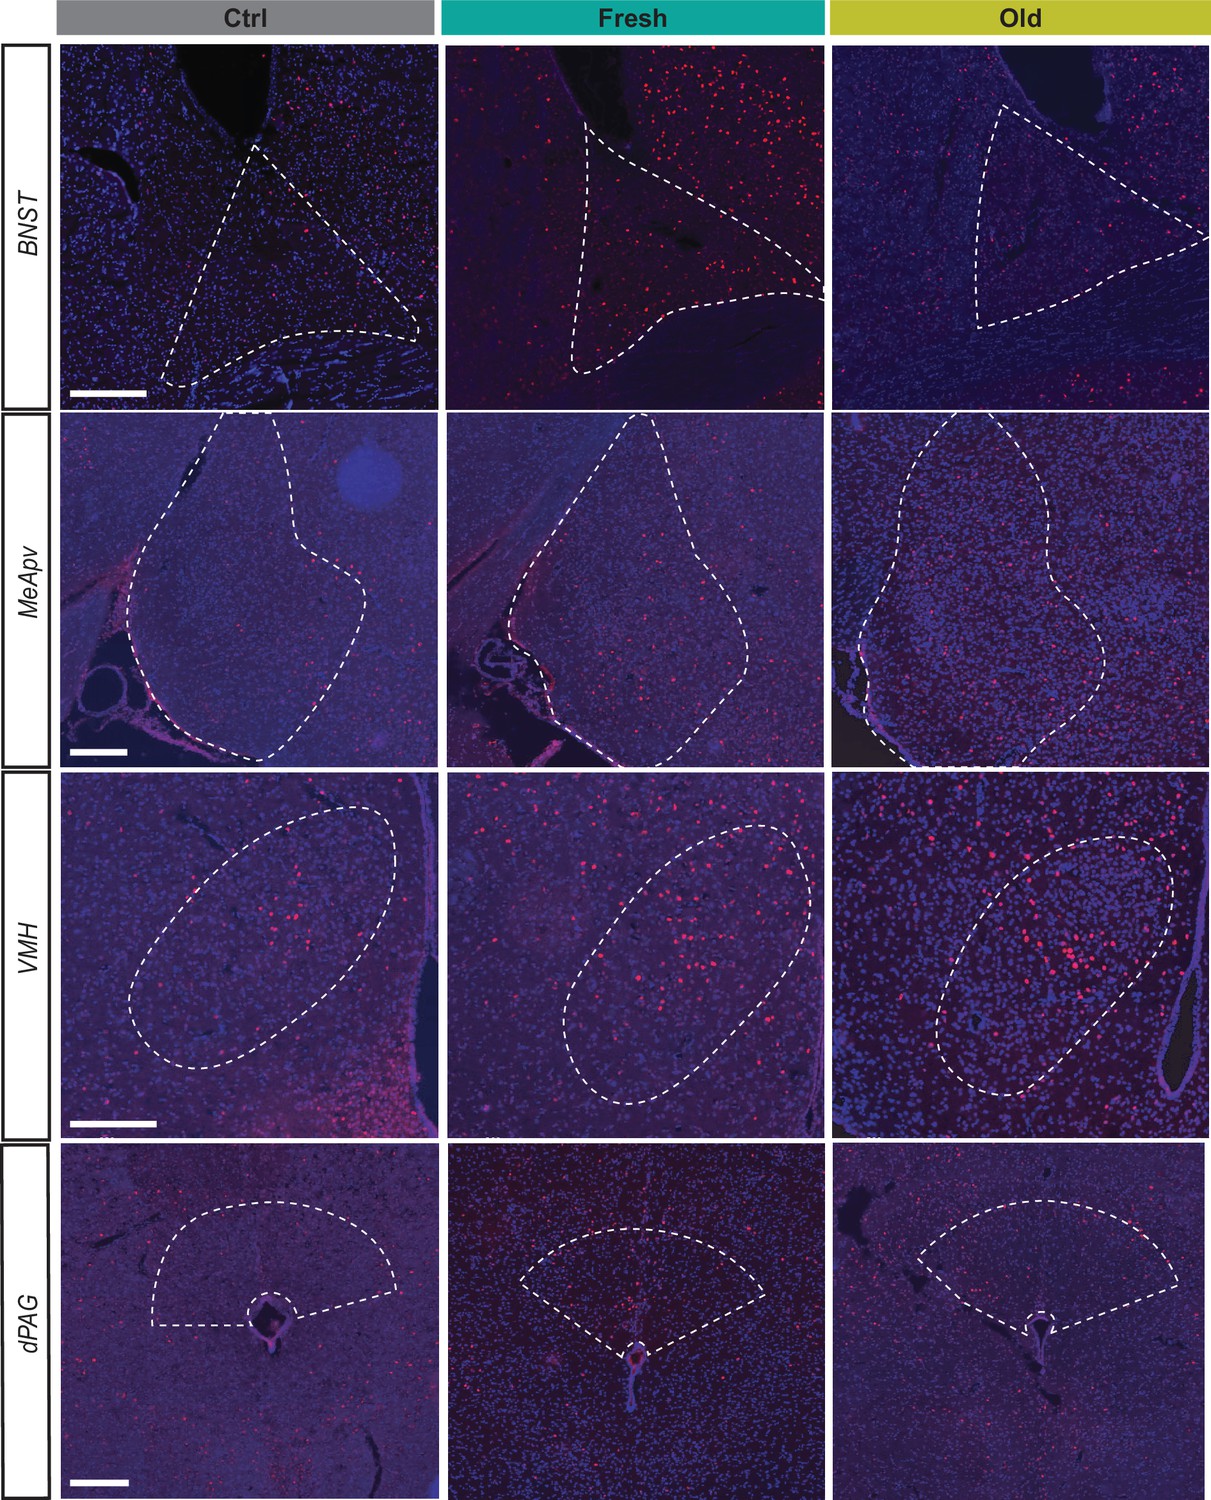
Representative images displaying the expression of cFos (red) in the BNST, MeApv, VMH, and dPAG of mice exposed to control, fresh, or old saliva swabs.
Each neural substrate is delineated by a dashed white line, defined by counterstaining with DAPI. Scale bar: 200 μm.
Figure 5
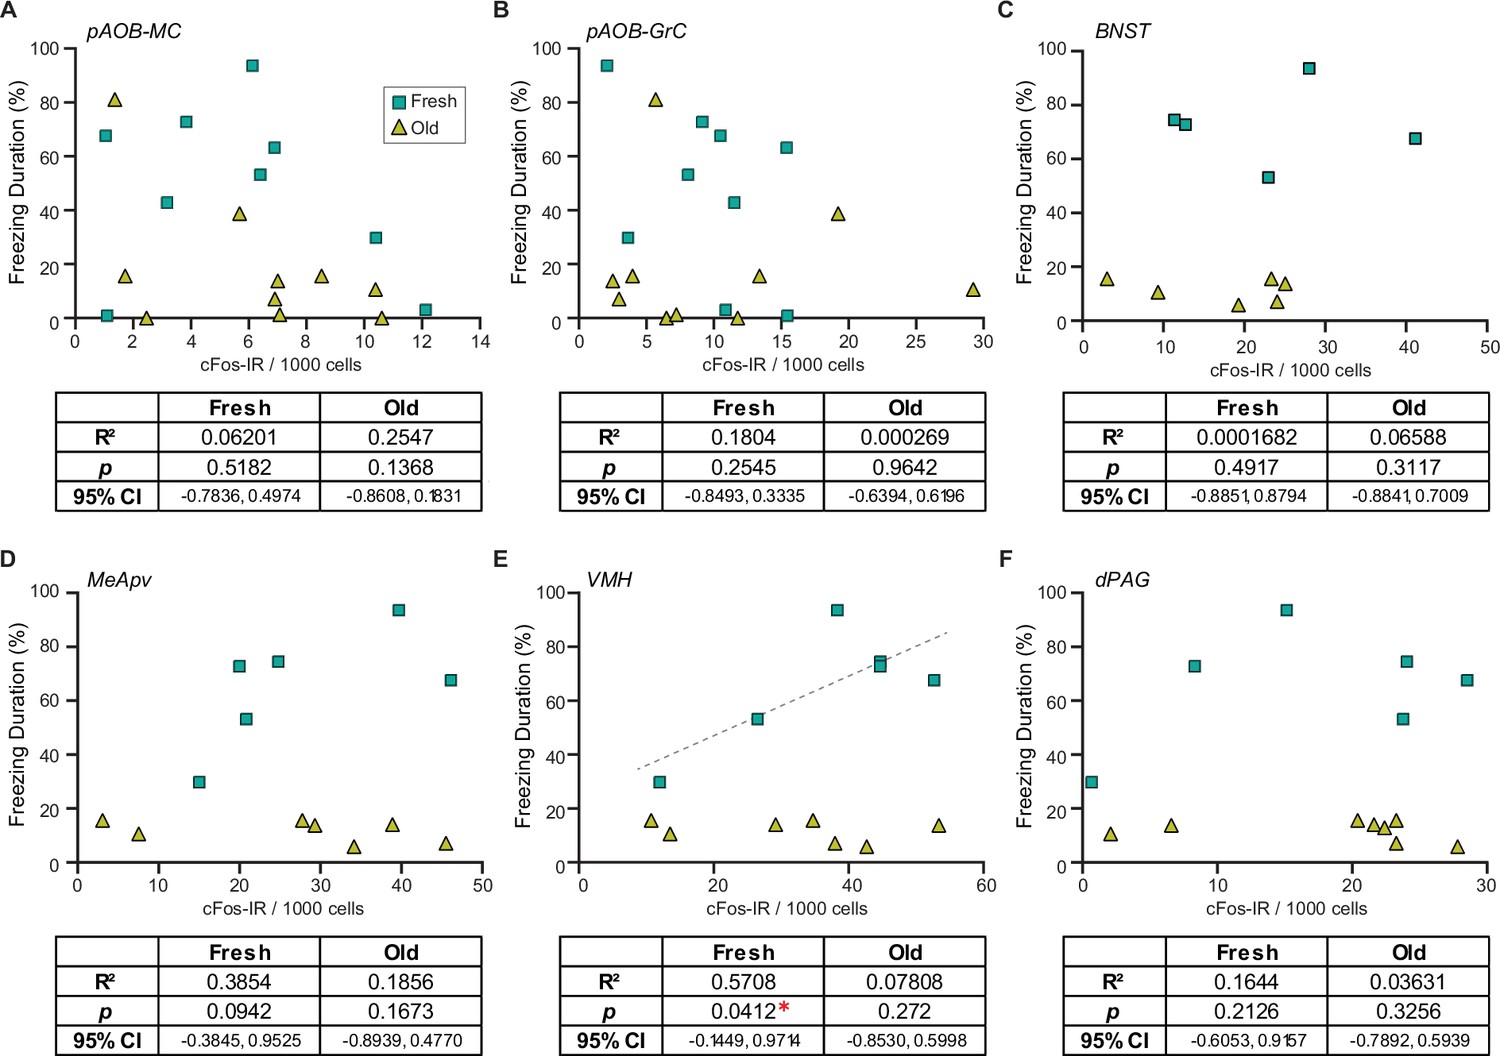
Fresh and old cat saliva differentially activate ventromedial hypothalamus (VMH) neurons to control defensive behavior.
(A–F) Percentage of the total freezing episodes as a function of the number of cFos-positive posterior accessory olfactory bulb (AOB) mitral cells (A) and granule cells (B), BNST (C), MeApv (D), VMH (E), and dPAG (F) neurons. Green, and yellow symbols represent values from mice exposed to fresh saliva and old saliva, respectively. Sample size is same as seen in Figure 4. Correlation was analyzed using Pearson correlation coefficient as data points in each group pass Shapiro–Wilk and Kolmogorov–Smirnov normality tests. Statistical results are reported in the table below each graph. * denotes statistical significance with p<0.05.
-
Figure 5—source data 1
Data used to generate the graphs in Figure 5.
- https://cdn.elifesciences.org/articles/92982/elife-92982-fig5-data1-v1.xlsx
Figure 6
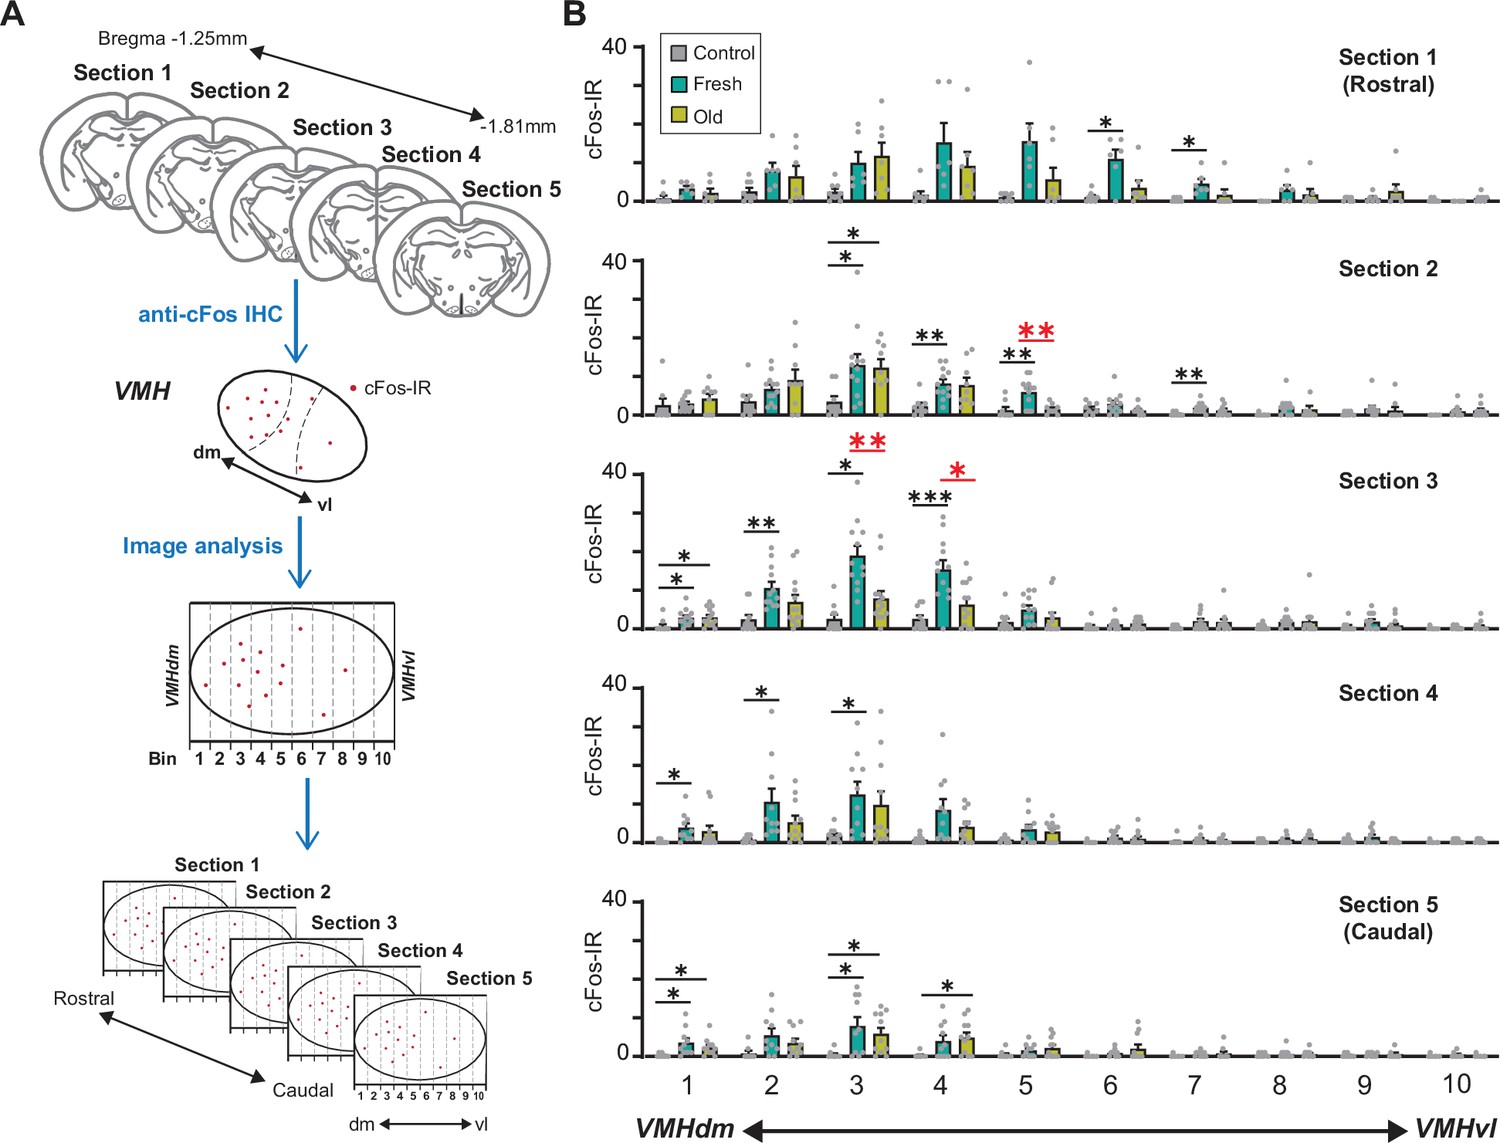
A population of ventromedial hypothalamus (VMH) neurons is more sensitive to fresh saliva than old saliva.
(A) Schematic diagram illustrating the cFos-IR distribution analysis. Each VMH region in five consecutive sections (140 μm apart) was prepared along the dorsomedial (dm)-ventrolateral (vl) axis and divided into 10 bins that are vertical to the dm-vl axis. cFos-IR signals in each bin were counted. (B) The number of cFos-IR-positive cells in each bin in the VMH hemisphere sections. Sample images are the same as seen in Figure 4 (n = 6–7 animals). The values are presented as means + S.E.M., with individual dots representing values from individual VMH hemisphere sections. Statistical analysis was performed using two-way ANOVA with Tukey’s multiple-comparisons test. Statistical results are reported in Supplementary file 1. Black * and ** denote significance levels of p<0.05 and 0.01, respectively, between control and fresh or old saliva conditions. Red * and ** denote significance levels of p<0.05 and 0.01, respectively, between fresh and old saliva conditions.
-
Figure 6—source data 1
Data used to generate the graphs in Figure 6.
- https://cdn.elifesciences.org/articles/92982/elife-92982-fig6-data1-v1.xlsx
Figure 7
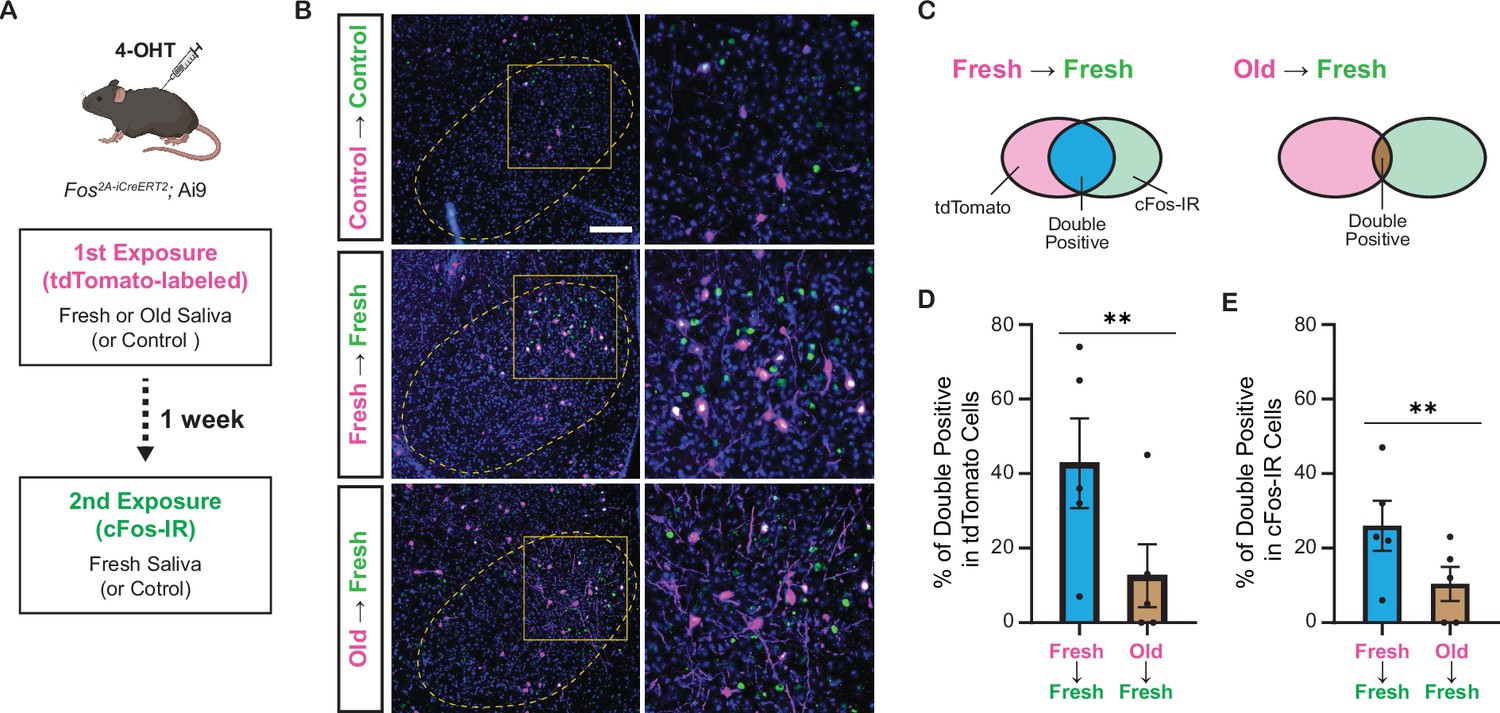
Fresh and old cat saliva activate largely different populations of ventromedial hypothalamus (VMH) neurons.
(A) Schematic diagram illustrating the double exposure experiment using Fos2A-iCreERT2; Ai9 mice to visualize the populations of neurons activated by fresh and old saliva in the same individual mouse. (B) Representative images showing tdTomato expression (magenta) and cFos-IR (green) in the VMH of mice exposed to different swabs: Control (first and second), fresh saliva (first and second), or old saliva (first), and fresh saliva (second). Overlapping signals are indicated in white. DAPI was used for nuclear counterstaining. Yellow dotted lines outline the VMH. Areas enclosed by yellow squares in the left images are enlarged in the right images. Scale bar: 100 μm. (C) Schematic diagram illustrating the color code for the graphs in (D) and (E). (D) The percentage of double-positive cells among tdTomato-expressing cells in mice exposed to fresh (first) and fresh (second) saliva (n = 5) and old (first) and fresh (second) saliva (n = 5). A permutation test (p=0.0035). (E) The percentage of double-positive cells among cFos-IR-positive cells in mice exposed to fresh (first) and fresh (second) saliva (n = 5) and old (first) and fresh (second) saliva (n = 5). A permutation test (p=0.0060). In (D) and (E), the values are presented as means ± S.E.M., with individual dots representing individual mice. ** denotes a significance level of p<0.01.
-
Figure 7—source data 1
Data used to generate the graphs in Figure 7.
- https://cdn.elifesciences.org/articles/92982/elife-92982-fig7-data1-v1.xlsx
Figure 8
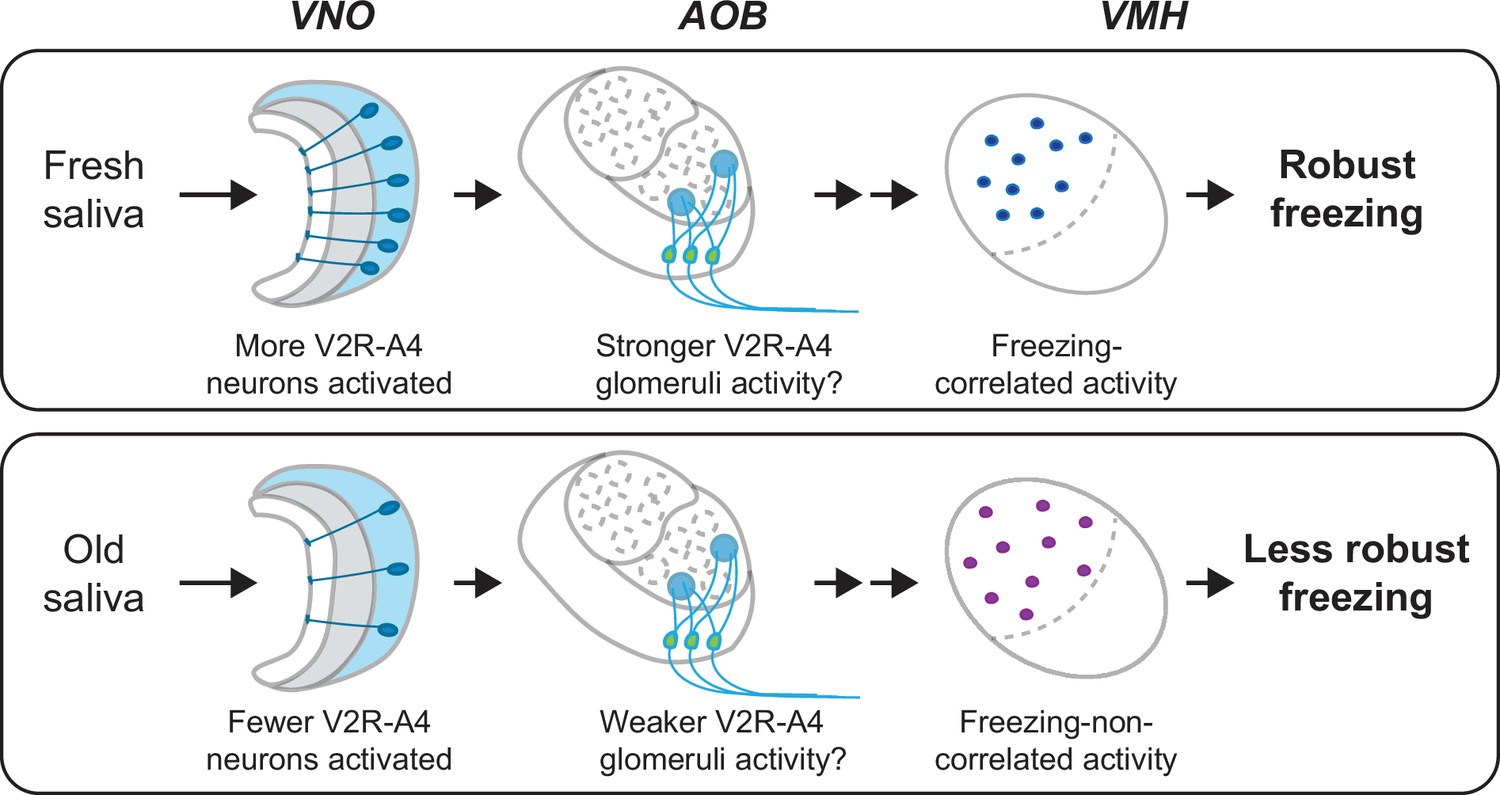
A model of the vomeronasal organ to ventromedial hypothalamus (VNO-to-VMH) pathway processing imminence of predator threat.
The circuitry is selectively activated based on the varying imminence of predator cues. Fresh saliva activates more V2R-A4-expressing VNO neurons (blue), which potentially results in stronger activation of the V2R-A4 glomeruli. This eventually triggers freezing-correlated neural activity in the VMH. In contrast, old saliva activates fewer V2R-A4-expressing VNO neurons (blue), which potentially results in weaker activation of the V2R-A4 glomeruli, leading to freezing-non-correlated activity in the VMH.
Videos
Video 1
Mouse behavior toward a control swab.
Video 2
Mouse behavior toward a swab containing fresh saliva.
Video 3
Mouse behavior toward a swab containing old saliva.
Tables
Key resources table
| Reagent type (species) or resource | Designation | Source or reference | Identifiers | Additional information |
|---|---|---|---|---|
| Genetic reagent (Mus musculus) | Trpc2 knock-out | Leypold et al., 2002 | Backcrossed for >7 generations with C57BL/6N | |
| Genetic reagent (M. musculus) | Fos2A-iCreERT2 | The Jackson Laboratory | #030323 | Backcrossed for >7 generations with C57BL/6N |
| Genetic reagent (M. musculus) | Ai9 | The Jackson Laboratory | #007909 | |
| Strain, strain background (M. musculus) | C57BL/6N | Charles River | # 027 | |
| Strain, strain background (Felis catus) | Domestic shorthair | Nutrition and Pet Care Center at the University of California, Davis | ||
| Antibody | Anti-Fel d 4 (rabbit polyclonal) | Inbio | PA-FD4 | WB (1:1000) |
| Antibody | Anti-pS6 (rabbit polyclonal) | Cell Signaling Technology | #4858 | IHC (1:200) |
| Antibody | Anti-Gαi2 (mouse monoclonal) | Cell Signaling Technology | #4858 | IHC (1:500) |
| Antibody | Anti-cFos (guinea pig polyclonal) | Synaptic Systems | #226 308 | IHC (1:1000) |
| Antibody | Horseradish peroxidase-conjugated anti-rabbit IgG | Cell Signaling Technology | #7074 | WB (1:5000) |
| Antibody | Anti-rabbit IgG, Alexa Fluor 647 | Life Technologies | #a21245 | IHC (1:500) |
| Antibody | Anti-mouse IgG2b, Alexa Fluor 546 | Life Technologies | #a21143 | IHC (1:500) |
| Antibody | Anti-guinea pig IgG, Alexa Fluor 647 | Life Technologies | #a21450 | IHC (1:500) |
| Antibody | Anti-DIG-POD | MilliporeSigma | #11207733910 | ISH (1:200) |
| Sequence-based reagent | pMAL-c2x-Fel d 4 | Papes et al., 2010 | ||
| Sequence-based reagent | pET-28a(+)-Fel d 4 | Created in this study | Details found in ‘Preparation of rFel d 4’ | |
| Sequence-based reagent | Template plasmid DNAs for V2R cRNA probe | Designed in this study | Sequence available in Supplementary file 2 | |
| Commercial assay or kit | ACTH ELISA kit | MD Bioproducts | # M046006 | |
| Commercial assay or kit | RNAscope Multiplex Fluorescent Reagent Kit v2 | ACD | #323100 | |
| Chemical compound, drug | 4-Hydroxytamoxifen | Sigma-Aldrich | #H6278 |
Additional files
-
Supplementary file 1
Statistical summary of Tukey’s multiple comparisons for Figure 1K and the two-way ANOVA with Tukey’s multiple comparisons for Figure 6B.
- https://cdn.elifesciences.org/articles/92982/elife-92982-supp1-v1.xlsx
-
Supplementary file 2
Sequence of cRNA probes for V2R subfamilies.
- https://cdn.elifesciences.org/articles/92982/elife-92982-supp2-v1.xlsx
-
MDAR checklist
- https://cdn.elifesciences.org/articles/92982/elife-92982-mdarchecklist1-v1.docx
Download links
A two-part list of links to download the article, or parts of the article, in various formats.
Downloads (link to download the article as PDF)
Open citations (links to open the citations from this article in various online reference manager services)
Cite this article (links to download the citations from this article in formats compatible with various reference manager tools)
Hypothalamic representation of the imminence of predator threat detected by the vomeronasal organ in mice
eLife 12:RP92982.
https://doi.org/10.7554/eLife.92982.4


