The non-muscle actinopathy-associated mutation E334Q in cytoskeletal γ-actin perturbs interaction of actin filaments with myosin and ADF/cofilin family proteins
- Institute for Biophysical Chemistry, Hannover Medical School, Fritz Hartmann Centre for Medical, Germany
- Department of Human Genetics, Hannover Medical School, Germany
- Division for Structural Biochemistry, Hannover Medical School, Germany
- RESiST, Cluster of Excellence 2155, Hannover Medical School, Germany
Figures
Figure 1 with 2 supplements

Analysis of actin folding, thermal stability, and nucleotide exchange.
(A) Homology model of human cytoskeletal γ-actin (based on PDB ID: 2BTF). Subdomains (SDs) of actin are colored in gray (SD1), dark gray (SD2), light green (SD3), and green (SD4). The hinge region encompassing residues 137–145 and 333–338 is colored in blue. The mutant residue E334 is shown as an orange sphere. (B) Inhibition of DNase I activity by monomeric γ-actin WT and p.E334Q. Data is the mean of three individual experiments ± SD. A Hill equation was fitted to the data, which yields the half-maximal inhibitory concentration (IC50, Table 1). (C) The protein denaturation temperature of monomeric and filamentous p.E334Q and WT actin were determined by differential scanning fluorimetry (DSF). Representative experimental traces are shown. The protein denaturation temperature is derived from the peak of the melting curve (Table 1) (p.E334Q [G-actin], N = 3; WT [G-actin], N = 5; p.E334Q [F–actin], N = 5; WT [F–actin], N = 5). (D) Nucleotide exchange rates (k-T,k-D) were determined for monomeric p.E334Q and γ-actin WT using fluorescently labeled ATP (ε-ATP) (p.E334Q, N = 18; WT, N = 21) and ADP (ε-ADP) (p.E334Q, N = 11; WT, N = 11) Representative experimental traces are shown. Rates were determined by fitting a single-exponential function to the data (Table 1).
Figure 1—figure supplement 1
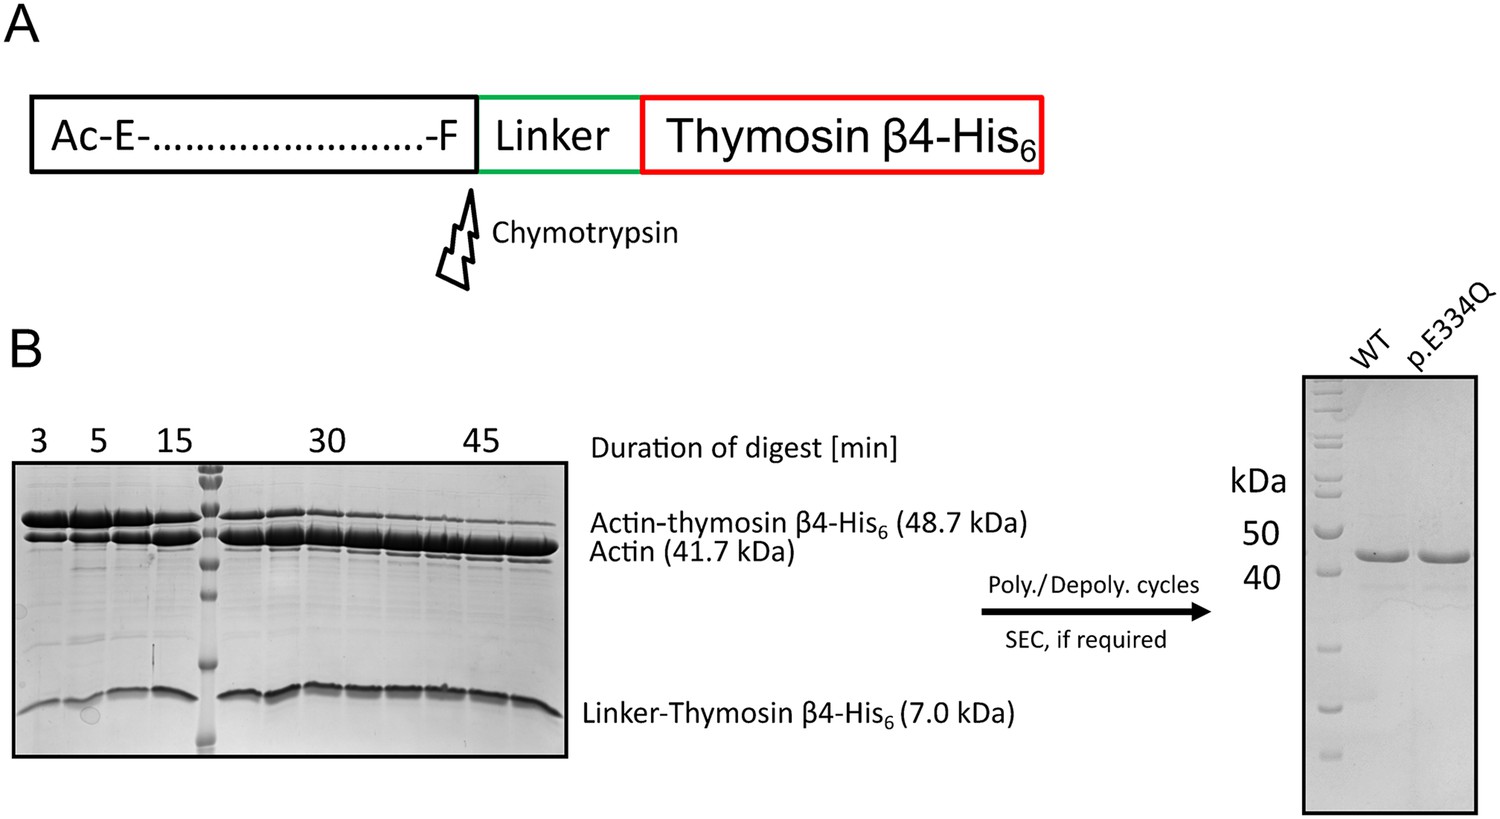
Purification of recombinant WT and p.E334Q γ-actin from Spodoptera frugiperda (Sf-9).
(A) Recombinant WT and p.E334Q γ-actin were produced in the form of actin–thymosin β4-His6 fusion proteins. The C-terminal linker and tag sequence are removed by chymotrypsin-mediated cleavage after the C-terminal residue of the native γ-actin sequence (Phe). (B) Exemplary polyacrylamide gels from different stages of the purification. Left gel: the actin–thymosin β4-His6 fusion protein is digested by treatment with chymotrypsin. The digest is stopped by treatment with PMSF. Time of digest strongly depends on the age and the batch of chymotrypsin and was determined by multiple test digests for each actin preparation. For the preparation pictured here, the fusion protein was digested for 50 min with a (w/w) ratio of 1:300 (chymotrypsin:actin). Molecular weight marker: PageRuler Prestained (Thermo Fisher Scientific, Waltham, MA) (see also Figure 1—figure supplement 1—source data 1). Right gel: after the digest was stopped, the actin was subjected to polymerization/depolymerization cycles and, if necessary, size-exclusion chromatography to obtain the final product. Molecular weight marker: PageRuler Unstained (Thermo Fisher Scientific) (see also Figure 1—figure supplement 1—source data 2 and 3).
-
Figure 1—figure supplement 1—source data 1
Scan of the SDS gel (left gel) shown in Figure 1—figure supplement 1.
- https://cdn.elifesciences.org/articles/93013/elife-93013-fig1-figsupp1-data1-v1.zip
-
Figure 1—figure supplement 1—source data 2
Scan of the SDS gel (right gel) shown in Figure 1—figure supplement 1.
- https://cdn.elifesciences.org/articles/93013/elife-93013-fig1-figsupp1-data2-v1.zip
-
Figure 1—figure supplement 1—source data 3
Additional SDS gel of the same protein samples.
- https://cdn.elifesciences.org/articles/93013/elife-93013-fig1-figsupp1-data3-v1.zip
Figure 1—figure supplement 2
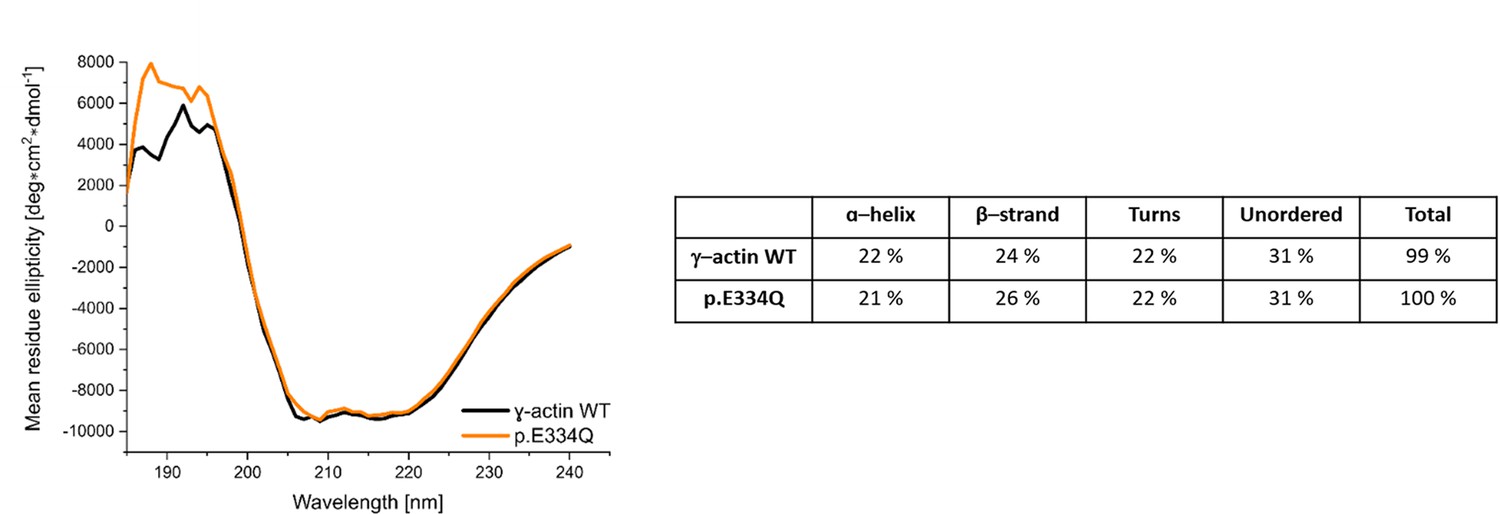
Circular dichroism (CD) spectra of γ-actin WT and p.E334Q protein.
Shown are the smoothed (Savitsky–Golay) and averaged spectra with the averaged buffer spectrum subtracted. The depicted secondary structure composition of γ-actin WT and p.E334Q protein was determined by using the DichroWeb online platform.
Figure 2

Analysis of the polymerization capacity of WT and p.E334Q γ-actin in the absence and presence of human Arp2/3 complex.
(A) Polymerization of p.E334Q and WT γ-actin (1 µM, 10% Atto 655 labeled) was induced by salt shift and the progression of the reaction was tracked by total internal reflection fluorescence (TIRF) microscopy. Shown are representative micrographs at the indicated points in time. Scale bar corresponds to 10 µm. (B) The elongation rates of individual filaments were determined by manual tracking of the elongating barbed ends of the filaments. Every data point represents an individual filament (WT: n = 128 filaments; p.E334Q: n = 114 filaments). Data is shown as the mean ± SEM. (C) Nucleation efficiencies were determined by monitoring changes in the number of filaments over the time of the polymerization experiments. The solid lines and shades represent the mean ± SD of four individual experiments. (D) TIRF microscopy-based observation of human Arp2/3 complex-mediated differences in the salt-induced polymerization of p.E334Q and WT γ-actin (1 µM, 10% Atto 655 labeled). Shown are representative micrographs at the indicated points in time. For both WT and p.E334Q γ-actin, the formation of the first branch points was observed after 250 s in the presence of 0.01 nM Arp2/3. Scale bar corresponds to 10 µm. N = 3 for each Arp2/3 concentration .(E) Pyrene-based polymerization experiment of 2 µM γ-actin WT, p.E334Q actin, or a 1:1 mixture of both (5% pyrene labeled) in the absence and presence of Arp2/3. Shown are representative traces. The solid lines/shades represent the mean ± SD of at least three individual experiments. (F) Bulk polymerization rates determined from the experiments shown in (E). Data is shown as the mean ± SD of all performed experiments. N = 3 for each Arp2/3 concentration. N = 12 for all experiments performed in the absence of Arp2/3. Individual kobs values and differences with statistical significance are summarized in Table 1.
Figure 3 with 1 supplement

In silico analysis of the effects of the E334Q mutation on the actin–cofilin interaction.
(A) Human homology model of a cytoskeletal γ-actin filament partially decorated with cofilin-1 (model based on PDB ID: 6UC4). Cofilin-1 is colored magenta, actin monomers are depicted in light blue, and the actin residue E334 is colored orange. (B) Closeup showing the details of the van der Waals interaction between E334 and cofilin residue L111 on the pointed end side. The length of the dotted line between the side chains of actin-E334 and cofilin-L111 corresponds to 3.1 Å in our model. (C) The change in surface charge at the actin–cofilin interaction interface introduced by mutation E334Q is visualized by coulombic surface coloring.
Figure 3—figure supplement 1
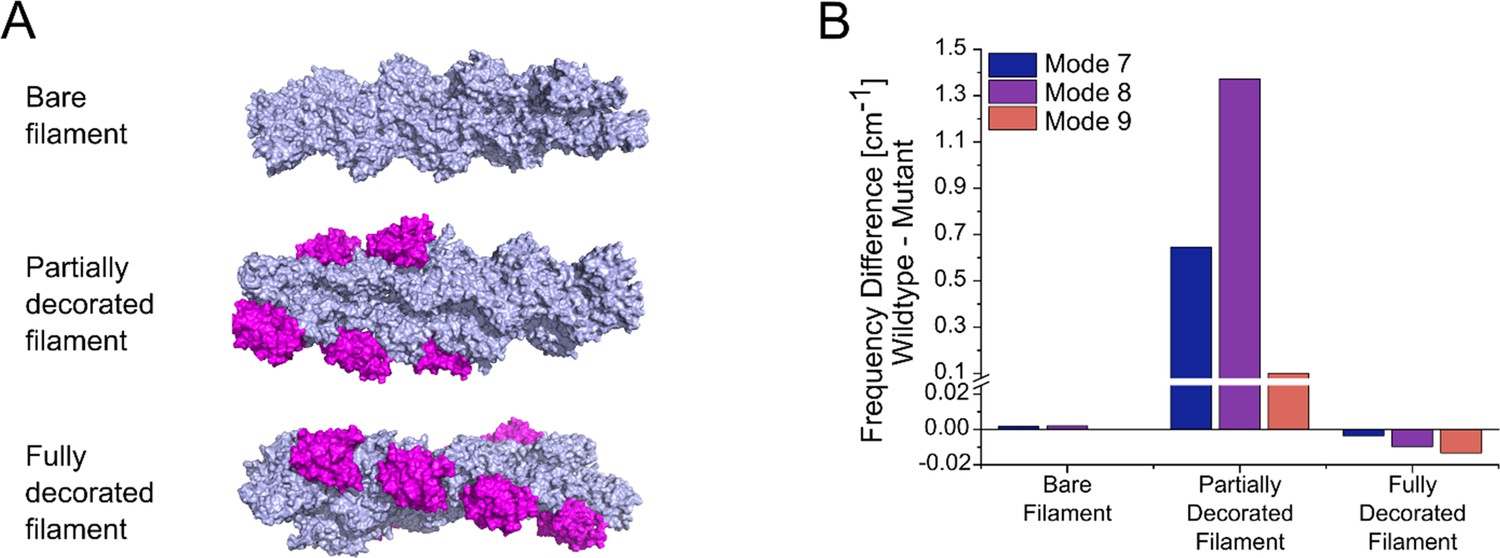
Normal mode analysis of changes induced by mutation E334Q in the global mobility of bare, partially, and a fully cofilin-1 decorated γ-actin mini-filaments.
(A) Models of a bare γ-actin mini-filament, a partially and a fully cofilin-1 decorated γ-actin mini-filament were generated for normal mode analysis. Each mini-filament consists of nine actin monomers. Actin is colored light blue and cofilin-1 magenta. (B) Significant differences in the global mobility of the different types of mini–filaments shown in panel (A), containing either WT or mutant cytoskeletal γ-actin, were only observed in the case of partial cofilin-1 decoration. Large differences are observed for partially decorated filaments in modes 7, 8, and 9, which are the global motions with the lowest frequencies.
Figure 4 with 6 supplements
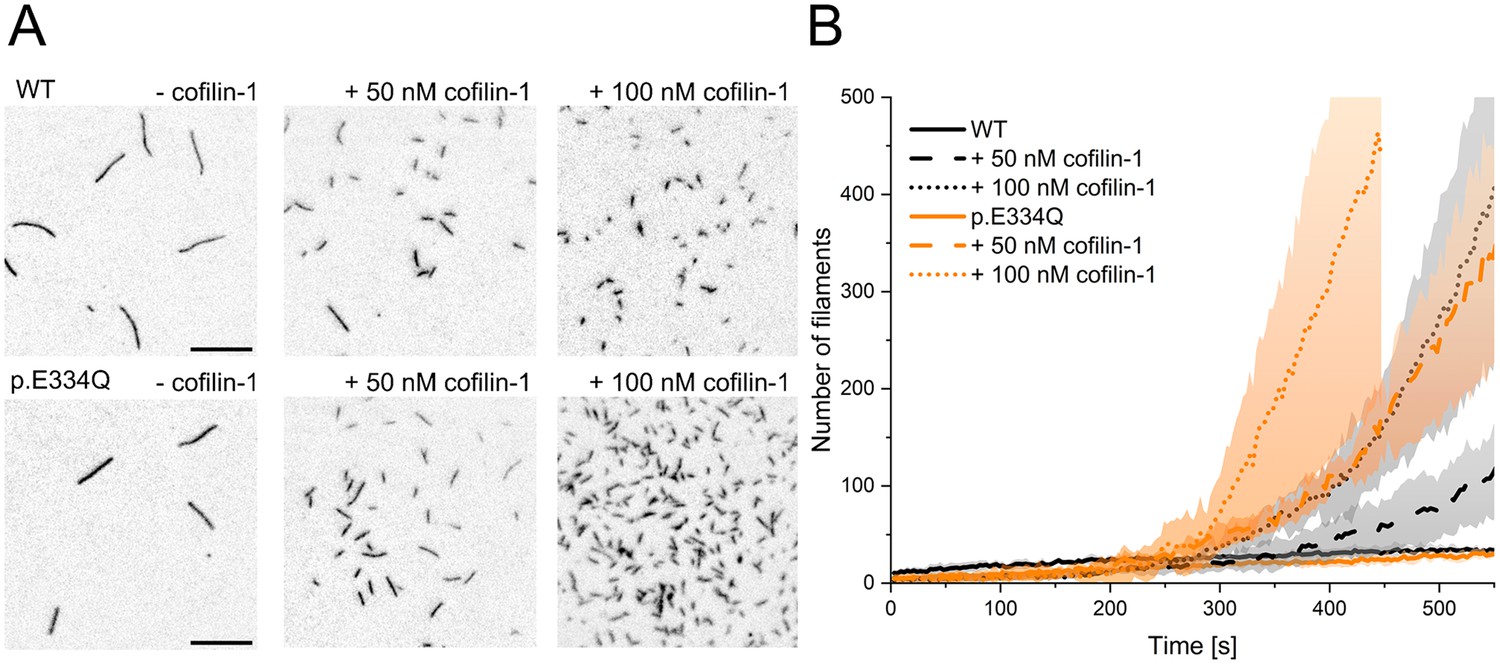
Analysis of the effect of cofilin-1 on the spontaneous polymerization of WT and p.E334Q γ-actin.
(A) Total internal reflection fluorescence (TIRF) microscopy-based observation of cofilin-1-mediated differences in the salt-induced polymerization of p.E334Q and WT γ-actin (1 µM, 10% Atto 655 labeled). Shown are representative micrographs 450 s after induction of polymerization. Scale bar corresponds to 10 µm. (B) Time dependence of the increase in filaments observed by TIRF microscopy. The solid and dotted lines and shades represent the mean ± SD of three individual experiments.
Figure 4—video 1
Polymerization of 1 µM WT γ-actin (10% Atto 655 labeled) visualized by total internal reflection fluorescence (TIRF) microscopy.
Figure 4—video 2
Polymerization of 1 µM WT γ-actin (10% Atto 655 labeled) in the presence of 50 nM cofilin-1 visualized by total internal reflection fluorescence (TIRF) microscopy.
Figure 4—video 3
Polymerization of 1 µM WT γ-actin (10% Atto 655 labeled) in the presence of 100 nM cofilin-1 visualized by total internal reflection fluorescence (TIRF) microscopy.
Figure 4—video 4
Polymerization of 1 µM p.E334Q γ-actin (10% Atto 655 labeled) visualized by total internal reflection fluorescence (TIRF) microscopy.
Figure 4—video 5
Polymerization of 1 µM p.E334Q γ-actin (10% Atto 655 labeled) in the presence of 50 nM cofilin-1 visualized by total internal reflection fluorescence (TIRF) microscopy.
Figure 4—video 6
Polymerization of 1 µM p.E334Q γ-actin (10% Atto 655 labeled) in the presence of 100 nM cofilin-1 visualized by total internal reflection fluorescence (TIRF) microscopy.
Figure 5 with 2 supplements
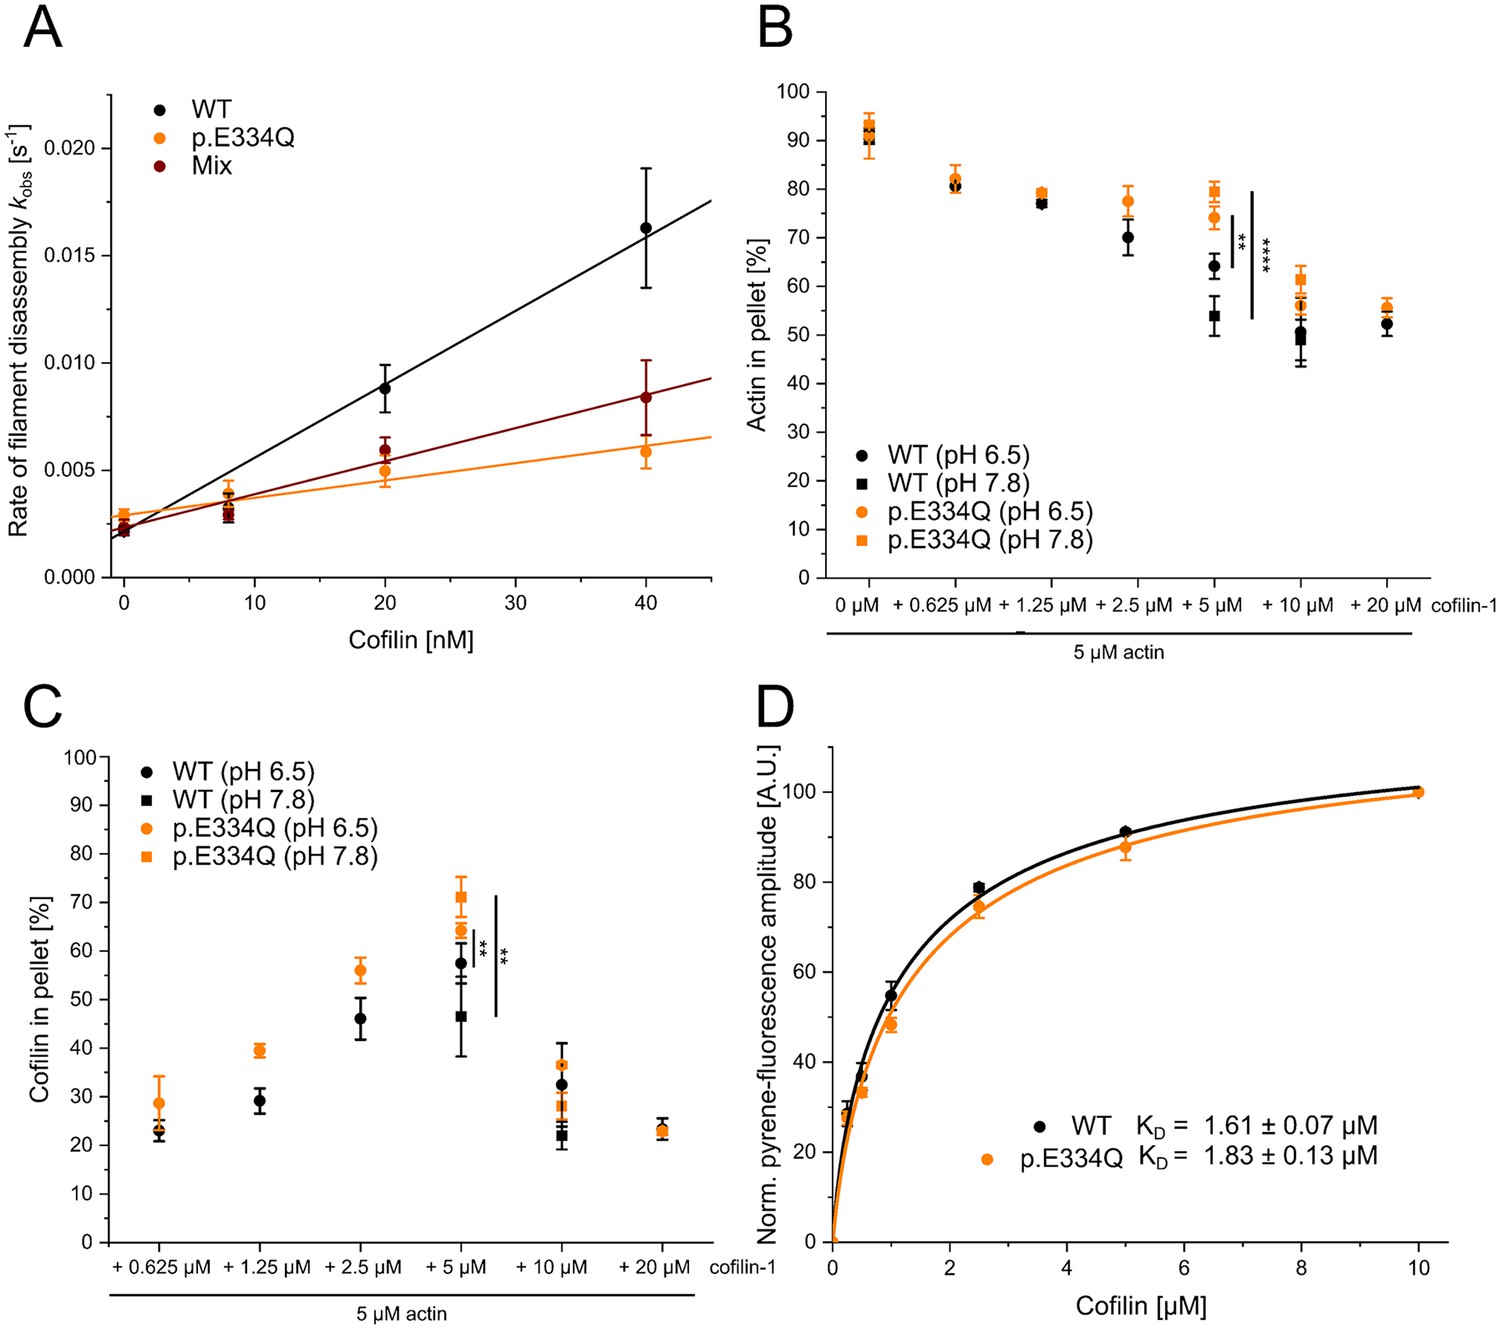
Analysis of the interaction of filamentous WT and p.E334Q γ-actin with cofilin-1.
(A) Pyrene-based dilution-induced depolymerization experiments (5% pyrene-labeled actin) were used to quantify the impact of cofilin-1 on the disassembly of filaments formed by p.E334Q, WT, and a 1:1 mixture of p.E334Q and WT γ-actin. Depolymerization was induced by adding G-buffer (pH 7.8). Representative experimental traces showing the decrease in pyrenyl fluorescence over time are given in Figure 5—figure supplement 1. The observed values of the rate constants show a linear dependence on the cofilin-1 concentration in the range of 0–40 nM, with the slopes corresponding to the apparent second-order rate constant (kC) for cofilin-1-induced depolymerization. Values for kC are summarized in Table 1. Data is shown as the mean ± SD of 8–14 individual experiments. (B, C) In addition, cofilin-1 binding to actin filaments and cofilin-1-mediated filament disassembly at different pH values (pH 6.5, pH 7.8) was investigated in co–sedimentation experiments. Data is shown as mean ± SD. N = 6 for experiments performed at pH 7.8. N = 7 for experiments performed at pH 6.5 in the absence of cofilin. N = 3 for experiments performed at pH 6.5 in the presence of cofilin. (D) The dissociation equilibrium constant (KD) for binding of cofilin-1 to pyrene-labeled WT or p.E334Q filaments was determined by monitoring the change in fluorescence amplitude upon cofilin-1 binding. Data is shown as the mean ± SD. N = 8 for WT, N = 9 for p.E334Q.
Figure 5—figure supplement 1
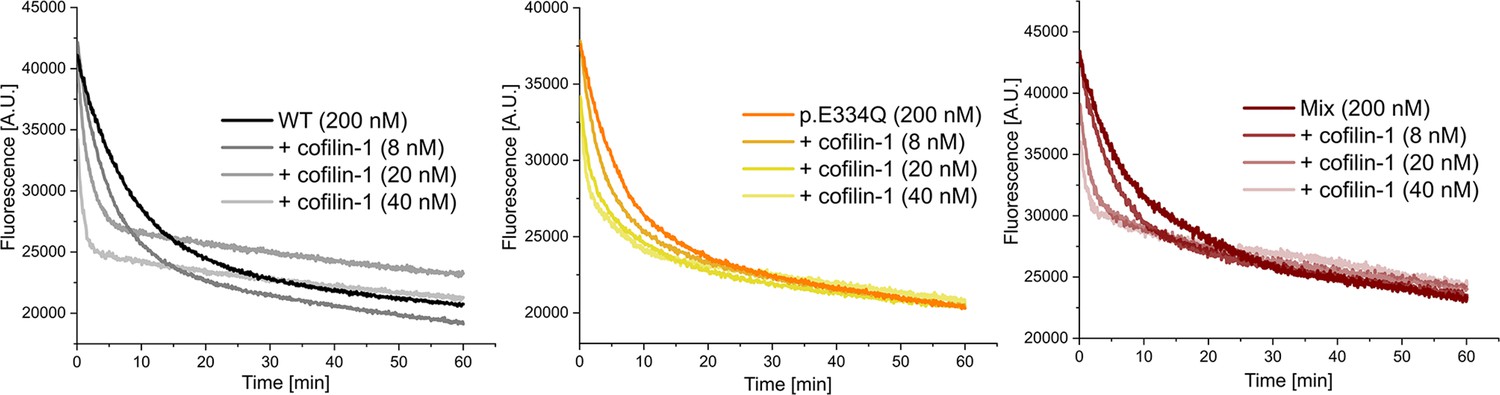
Exemplary traces of dilution-induced depolymerization experiments in the absence and presence of increasing concentrations of human cofilin-1.
Figure 5—figure supplement 2
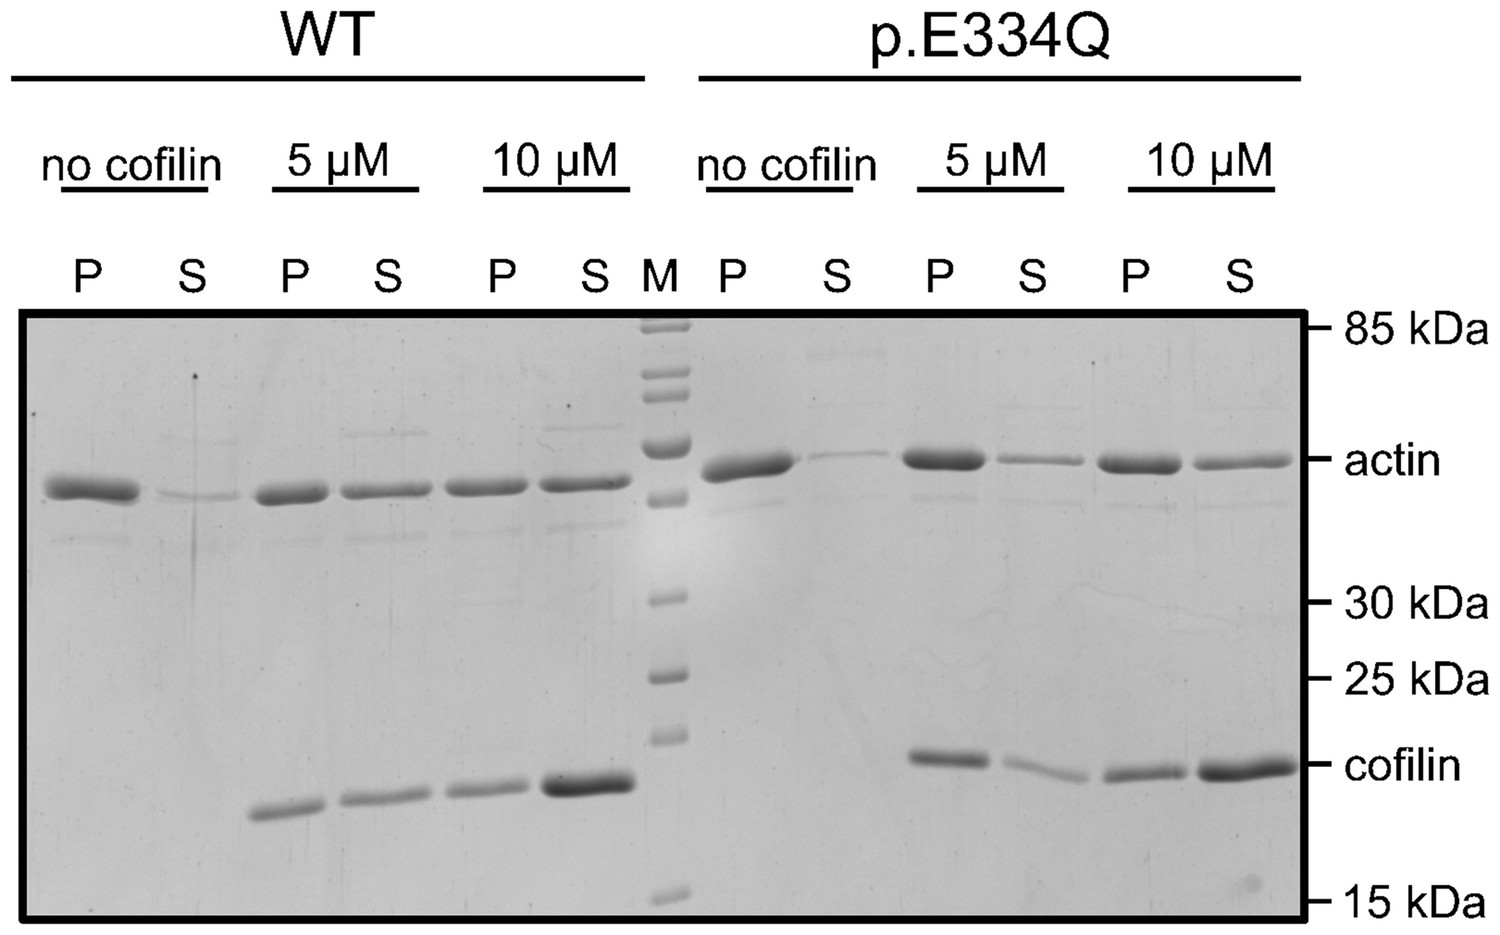
Exemplary polyacrylamide gel showing a co-sedimentation experiment performed with 5 µM WT and p.E334Q γ-actin in the absence and presence of 5 µM or 10 µM cofilin-1 at pH 7.8 (see also: Figure 5—figure supplement 2—source data 1).
-
Figure 5—figure supplement 2—source data 1
Scan of the SDS gel shown in Figure 5—figure supplement 2.
- https://cdn.elifesciences.org/articles/93013/elife-93013-fig5-figsupp2-data1-v1.zip
Figure 6 with 1 supplement
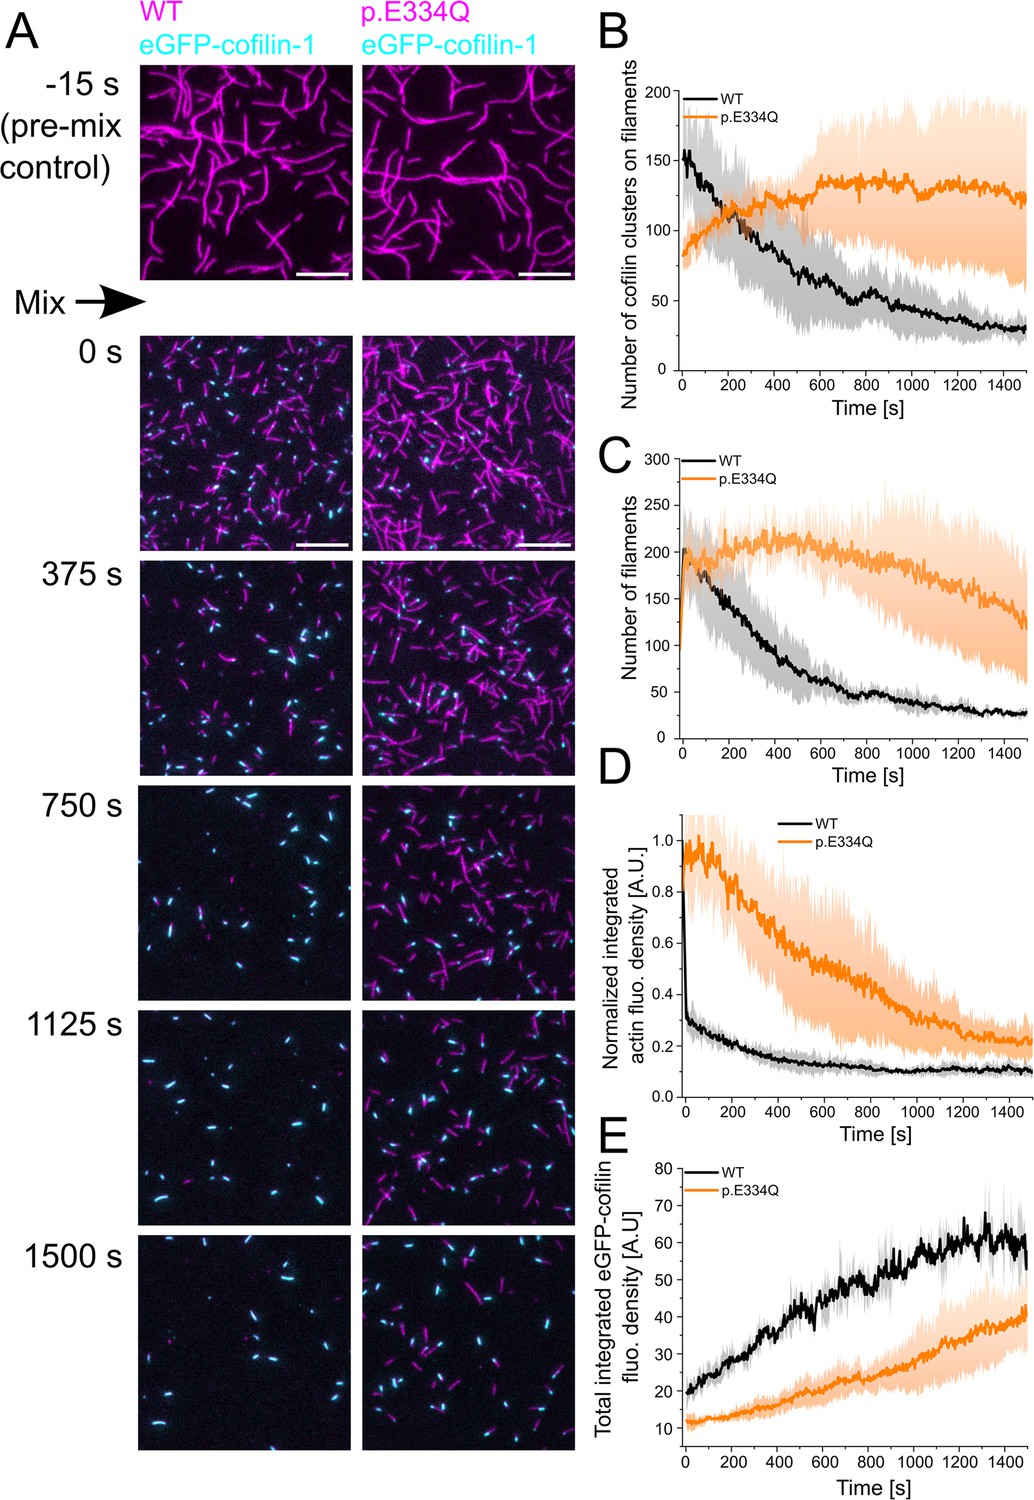
Analysis of the interaction of WT and p.E334Q γ-actin with eGFP-cofilin-1.
(A) The disassembly of 300 nM ‘aged’ WT and p.E334Q F-actin (10% Atto 655 labeled, capped by CP) in the presence of 100 nM eGFP-cofilin-1 was visualized using two-color total internal reflection fluorescence (TIRF) microscopy. F-actin is shown in magenta, eGFP-cofilin in cyan. Shown are representative micrographs at the indicated time points. Scale bar corresponds to 10 µm. (B) Time dependence of the change in the number of eGFP-cofilin-1 clusters on actin filaments. The solid lines and shades represent the mean ± SD of three individual experiments. (C) Time dependence of the decrease in filament count. The solid lines and shades represent the mean ± SD of three individual experiments. (D) Temporal tracking of actin filament disassembly by monitoring changes in total actin fluorescence per image frame. The solid lines and shades represent the mean ± SD of three individual experiments. (E) Visualization of temporal changes in the abundance of eGFP-cofilin-1 clusters based on monitoring total eGFP-cofilin-1 fluorescence per image frame. The solid lines and shades represent the mean ± SD of three individual experiments.
Figure 6—figure supplement 1
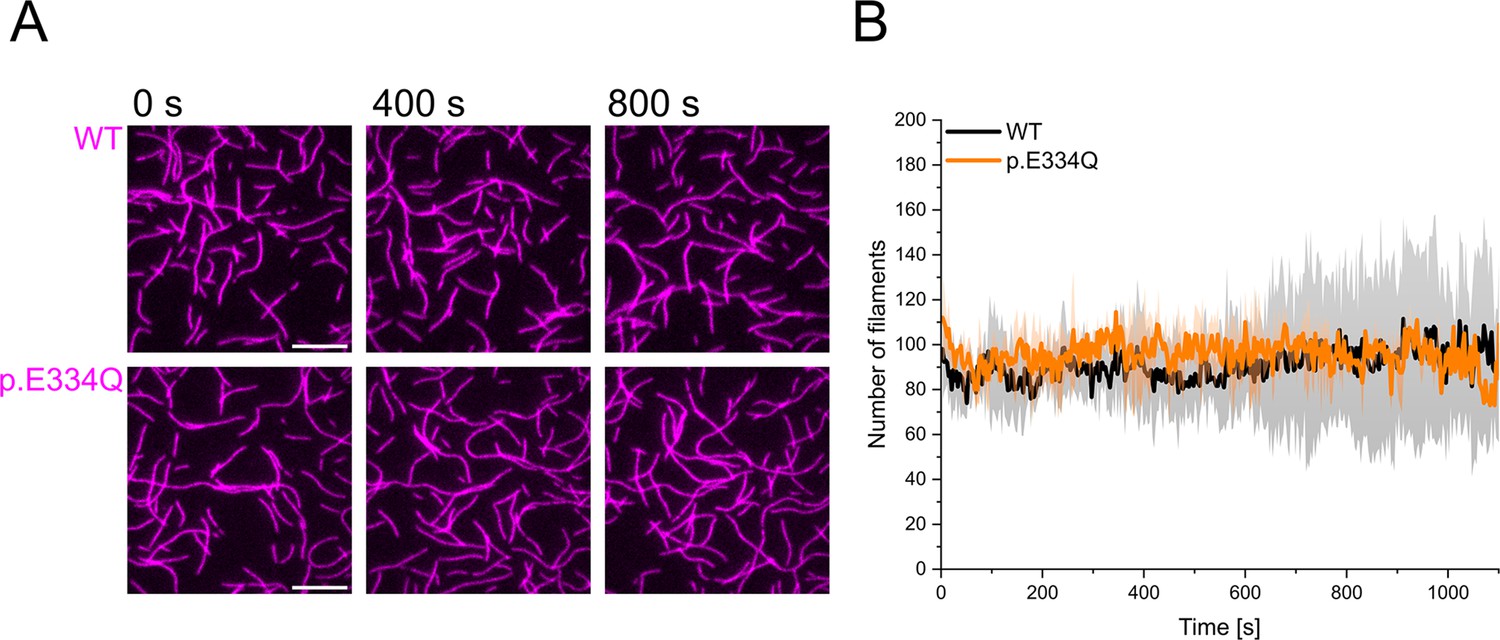
Control experiments showing that E334Q and WT γ-actin filaments are stable over a period of 1000s.
(A) 300 nM ‘aged’ WT and p.E334Q F-actin (10% Atto 655 labeled, capped by CP) was visualized using total internal reflection fluorescence (TIRF) microscopy. Shown are representative micrographs at the indicated time points. Scale bar corresponds to 10 µm. (B) Quantification of the number of actin filaments over the time of the experiment. The solid lines and shades represent the mean ± SD of 2–3 individual experiments.
Figure 7

In silico analysis of the effects of the E334Q mutation on the actin–myosin interaction.
(A) Contact region between the cardiomyopathy (CM) loop of NM2C (blue) and residue E334 (orange) in cytoskeletal γ-actin (PDB ID: 5JLH) (von der Ecken et al., 2016). Actin interacts with a core contact triad in the myosin CM loop, which in the case of NM2C consists of lysine K429 and hydrophobic residues I420 and V427. (B) Multiple-sequence alignment of the CM loop of selected cytoskeletal myosin isoforms. The alignment shows complete sequence identity for NM2C, NM2A, and conservation of residues contributing to the core contact triad in class 5, class 19, and selected members of class 1 myosins (blue boxes). Residue numbering refers to the NM2C primary structure. (C) Mutation E334Q leads to a weakening of complementary electrostatic interactions. The interaction interface involving the CM loop of NM2C and the region affected by the mutation on cytoskeletal γ-actin is visualized by coulombic surface coloring. Positive potentials are shown in blue, and negative potentials in red.
Figure 8 with 6 supplements
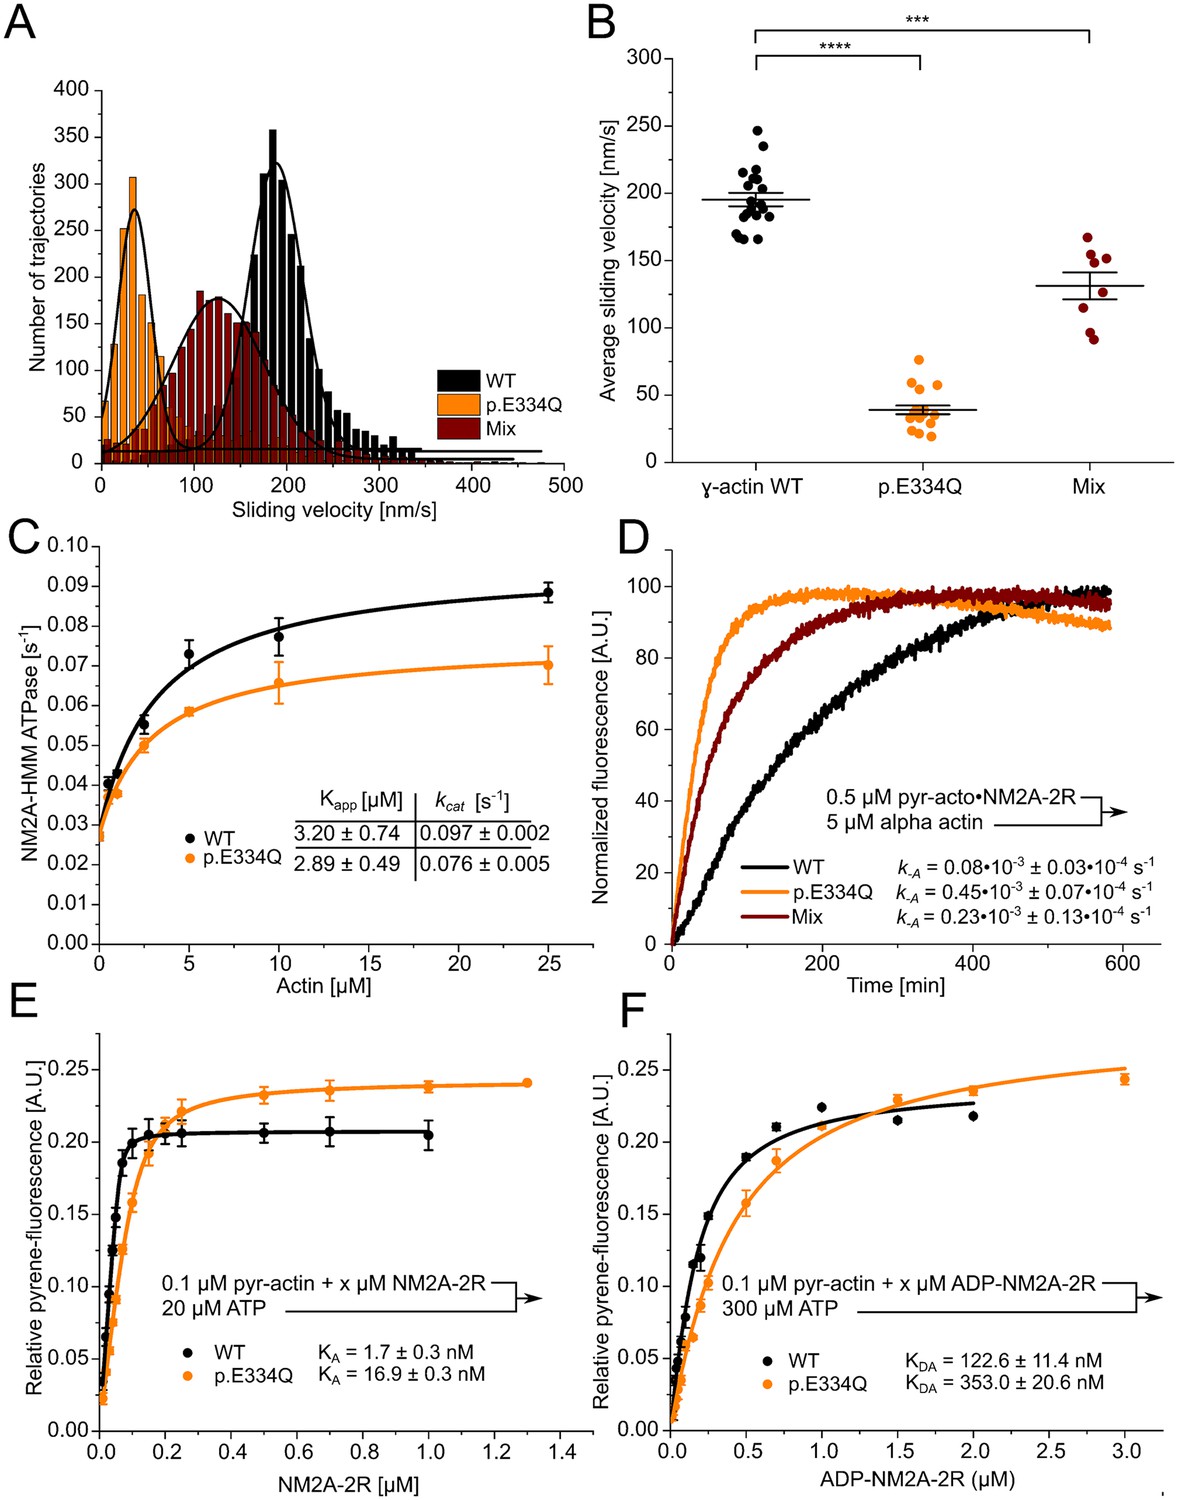
Analysis of the interaction of human NM2A with WT and p.E334Q γ-actin.
(A) The interaction of surface-immobilized NM2A-HMM with WT γ-actin filaments, p.E334Q γ-actin filaments, and heterofilaments (1:1 mixture) was analyzed using the unloaded in vitro motility assay. Representative velocity distributions are obtained from recorded trajectories of WT and mutant filaments in a single experiment. The average sliding velocity of the filaments in each experiment was determined by applying a Gaussian fit (black line) to the obtained velocity distributions. (B) Secondary plot of all measured sliding velocities. Each data point represents a single experiment (N = 20 for WT filaments, N = 18 for p.E334Q filaments, N = 8 for heterofilaments) in which the sliding velocities of a minimum of 600 filaments have been analyzed. The average sliding velocity in each experiment was determined as described in (A). Data is shown as the mean ± SEM. (C) The ability of p.E334Q and WT filaments to activate the NM2A-HMM ATPase was analyzed using a NADH-coupled enzymatic assay. The data is best described by a hyperbolic fit that yields Kapp (apparent Km for actin) and kcat (maximal turnover). Data is shown as the mean ± SD of three individual experiments. (D) Determination of the dissociation rate constant (k–A) for the interaction of NM2A-2R with p.E334Q or WT γ-actin in the absence of nucleotide. k-A was determined in displacement experiments by chasing pyrene-labeled acto•NM2C-2R with a large excess of unlabeled F-actin. Shown are representative traces. The shown k-A values are the results of 5–11 individual experiments. Data were fitted using a single exponential function. (E, F) The affinity of WT and p.E334Q γ-actin for NM2A-2R in the absence (KA) and presence of saturating ADP concentrations (KDA) was determined using the method developed by Kurzawa and Geeves, 1996. Increasing concentrations of myosin were dissociated from pyrene-labeled WT or p.E334Q F-actin by mixing the complex with excess ATP. The obtained fluorescence amplitudes of the individual transients were plotted against the corresponding myosin concentrations. A quadratic equation (see ‘Materials and methods’) was fitted to the data, which yields the respective affinity. Data is shown as the mean ± SD of three individual experiments.
Figure 8—figure supplement 1
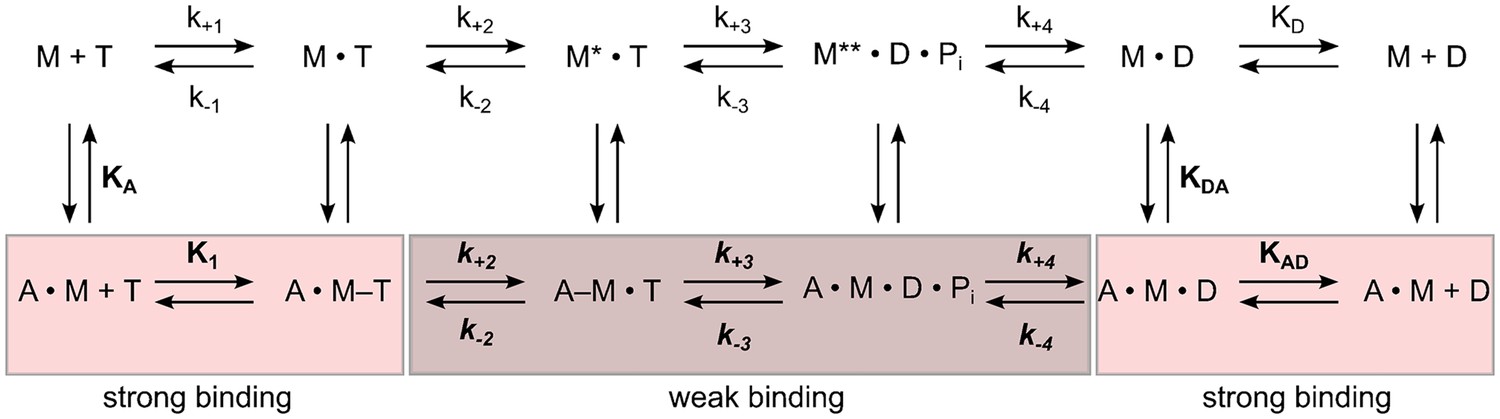
Schematic representation of the basic reaction pathway of myosin- and actomyosin-catalyzed ATP hydrolysis and ATP conversion.
The notation for the description of the kinetic parameters shows rate constants in italics and equilibrium constants in normal type; the notation distinguishes between the constants in the presence and absence of F-actin by using boldface (k+1 and K1) versus normal type (k+1 and K1); subscripts A and D refer to actin (KA) and ADP (KD), respectively. KA represents the affinity of myosin for F-actin, KD the affinity of ADP for myosin, KAD the affinity of ADP for the actomyosin complex, and KDA the affinity of actin for myosin in the presence of saturating [ADP]. M refers to myosin and Pi to inorganic phosphate. The asterisk represents different conformational states of the myosin motor domain.
Figure 8—figure supplement 2
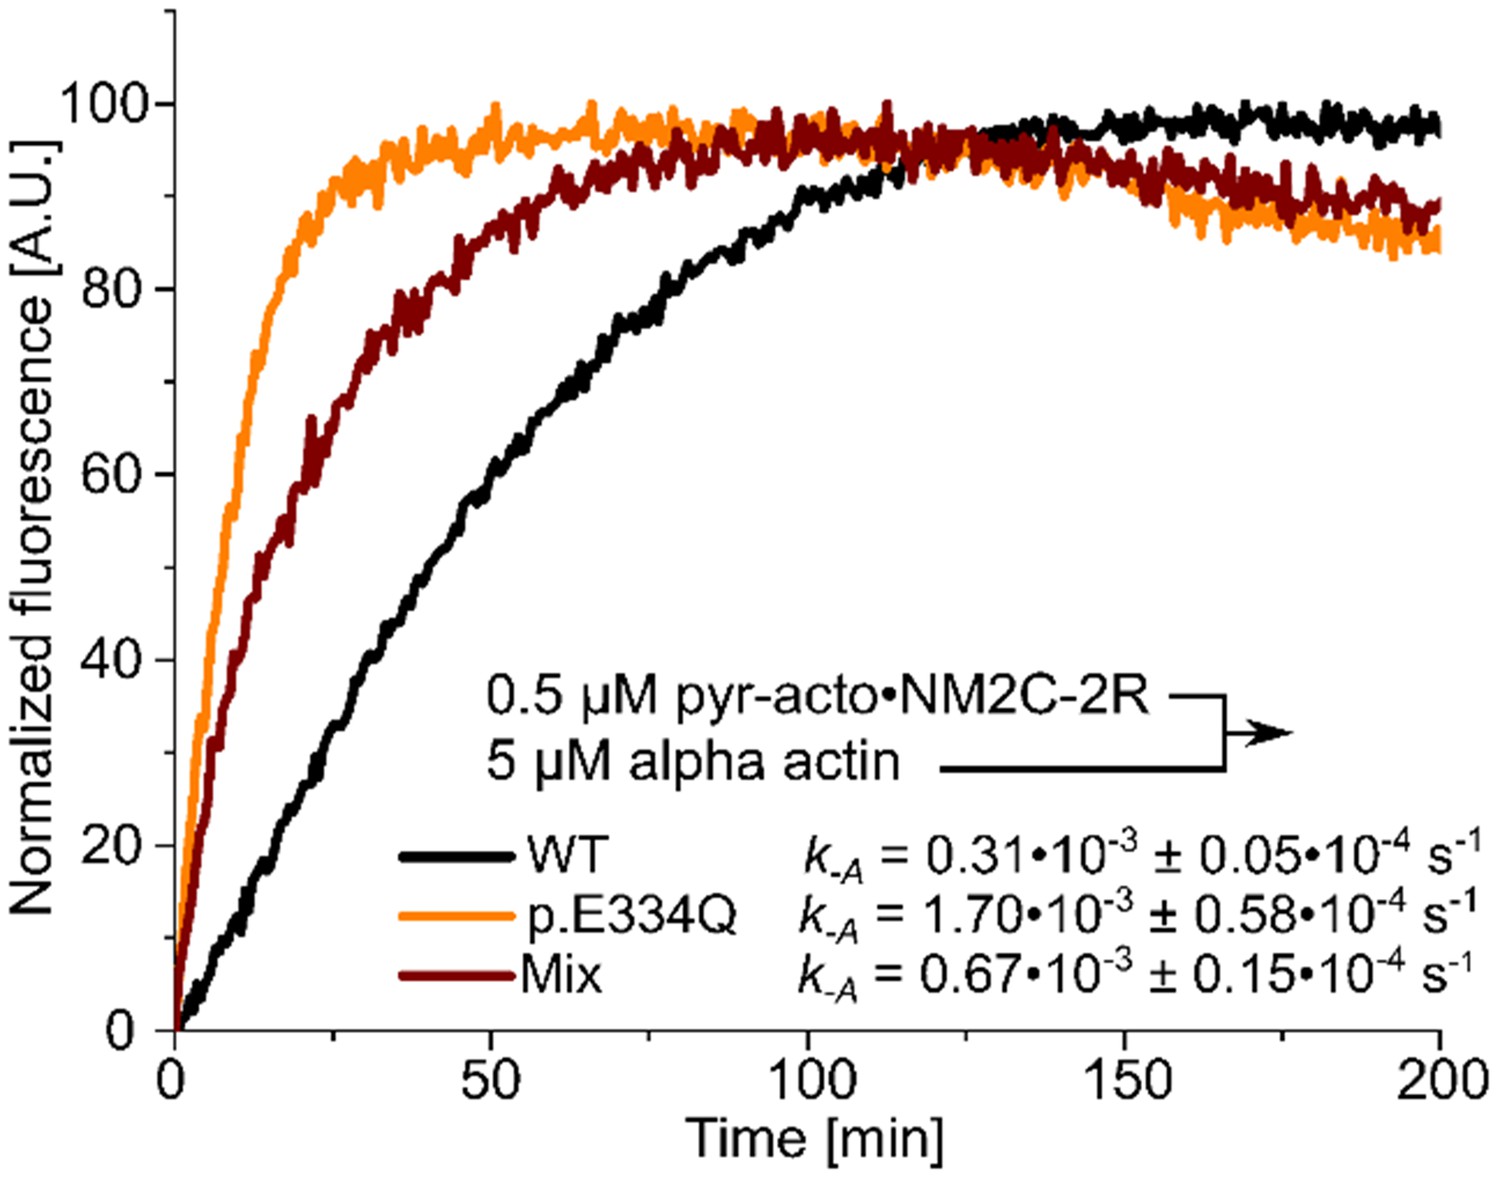
Determination of the dissociation rate constants (k–A) for the interaction of NM2C-2R with p.E334Q or WT γ-actin in the absence of nucleotide.
Values for k-A were directly measured by chasing pyrene-labeled acto-NM2C-2R with a large excess of unlabeled F-actin.
Shown are representative traces. The k-A values are the results of 5–11 individual experiments.
Figure 8—figure supplement 3
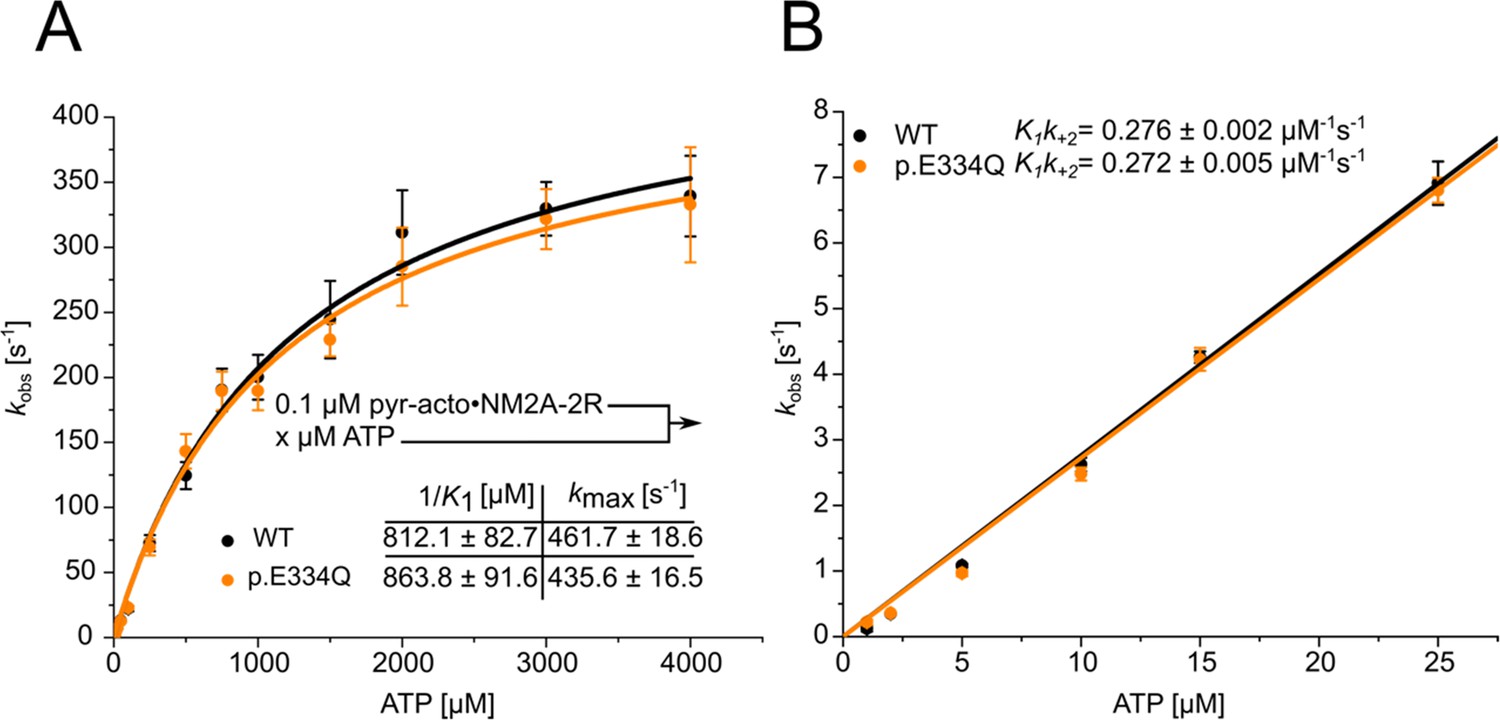
Analysis of the apparent ATP-affinity (1/K1), the maximal ATP-induced dissociation rate of NM2A from actin (k+2), and the second-order rate constant for ATP binding (K1k+2) for complexes formed between NM2A-2R and WT or p.E334Q filaments.
(A) ATP-induced dissociation experiments with phalloidin-stabilized pyrene-labeled acto-NM2A-2R complexes were performed as described in ‘Material and methods’. A hyperbolic fit to the obtained data yields 1/K1 and k+2. Data is shown as the mean ± SD of six individual experiments. (B) A linear fit to the data obtained with low ATP concentrations (0–25 µM) yields K1k+2.
Figure 8—video 1
Sliding of WTγ-actin filaments (TRITC-phalloidin labeled) on surface-immobilized NM2A-HMM visualized by fluorescence microscopy.
Figure 8—video 2
Sliding of p.E334Q γ-actin filaments (TRITC-phalloidin labeled) on surface-immobilized NM2A-HMM visualized by fluorescence microscopy.
Figure 8—video 3
Sliding of mutant-WT heterofilaments (TRITC-phalloidin labeled) on surface-immobilized NM2A-HMM visualized by fluorescence microscopy.
Figure 9
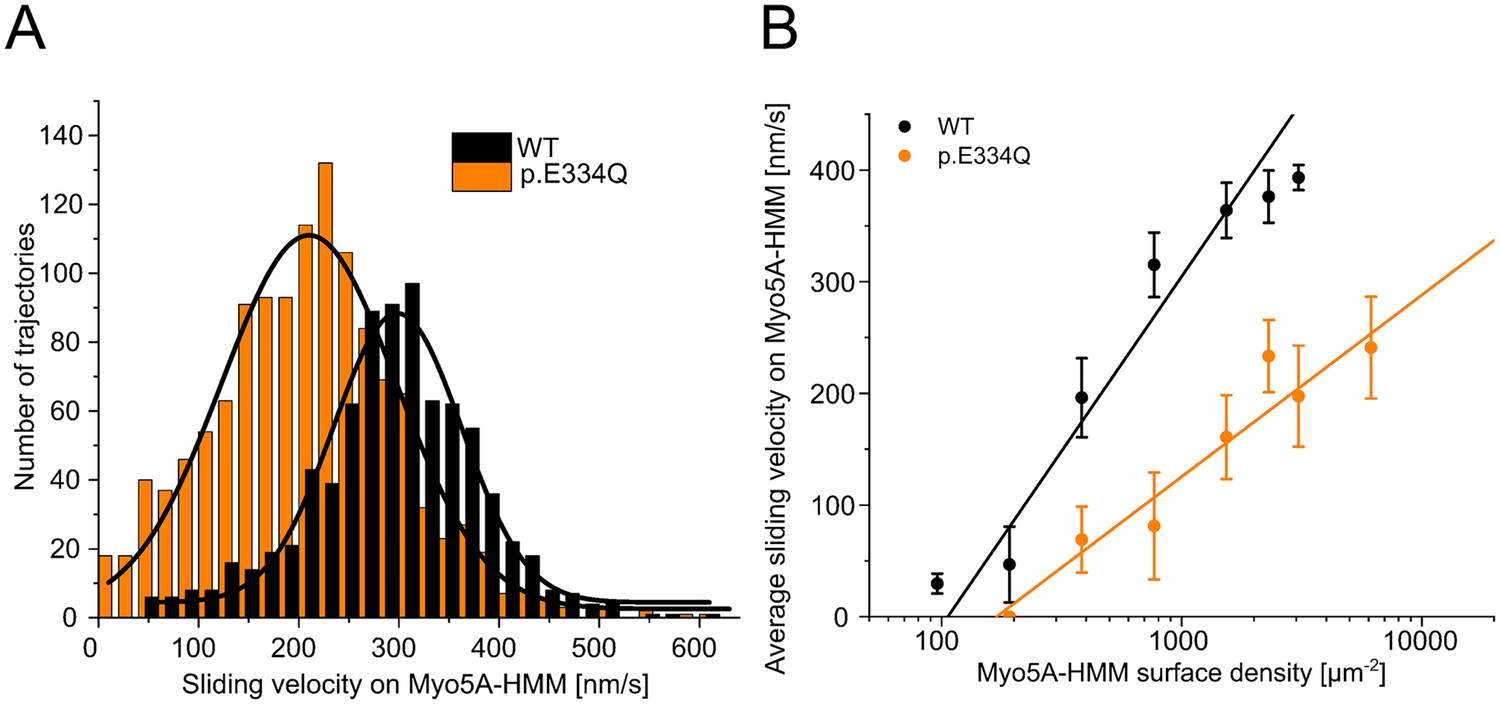
Analysis of the interaction of human Myo5A-HMM with WT and p.E334Q γ-actin in the unloaded in vitro motility assay at different Myo5A surface densities.
(A) The interaction of surface-immobilized Myo5A-HMM with WT γ-actin and p.E334Q γ-actin filaments was analyzed using the unloaded in vitro motility assay. Representative velocity distributions were obtained from one individual experiment at the optimal Myo5A-HMM surface density for WT (770 µm–2) and p.E334Q filaments (3100 µm–2). The average sliding velocity of the filaments in each experiment was determined by applying a Gaussian fit (black line) to the obtained velocity distributions. (B) Semi-logarithmic plot summarizing all measured sliding velocities at different Myo5A-HMM surface densities. Data is shown as the mean ± SD of 3–10 individual experiments. The dependence of the average sliding velocity on surface motor density is best described in the semi-logarithmic graph by lines up to approximately 1000 motors µm–2 for WT filaments and 7000 motors µm–2 for p.E334Q filaments.
Tables
Table 1
Comparison of biochemical parameters, velocities, rate, and equilibrium constants measured in experiments with human cytoskeletal γ-actin and variant p.E334Q.
| Parameter | γ-actin | p.E334Q | 1:1 mixture |
|---|---|---|---|
| IC50 (nM) (DNase inhibition) | 22.7 ± 0.7 | 25.7 ± 0.6 (*1.1-fold ↑) | – |
| TM (°C) (Mg2+-ATP-G-actin) | 56.77 ± 0.24 | 56.19 ± 0.30 (ns) | – |
| TM (°C) (Mg2+-ADP-F-actin) | 65.00 ± 0.76 | 64.83 ± 0.25 (ns) | – |
| k-T (s–1) (Mg2+-ε-ATP) | 0.0473 ± 0.0013 | 0.0972 ± 0.0019 (**** 2.1-fold ↑) | – |
| k-D (s–1) (Mg2+-ε-ADP) | 0.2155 ± 0.0017 | 0.3199 ± 0.0027 (**** 1.5-fold ↑) | – |
| F-actin ATPase (s–1) | 0.00089 ± 0.00005 | 0.00088 ± 0.00004 (ns) | – |
| kobs (s–1) bulk polymerization rate (Δpyr-fluorescence) | 0.0140 ± 0.0004 | 0.0129 ± 0.0008 (***1.1-fold ↓) | 0.0134 ± 0.0006 (*1.04-fold ↓) |
| kobs (s–1) + 10 nM Arp2/3 bulk polymerization rate (Δpyr-fluorescence) | 0.6441 ± 0.0163 | 0.5458 ± 0.02256 (**1.2-fold ↓) | 0.6162 ± 0.0776 (ns) |
| robs (nm s–1) rate of filament elongation (TIRF-M) | 12.6 ± 0.3 | 11.1 ± 0.3 (**** 1.1-fold ↓) | – |
| kobs (s–1) rate of filament disassembly (Δpyr-fluorescence) | 0.0022 ± 0.0002 | 0.0029 ± 0.0003 (**** 1.3-fold ↑) | 0.0023 ± 0.0002 (ns) |
| kc (nM–1 s–1) + cofilin rate of filament disassembly (Δpyr-fluorescence) | 3.42 × 10⁻⁴ ± 0.22 × 10⁻⁴ | 0.81 × 10⁻⁴ ± 0.08 × 10⁻⁴ (**** 4.2-fold ↓) | 1.54 × 10⁻⁴ ± 0.11 × 10⁻⁴ (*** 2.2-fold ↓) |
| v (nm s–1) sliding velocity on NM2A-HMM | 195.3 ± 5.0 | 39.1 ± 3.2 (**** 5.0-fold ↓) | 131.2 ± 10.0 (*** 1.5-fold ↓) |
| v (nm s–1) sliding velocity on Myo5A-HMM at optimal myosin density | 315.1 ± 28.9 | 190.4 ± 46.9 (**** 1.7-fold ↓) | – |
| Kapp (µM) (NM2A-HMM) | 3.20 ± 0.74 | 2.89 ± 0.49 (ns) | – |
| kcat (s–1) (NM2A-HMM) | 0.097 ± 0.002 | 0.076 ± 0.005 ( *1.3-fold ↓) | – |
| k-A (s–1) (NM2A-2R) | 8.0 × 10⁻⁵ ± 3.3 × 10⁻⁶ | 4.5 × 10⁻⁴ ± 6.7×10⁻⁶ (**** 5.6-fold ↑) | 2.3 × 10⁻⁴ ± 1.3 × 10⁻⁵(***2.9-fold ↑) |
| k-A (s–1) (NM2C-2R) | 3.1 × 10⁻⁴ ± 5.0 × 10⁻⁶ | 1.7 × 10⁻³ ± 5.8 × 10⁻⁵ (***5.6-fold ↑) | 6.7 × 10⁻⁴ ± 1.5×10⁻⁵ (***2.2-fold ↑) |
| KA (nM) (NM2A-2R) | 1.7 ± 0.3 | 16.9 ± 0.3 (**9.9-fold ↑) | – |
| KDA (nM) (NM2A-2R) | 122.6 ± 11.4 | 353.0 ± 20.6 (**2.9-fold ↑) | – |
| Coupling (KDA/KA) (NM2A-2R) | 72.1 | 20.9 (**** 3.5-fold ↓) | – |
| 1/K1 (µM) (NM2A-2R) | 812.1 ± 82.7 | 863.8 ± 91.6 (ns) | – |
| k+2 (s–1) (NM2A-2R) | 461.7 ± 18.6 | 435.6 ± 16.5 (ns) | – |
| K1k+2 (µM–1 s–1) (NM2A-2R) | 0.276 ± 0.002 | 0.272 ± 0.005 (ns) | – |
-
Bold entries indicate the observed difference between wt and mutant values. ns = p> 0.05, * p≤ 0.05 , ** p≤ 0.01, *** p ≤ 0.001, **** p≤ 0.0001
Additional files
Download links
A two-part list of links to download the article, or parts of the article, in various formats.
Downloads (link to download the article as PDF)
Open citations (links to open the citations from this article in various online reference manager services)
Cite this article (links to download the citations from this article in formats compatible with various reference manager tools)
The non-muscle actinopathy-associated mutation E334Q in cytoskeletal γ-actin perturbs interaction of actin filaments with myosin and ADF/cofilin family proteins
eLife 12:RP93013.
https://doi.org/10.7554/eLife.93013.3


