Sex-specific resilience of neocortex to food restriction
- Wellcome-MRC Institute of Metabolic Science, University of Cambridge, United Kingdom
- Centre for Discovery Brain Sciences, School of Biomedical Sciences, University of Edinburgh, United Kingdom
- Simons Initiative for the Developing Brain, University of Edinburgh, United Kingdom
- Rosamund Stone Zander Translational Neuroscience Center, F.M. Kirby Center, Boston Children’s Hospital, Harvard Medical School, United States
Figures
Figure 1
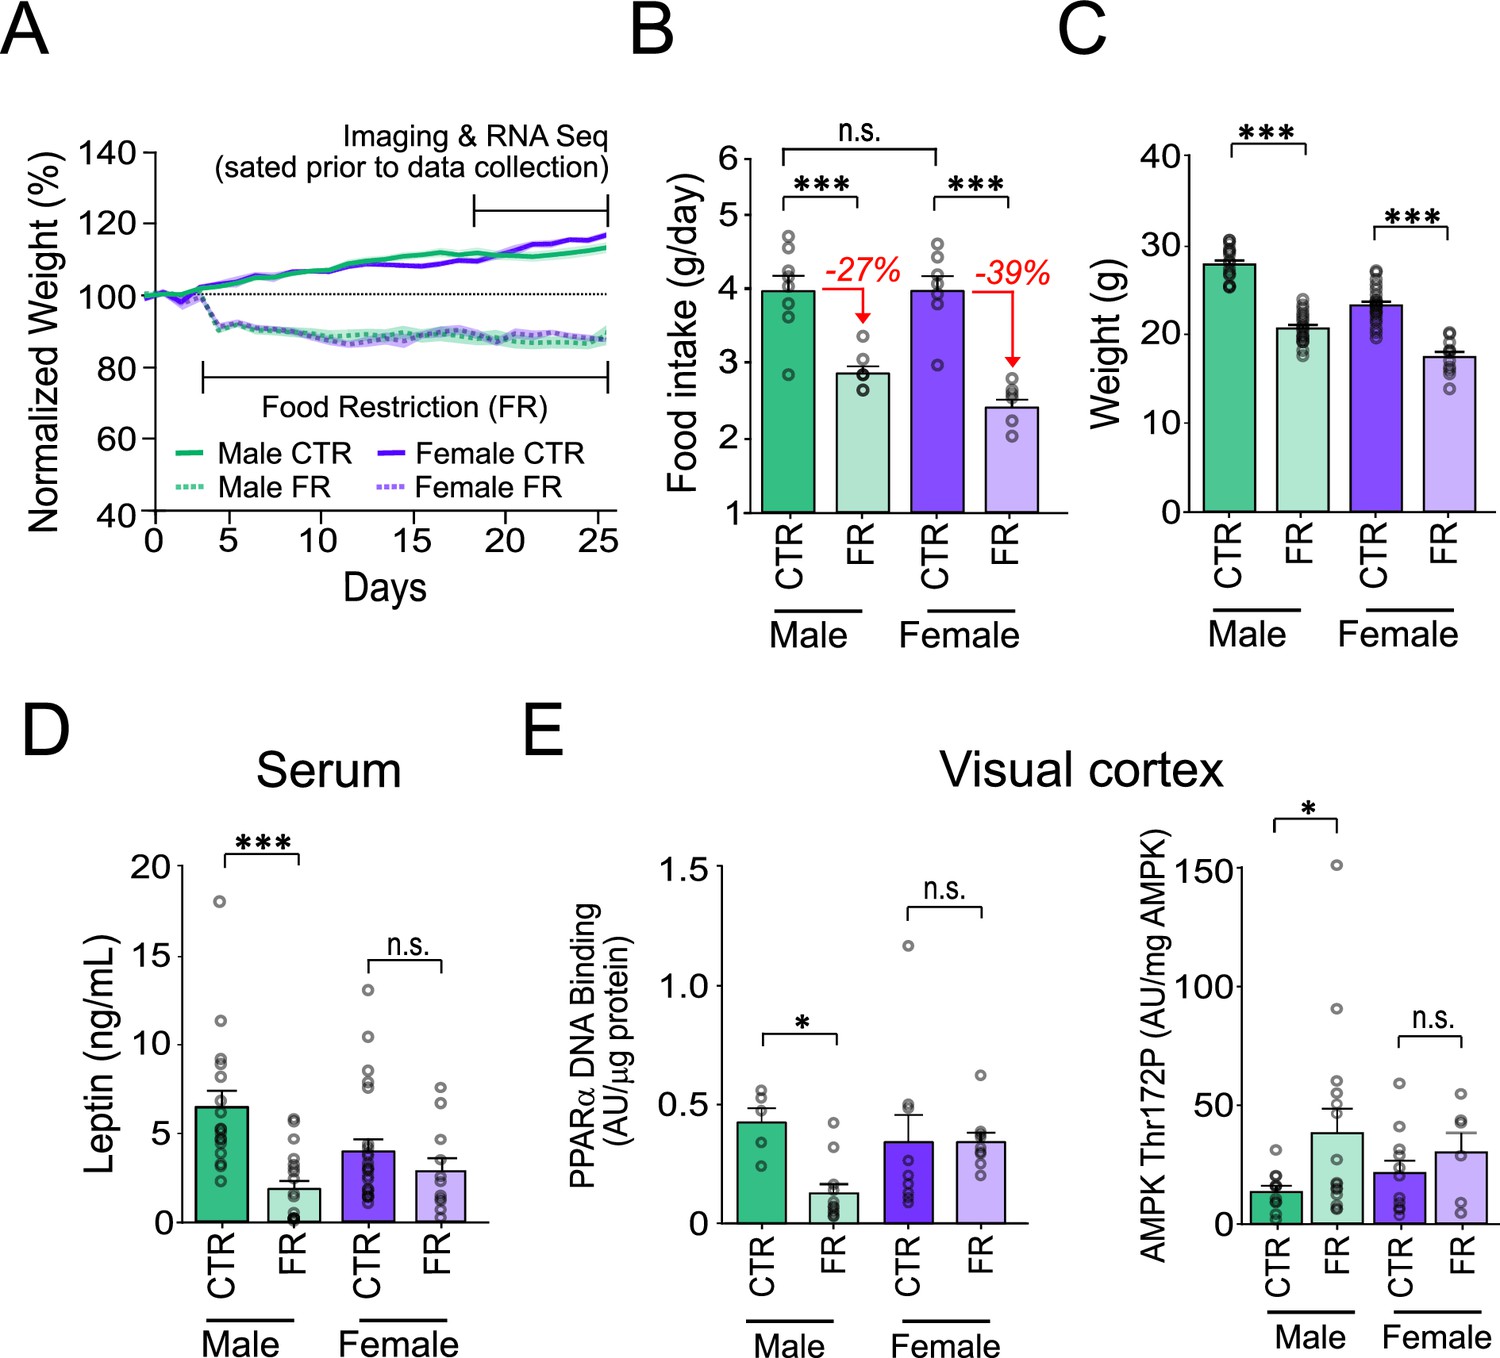
Sex-specific impact of food restriction on weight loss and serum leptin.
(A) Animal weight across time. (B) Daily food intake (two-way analysis of variance [ANOVA]: CTR male vs. FR male; t = 4.81; df = 25; p < 0.0001; CTR male vs. CTR female; t = 0.013; df = 25; p = 0.99; CTR female vs. FR female; t = 6.59; df = 25; p < 0.0001; FR male vs. FR female; t = 1.93; df = 25; p = 0.07; n = 8 CTR males, 8 FR males, 7 CTR females, and 7 FR females). Percent reduction of food intake for food restriction is shown in red for each sex. (C) Animal weight (two-way ANOVA: CTR male vs. FR male; t = 11.36; df = 25; p < 0.0001; CTR female vs. FR female; t = 8.36; df = 25; p < 0.0001; n = 17 CTR males and 19 FR males; 23 CTR females and 11 FR females). (D) Serum leptin levels (two-way ANOVA: CTR male vs. FR male; t = 4.58; df = 66; p < 0.0001; CTR females vs. FR females; t = 1.00; df = 66; p = 0.32; n = 17 CTR males and 19 FR males; 23 CTR females and 11 FR females). (E) Left: AMP-activated protein kinase (AMPK) Thr172 phosphorylation, normalized by total AMPK, in primary visual cortex (V1) tissue (two-way ANOVA: CTR male vs. FR male; t = 2.28; df = 39; p = 0.022; CTR female vs. FR female; t = 0.64; df = 39; p = 0.11; n = 11 CTR males, 15 FR males, 11 CTR females, and 6 FR females). Right: Peroxisome proliferator-activated receptor alpha (PPARα) activity in V1 tissue, as assessed by levels of DNA binding, normalized to protein level (two-way ANOVA: CTR male vs. FR male; t = 4.81; df = 30; p = 0.013; CTR female vs. FR female; t = 0.0016; df = 30; p = 0.99; n = 5 CTR males, 11 FR males, n = 9 CTR females, and 9 FR females). ***p < 0.0001; *p < 0.05; n.s. = not significant. Error bars are standard error of the mean (SEM).
Figure 2
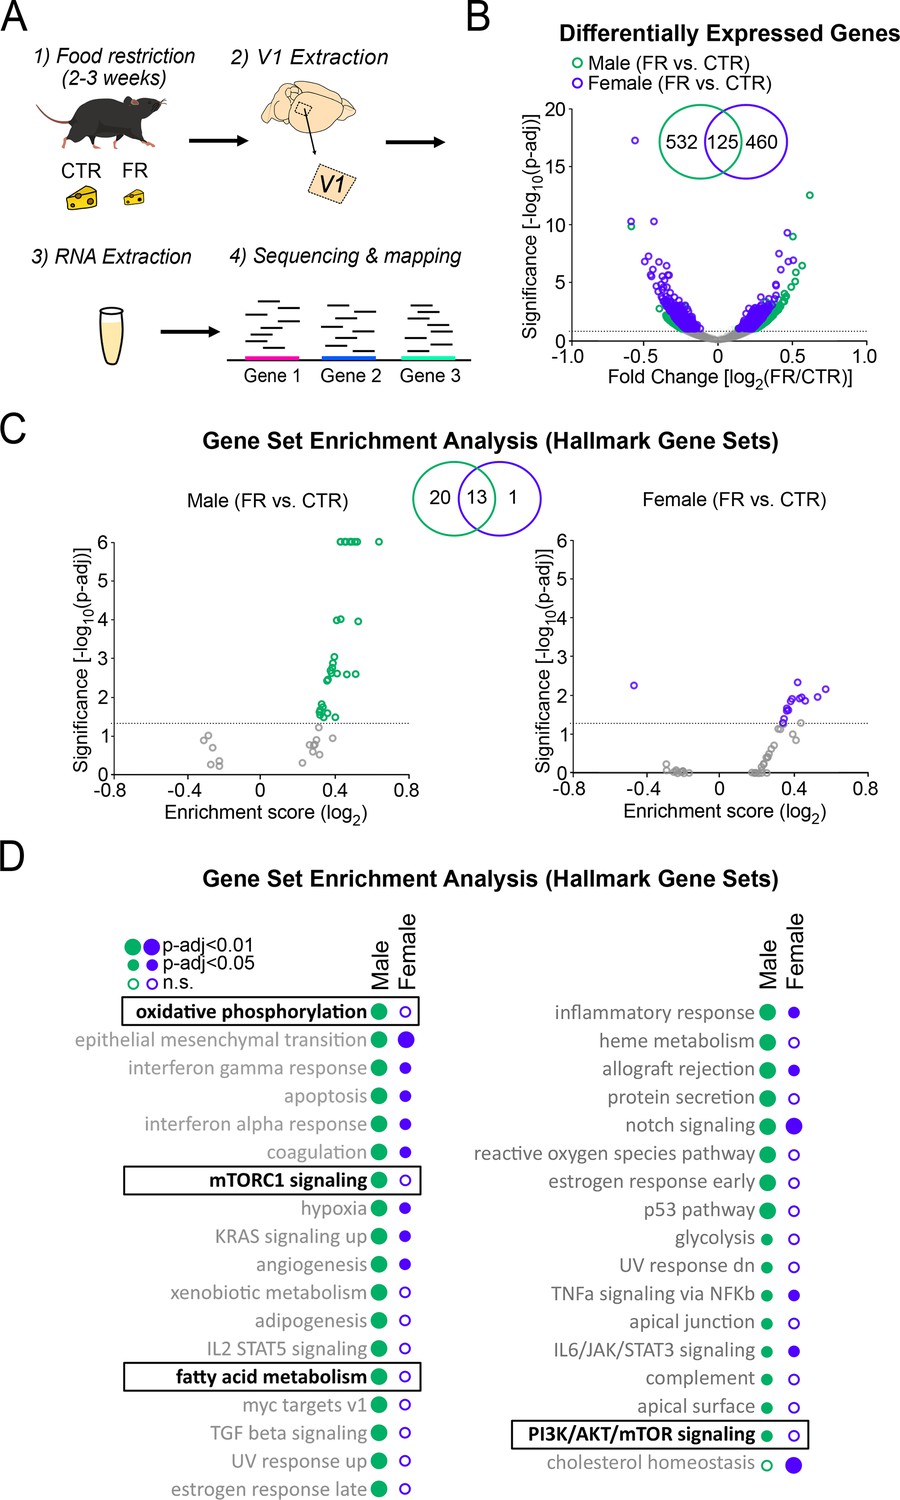
Cellular energy-regulating pathways are more robustly impacted by food restriction in males than in females.
(A) Schema of RNA sequencing of V1 tissue. (B) Volcano plot of fold change expression with food restriction vs. significance for all analysed genes; broken horizontal line denotes adjusted p < 0.1 significance level, below which non-significantly regulated expressed genes are marked by grey. Inset: Venn diagram showing the number of significantly differentially expressed genes with food restriction in males and females. (C) Gene Set Enrichment Analysis using Hallmark Gene Sets, depicted using a volcano plot of Enrichment Score vs. significance for males (left) and females (right); broken horizontal lines denotes adjusted p < 0.05 significance level. Inset: Venn diagram showing the number of significantly regulated gene sets with food restriction in males and females. (D) Complete list of significantly enriched gene sets by food restriction in males and females for analysis in C. Gene sets of interest are denoted by a box (oxidative phosphorylation: male; t = 0.48; p < 0.0001; female; t = −0.17; p = 0.96; mTORC1 signalling: male; t = 0.46; p < 0.0001; female; t = −0.18; p = 0.98; fatty acid metabolism: male; t = 0.43; p < 0.0001; t = 0.2; p = 0.88; PI3K/AKT/mammalian target of rapamycin (mTOR) signalling: male; t = 0.34; p = 0.027; female; t = 0.17; p = 0.98). All data from four CTR males, four FR males, four CTR females, and four FR females.
Figure 3 with 3 supplements
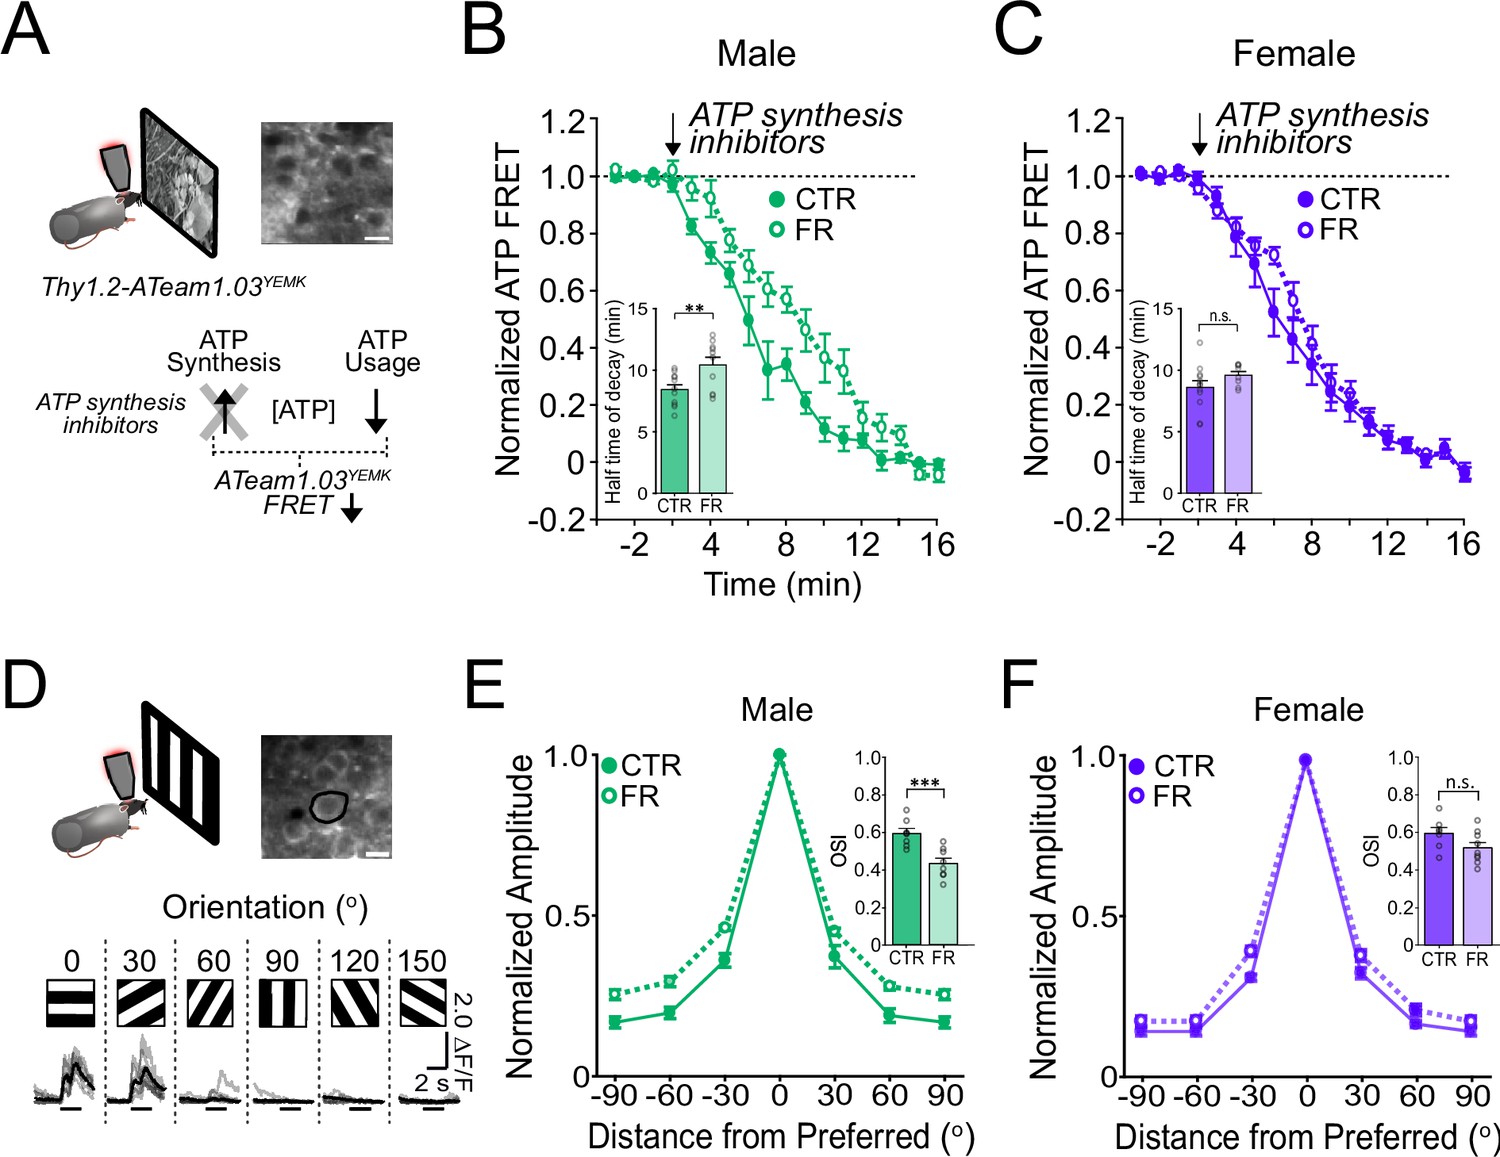
ATP usage and orientation selectivity in V1 are more robustly decreased by food restriction in males than in females.
(A) Schemata of ATP imaging experiment. Top: Example field of view of V1 layer 2/3 neurons in the ATeam1.03YEMK transgenic mouse (scale bar: 10 μm). Bottom: ATP synthesis inhibitors were used to isolate ATP usage, recorded as a decrease in FRET signal during presentation of natural, outdoor scenes. (B) Normalized ATeam1.03YEMK FRET signal in males and during presentation of natural, outdoor scenes. ATP synthesis inhibitors (arrow) were added to isolate ATP usage. Inset: Time to 50% decay of the ATeam1.03YEMK FRET signal (two-way analysis of variance [ANOVA]: t = 2.87; df = 37; p = 0. 0067; n = 11 CTR males and 10 FR males). (C) As in (B) but for females (inset: two-way ANOVA: t = 1.36; df = 37; p = 0.18; n = 12 CTR females and n = 8 FR females). (D) Top: Schema of two-photon imaging and sample field of view of V1 layer 2/3 neurons expressing GCaMP6s (scale bar: 10 μm). Bottom: Sample fluorescent signals (grey) from a selected neuron (black circle) in response to 6 drifting gratings of varying orientations. Trial averages are in black. Horizontal bar denotes 2 s grating presentation. (E) Mean orientation tuning curves normalized to the response to the preferred orientation for CTR and FR males (data from Padamsey et al., 2022). Note that −90° and +90° conditions correspond to the same visual stimulus. Inset: Orientation selectivity index (OSI; two-way ANOVA: t = 3.75; df = 27; p = 0.0009; n = 8 CTR and 8 FR males). (F) As in (E) but for females (Inset: two-way ANOVA: t = 1.90; df = 27; p = 0.08; n = 7 CTR females and 9 FR females). **p < 0.01; ***p < 0.001; n.s. = not significant. Error bars are standard error of the mean (SEM). Data from male mice are from a previously published dataset obtained under similar conditions (Padamsey et al., 2022).
Figure 3—figure supplement 1
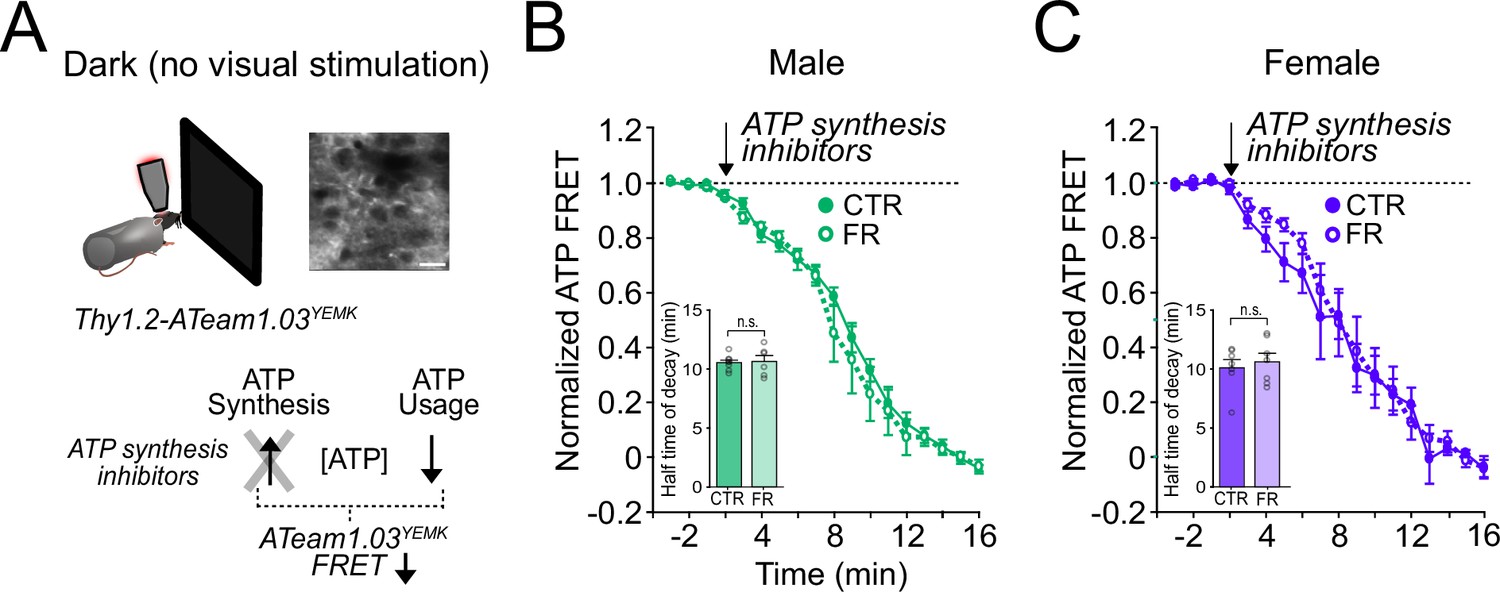
ATP usage in visual cortex is not affected by food restriction in the absence of visual stimulation.
(A) Schemata of ATP imaging experiment in the absence of visual stimulation (dark screen). Top: Example field of view of V1 layer 2/3 neurons in the ATeam1.03YEMK transgenic mouse (scale bar: 10 μm). Bottom: ATP synthesis inhibitors were used to isolate ATP usage, recorded as a decrease in FRET signal. (B) Normalized ATeam1.03YEMK FRET signal in males in the absence of visual stimulation (dark screen). ATP synthesis inhibitors (arrow) were added to isolate ATP usage. Inset: Time to 50% decay of the ATeam1.03YEMK FRET signal (two-way analysis of variance [ANOVA]: t = 0.14; df = 24; p = 0.89; n = 8 CTR males and 6 FR males). (C) As in (B) but for females (inset: two-way ANOVA: t = 0.64; df = 37; p = 0.52; n = 8 CTR females and n = 8 FR females). n.s. = not significant. Error bars are standard error of the mean (SEM).
Figure 3—figure supplement 2

Pupil diameter during visual stimulation is not affected by sex or food restriction.
(A) Top: Sample camera image of pupil (red outline) during visual stimulation. Bottom: Pupil diameter during the presentation of drifting gratings. (B) Pupil diameter was comparable across sex and diet. To assess significance across sex, pupil data within a sex was pooled (across diet) (t-test: male vs. female; t = 0.82; df = 18; p = 0.42; n = 7 CTR males, 8 FR females, 1 CTR female, and 4 FR females). n.s. = not significant. Error bars are standard error of the mean (SEM). Data from male mice are from a previously published dataset obtained under similar conditions (Padamsey et al., 2022).
Figure 3—figure supplement 3
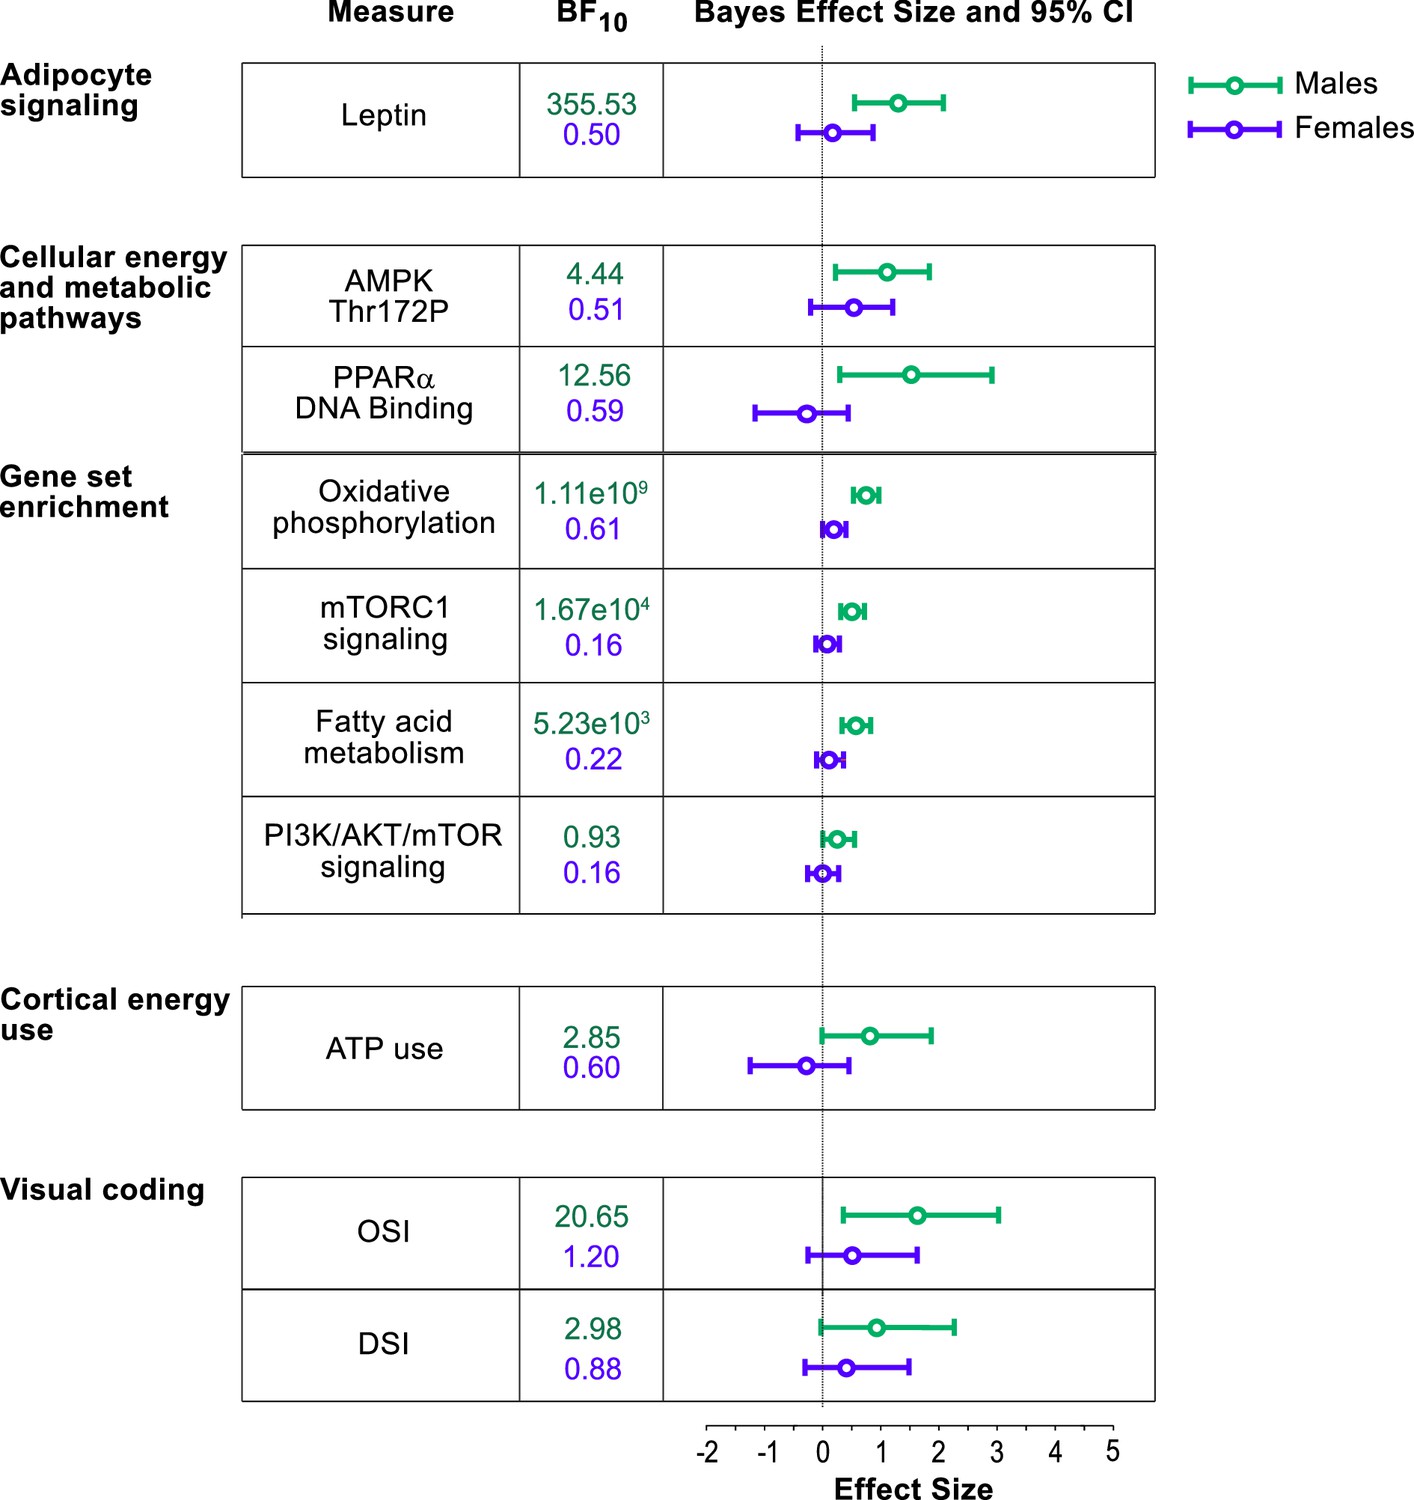
Bayes factor analysis reveals statistically robust impact of metabolic stress on V1 energy usage and visual coding in males, but not in females.
Bayes factor (BF10) along with quantified effect size and 95% confidence intervals (CIs) are shown for males (green) and females (purple). Across parameters, BF10 and effect sizes are greater for males than females, meaning that food restriction induces a more robust effect on visual cortical function and energy usage in males than females.
Additional files
-
Supplementary file 1
Hallmark Gene Sets, male food deprived vs. controls.
Gene Set Enrichment Analysis (GSEA) to identify pathways enriched in the populations differentially expressed in food restricted animals compared to controls. We found that food restriction resulted in a significant alteration of 34 gene sets (at p-adj <0.05) in males; 13 of these were common to both sexes. n = 4 CTR male, n = 4 FR male mice.
- https://cdn.elifesciences.org/articles/93052/elife-93052-supp1-v1.xlsx
-
Supplementary file 2
Hallmark Gene Sets, female food deprived vs. controls.
Same as Supplementary file 1 for females. We found that food restriction resulted in a significant alteration of 14 gene sets (at p-adj <0.05) in females; 13 of these were common to both sexes. n = 4 CTR female, n = 4 FR female mice.
- https://cdn.elifesciences.org/articles/93052/elife-93052-supp2-v1.xlsx
-
MDAR checklist
- https://cdn.elifesciences.org/articles/93052/elife-93052-mdarchecklist1-v1.docx
Download links
A two-part list of links to download the article, or parts of the article, in various formats.
Downloads (link to download the article as PDF)
Open citations (links to open the citations from this article in various online reference manager services)
Cite this article (links to download the citations from this article in formats compatible with various reference manager tools)
Sex-specific resilience of neocortex to food restriction
eLife 12:RP93052.
https://doi.org/10.7554/eLife.93052.3


