Wide transition-state ensemble as key component for enzyme catalysis
- Departamento de Química Inorgánica, Analítica y Química-Física (INQUIMAE-CONICET), Universidad de Buenos Aires, Argentina
- Howard Hughes Medical Institute, Department of Biochemistry, Brandeis University, United States
- Departamento de Química Biológica (IQUIBICEN-CONICET), Facultad de Ciencias Exactas y Naturales, Universidad de Buenos Aires, Argentina
Figures
Figure 1 with 6 supplements
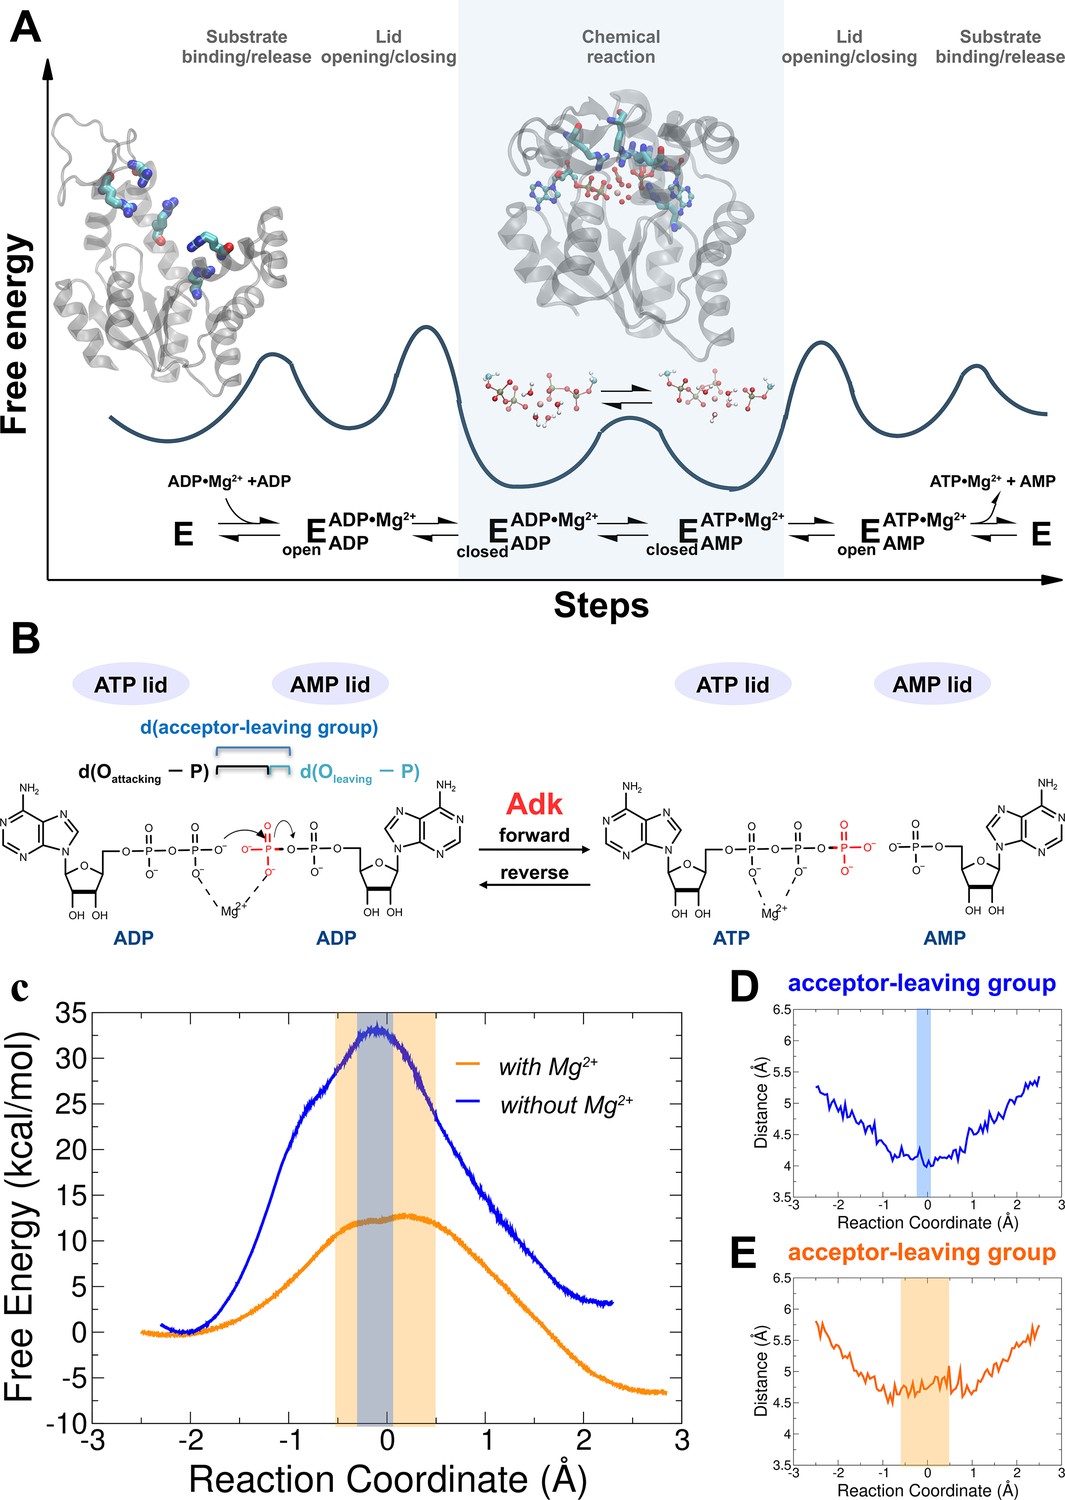
Investigation of the chemical step of phosphoryl transfer by quantum-mechanics/molecular-mechanics (QM/MM) calculations in the enzymatic reaction of adenylate kinase (Adk).
(A) Complete reaction scheme with corresponding illustrative free-energy landscape highlighting the chemical phosphoryl-transfer step (modified from Kerns et al., 2015). Protein structures shown are apo Adk in the open conformation and Adk in the closed conformation with two bound ADP molecules and one Mg2+ atom (active-site arginine side chains are shown in stick representation). (B) Phosphoryl-transfer step is drawn with corresponding distances used to define the reaction coordinate as used in panels D, E. (C) Free-energy profiles for the Adk-catalyzed interconversion of ADP–ADP into ATP–AMP in the absence (blue) and presence of Mg2+ (orange) from QM/MM calculations. AD(T)P is fully charged for the reaction with Mg2+, and singly protonated on one ADP β-oxygen for reaction without Mg2+. The reaction coordinate is defined as the difference between the distance of the leaving oxygen to the transferring phosphorus d(Oleaving − P) and the distance of the attacking oxygen to the transferring phosphorus d(Oattacking − P). Distance between acceptor and leaving oxygens along the reaction coordinate in the presence (E) and in the absence (D) of Mg2+. The transition-state regions in C–E are highlighted in orange and gray, respectively.
Figure 1—figure supplement 1
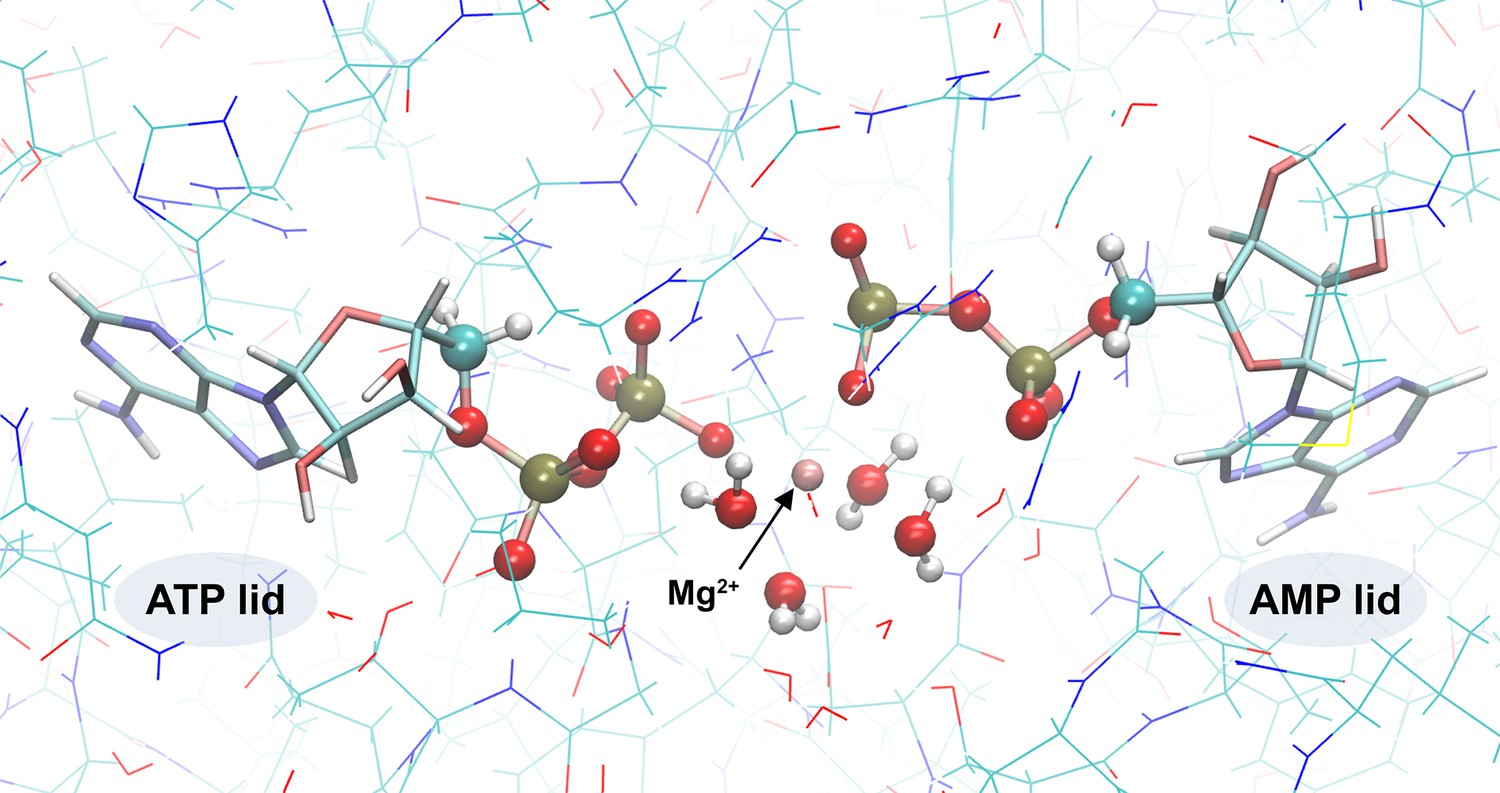
Quantum-mechanics/molecular-mechanics (QM/MM) system.
The QM subsystem is shown in CPK representation and the MM subsystem is in lines representation.
Figure 1—figure supplement 2

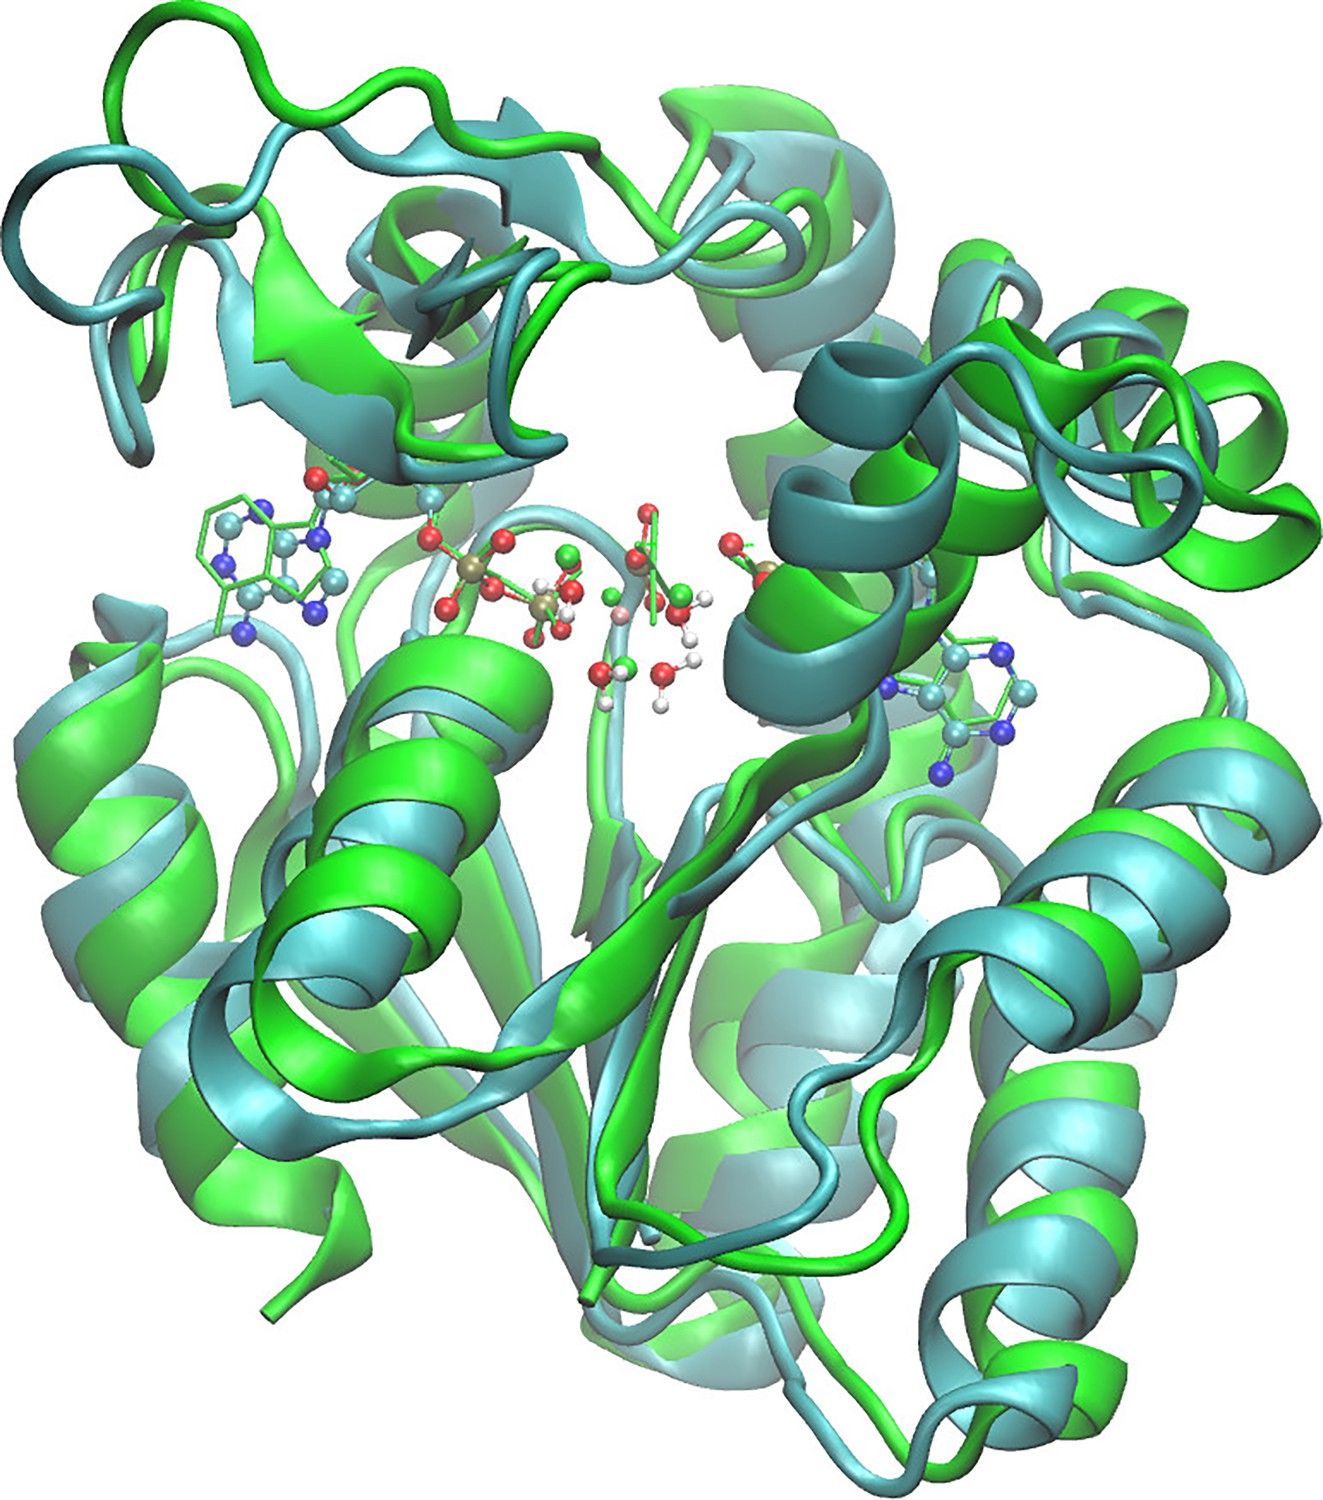
Superposition of the starting model structure for quantum-mechanics/molecular-mechanics (QM/MM) and the crystallographic structure (PDB ID: 4CF7; Kerns et al., 2015) of adenylate kinase (Adk) with two ADP/Mg bound.
(A) Comparison of ADPs, main amino acids and Mg2+ ion in the active site against the crystallographic model in green (starting structure for QM/MM as ball and stick), (B) zoom-in showing Mg2+ ion coordinated by water molecules and the phosphates, and (C) the Adk backbone of the starting model (cyan) and the crystallographic structure (green) with a backbone RMSD of 0.98 Å.
Figure 1—figure supplement 3
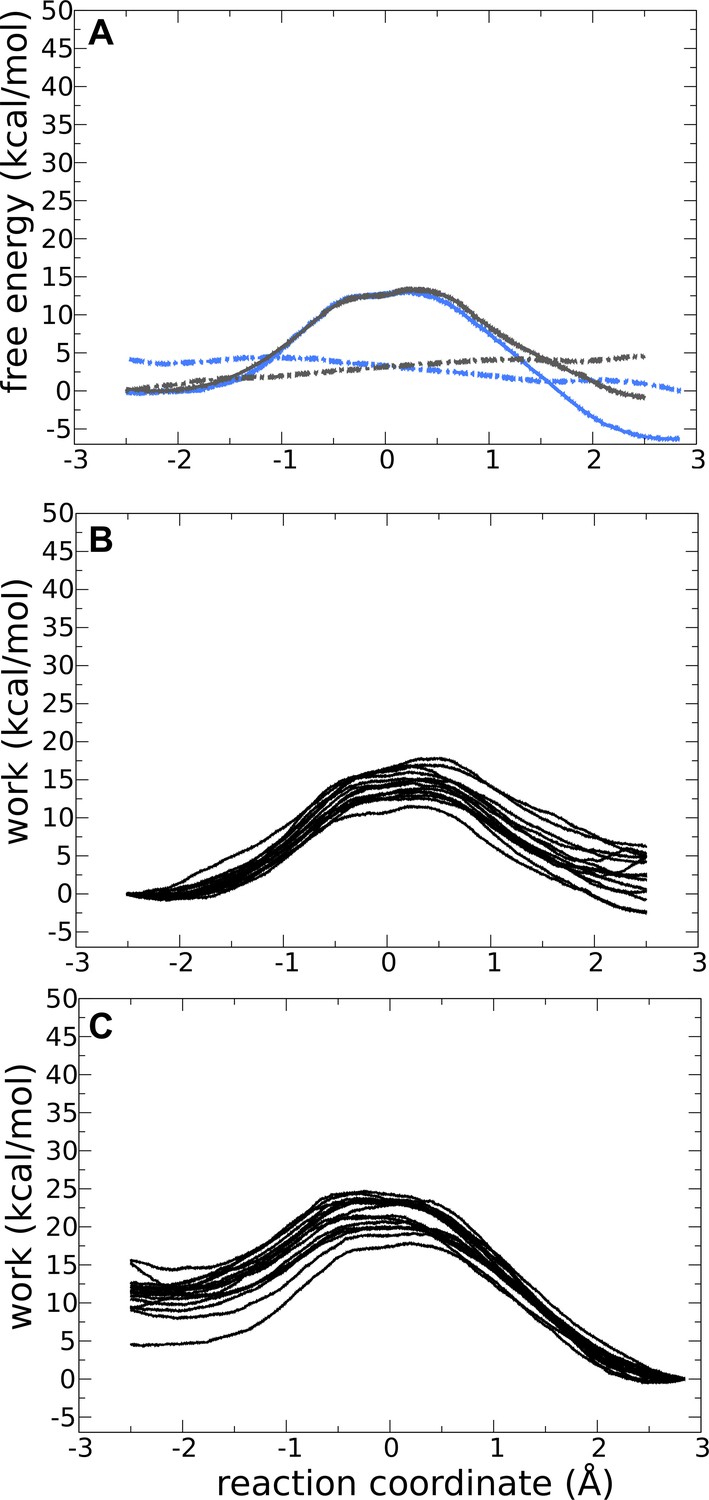
Forward and backward quantum-mechanics/molecular-mechanics (QM/MM) reactions for adenylate kinase (Adk) with two ADP and Mg2+ bound.
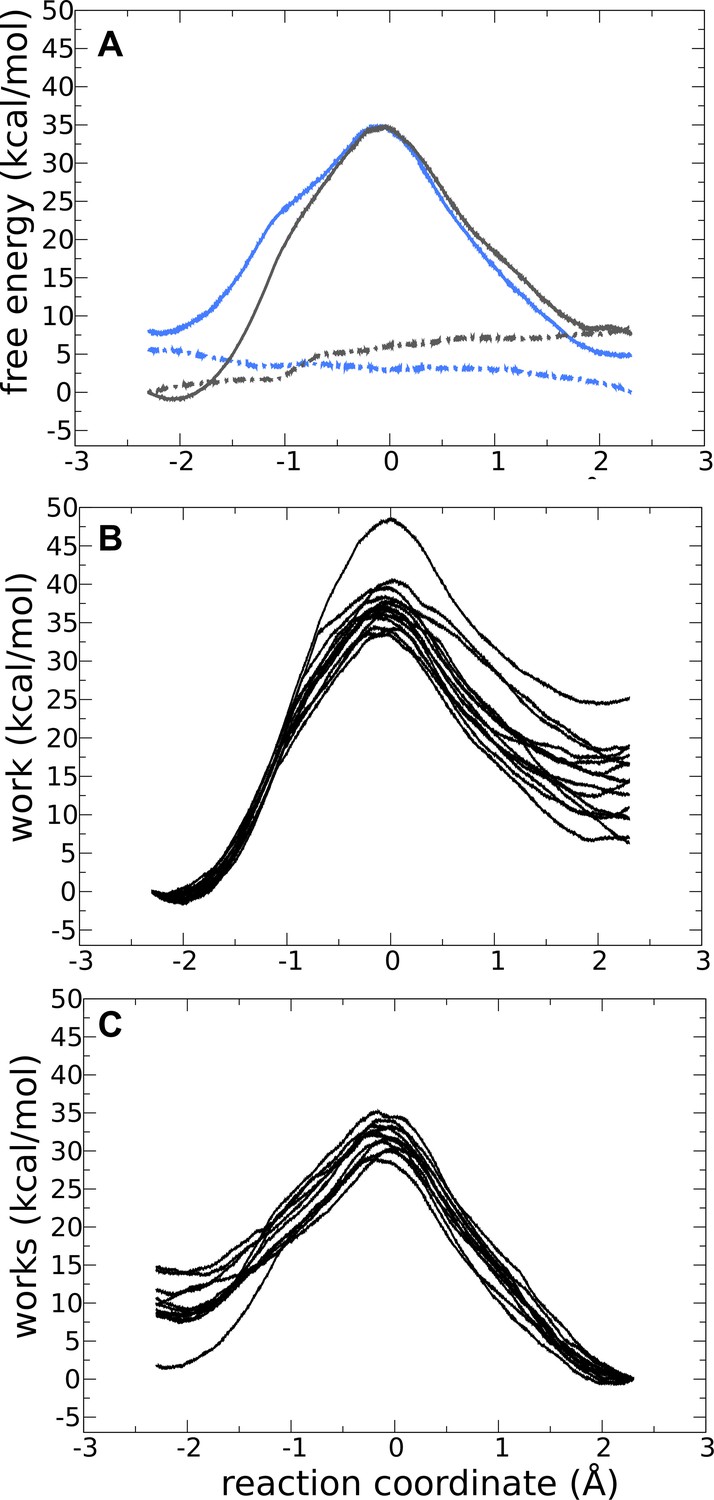
(A) Free-energy profile (FEP) for the forward (solid gray line) and backward (solid blue line) reactions for the nonprotonated system in the presence of Mg2+.
The dashed lines are the standard deviation for the forward and backward reactions in gray and blue, respectively. Works profiles obtained for the forward (B) and backward (C) reactions.
Figure 1—figure supplement 4
Forward and backward quantum-mechanics/molecular-mechanics (QM/MM) reactions for adenylate kinase (Adk) with ADP, ADP, and Mg2+ bound.
(A) Free-energy profile for the forward (solid gray line) and backward (solid blue line) reactions for the monoprotonated system with Mg2+.
The dashed lines are the standard deviation for the forward and backward reactions in gray and blue, respectively. Works profiles obtained for the forward (B) and backward (C) reactions.
Figure 1—figure supplement 5
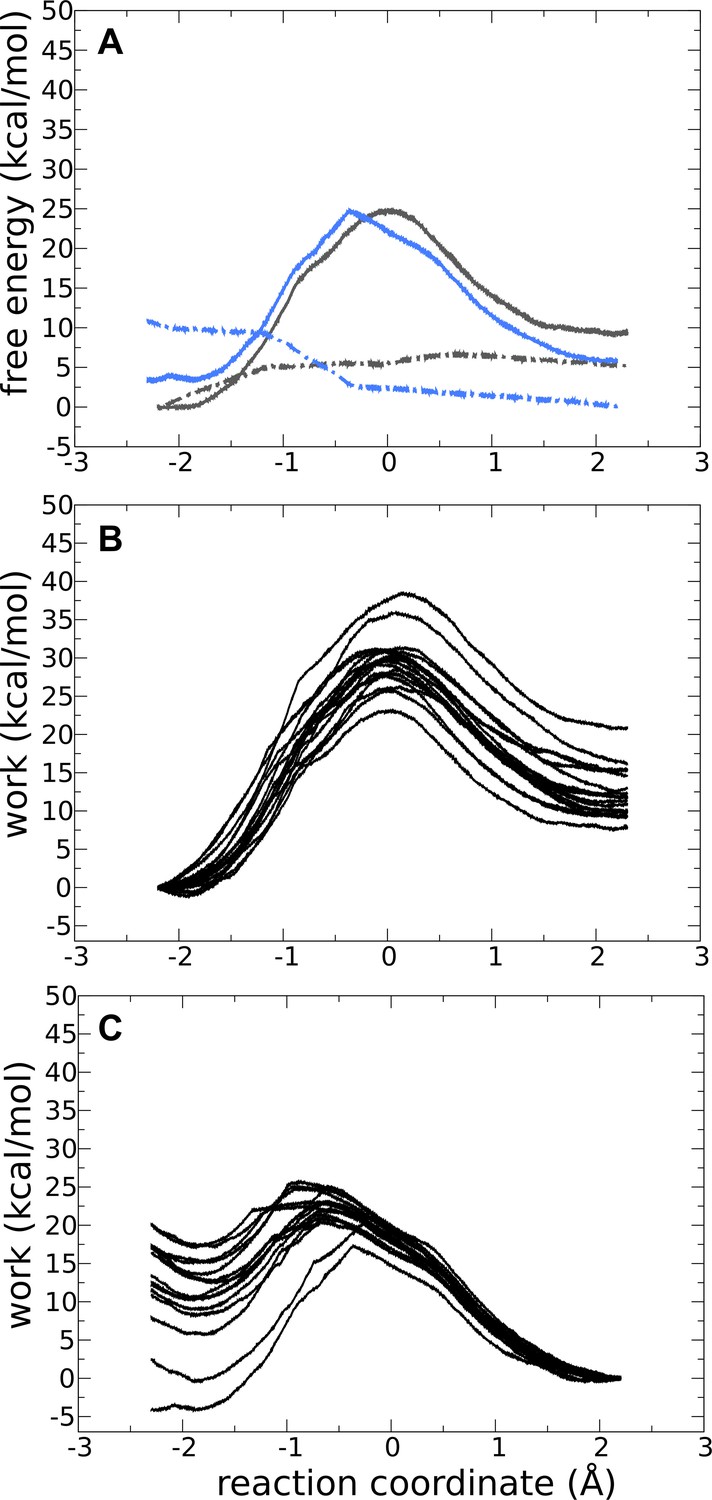
Forward and backward quantum-mechanics/molecular-mechanics (QM/MM) reactions for adenylate kinase (Adk) with two ADP and without Mg2+ bound.
(A) Free-energy profile for the forward (solid gray line) and backward (solid blue line) reactions for the monoprotonated system without Mg2+.
The dashed lines are the standard deviation for the forward and backward reactions in gray and blue, respectively. Works profiles obtained for the forward (B) and backward (C) reactions.
Figure 1—figure supplement 6
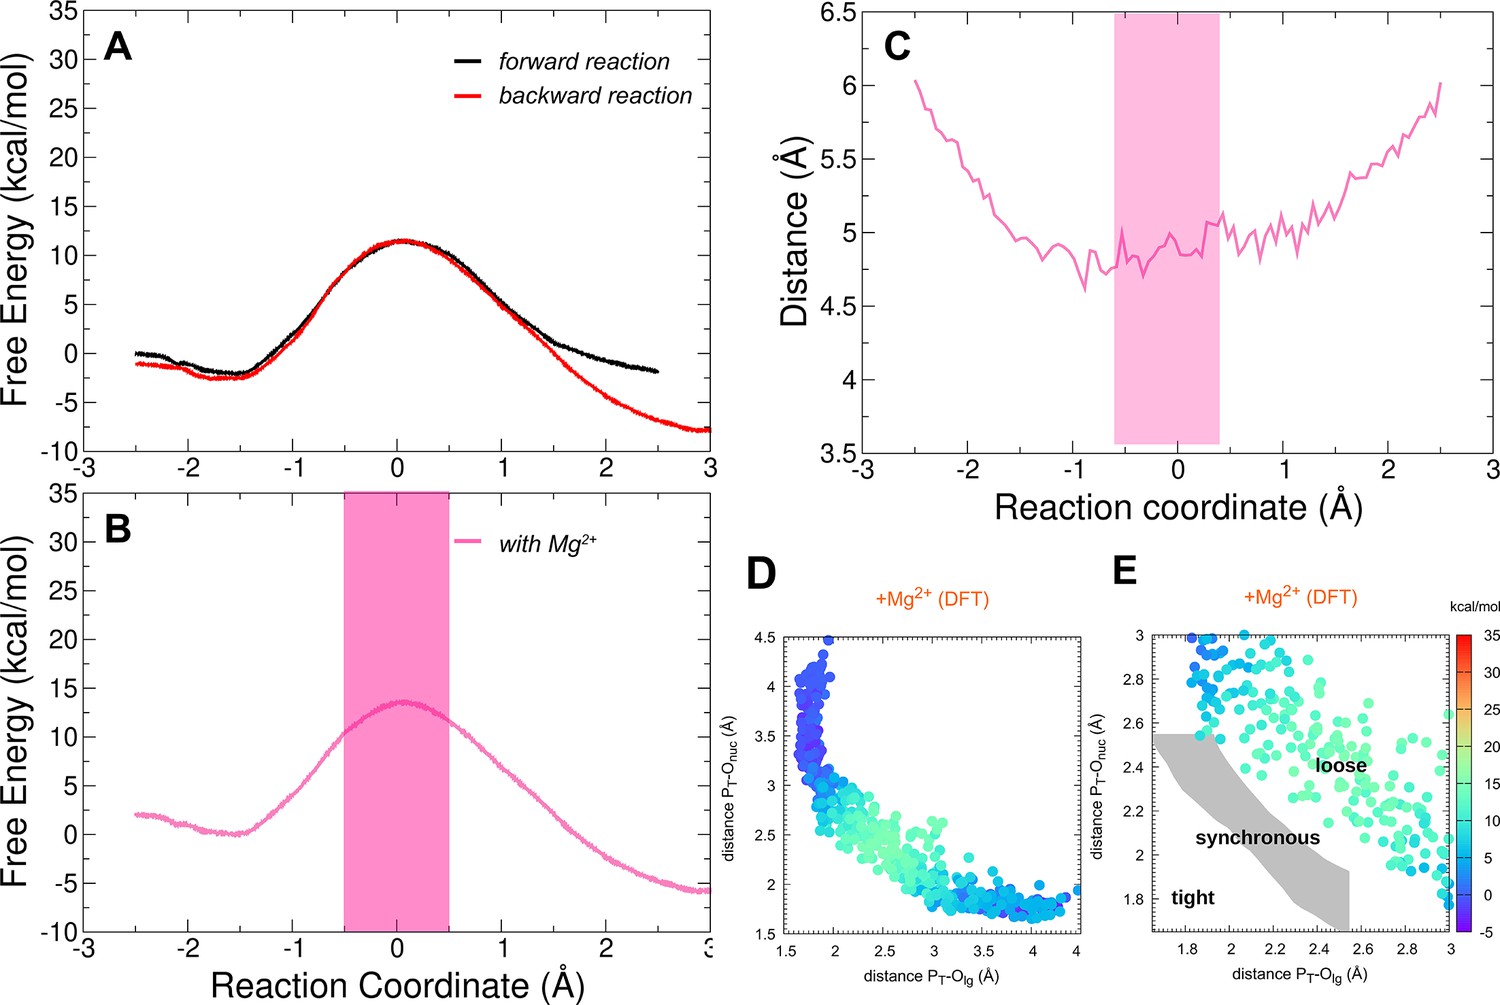
Free-energy profiles for the adenylate kinase (Adk)-catalyzed interconversion of ADP–ADP into ATP–AMP and presence of Mg2+ employing higher-level DFT(PBE) free-energy calculations (see methods for details).
Reaction coordinate is the same as in Figure 1. (A) Superposition of the forward and backward free-energy profiles. (B) The free-energy profile as result of the combination of the forward and backward free-energy profiles. The transparent pink region shows the transition-state region. (C) Distance between acceptor and leaving oxygens along the reaction coordinate in the presence of Mg2+. The transition-state region is highlighted in pink. (D, E) Diagram of (Jencks, 1972; O’Ferrall, 1970) from the simulations, plotting the two P–O distances involved in the P-transfer for the reaction with Mg2+, using DFT level at the quantum-mechanics (QM) region (PT for transferring phosphate). The theoretical transition pathways for a tight, synchronous, and loose transition state are shown in E (as defined in Roston and Cui, 2016).
Figure 2
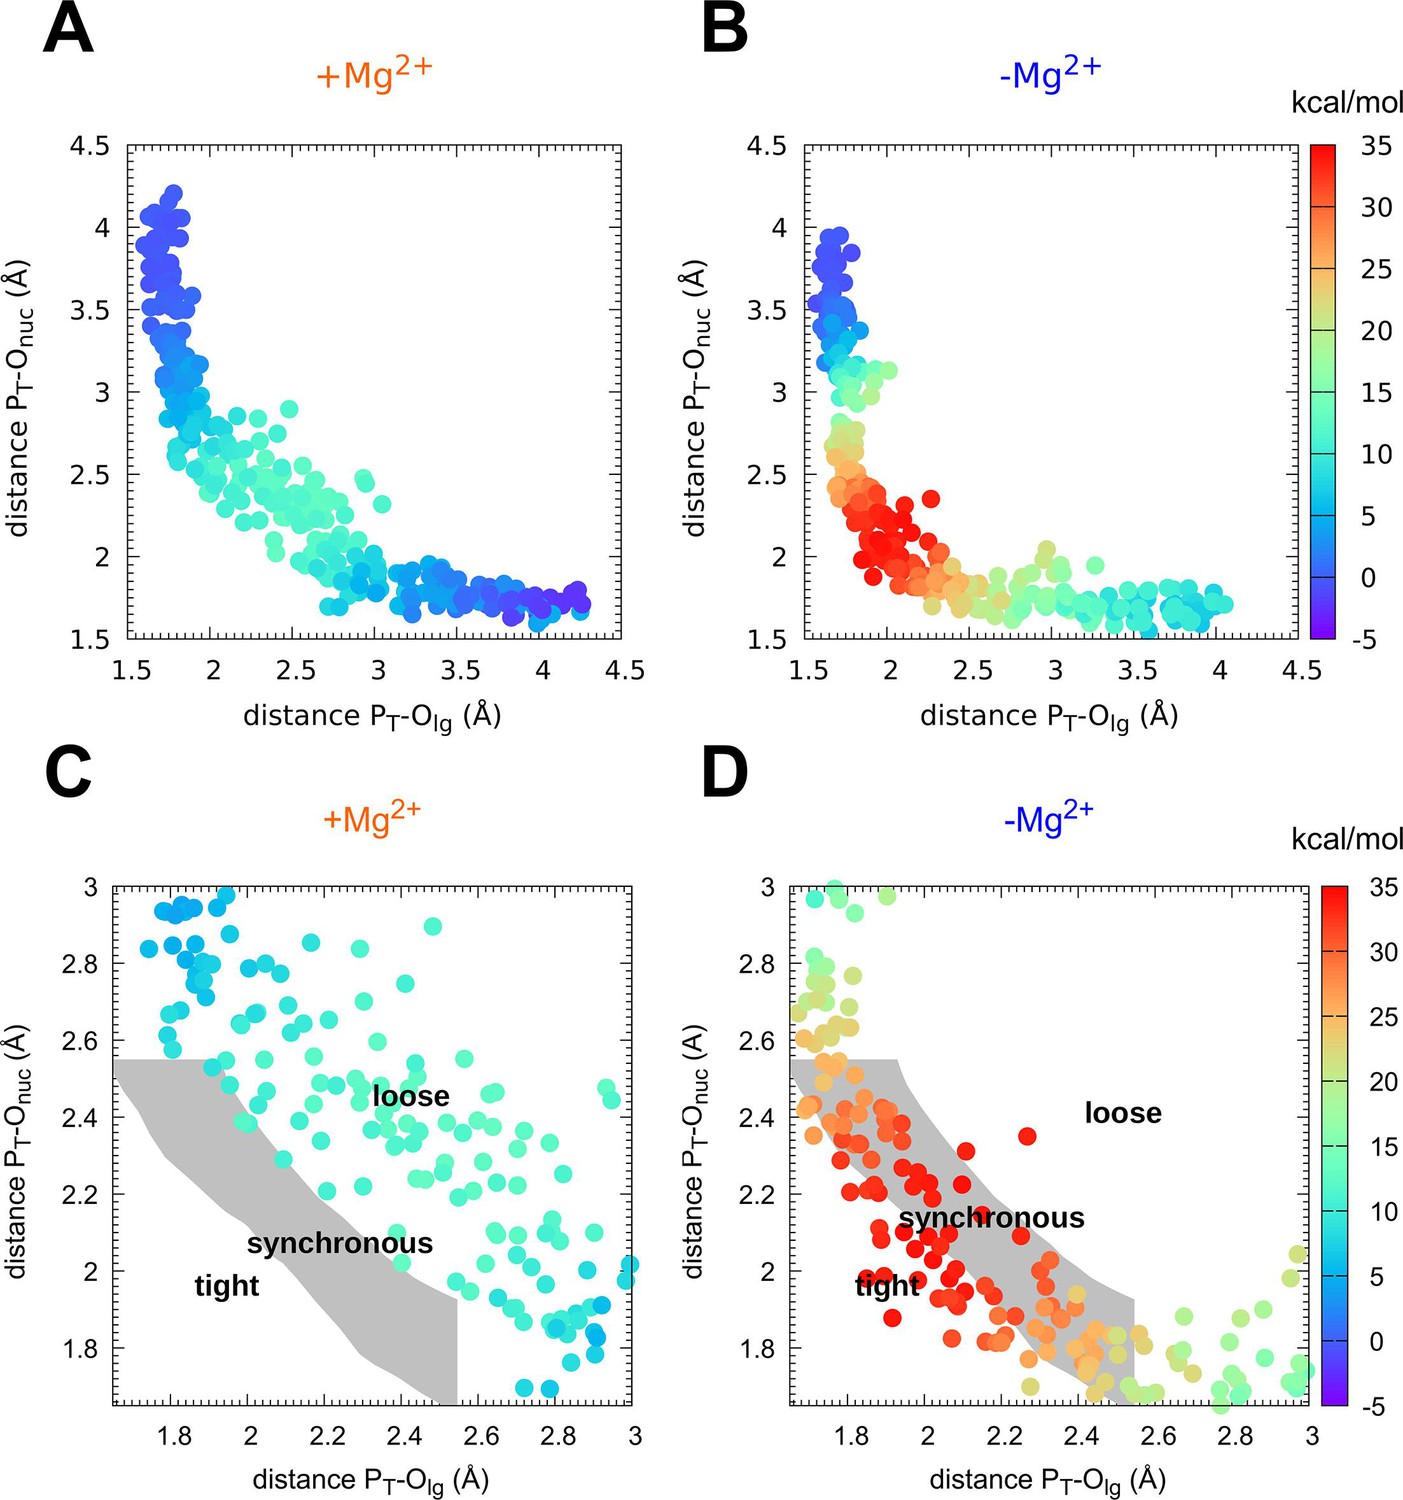
Mechanism of phosphoryl transfer.
Diagram of (Jencks, 1972; O’Ferrall, 1970) from the quantum-mechanics/molecular-mechanics (QM/MM) simulations, plotting the two P–O distances involved in the P-transfer for the reaction (A, C) with Mg2+ and (B, D) without Mg2+ (PT for transferring phosphate). The theoretical transition pathways for a tight, synchronous, and loose transition state are shown in C, D (as defined in Roston and Cui, 2016).
Figure 3 with 9 supplements
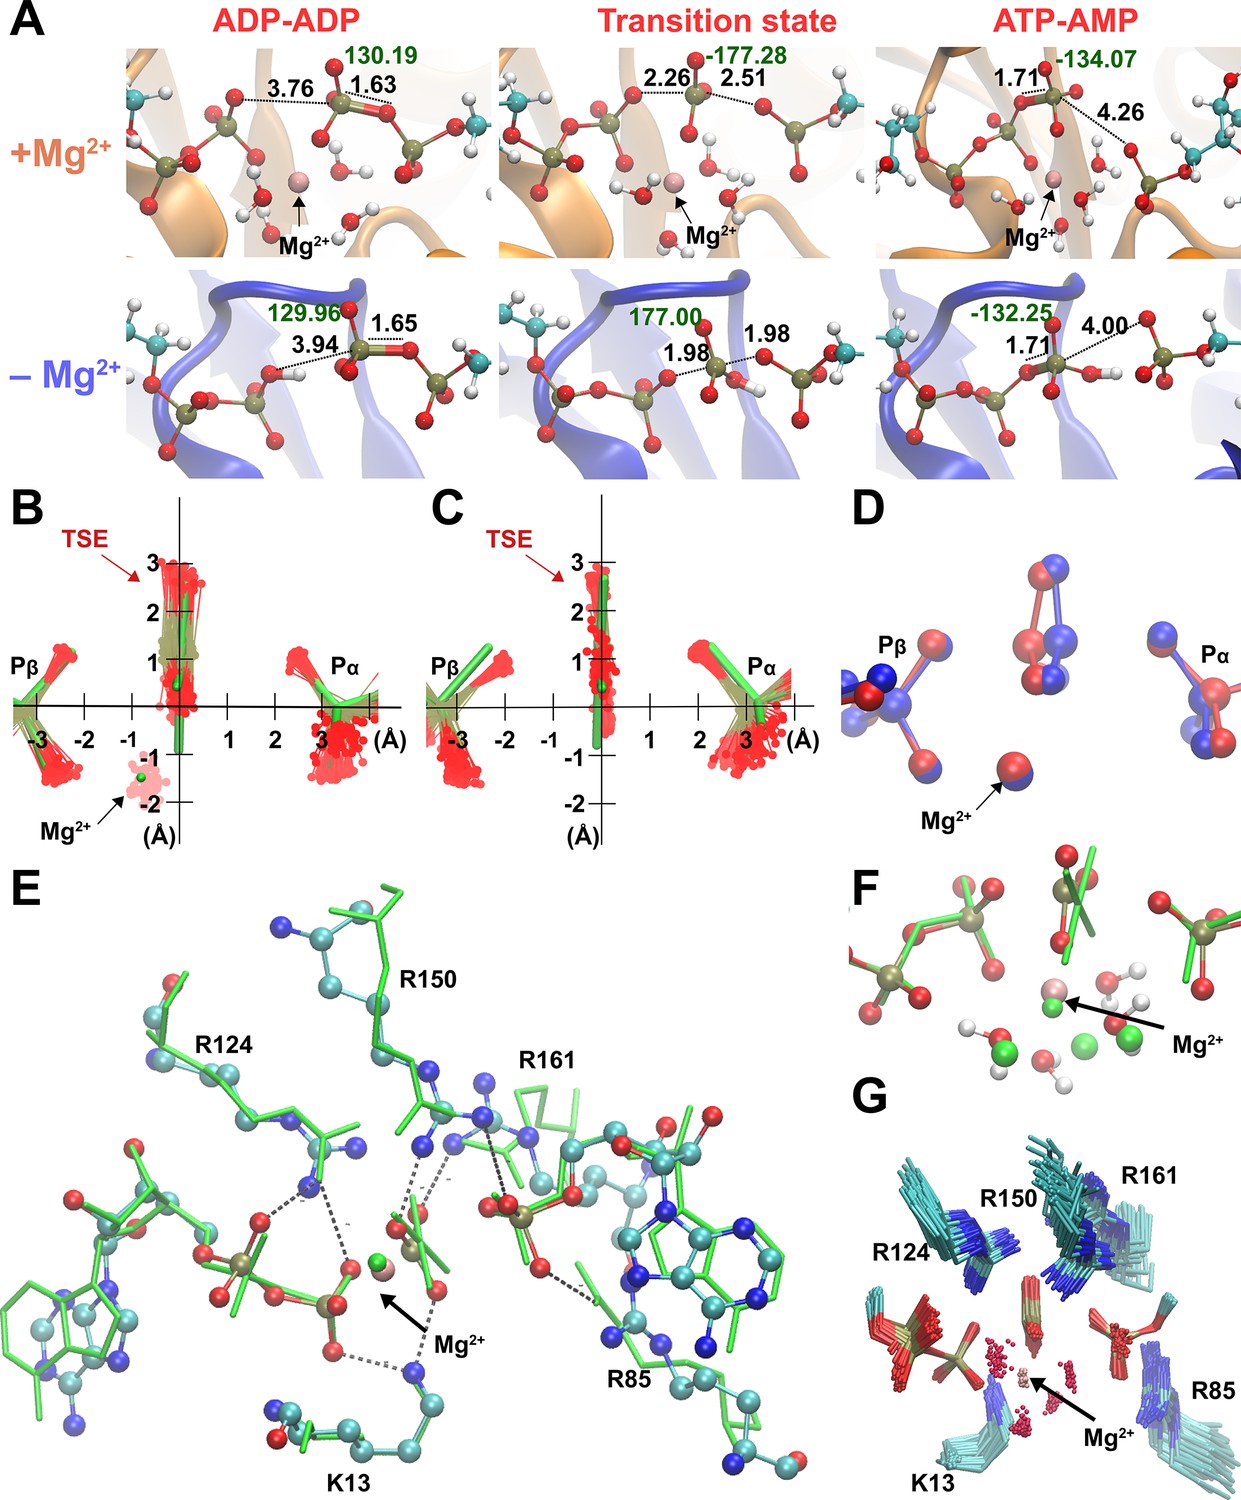
Broad transition-state ensemble (TSE) in fully active enzyme.
(A) Representative snapshots for structure of reactants, transition states, and products in the adenylate kinase (Adk) active site in the presence and absence of magnesium. d(Oattacking − P) and d(Oleaving − P) are shown. Labels in black indicate the length of the bonds involved in the phosphate transfer and in green, the dihedral angle of the phosphoryl group. Superposition of the TSEs reveals a wider TSE with Mg2+ (B) relative to the one without the cation (C) with mean rmsd (± SD) of distances of the central P atom from its ‘average’ position of 0.30 ± 0.11 Å (B) and 0.13 ± 0.06 Å (C). The TSEs are superimposed with the X-ray structure solved with a transition-state analog in green (AMP, AlF4−, and ADP) reported in Kerns et al., 2015 (PDB ID: 3SR0). (D) Superposition of two extreme structures out of the large TSE for the enzyme with Mg2+, one where the phosphoryl group is closest to the donor oxygen (blue) and the other closest to the acceptor oxygen (red) highlighting the asymmetric character of TSE members. (E, F) Superposition of most symmetric snapshot from TSE of quantum-mechanics/molecular-mechanics (QM/MM) calculations (ball and stick representation in cyan) with the X-ray structure of transition-state analog (green, PDB ID: 3SR0 Kerns et al., 2015 including coordinating water molecules in F). (G) Zoom into the active site to display the broad TSE in the presence of Mg2+ aided by flexible Arg and Lys side chains in the active site.
Figure 3—figure supplement 1
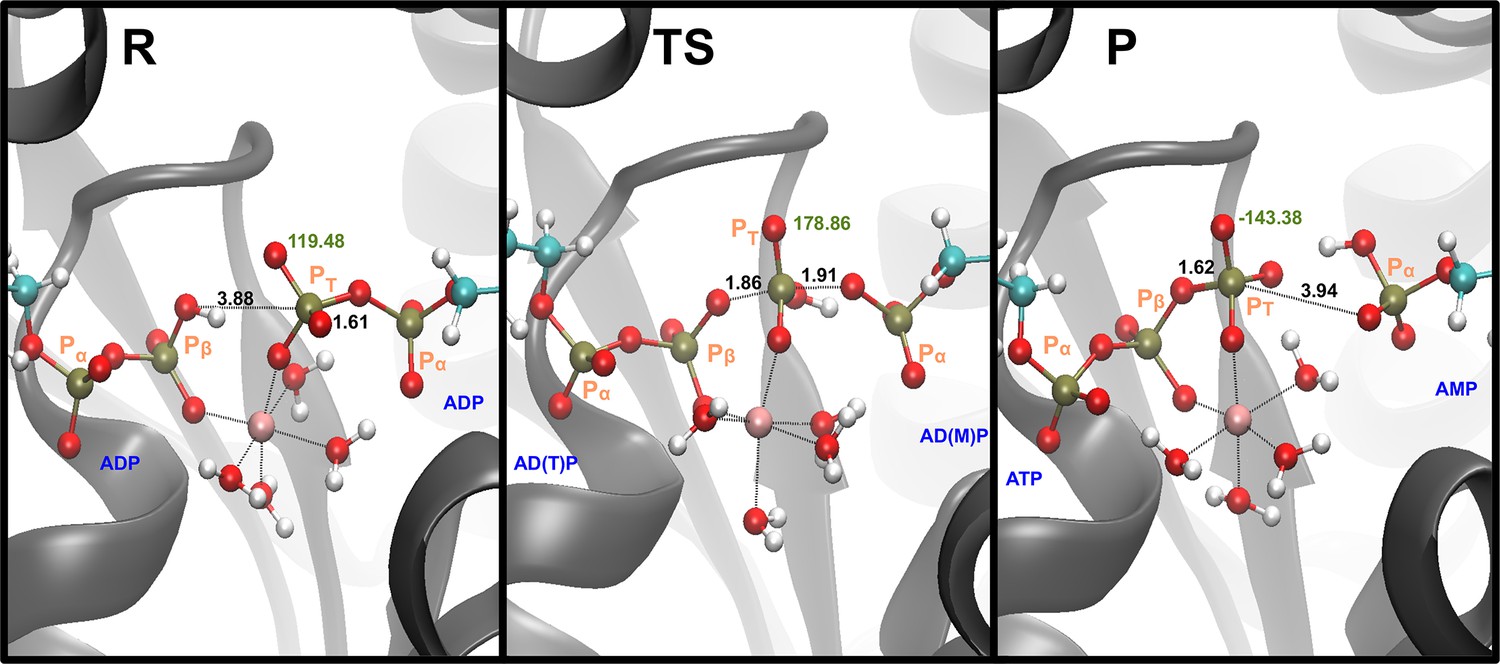
Representative snapshots for the reactant, transition state (TS), and product states in the monoprotonated system with Mg2+.
The labels in black describe the distances that are part of the phosphate transfer and the label in green shows the dihedral angle. Label of the phosphates in orange.
Figure 3—figure supplement 2
A representative transition-state structure is compared against the X-ray structure PDB ID: 3SR0 (Kerns et al., 2015).
The superposition is showed for: the main active site’s residues the atoms taking part of the reaction and backbone of the adenylate kinase (Adk).
Figure 3—figure supplement 3
Reaction with Mg2+ and fully charged nucleotides.
The change in geometrical parameters along the reaction coordinate is shown for (A) forward and (B) backward reactions. Parameters: distance Oleaving – Ptransferring (red), distance Oattacking – Ptransferring (black), transferring phosphate dihedral angle (light blue), distance Mg2+ – O from transferring phosphate (blue), and distance Mg2+ – O from beta-phosphate of ADPATP-lid (orange). The charge (mulliken charge) variation of different moieties involved in the reaction are shown for (C) forward and (D) backward reactions: Mg2+ (green), alpha-phosphate of ADPATP-lid (red), alpha-phosphate of ADPAMP-lid (orange), beta-phosphate of ADPATP-lid (black), and transferring phosphate (blue). Note that a proton is transiently transferred from one water molecule coordinating the Mg2+ to an oxygen of Pα in ADPAMP-lid (leaving group). In all plots, the free-energy profile (FEP) is shown in the background as light gray dashed line.
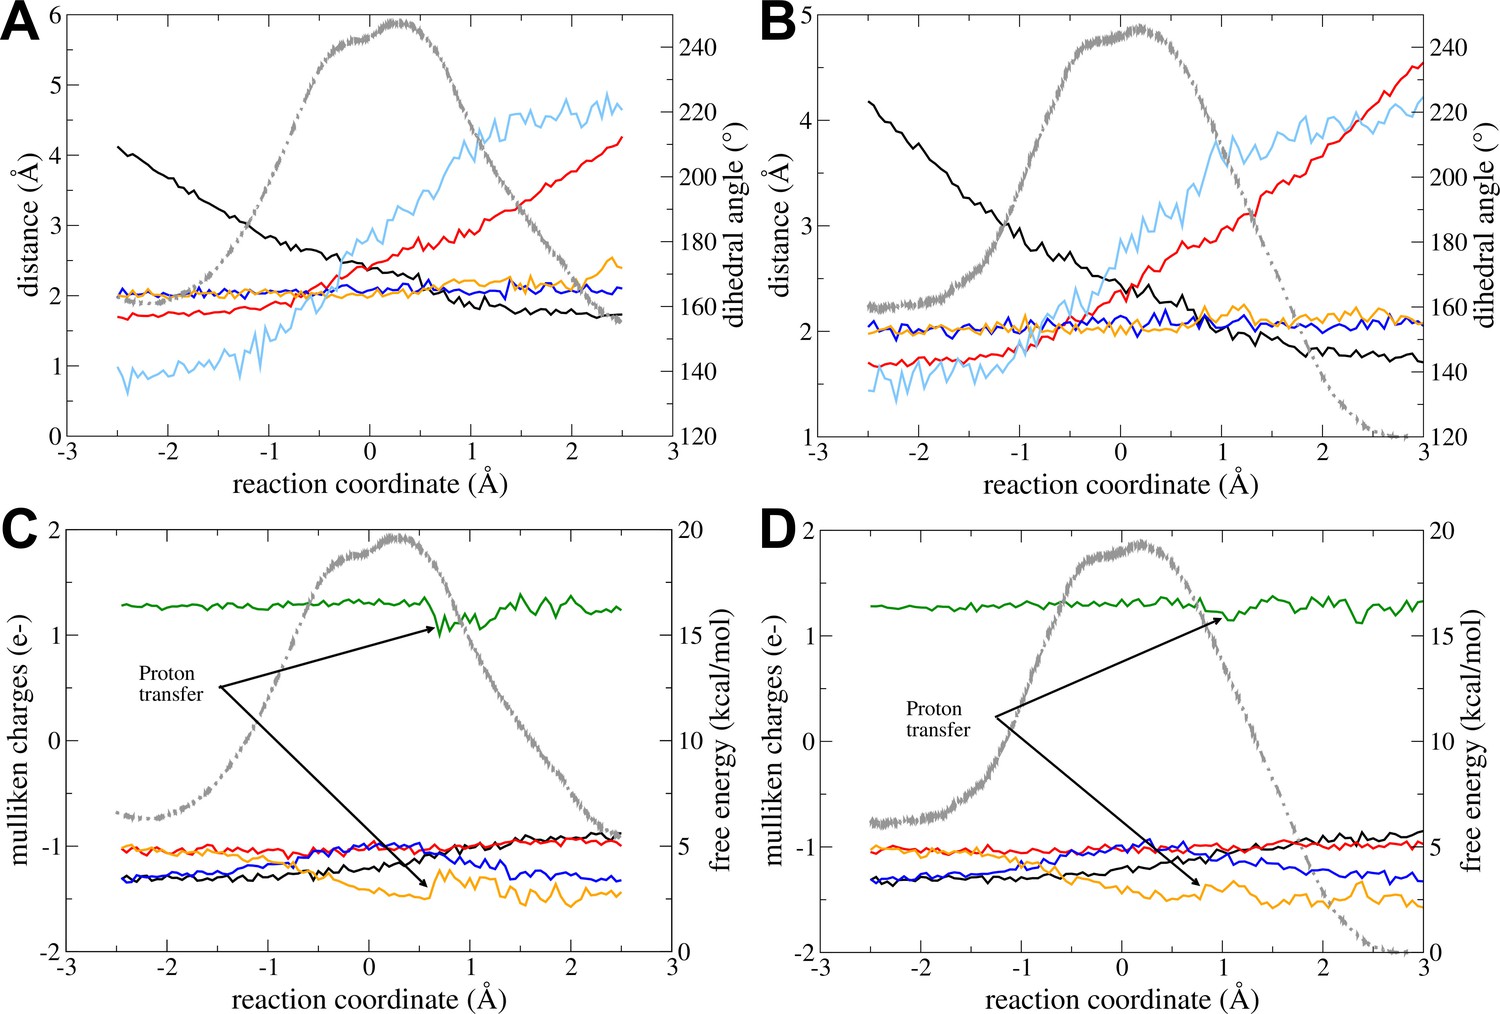
Figure 3—figure supplement 4
Reaction without Mg2+.
The change in different geometrical parameters along the reaction coordinate is shown for (A) forward and (B) backward reactions. Parameters shown: distance Oleaving – Ptransferring (red), distance Oattacking – Ptransferring (black), and transferring phosphate dihedral angle (light blue). The charge (mulliken charge) variation of different moieties involved in the reaction are shown for (C) forward and (D) backward reactions: alpha-phosphate of ADPATP-lid (red), alpha-phosphate of ADPAMP-lid (orange), beta-phosphate of ADPATP-lid (black), and transferring phosphate (blue). The distances involving the proton transfer are shown for (E) forward and (F) backward reactions: H – Oattacking (black), H – O of transferring phosphate (red), and H – O of alpha-phosphate of ADPAMP-lid (green). In all plots, the free-energy profile (FEP) is shown in the background as light gray dashed line.
Figure 3—figure supplement 5
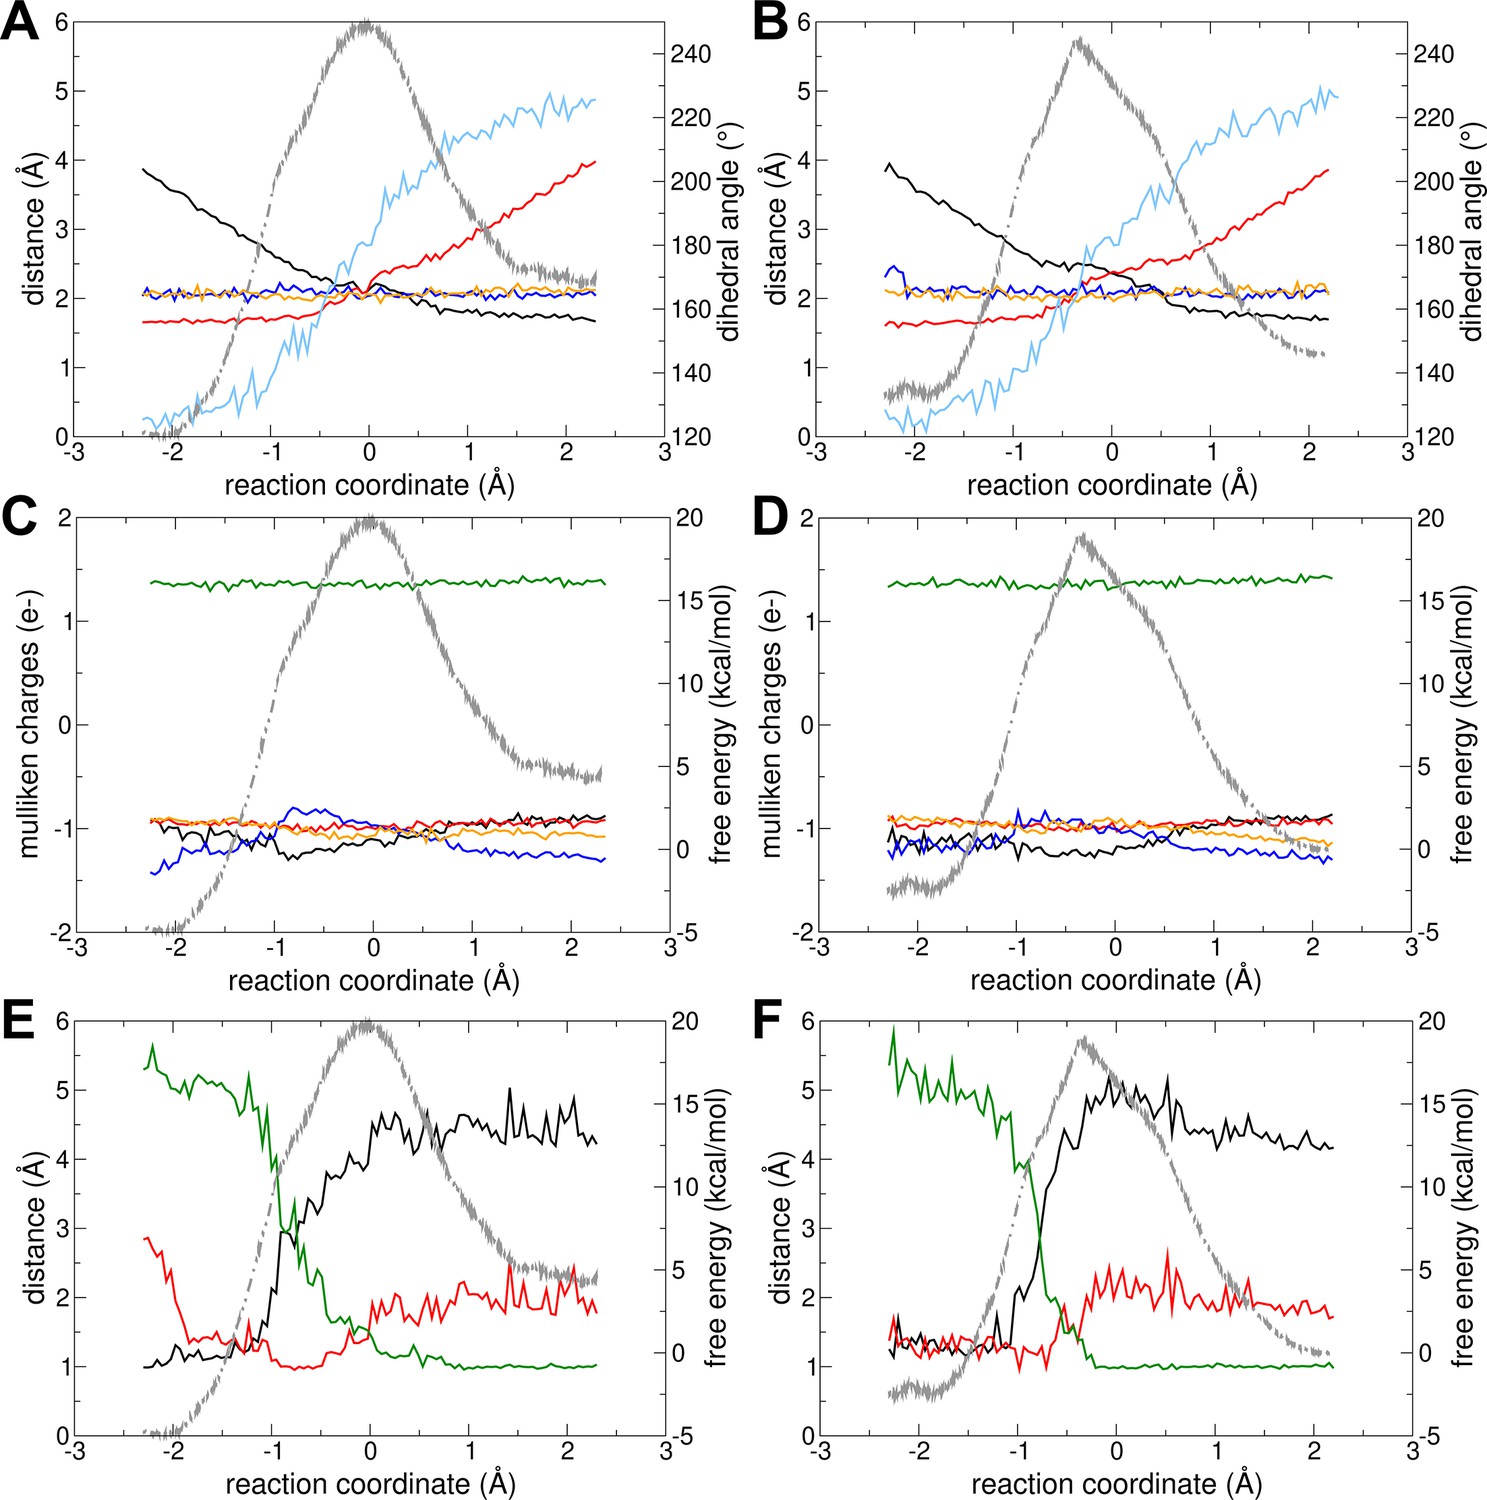
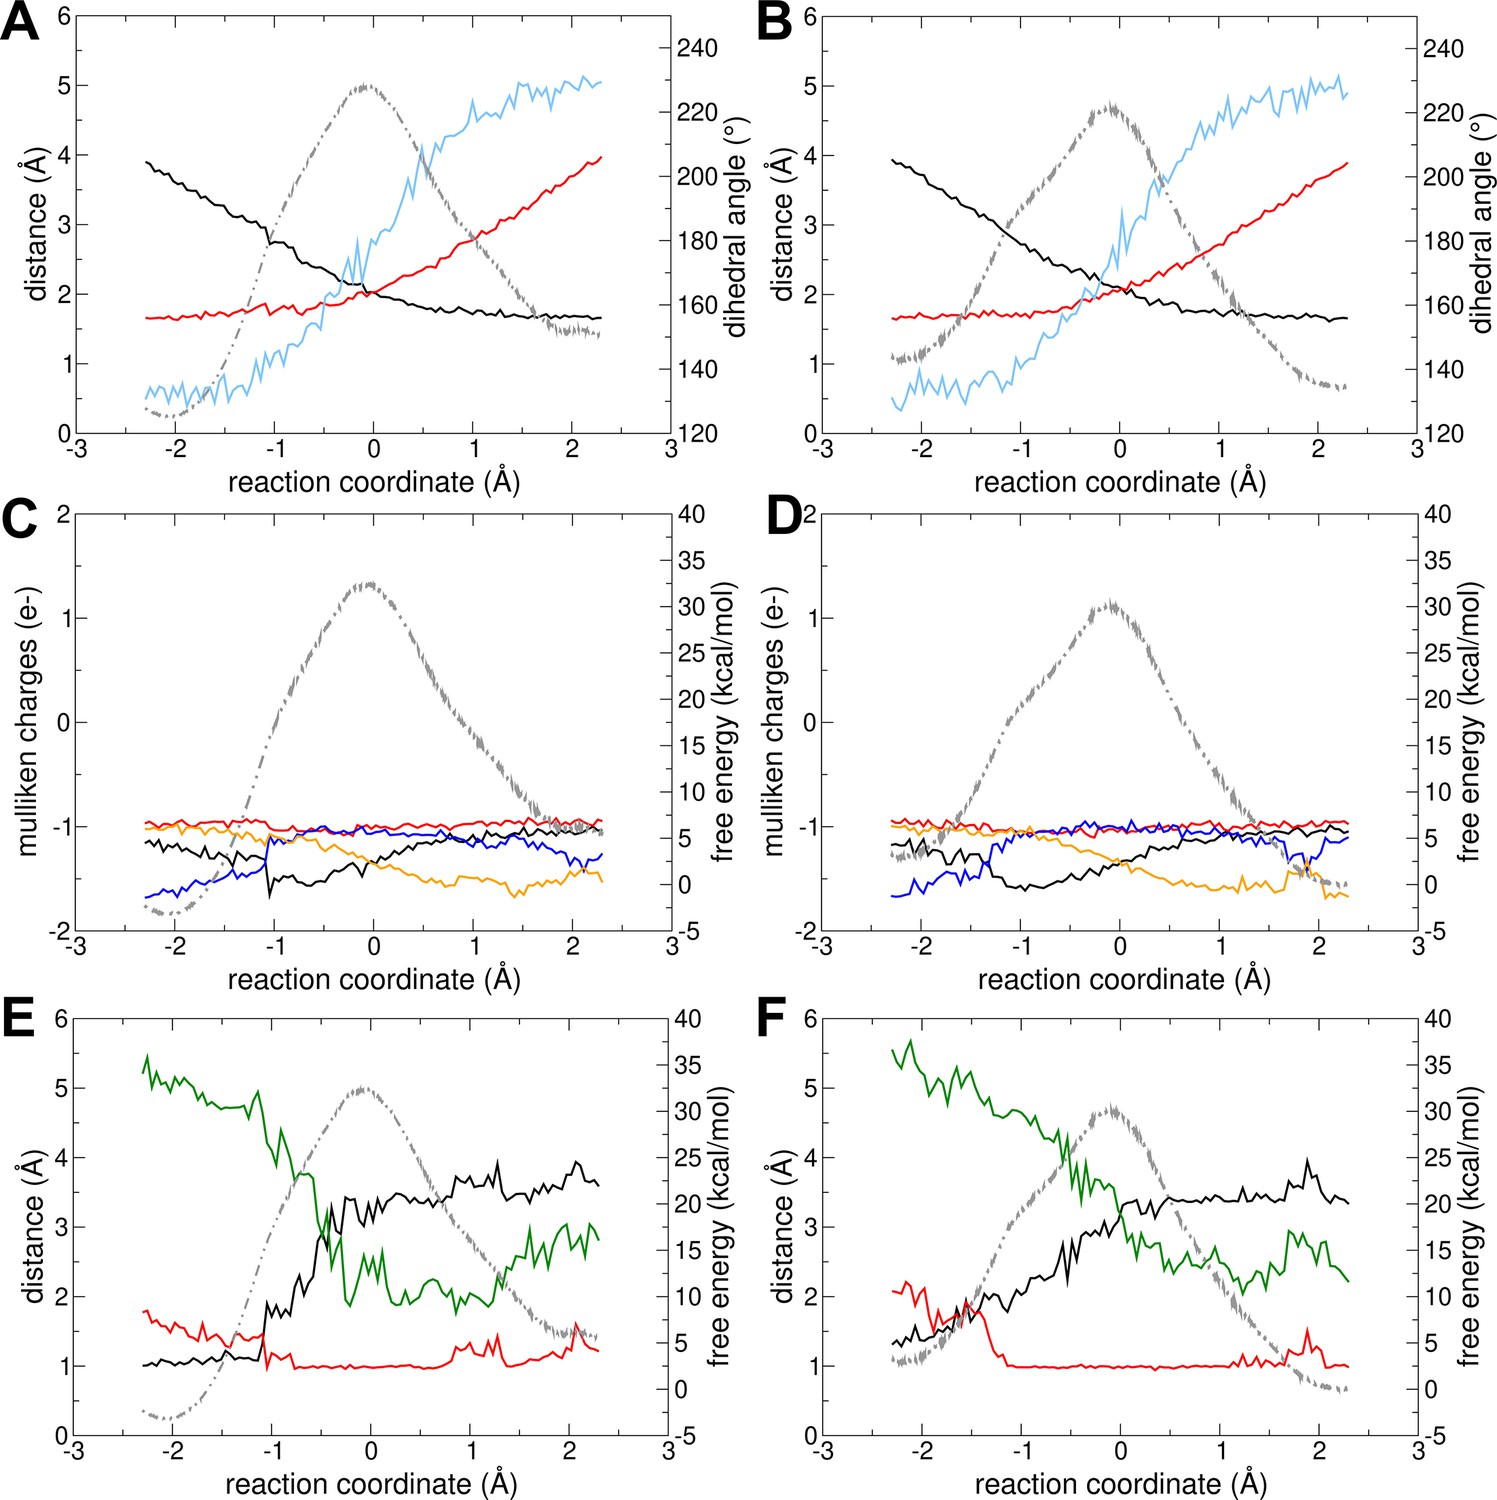
Reaction with Mg2+ and protonated in an oxygen of the beta-phosphate of ADPATP-lid.
The change in different geometrical parameters along the reaction coordinate is shown for (A) forward and (B) backward reactions. Parameters shown: distance Oleaving – Ptransferring (red), distance Oattacking – Ptransferring (black), transferring phosphate dihedral angle (light blue), distance Mg2+ – O from transferring phosphate (blue), and distance Mg – O from beta-phosphate of ADPATP-lid (orange). The charge (mulliken charge) variation of different moieties involved in the reaction with Mg2+are shown for (C) forward and (D) backward reactions: Mg2+ (green), alpha-phosphate of ADPATP-lid (red), alpha-phosphate of ADPAMP-lid (orange), beta-phosphate of ADPATP-lid (black), and transferring phosphate (blue). The distances involving the proton transfer are shown for (E) forward and (F) backward reactions: H – Oattacking (black), H – O of transferring phosphate (red), and H – O of alpha-phosphate of ADPAMP-lid (green). In all plots, the free-energy profile (FEP) is shown in the background as light gray dashed line.
Figure 3—figure supplement 6
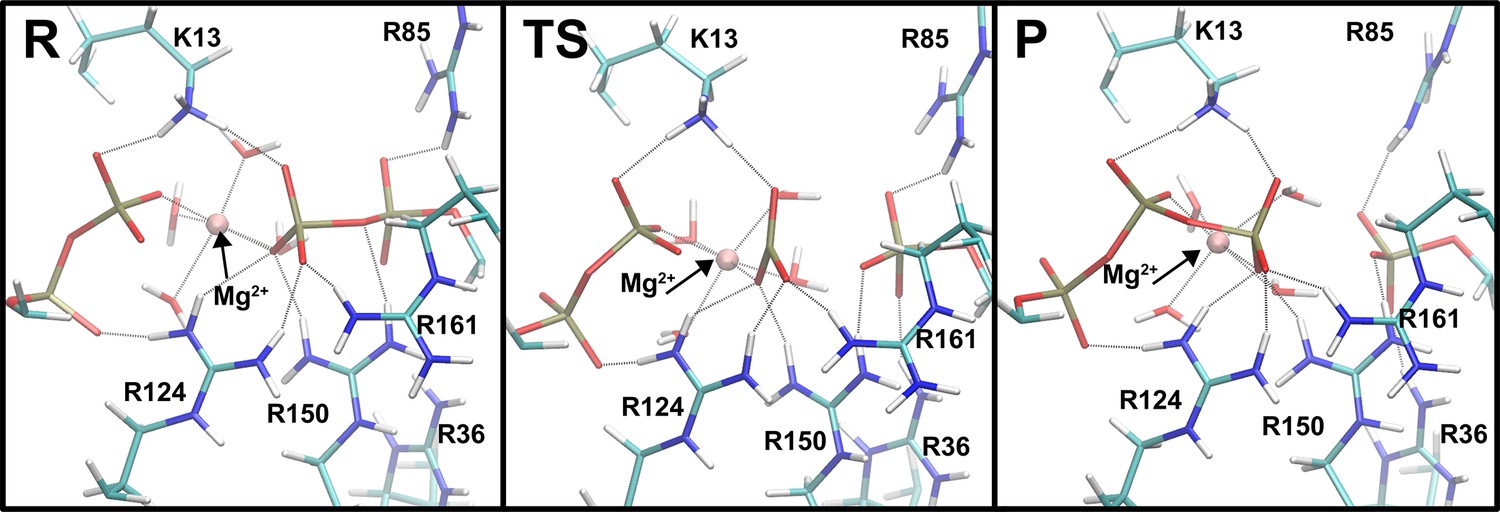
Representative snapshots for the reactant, transition state (TS), and product states in the system with Mg2+.
The main interactions between the phosphate moieties of the nucleotides and the amino acid side chains in the active site are shown (in gray dashed lines).
Figure 3—figure supplement 7
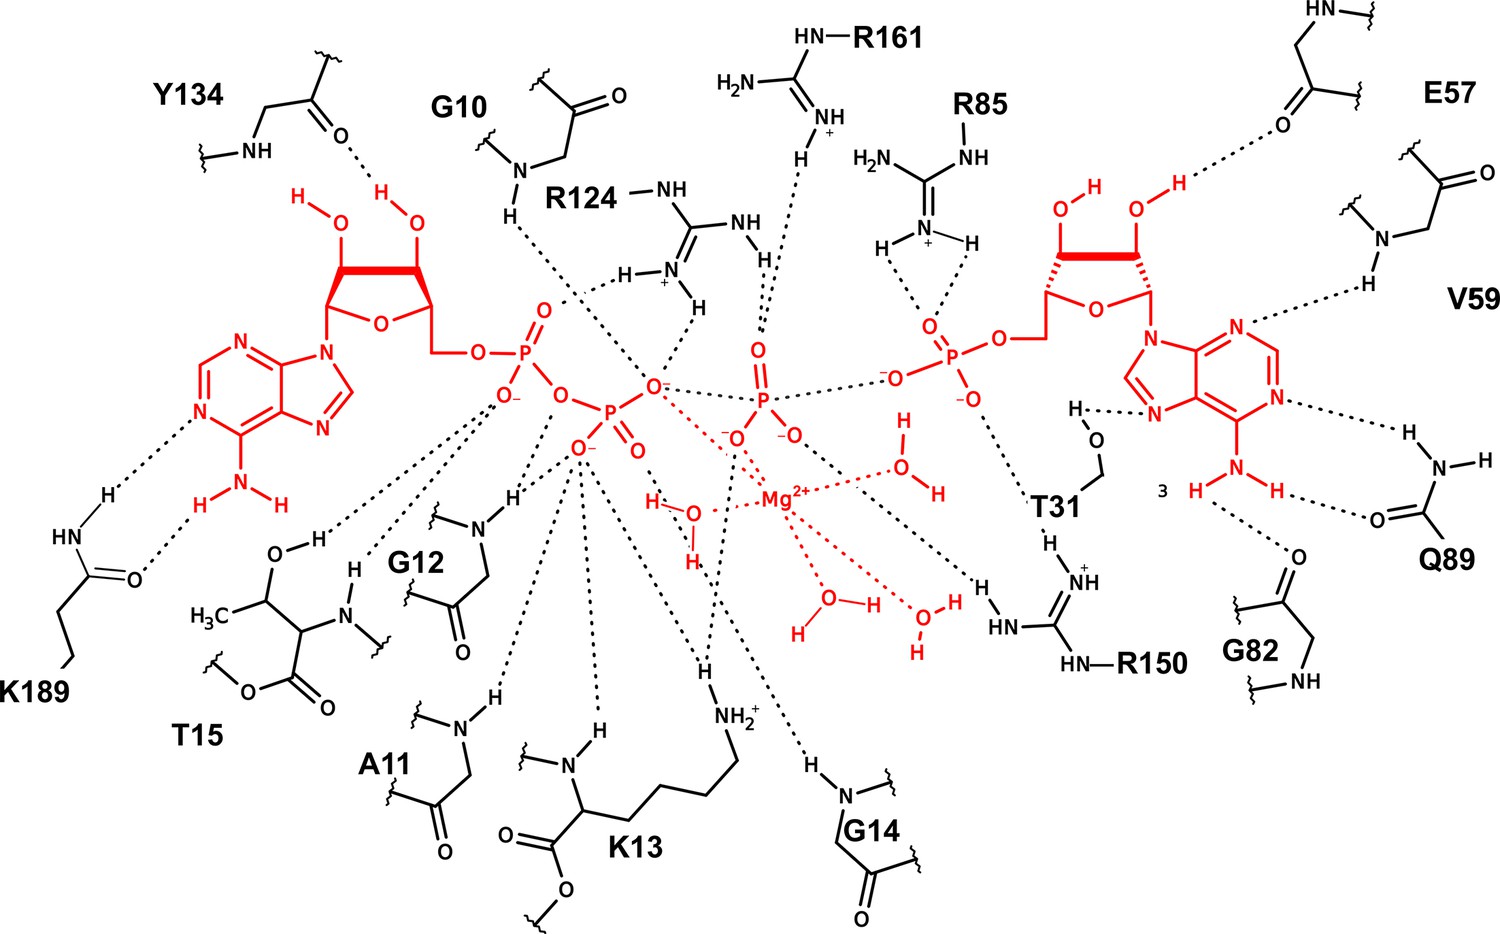
Representation of the interactions between the nucleotides with the active-site amino acids and Mg2+ in the active site of adenylate kinase (Adk) for a representative snapshot from the transition-state ensemble (TSE).
Figure 3—figure supplement 8
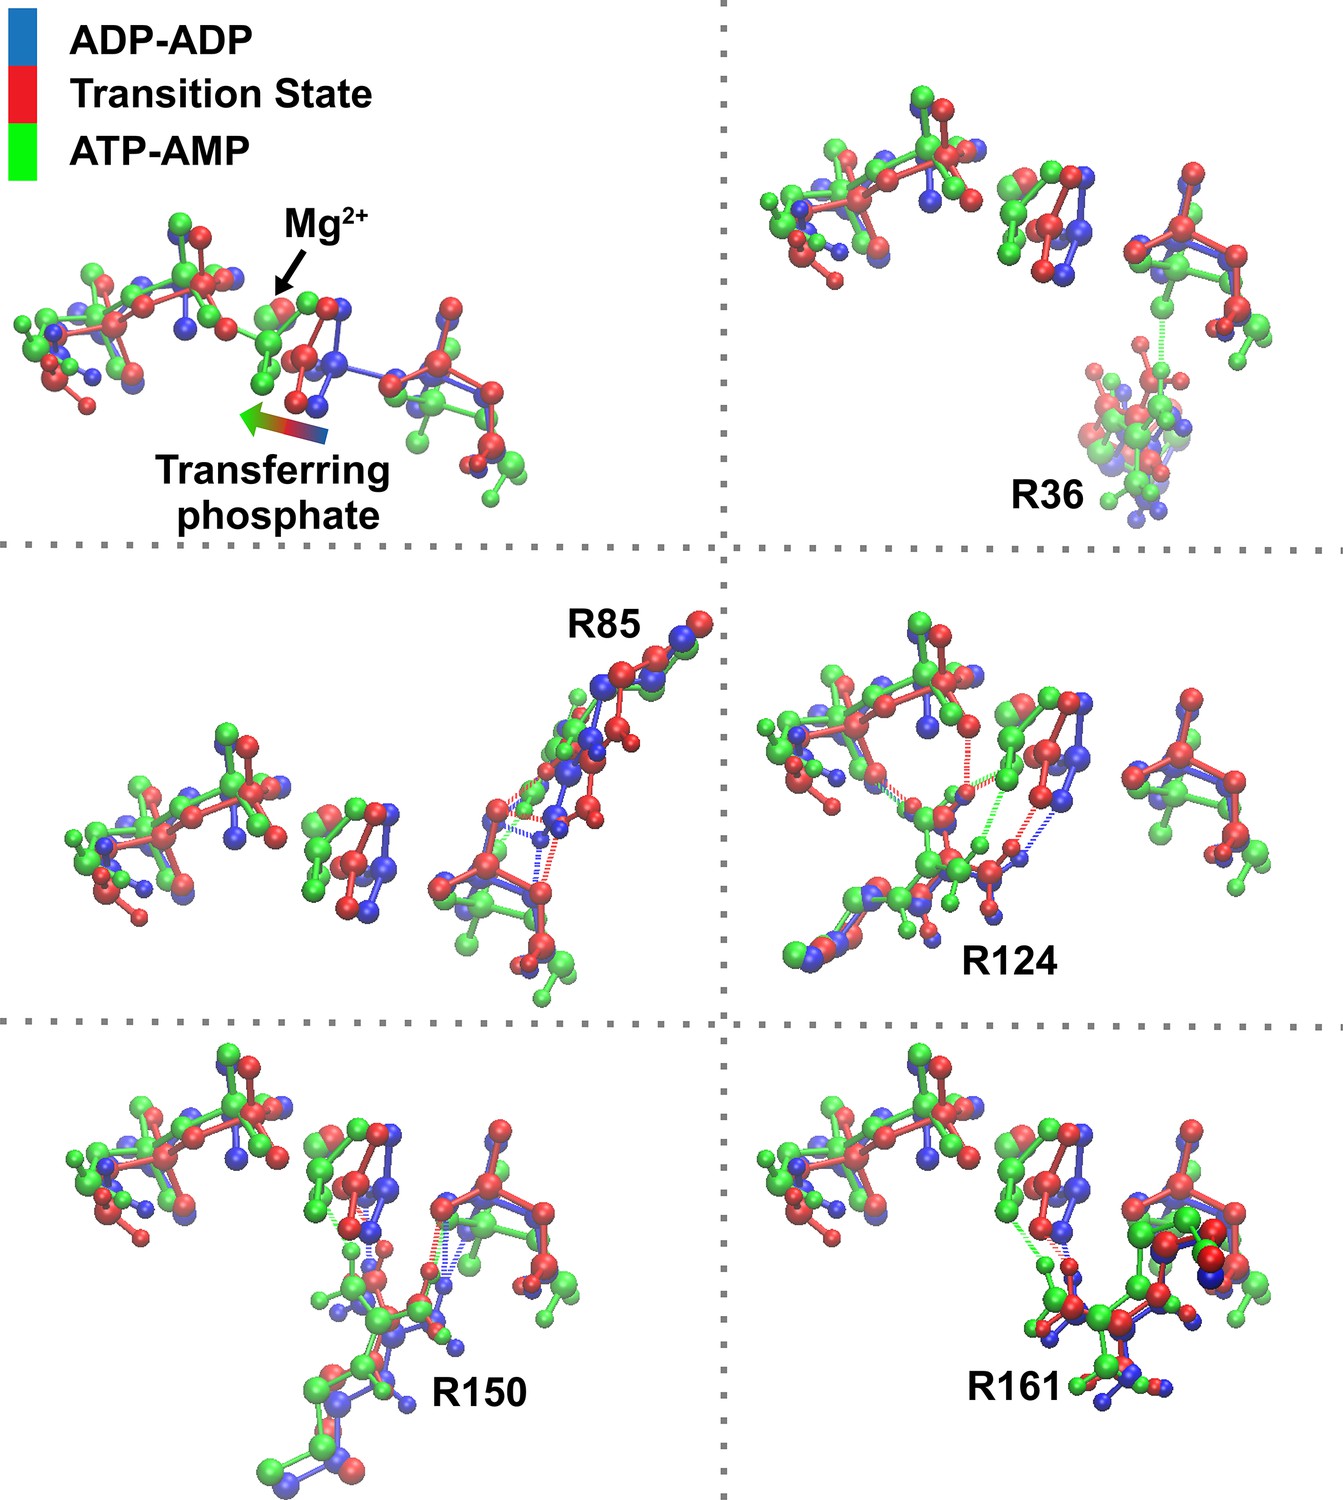
Superposition of reactant (blue), transition state (TS) (red), and product (green) states focusing on the transferring phosphate and the main amino acids assisting phosphoryl transfer, for the system with Mg2+.
Figure 3—figure supplement 9
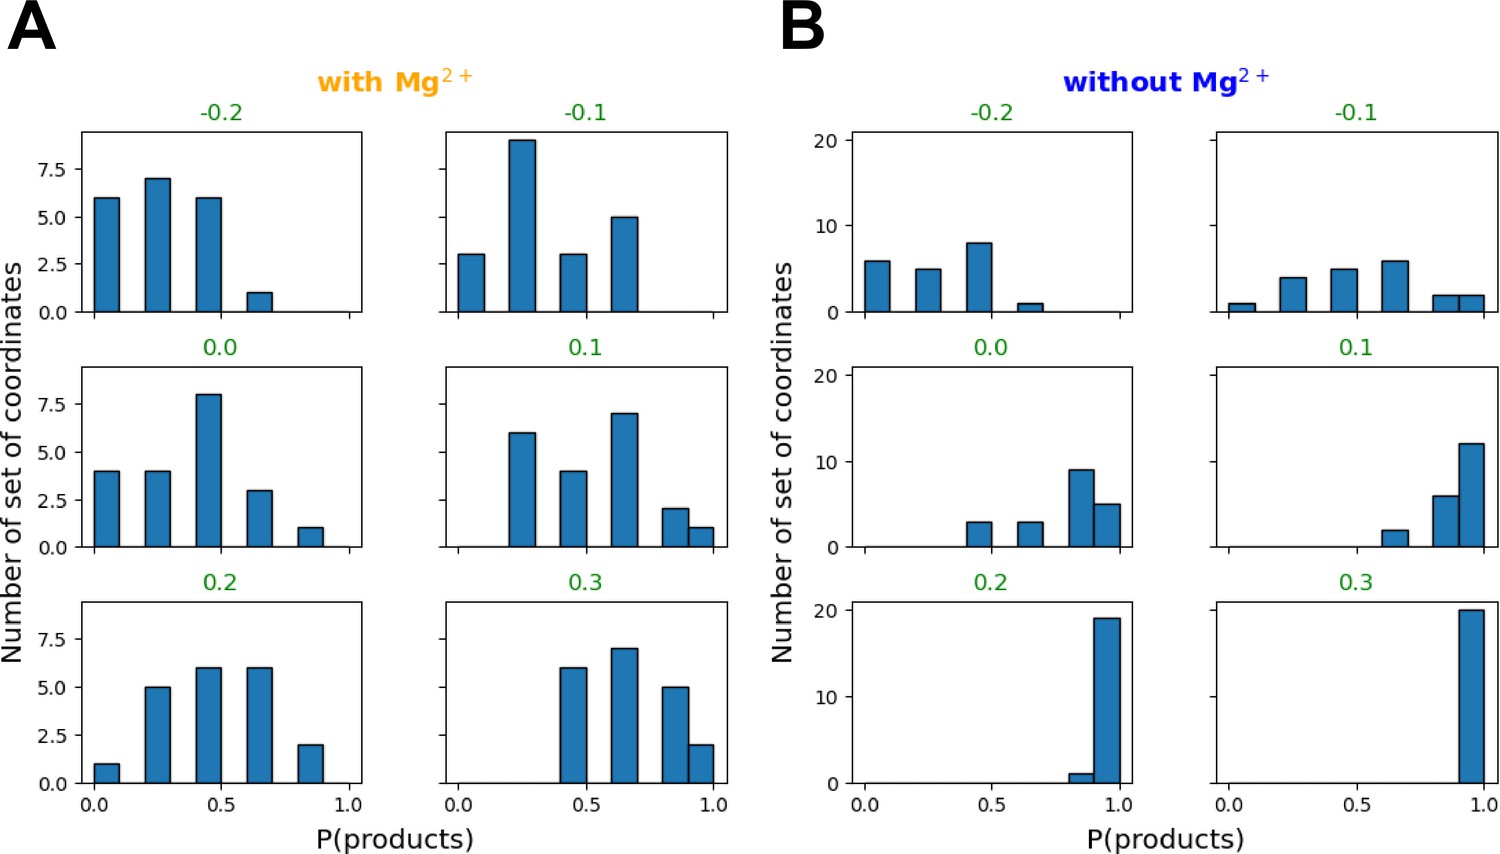
Committor distribution (histogram) between reaction coordinate values (RC) from −0.2 to 0.3 for the reaction with (A) and without Mg2+ (B).
RC equal to 0.0, 0.1, and 0.2 Å with Mg2+ have a transition state (TS)-like ensemble distribution, whereas only RC equal to −0.1 Å has a TS-like ensemble distribution without Mg2+.
Figure 4
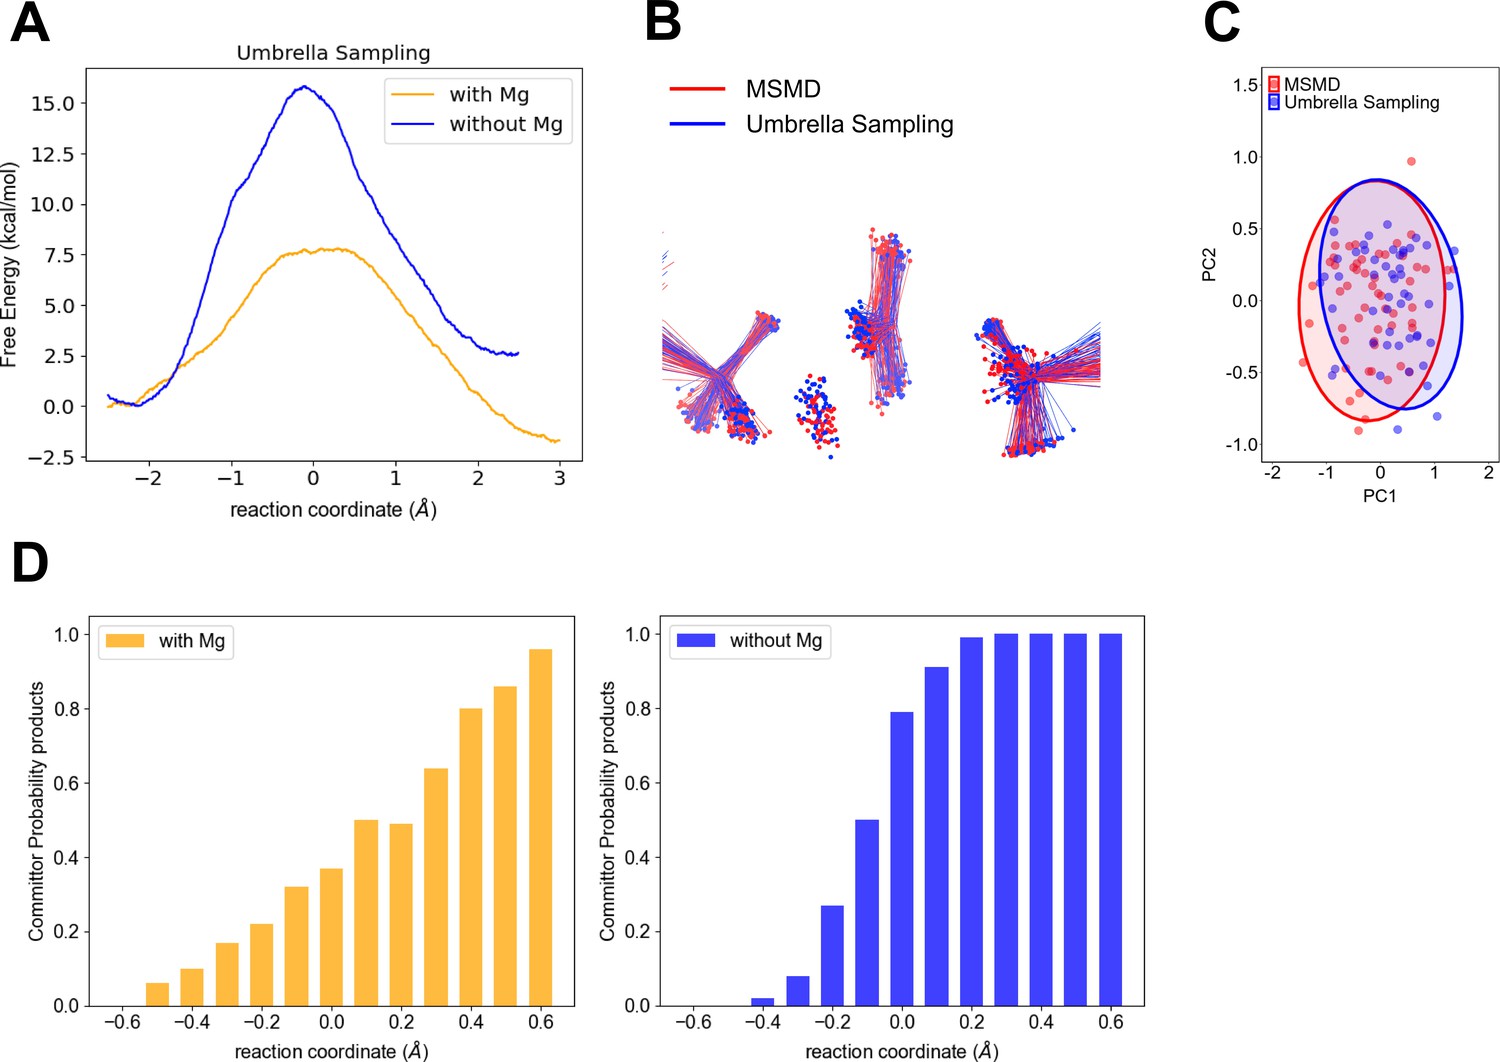
Computational testing of wider transition-state ensemble (TSE) for P-transfer step in adenylate kinase (Adk) in the presence of Mg2+ versus no divalent metal.
(A) Free-energy profiles obtained by umbrella sampling for reactions with and without Mg2+. (B) Comparison of the TSE from multiple steered molecular dynamics (MSMD) and umbrella sampling for runs in the presence of Mg2+. The TSE structures were aligned by atoms of the Pα and O3α atoms from AD(M)P and Pβ and O3β atoms from AD(T)P. (C) First principal component (PC1) and second principal component (PC2) obtained from principal component analysis (PCA) for b. The PCA was calculated using the transferring phosphate atoms, Mg2+ ion, Pα and O3α atoms from AD(M)P and Pβ and O3β atoms from AD(T)P. The TSE structures aligned by atoms of the P–Oleaving and P–Oattacking (see method for details). (D) Commitment plot with the committor probability to products (ATP + AMP) for the reaction with and without Mg2+.
Figure 5
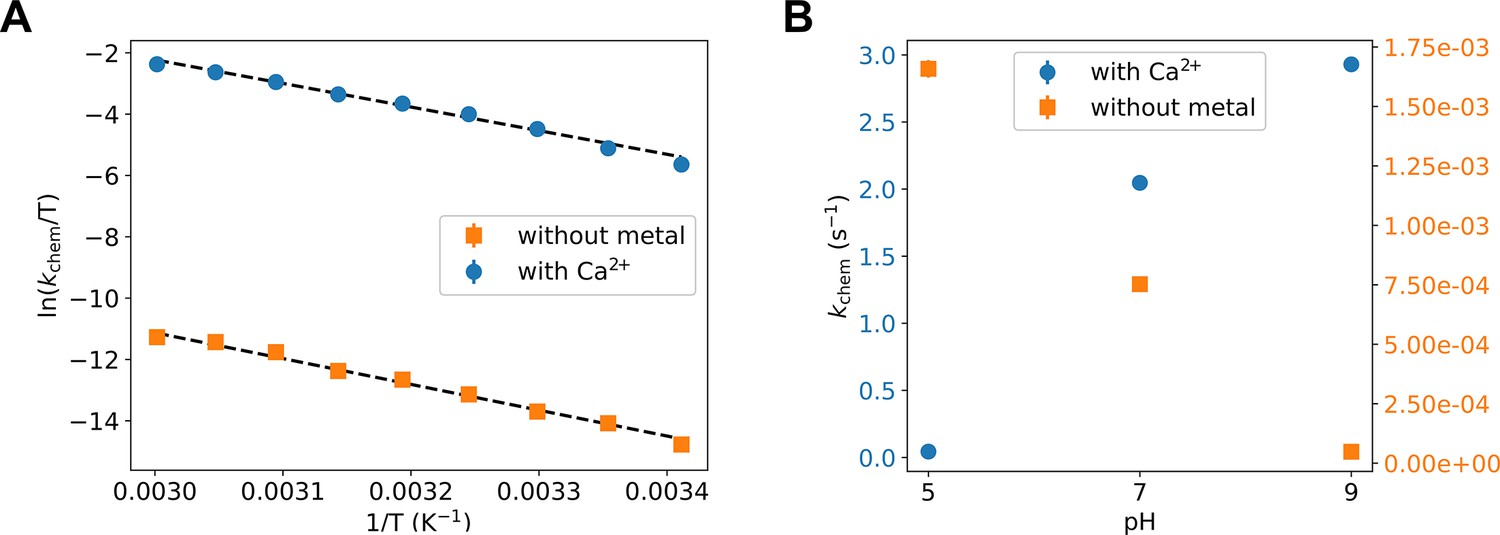
Experimental testing of the computational findings.
(A, B) Turnover rate constants that represent the chemical step (kchem) under these conditions were measured with 8 mM ADP/Mg2+ by HPLC detection of build-up of ATP and AMP. (A) Temperature dependence of the phosphoryl-transfer step measured in presence of calcium and in absence of divalent any cations, plotted as Eyring plots. Fits to the Eyring equation (dashed lines) result in ΔH‡ = 16.7 ± 1 kcal/mol and ΔS‡ = −19.1 ± 3.1 cal/mol/K without metal, and ΔH‡ = 15.3 ± 0.5 kcal/mol and ΔS‡ = −5.7 ± 1.6 cal/mol/K with Ca2+. (B) pH dependence of kchem measured in the presence of calcium and in absence of any divalent cation.
Tables
Table 1
Free-energy profile estimates of the free-energy parameters of the reaction, using self-consistent charge-density functional tight-binding (SCC-DFTB) (all values in kcal/mol).
| With Mg2+ | Without Mg2+ | With Mg2+, ADP monoprotonated | |
|---|---|---|---|
| ΔG* | −6 (1.7) | +4 (2.5) | +6 (1.9) |
| ΔfG† | 13 (0.9) | 34 (1.6) | 23 (0.9) |
| ΔbG† | 20 (0.8) | 30 (0.9) | 18 (0.9) |
| ξ(TS) | −0.5 to 0.7 ‡ 0.0 to 0.2 |
| −0.3 to −0.1 ‡ Not calculated |
| ζ(TS) | 165 to 190 | 165 to 180 | 170 to 180 |
-
ξ(TS) is the range of the reaction coordinate in the TSE (in Å); ζ(TS) is the improper dihedral angle of the transferring phosphate in the TS. The estimated errors of the free energies are in parenthesis and are computed as described in Materials and methods.
-
*
overall reaction free energy.
-
†
activation free energy of the forward reaction; activation free energy of the backward reaction.
-
‡
Values were analyzed by a visual analysis of the multiple steered molecular dynamics (MSMD) trajectories, no committor distribution were calculated.
Table 2
Experimentally determined observed rate constants of the forward and backward chemical reactions for mutant forms of adenylate kinase (Adk) in the presence of Mg2+.
Note that the corresponding rate constants for the phosphoryl transfer in the wild-type protein are too fast to be directly measured and have been estimated to be more than three orders of magnitude faster than in the mutants (Kerns et al., 2015).
| AAdk mutant | Rate constant (s−1)2 ADP → ATP + AMP | Rate constant (s−1)ATP + AMP → 2 ADP |
|---|---|---|
| R124K | 4.6 ± 0.5 | 1.6 ± 0.4 |
| R150K | 1.3 ± 0.3 | 1.1 ± 0.3 |
| R161K | 0.4 ± 0.1 | 0.5 ± 0.2 |
| R85K | 0.3 ± 0.1 | 1.6 ± 0.2 |
| R36K | 0.8 ± 0.2 | 14 ± 2 |
Additional files
Download links
A two-part list of links to download the article, or parts of the article, in various formats.
Downloads (link to download the article as PDF)
Open citations (links to open the citations from this article in various online reference manager services)
Cite this article (links to download the citations from this article in formats compatible with various reference manager tools)
Wide transition-state ensemble as key component for enzyme catalysis
eLife 12:RP93099.
https://doi.org/10.7554/eLife.93099.4


