Salmonella-induced SIRT1 and SIRT3 are crucial for maintaining the metabolic switch in bacteria and host for successful pathogenesis
- Department of Microbiology and Cell Biology, Indian Institute of Science, India
- Centre of Infectious Disease Research, Indian Institute of Science, India
- Pharmacology Division, CSIR-Central Drug Research Institute, India
- Academy of Scientific and Innovative Research (AcSIR), India
- Adjunct Faculty, School of Biology, Indian Institute of Science Education and Research, India
Figures
Figure 1 with 1 supplement
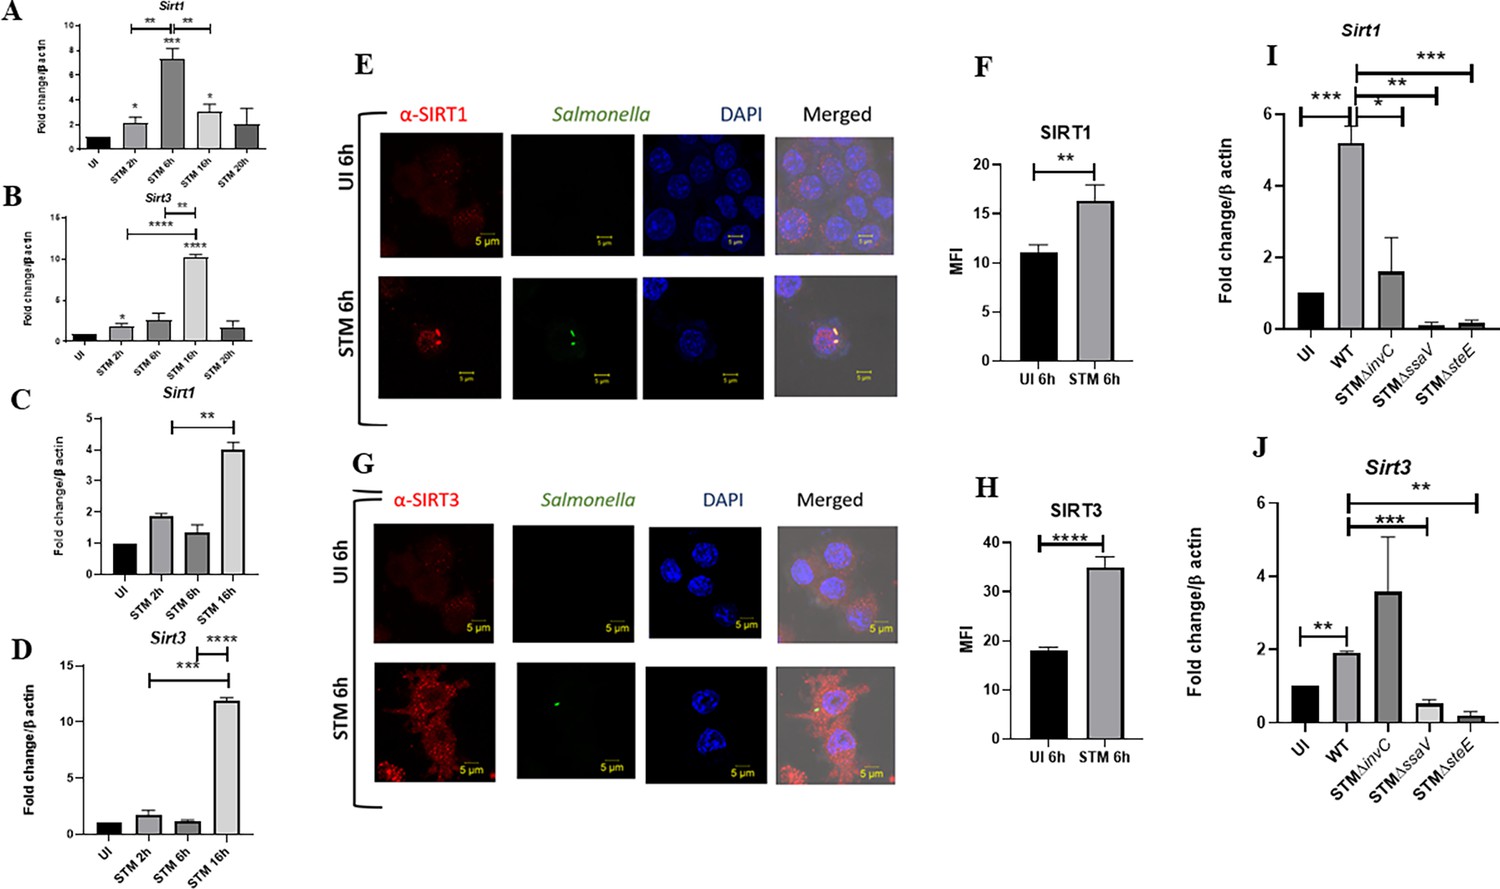
Salmonella modulates the expression of SIRT1 and SIRT3 along its course of infection.
(A, B) Expression studies of Sirt1 and Sirt3 through qPCR in RAW 264.7 macrophages. Data is representative of N = 4, n = 2. Unpaired two-tailed Student’s t-test was performed to obtain the p-values (****p<0.0001, ***p<0.001, **p<0.01, *p<0.05). (C, D) Expression studies of Sirt1 and Sirt3 through qPCR in peritoneal macrophages derived from C57BL/6. Data is representative of N = 3, n = 2. Unpaired two-tailed Student’s t-test was performed to obtain the p-values (****p<0.0001, ***p<0.001, **p<0.01, *p<0.05). (E) Representative confocal images of RAW 264.7 macrophages exhibiting SIRT1 expression upon S. Typhimurium infection at indicated time points post-infection. Data is representative of N = 3, n = 80 (microscopic field). (F) Quantitative representation of the expression profile as depicted in the confocal images (E) in terms of mean fluorescence intensity (MFI). Unpaired two-tailed Student’s t-test was performed to obtain the p-values (****p<0.0001, ***p<0.001, **p<0.01). (G) Representative confocal images of RAW 264.7 macrophages exhibiting SIRT3 expression upon S. Typhimurium infection at indicated time points post-infection. Data is representative of N = 3, n = 80 (microscopic field). (H) Quantitative representation of the expression profile as depicted in the confocal images (G) in terms of MFI. Unpaired two-tailed Student’s t-test was performed to obtain the p-values (****p<0.0001, ***p<0.001, **p<0.01). (I) qPCR-mediated expression of Sirt1 in RAW 264.7 macrophages upon infection with wildtype S. Typhimurium or SPI-1 (∆invC)or SPI-2 (∆ssaV and ∆steE) mutants of S. Typhimurium. Data is representative of N = 3,n = 3. Unpaired two-tailed Student’s t-test was performed to obtain the p-values. (****p<0.0001, ***p<0.001, **p<0.01). (J) qPCR-mediated expression of Sirt3 in RAW 264.7 macrophages upon infection with wildtype S. Typhimurium or SPI-1 (∆invC) or SPI-2 (∆ssaV and ∆steE) mutants of S. Typhimurium. Data is representative of N = 3, n = 3. Unpaired two-tailed Student’s t-test was performed to obtain the p-values (****p<0.0001, ***p<0.001, **p<0.01).
Figure 1—figure supplement 1
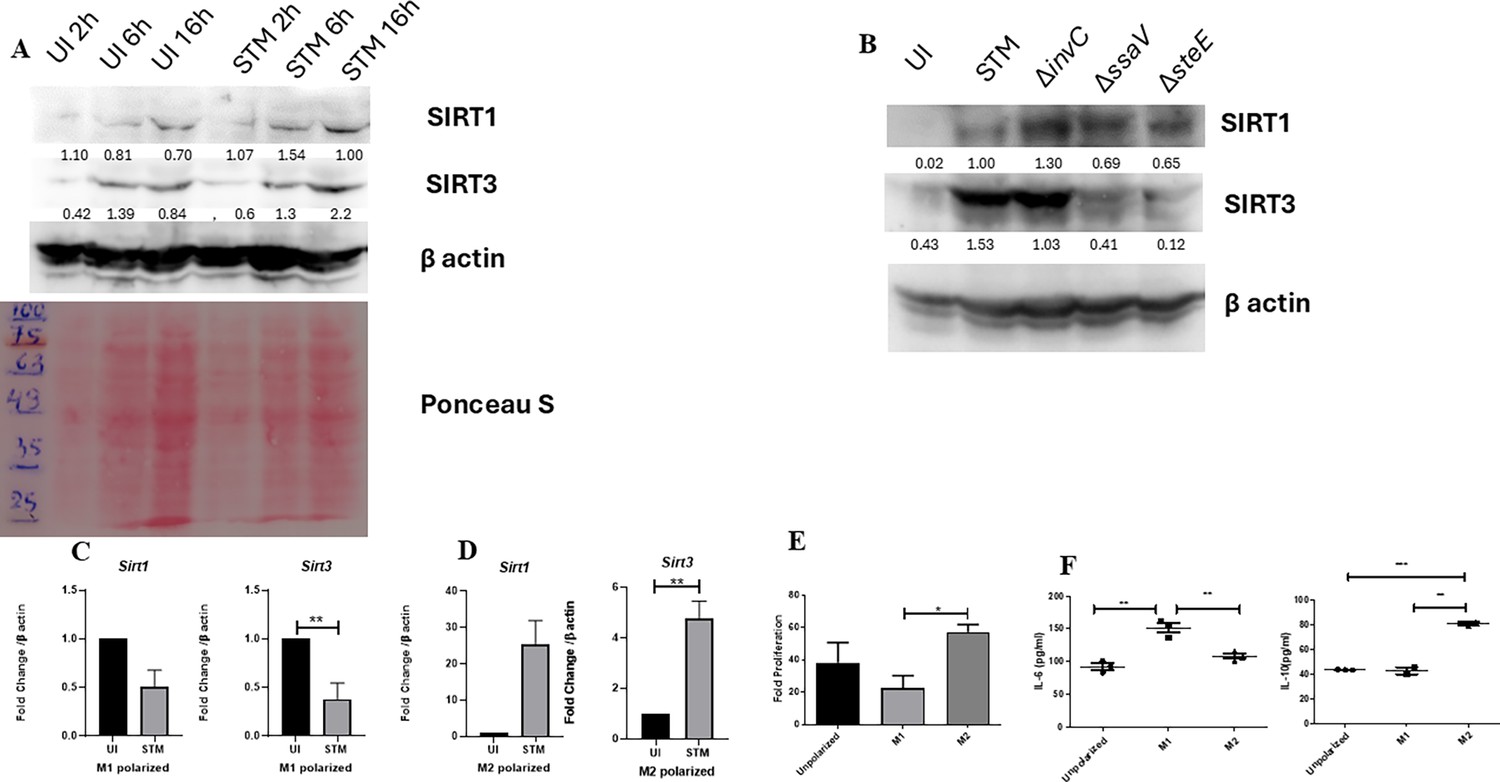
Salmonella modulates the expression of SIRT1 and SIRT3 along its course of infection.
(A) Expression studies of SIRT1 and SIRT3 through immunoblotting in RAW 264.7 macrophages. (B) Representative immunoblot showing SIRT1 and SIRT3 expression at 16 hr post-infection with wildtype S. Typhimurium, SPI-1 mutant-∆invC, and SPI-2 mutants-∆ssaV, ∆steE. (C) Sirt1 and Sirt3 transcript-level expression in M1-polarized RAW 264.7 macrophages at 16 hr post-infection. Data is representative of N = 3, n = 3. Unpaired t-test was performed to obtain p values (****p<0.0001, ***p<0.001, **p<0.01, *p<0.05). (D) Expression profile of Sirt1 and Sirt3 in M2-polarized RAW 264.7 macrophages at 16 hr post-infection. Data is representative of N = 3, n = 3. Unpaired t-test was performed to obtain p-values (****p<0.0001, ***p<0.001, **p<0.01, *p<0.05). (E) Intracellular fold proliferation of S. Typhimurium within non-polarized, M1 and M2-polarized RAW 264.7 macrophages. Data is representative of N = 3, n = 3. Unpaired t-test was performed to obtain p-values (****p<0.0001, ***p<0.001, **p<0.01, *p<0.05). (F) Validation of M1 and M2-polarized status of RAW 264.7 macrophages by estimation of IL-6 and IL-10 production via ELISA 24 hr post-polarization. Data is representative of N = 3, n = 3. Unpaired t-test was performed to obtain p-values (****p<0.0001, ***p<0.001, **p<0.01, *p<0.05).
-
Figure 1—figure supplement 1—source data 1
Original files for western blot analysis displayed in Figure 1—figure supplement 1A.
- https://cdn.elifesciences.org/articles/93125/elife-93125-fig1-figsupp1-data1-v1.xlsx
-
Figure 1—figure supplement 1—source data 2
Original files for western blot analysis displayed in Figure 1—figure supplement 1B.
- https://cdn.elifesciences.org/articles/93125/elife-93125-fig1-figsupp1-data2-v1.zip
-
Figure 1—figure supplement 1—source data 3
File containing original uncropped western blots for Figure 1—figure supplement 1A, indicating relevant bands and treatments.
- https://cdn.elifesciences.org/articles/93125/elife-93125-fig1-figsupp1-data3-v1.zip
-
Figure 1—figure supplement 1—source data 4
File containing original uncropped western blots for Figure 1—figure supplement 1B, indicating relevant bands and treatments.
- https://cdn.elifesciences.org/articles/93125/elife-93125-fig1-figsupp1-data4-v1.zip
Figure 2 with 1 supplement
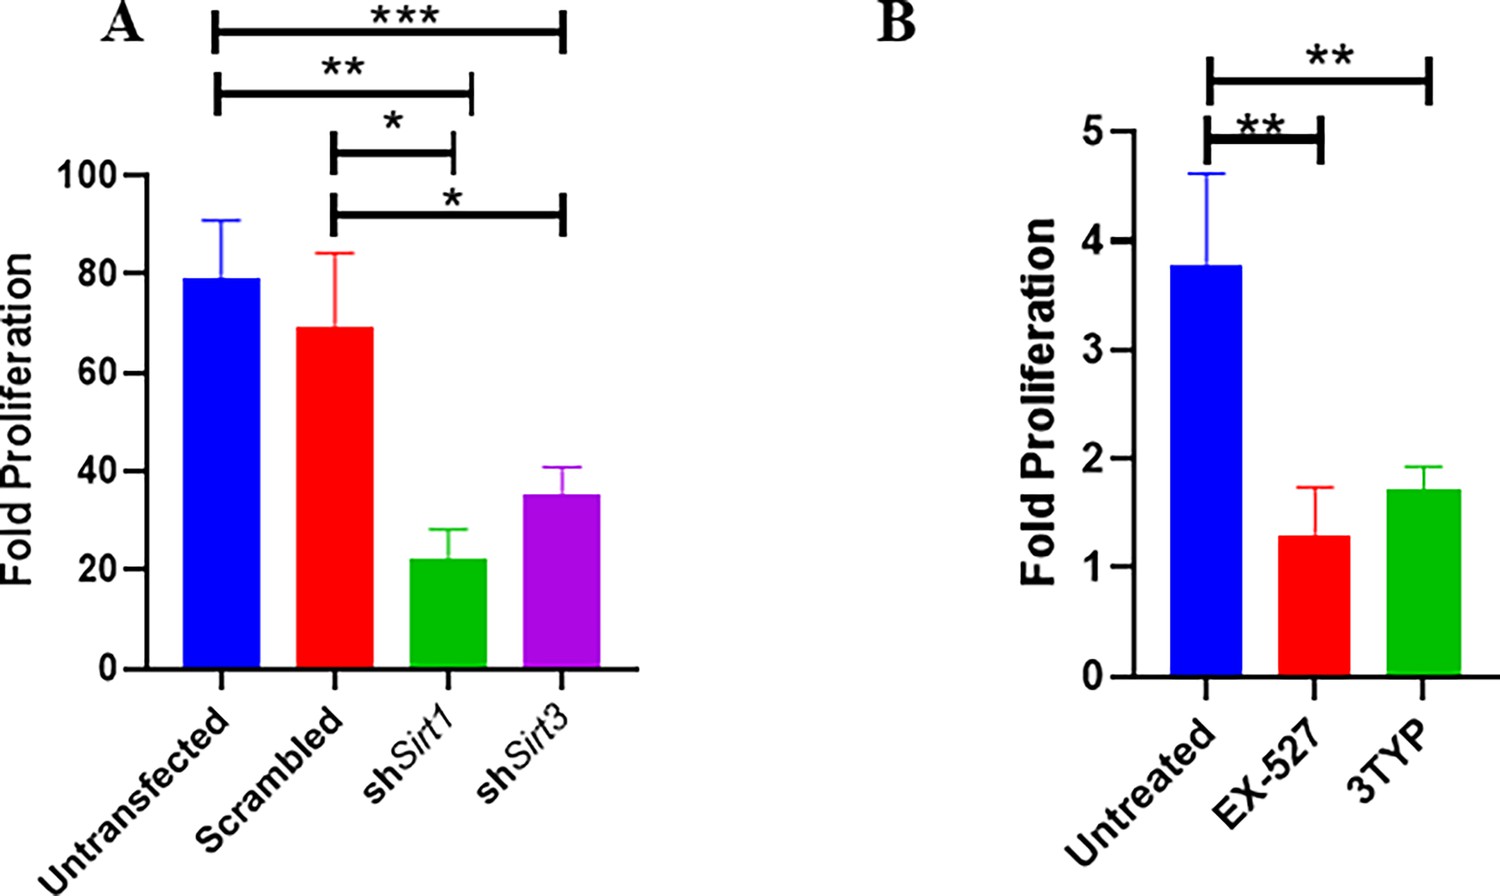
Effect of SIRT1 and SIRT3 knockdown in intracellular bacterial proliferation within RAW 264.7 and primary murine macrophages.
(A) Fold proliferation of S. Typhimurium within RAW 264.7 macrophages in transfected and untransfected conditions. Data is representative of N = 3, n = 3. Unpaired two-tailed Student’s t-test was performed to obtain the p-values (**p<0.01, *p<0.05). (B) Fold proliferation of S. Typhimurium within infected peritoneal macrophages isolated from adult male C57BL/6 mice upon SIRT1 (EX-527) or SIRT3 (3TYP) inhibitor treatment. Unpaired two-tailed Student’s t-test was performed to obtain the p-values (**p<0.01, *p<0.05).
Figure 2—figure supplement 1
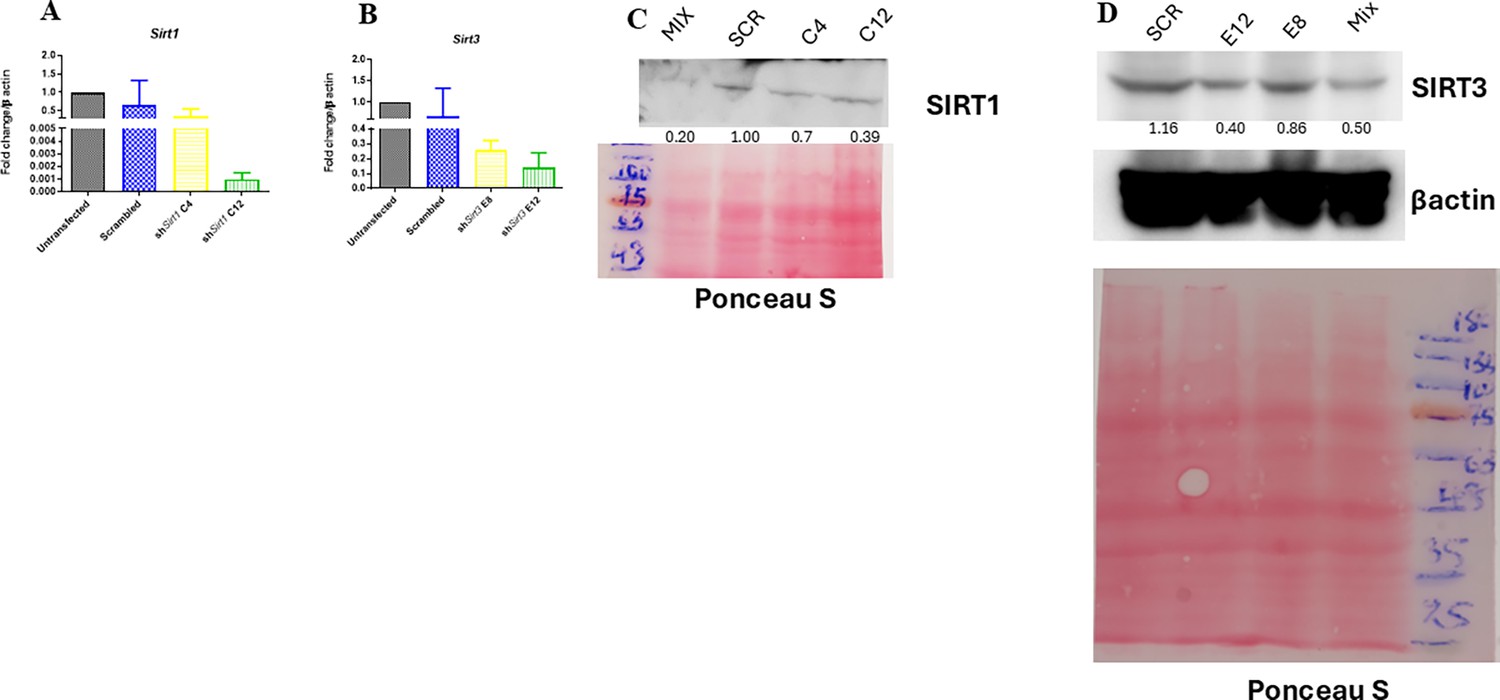
Validation of Sirt1 and Sirt3 knockdown in RAW 264.7 macrophages.
(A) Knockdown confirmation of Sirt1 at transcript level through qPCR. (B) qPCR expression of Sirt3 in order to validate knockdown efficiency. (C) Immunoblotting of SIRT1 for verification of knockdown. Scr = scrambled, Mix = transfection with equimolar concentration of both SIRT1 shRNA construct C4 and C12. (D) Sirt3 knockdown validation through western blotting. Scr = scrambled, Mix = transfection with equimolar concentration of both SIRT3 shRNA construct E8 and E12.
-
Figure 2—figure supplement 1—source data 1
Original files for western blot analysis displayed in Figure 2—figure supplement 1C and D.
- https://cdn.elifesciences.org/articles/93125/elife-93125-fig2-figsupp1-data1-v1.xlsx
-
Figure 2—figure supplement 1—source data 2
File containing original uncropped western blots for Figure 2—figure supplement 1C and D, indicating relevant bands and treatments.
- https://cdn.elifesciences.org/articles/93125/elife-93125-fig2-figsupp1-data2-v1.zip
Figure 3 with 4 supplements
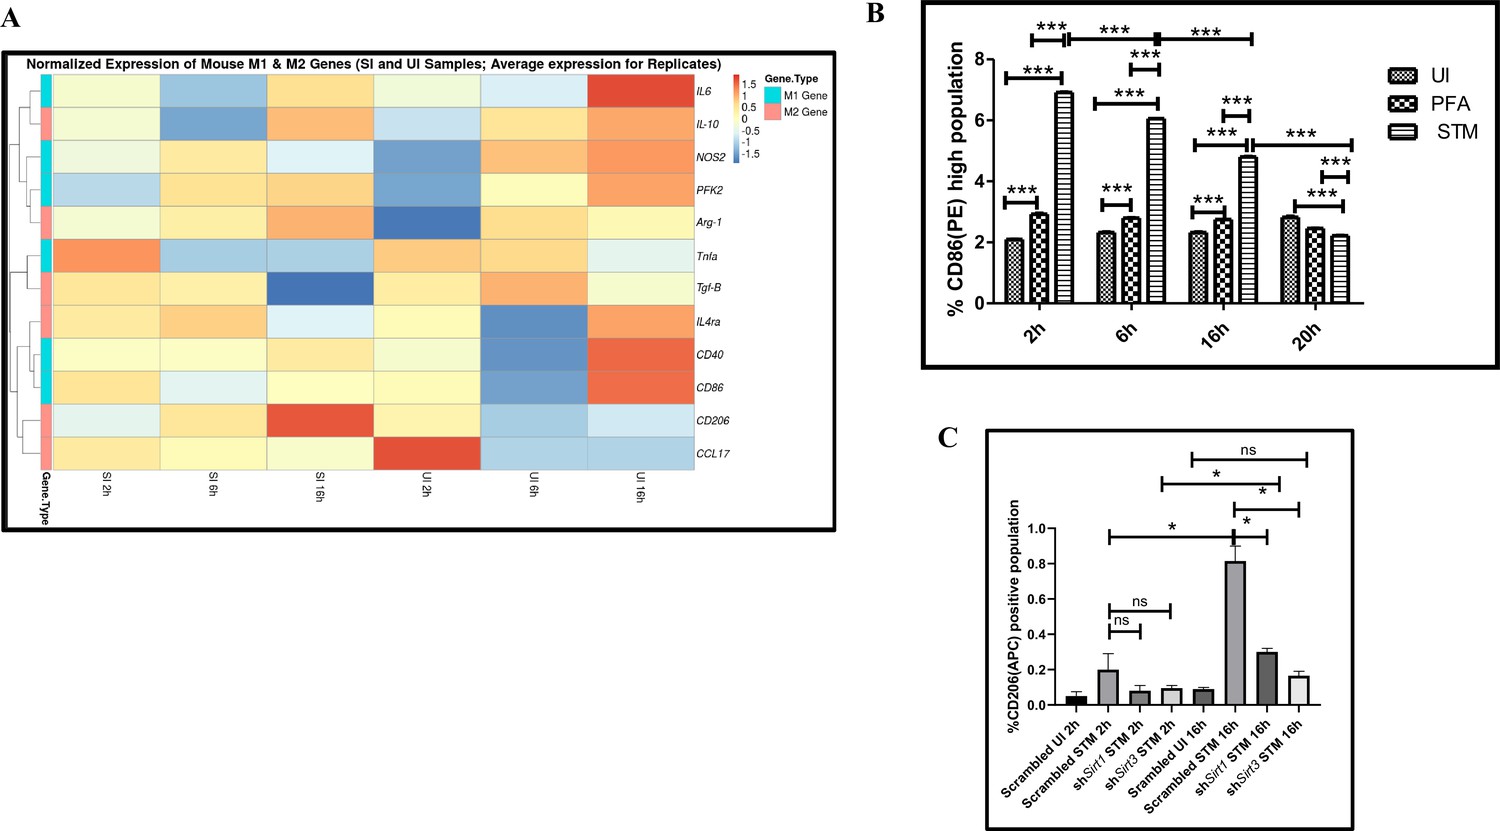
Salmonella Typhimurium skews the polarization state of the macrophage toward an immunosuppressive M2 state along the course of infection.
(A) nanoString gene expression profiling data of S. Typhimurium (STM)-infected RAW 264.7 macrophages versus uninfected control data sets at 2 hr, 6 hr, and 16 hr time points of infection. Data is representative of N = 2, n = 2. (B) Quantitative representation of flow cytometric analysis of alteration in M1 CD86-positive population in STM-infected samples in comparison to uninfected (UI) and paraformaldehyde-fixed (PFA) bacteria at the indicated time post-infection. Data is representative of N = 2, n = 3. Two-way ANOVA and Bonferroni post-t-test were used to obtain p-values (***p<0.001). (C) Quantitative representation of flow cytometric analysis of M2 surface marker CD206 in STM-infected Sirt1 or Sirt3 knockdown RAW 264.7 macrophages in comparison to the scrambled control at the indicated time post-infection. Data is representative of N = 3, n = 3. Two-way ANOVA and Bonferroni post-t-test were used to obtain p-values (***p<0.001).
Figure 3—figure supplement 1
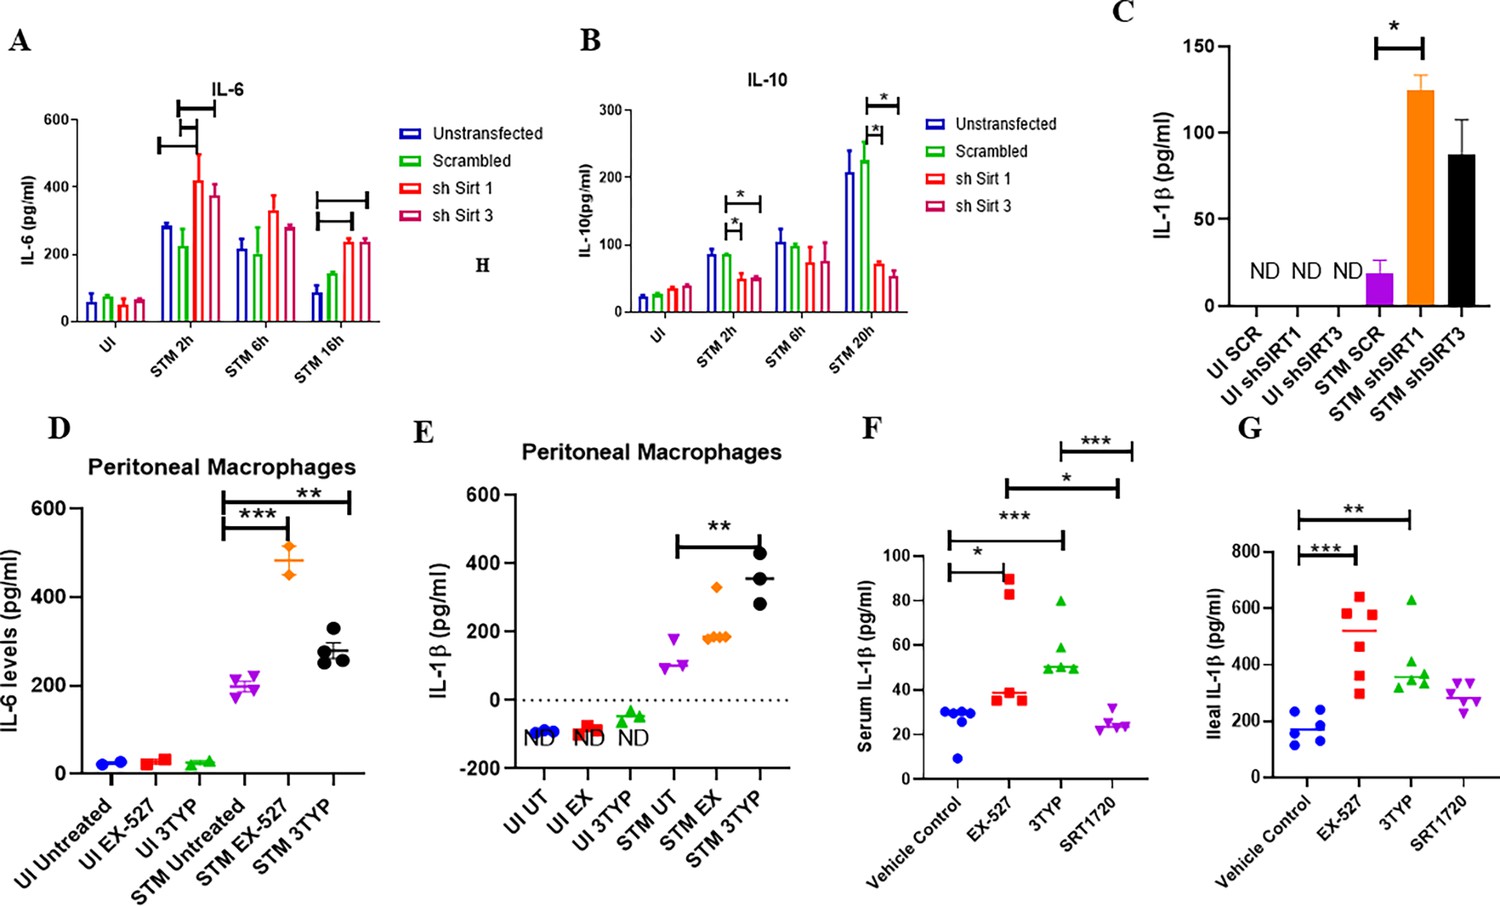
SIRT1 and SIRT3 modulate cytokine production in Salmonella infection scenario.
(A) Estimation of pro-inflammatory IL-6 cytokine production upon S. Typhimurium infection in Sirt1 and Sirt3 knockdown RAW 264.7 macrophages through ELISA. Data is representative of N = 2, n = 2. Unpaired two-tailed Student’s t-test was performed to obtain the p-values (**p<0.01, *p<0.05). (B) Estimation of anti-inflammatory IL-10 cytokine production upon S. Typhimurium infection in Sirt1 and Sirt3 knockdown RAW 264.7 macrophages through ELISA. Data is representative of N = 2, n = 2. Unpaired two-tailed Student’s t-test was performed to obtain the p-values (***p<0.001, *p<0.05). (C) Estimation of IL-1β cytokine production upon S. Typhimurium infection in Sirt1 and Sirt3 knockdown RAW 264.7 macrophages through ELISA at 20 hr post-infection. Data is representative of N = 2, n = 2. Unpaired two-tailed Student’s t-test was performed to obtain the p-values (***p<0.001, *p<0.05). Uninfected (UI) samples values were below the detection level (ND, not detectable). (D) Estimation of pro-inflammatory IL-6 cytokine production within uninfected or S. Typhimurium-infected peritoneal macrophages in the presence or absence of SIRT1 or SIRT3 inhibitor treatment at 6 hr post-infection. Data is representative of N = 2, n = 2. Unpaired two-tailed Student’s t-test was performed to obtain the p-values (**p<0.01, *p<0.05). (E) Estimation of pro-inflammatory IL-1β cytokine production within uninfected or S. Typhimurium-infected peritoneal macrophages in the presence or absence of SIRT1 or SIRT3 inhibitor treatment at 6 hr post-infection. Data is representative of N = 2, n = 2. Unpaired two-tailed Student’s t-test was performed to obtain the p-values (**p<0.01, *p<0.05). Uninfected (UI) sample values were below the detection level (ND, not detectable). (F) Serum IL-1β levels of S. Typhimurium-infected C57BL/6 WT mice (males) upon SIRT1 or SIRT3 inhibitor treatment on fifth day post-infection. Data is representative of N = 3, n > 3. Unpaired two-tailed Student’s t-test was performed to obtain the p-values (** p<0.01, *p<0.05). (G) Intestinal (ileal) IL-1β levels of S. Typhimurium-infected C57BL/6 WT mice (males) upon SIRT1 or SIRT3 inhibitor treatment on fifth day post-infection. Data is representative of N = 3, n > 3. Unpaired two-tailed Student’s t-test was performed to obtain the p-values (**p<0.01, * p<0.05).
Figure 3—figure supplement 2
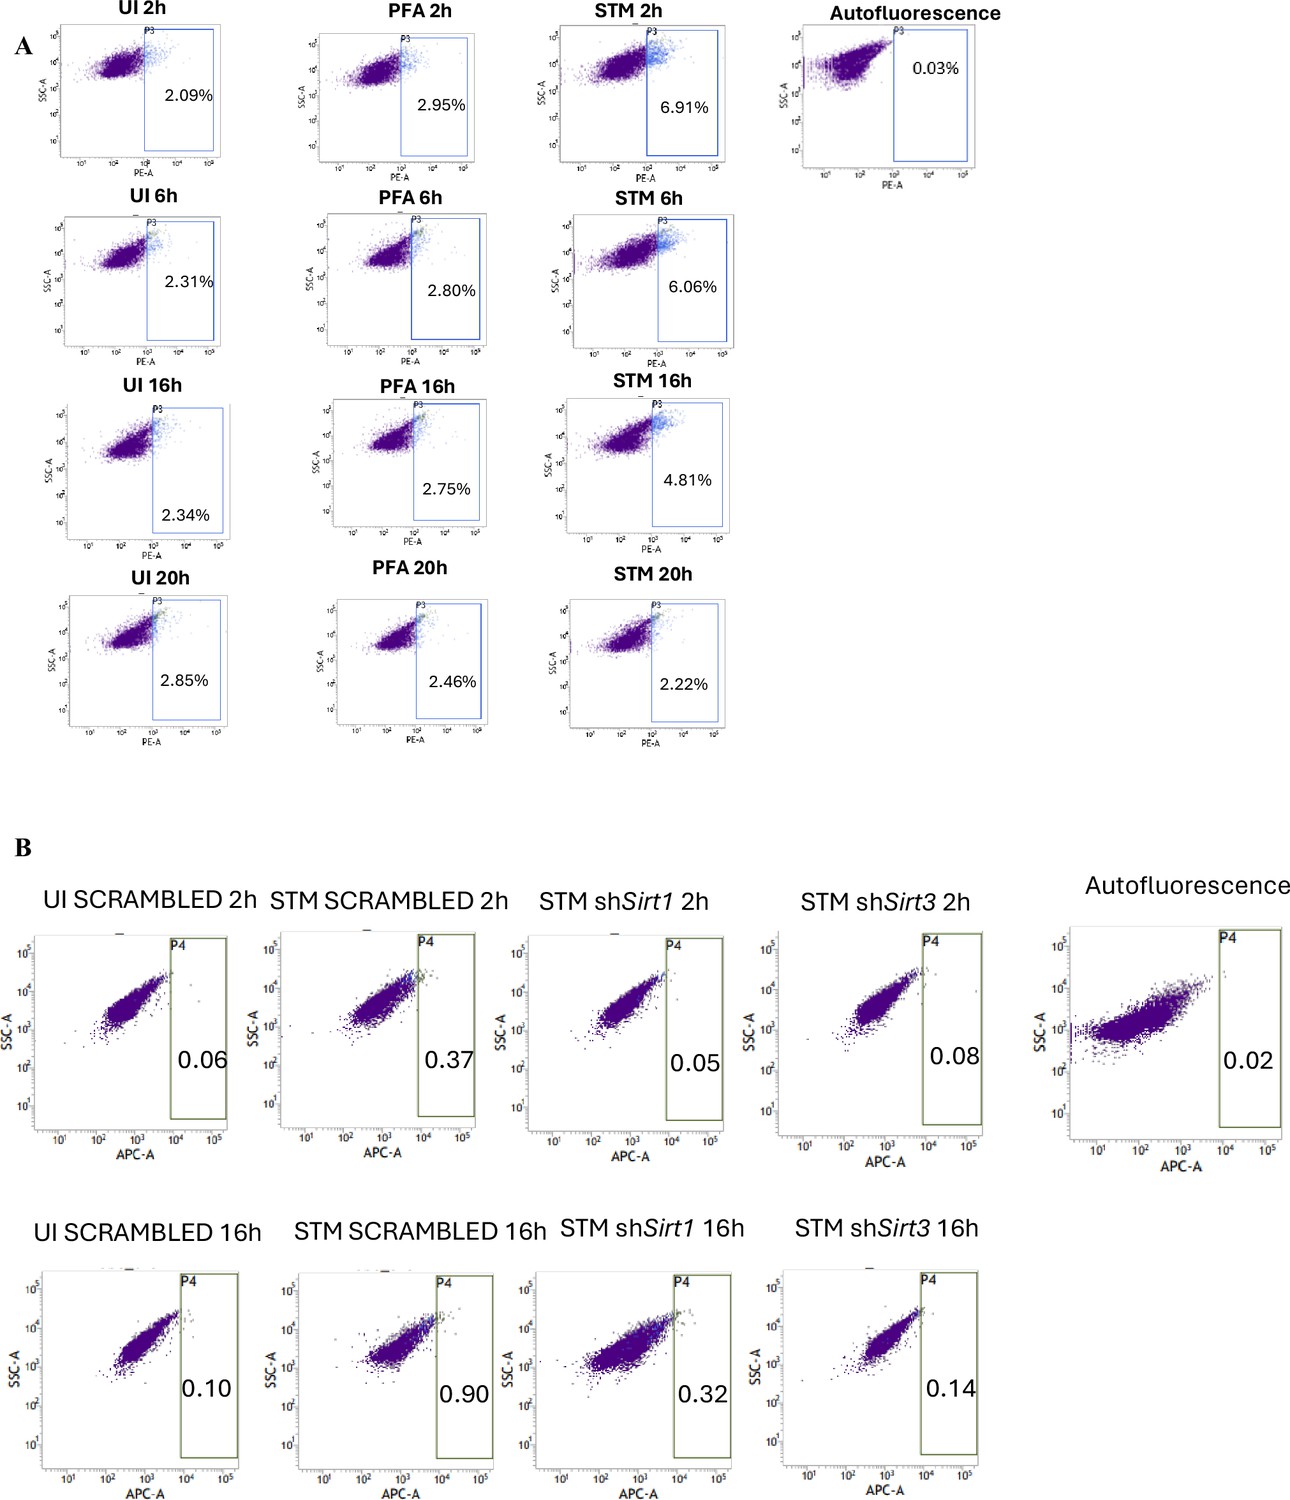
Salmonella Typhimurium (STM) skews the polarization state of the macrophage toward an immunosuppressive M2 state along the course of infection.
(A) Flow cytometric analysis of alteration in M1 CD86 (PE)-positive population in STM-infected samples in comparison to uninfected (UI) and paraformaldehyde fixed (PFA) bacteria at the indicated time post-infection. (B) Flow cytometric analysis of M2 surface marker CD206 (APC) in STM-infected Sirt1 or Sirt3 knockdown RAW 264.7 macrophages in comparison to the scrambled control at the indicated time post-infection.
Figure 3—figure supplement 3
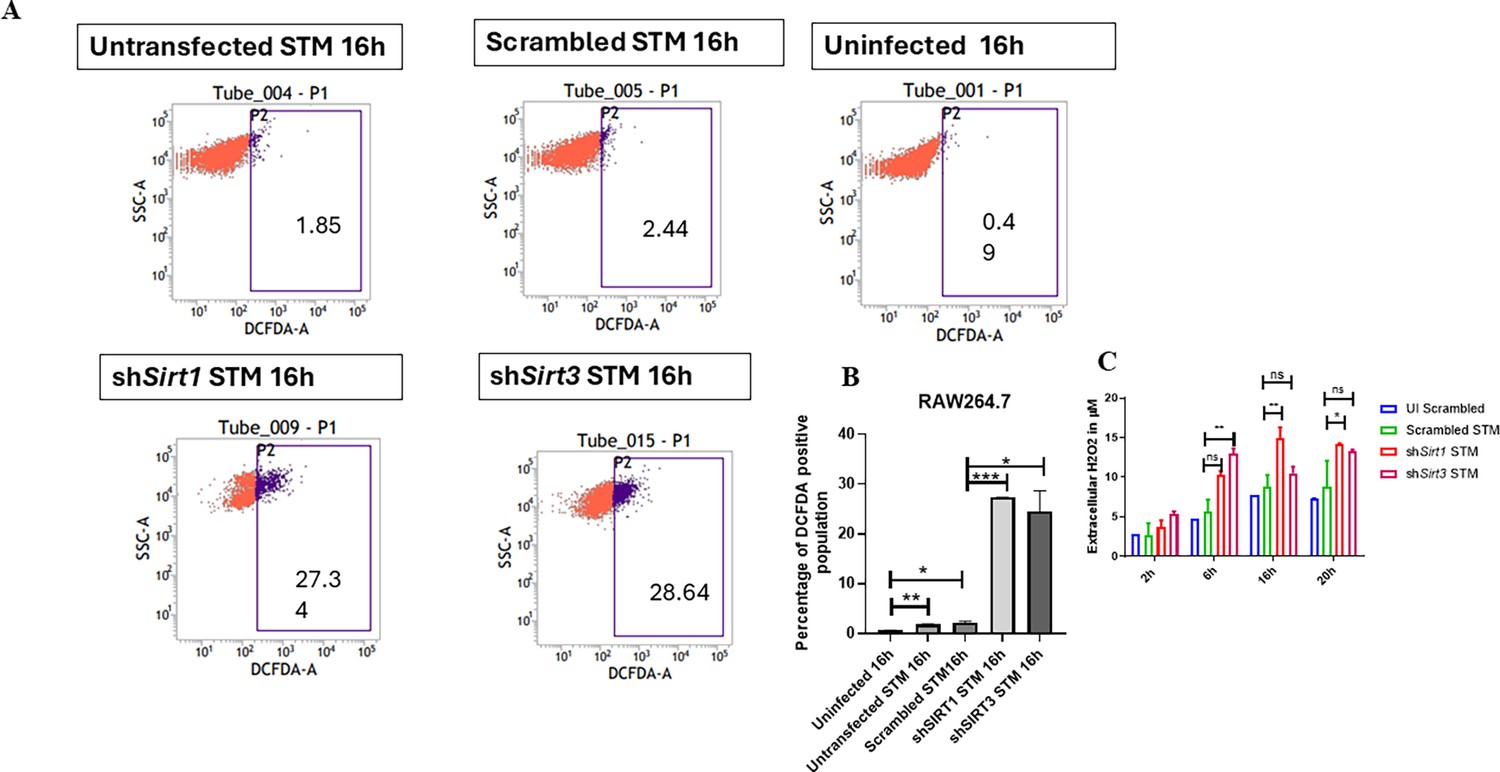
SIRT1 and SIRT3 play a role in maintaining ROS balance within Salmonella-infected macrophages.
(A) DCFDA fluorescence measured through flow cytometry in shSirt1, shSirt3, or scrambled shRNA transfected and untransfected RAW 264.7 macrophages at 16 hr post S. Typhimurium infection. Data is representative of N = 3, n = 2. (B) Quantitative analysis of percentage population of DCFDA-positive cells shown in (A). Unpaired two-tailed Student’s t-test was performed. Data is statistically nonsignificant (**p<0.01, *p<0.05). (C) Detection of extracellular H2O2 production through phenol red hydrogen peroxidase assay at 610 nm absorbance. Two-way ANOVA and Bonferroni post-t-test were used to obtain p-values (**p<0.01, *p<0.05, ns, not significant). Data is representative of N = 2, n = 2 (**p<0.01, *p<0.05).
Figure 3—figure supplement 4
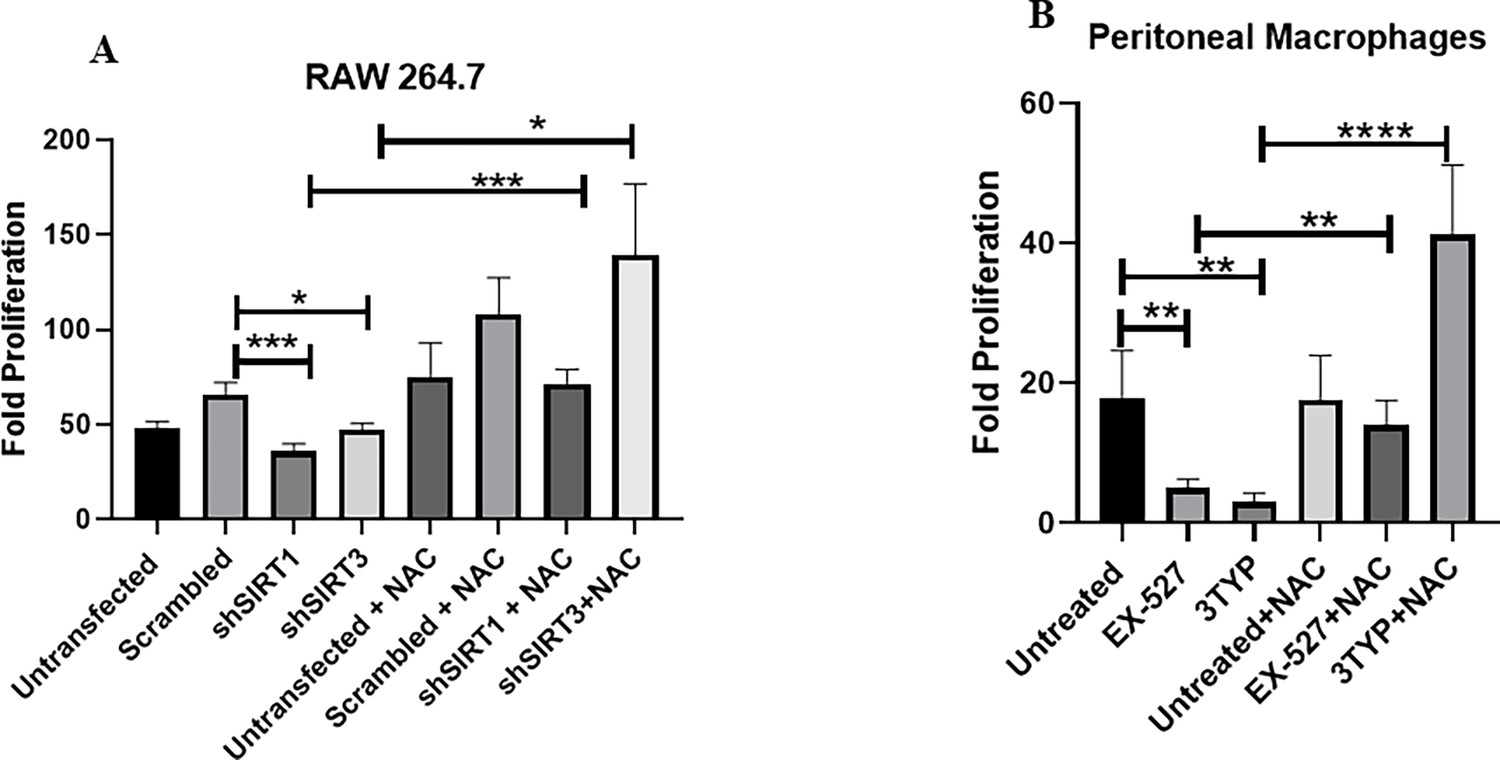
Effect of Sirt1 and Sirt3 knockdown or inhibition in intracellular bacterial proliferation within RAW 264.7 macrophages or peritoneal macrophages in the presence of ROS scavenger N-acetyl cysteine (NAC).
(A) Fold proliferation of S. Typhimurium within RAW 264.7 macrophages in transfected and untransfected conditions in the presence or absence of NAC (1 mM). Data are representative of N = 3, n = 3. Unpaired two-tailed Student’s t-test was performed to obtain the p-values (****p<0.0001, ***p<0.001, **p<0.01, *p<0.05). (B) Fold proliferation of S. Typhimurium within peritoneal macrophages isolated from 6- to 8-week-old adult male C57BL/6 mice upon SIRT1 (EX-527, 1 µM) or SIRT3 (3TYP, 1 µM) inhibitor treatment in the presence or absence of NAC (1 mM). Data are representative of N = 3, n = 3. Unpaired two-tailed Student’s t-test was performed to obtain the p-values (****p<0.0001, *** p<0.001, **p<0.01, *p<0.05).
Figure 4
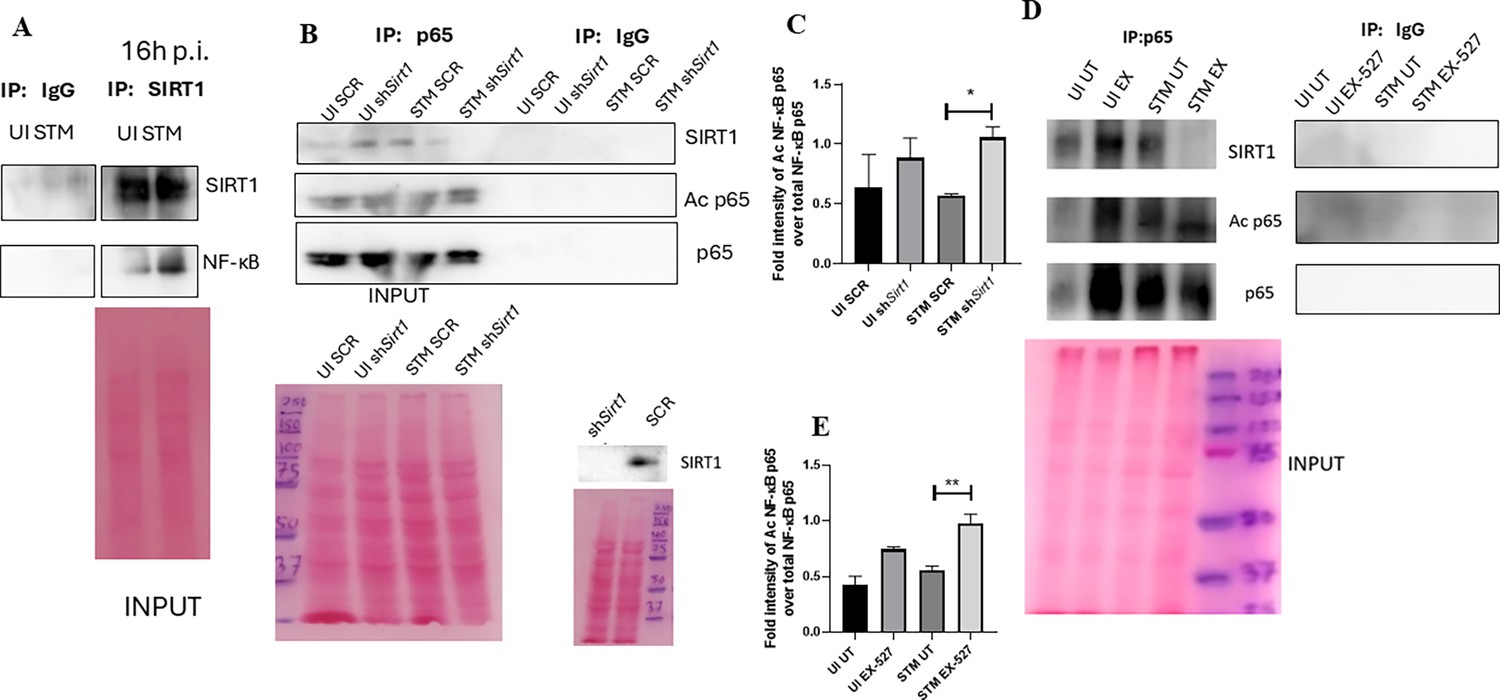
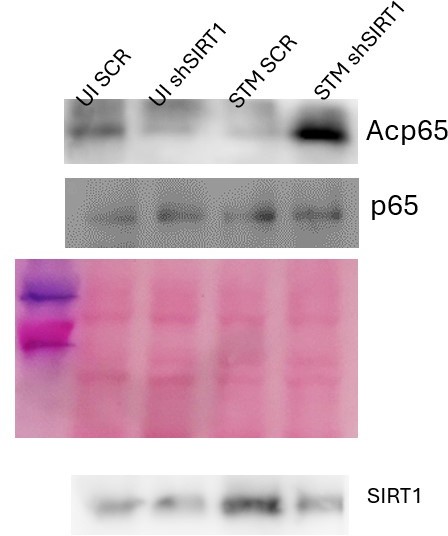
SIRT1 mediates modulation of immune functions via deacetylation of p65 subunit of NF-κB in S. Typhimurium (STM)-infected macrophages.
(A) Immunoblot depicting p65 NF-κB interaction with SIRT1 post immunoprecipitation of SIRT1 in uninfected (UI) or STM-infected RAW 264.7 macrophages at 16 hr post-infection. Data is representative of N = 3, n = 1. (B) An immunoblot depicting p65 NF-κB interaction with SIRT1 as well as the p65 NF-κB acetylation status post immunoprecipitation of p65 (IP: p65) or with control IgG (IP: IgG) in UI or STM-infected RAW 264.7 macrophages upon knockdown with Sirt1 shRNA or scrambled control. (C) Densitometric plot depicting the band intensities of acetylated p65 over total p65 in blot B. (D) An immunoblot depicting p65 NF-κB interaction with SIRT1 as well as the p65 NF-κB acetylation status post immunoprecipitation of p65 (IP: p65) or with control IgG (IP: IgG) in UI or STM-infected RAW 264.7 macrophages upon SIRT1 inhibitor (EX-527, 1 µM) treatment at 16 hr post-infection. UT, untreated. (E) Densitometric plot depicting the band intensities of acetylated p65 subunit of NF-κB over total p65 NF-κB in blot D.
-
Figure 4—source data 1
Original files for western blot analysis displayed in Figure 4A.
- https://cdn.elifesciences.org/articles/93125/elife-93125-fig4-data1-v1.zip
-
Figure 4—source data 2
Original files for western blot analysis displayed in Figure 4B.
- https://cdn.elifesciences.org/articles/93125/elife-93125-fig4-data2-v1.zip
-
Figure 4—source data 3
Original files for western blot analysis displayed in Figure 4D.
- https://cdn.elifesciences.org/articles/93125/elife-93125-fig4-data3-v1.zip
-
Figure 4—source data 4
File containing original uncropped western blots for Figure 4A, indicating relevant bands and treatments.
- https://cdn.elifesciences.org/articles/93125/elife-93125-fig4-data4-v1.zip
-
Figure 4—source data 5
File containing original uncropped western blots for Figure 4B, indicating relevant bands and treatments.
- https://cdn.elifesciences.org/articles/93125/elife-93125-fig4-data5-v1.zip
-
Figure 4—source data 6
File containing original uncropped western blots for Figure 4D, indicating relevant bands and treatments.
- https://cdn.elifesciences.org/articles/93125/elife-93125-fig4-data6-v1.zip
Figure 5 with 1 supplement
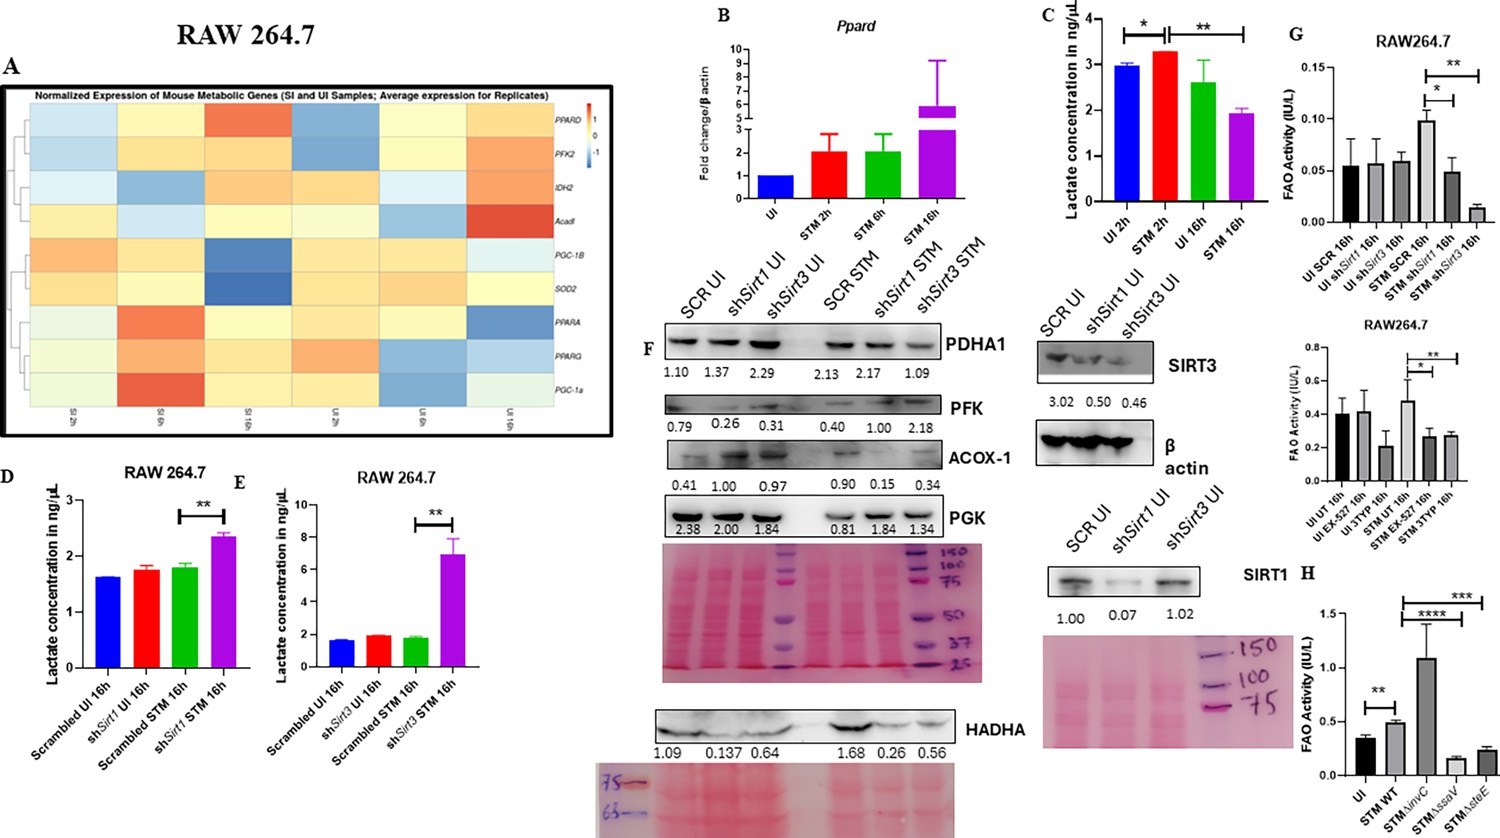
Salmonella Typhimurium drives the metabolism of the infected macrophage toward fatty acid oxidation.
(A) Metabolic gene expression data of S. Typhimurium-infected RAW 264.7 macrophages at 2 hr, 6 hr, and 16 hr time points of infection through nanoString. Data is representative of N = 2, n = 1. (B) Ppard qPCR expression data in S. Typhimurium-infected RAW 264.7 macrophages at the indicated time points of infection. Data is representative of N = 3, n = 2. (C) Lactate estimation assay of S. Typhimurium-infected RAW 264.7 macrophages at the initial time point of 2 hr and at the late time point of 16 hr post-infection. Data is representative of N = 3, n = 3. Unpaired two-tailed Student’s t-test was performed to obtain the p-values (**p<0.01, *p<0.05). (D, E) Lactate estimation assay of S. Typhimurium-infected RAW 264.7 macrophages upon Sirt1 (D) or Sirt3 (E) knockdown condition at 16 hr post-infection. Data is representative of N = 3, n = 3. Unpaired two-tailed Student’s t-test was performed to obtain the p-values. (F) Immunoblotting of host glycolytic (PGK), TCA cycle (PDHA1), and fatty acid oxidation (HADHA, ACOX-1) proteins under Sirt1 and Sirt3 knockdown condition of S. Typhimurium-infected RAW 264.7 macrophages at 16 hr post-infection. (G) Fatty acid oxidation (FAO) assay of uninfected (UI) and infected (STM) RAW 264.7 macrophages under Sirt1 or Sirt3 knockdown or inhibitor treatment. N = 2, n = 2 (** p<0.01, *p<0.05). (H) FAO assay of uninfected (UI) and infected RAW 264.7 macrophages under infection with wildtype S. Typhimurium (STM WT), SPI-1 (∆invC), or SPI-2 (∆ssaV and ∆steE) mutants of S. Typhimurium. Data is representative of N = 2,n = 2 (**p<0.01, * p<0.05).
-
Figure 5—source data 1
Original files for western blot analysis displayed in Figure 5F.
- https://cdn.elifesciences.org/articles/93125/elife-93125-fig5-data1-v1.zip
-
Figure 5—source data 2
File containing original uncropped western blots for Figure 5F, indicating relevant bands and treatments.
- https://cdn.elifesciences.org/articles/93125/elife-93125-fig5-data2-v1.zip
Figure 5—figure supplement 1
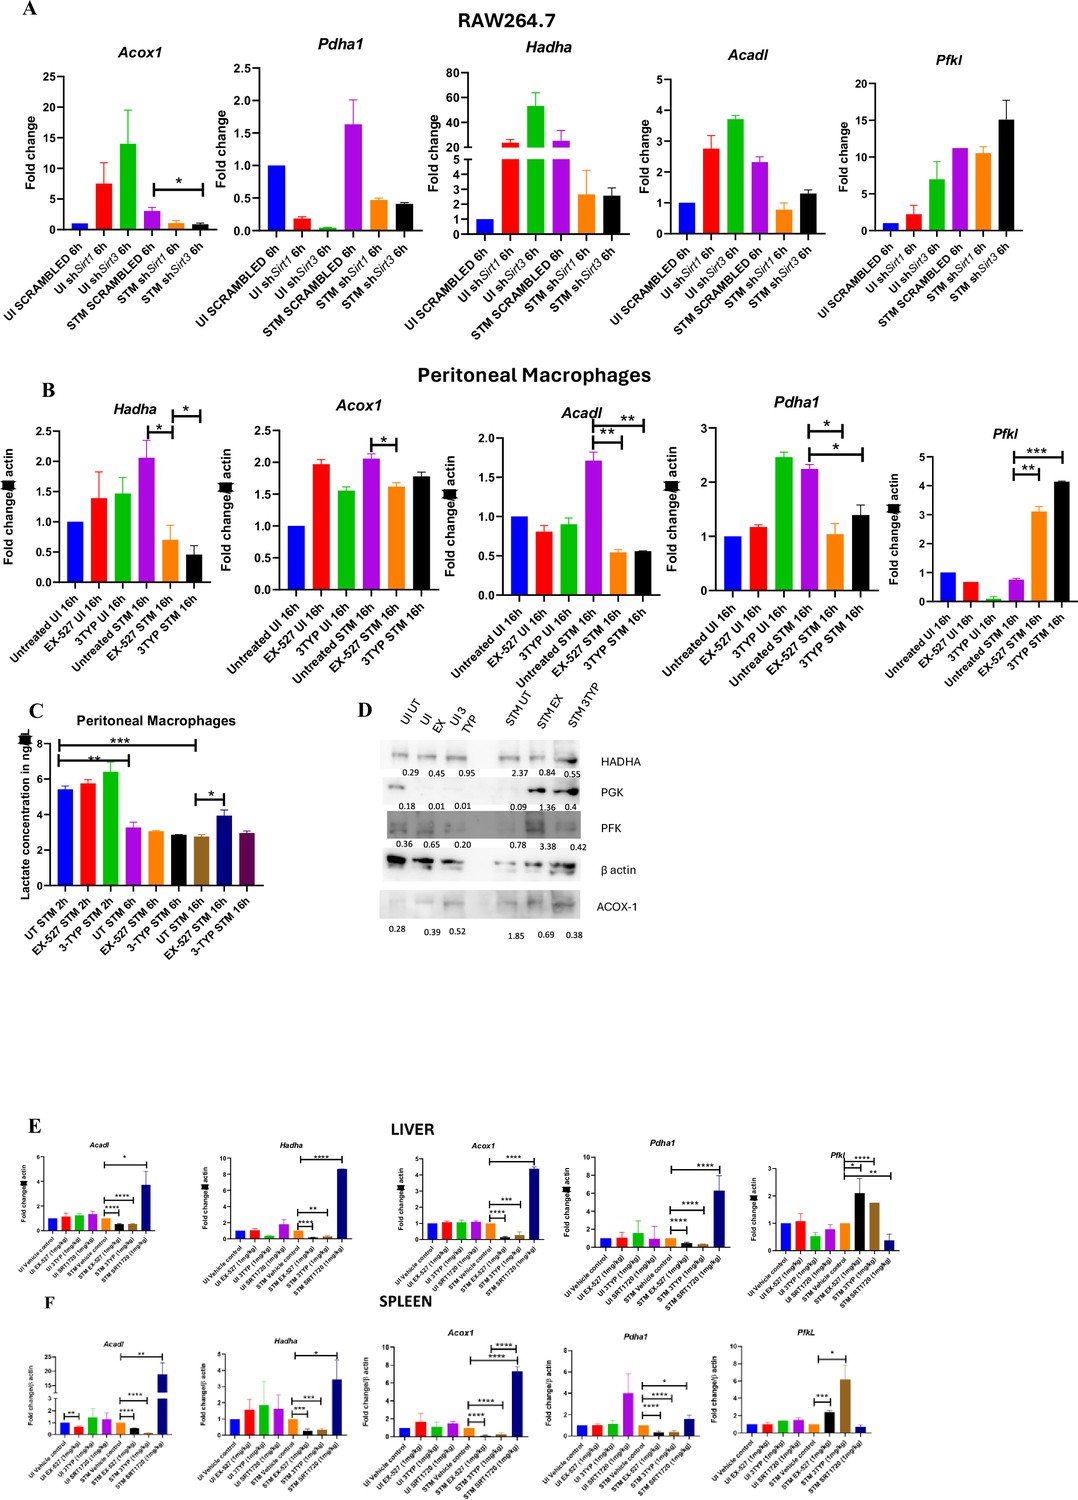
SIRT1 and SIRT3 knockdown or inhibitor treatment led to decrease in fatty acid oxidation and promoted host glycolysis in S. Typhimurium-infected peritoneal macrophages.
(A) qRT PCR-mediated gene expression analysis of several host metabolic genes in Sirt1 or Sirt3 knockdown RAW 264.7 macrophages at 6 hr post-infection. Data is representative of N = 3,n = 3. Unpaired two-tailed Student’s t-test was performed to obtain the p-values (*p<0.05). (B) qRT PCR-mediated gene expression analysis of several host metabolic genes in SIRT1 or SIRT3 inhibitor-treated (1 µM) peritoneal macrophages isolated from 6- to 8-week-old C57BL/6 male mice liver harvested on fifth day post-thioglycolate injection. Data is representative of N = 3,n = 3. Unpaired two-tailed Student’s t-test was performed to obtain the p-values (****p<0.0001, *** p<0.001, **p<0.01, *p<0.05). (C) Lactate estimation assay of S. Typhimurium-infected peritoneal macrophages upon SIRT1 or SIRT3 catalytic inhibition at 2 hr, 6 hr, and 16 hr post-infection. Data is representative of N = 3,n = 3. Unpaired two-tailed Student’s t-test was performed to obtain the p-values (****p<0.0001, ***p<0.001, **p<0.01, *p<0.05). (D) Immunoblotting of host glycolytic (PGK, PFK) and fatty acid oxidation (HADHA, ACOX-1) proteins under SIRT1 (EX-527) and SIRT3 (3TYP) catalytic inhibitor-treated condition in S. Typhimurium-infected peritoneal macrophages (isolated from thioglycolate-treated adult male C57BL/6 mice) at 16 hr post-infection. Data is representative of N = 2, n = 1. (E) qRT PCR- mediated gene expression profiling of several host metabolic genes in SIRT1 or SIRT3 inhibitor-treated 6- to 8-week-old C57BL/6 male mice liver harvested on fifth day post-infection of S. Typhimurium (107 CFU units/animal). Unpaired two-tailed Student’s t-test was performed to obtain the p-values. Data is representative of N = 3, n = 3 (****p<0.0001, ***p<0.001, ** p<0.01, *p<0.05). (F) qRT PCR-mediated gene expression profiling of several host metabolic genes in SIRT1 or SIRT3 inhibitor-treated 6- to 8-week-old C57BL/6 male mice spleen harvested on fifth day post-infection of S. Typhimurium (107 CFU units/animal). Unpaired two-tailed Student’s t-test was performed to obtain the p-values. Data is representative of N = 3, n = 3 (****p<0.0001, ***p<0.001, **p<0.01, *p<0.05).
-
Figure 5—figure supplement 1—source data 1
Original files for western blot analysis displayed in Figure 5—figure supplement 1D.
- https://cdn.elifesciences.org/articles/93125/elife-93125-fig5-figsupp1-data1-v1.zip
-
Figure 5—figure supplement 1—source data 2
File containing original uncropped western blots for Figure 5—figure supplement 1D, indicating relevant bands and treatments.
- https://cdn.elifesciences.org/articles/93125/elife-93125-fig5-figsupp1-data2-v1.zip
Figure 6
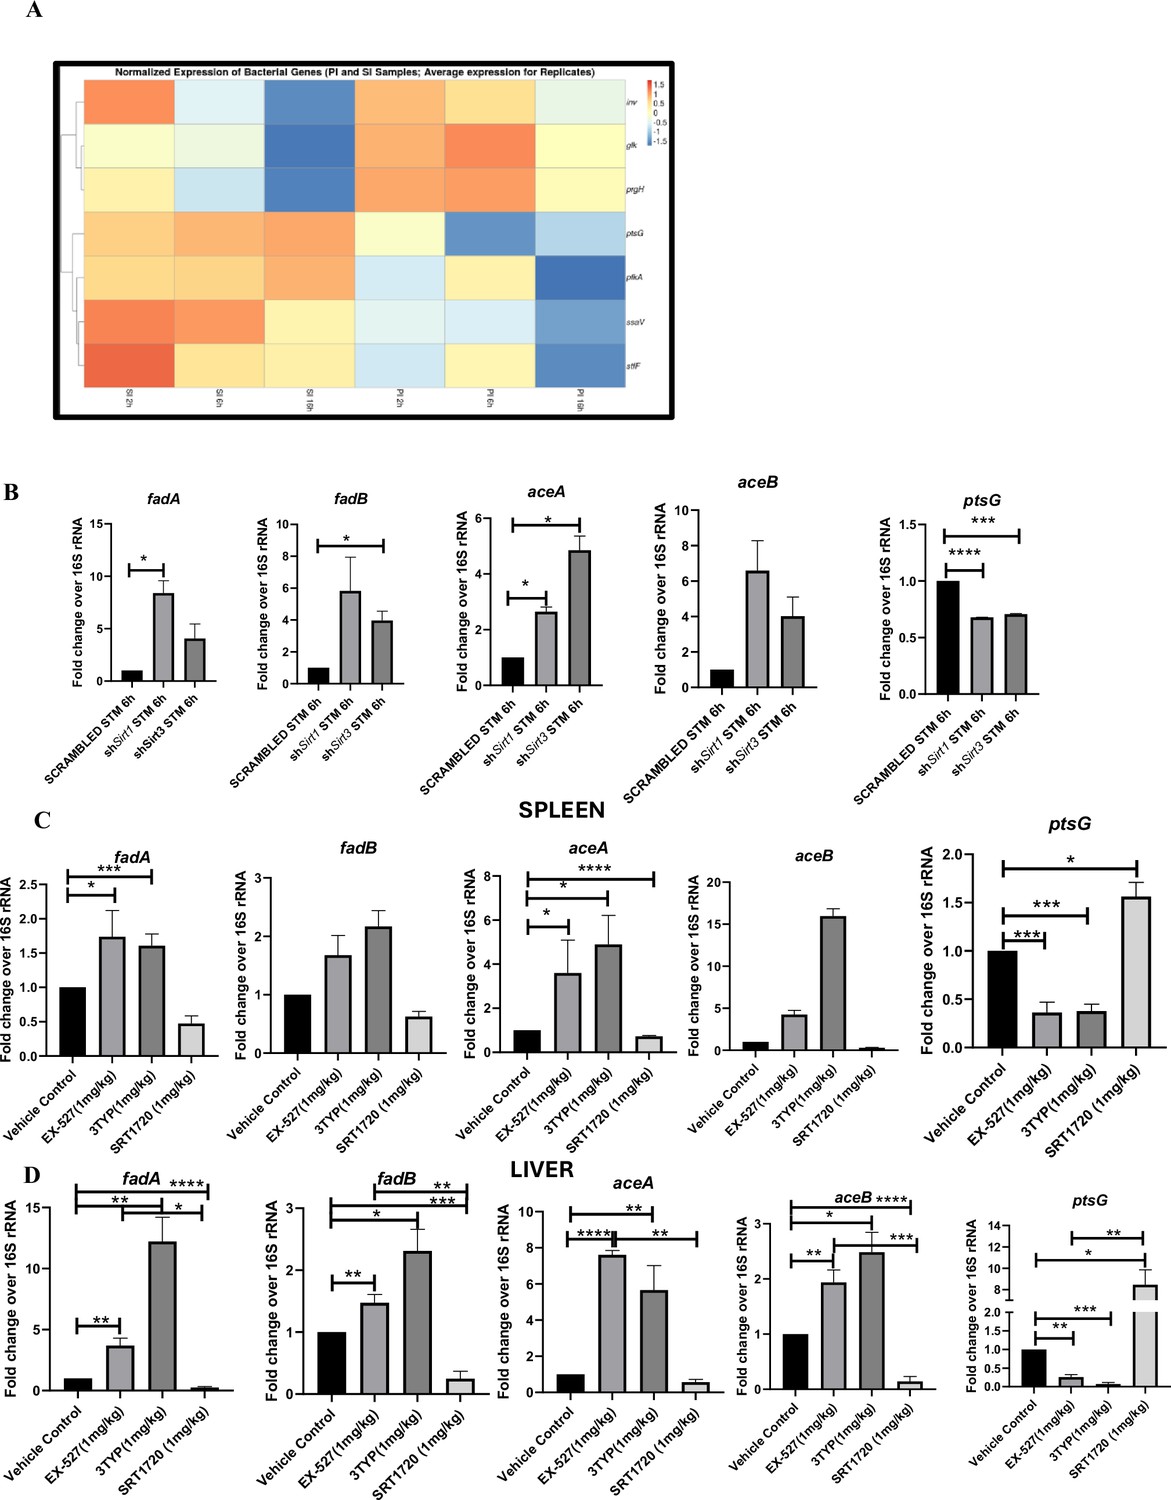
Salmonella Typhimurium infection proceeds with increased glycolysis and glucose uptake inside the infected RAW 264.7 macrophages.
(A) Salmonella gene expression profiling data of S. Typhimurium-infected RAW 264.7 macrophages at 2 hr, 6 hr, and 16 hr time points of infection through nanoString. SI, S. Typhimurium-infected; PI, PFA fixed S. Typhimurium-infected. SPI-1 genes, inv, prgH; SPI-2 genes, ssaV,stfF; glk, glucokinase; pfkA, phosphofrucktose kinase A; ptsG, phosphophenolpyruvate-dependent sugar phosphotransferase system (PTS). Data is representative of N = 2, n = 2. (B) qRT PCR gene expression profiling of Salmonella metabolic genes within infected RAW 264.7 macrophages in knockdown condition of either Sirt1 or Sirt3 at 6 hr post-infection. Data is representative of N = 3, n = 3. (C, D). qRT PCR gene expression profiling of Salmonella metabolic genes within infected female C57BL/6 mice spleen (C) and liver (D) under SIRT1 or SIRT3 inhibitor treatment harvested on fifth day post-infection of S. Typhimurium (107 CFU units/animal). Unpaired two-tailed Student’s t-test was performed to obtain the p-values. Data is representative of N = 3, n = 3 (****p<0.0001, ***p<0.001, **p<0.01, *p<0.05).
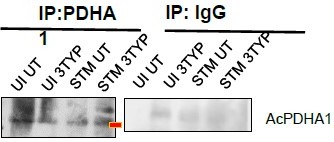
Figure 7
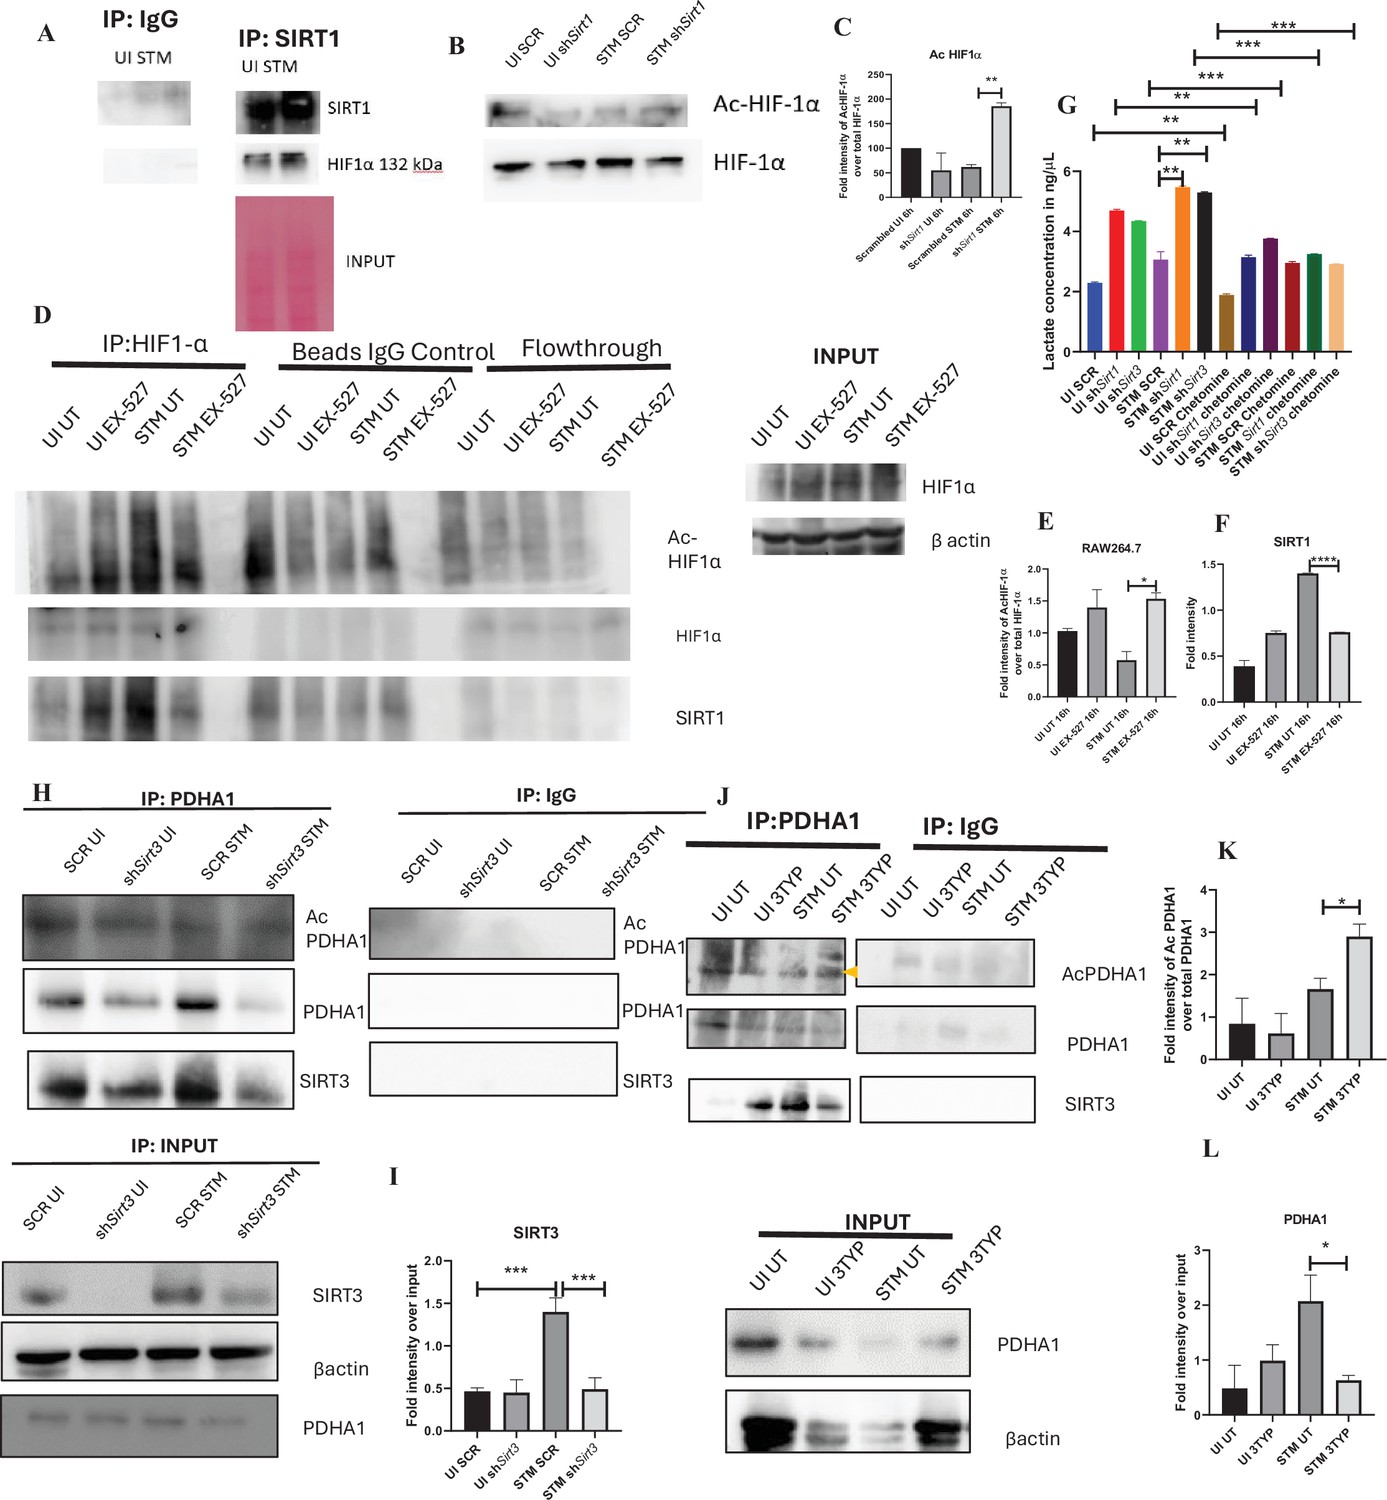
SIRT1 inhibition triggers hyperacetylation of glycolytic master regulator HIF-1α within S. Typhimurium (STM)-infected macrophages while SIRT3 skews metabolism of S. Typhimurium-infected macrophages via interaction with PDHA1.
(A) An immunoblot depicting HIF-1α interaction with SIRT1 post immunoprecipitation of SIRT1 in uninfected (UI) or STM-infected RAW 264.7 macrophages at 16 hr post-infection (derived from the same SIRT1 IP blot as in Figure 4A). (B) Immunoblotting of HIF-1ɑ in SIRT1 knockdown UI or STM-infected RAW 264.7 cells at 16 hr post-infection to assess the acetylation status of HIF-1α. (C) Densitometric plot depicting the band intensities of acetylated HIF-1α over total HIF-1α in blot B. Data is representative of N = 3. (D) An immunoblot depicting HIF-1α interaction with SIRT1 as well as the HIF-1α acetylation status post immunoprecipitation of HIF-1α [IP:HIF-1α or with control IgG (IP:IgG)] in UI or STM-infected RAW 264.7 macrophages upon SIRT1 inhibitor (EX-527, 1 µM) treatment at 16 hr post-infection. UT, untreated. (E) Densitometric plot depicting the band intensities of acetylated HIF-1α over total HIF-1α in blot D. Data is representative of N = 3. (F) Densitometric plot depicting the band intensities of SIRT1 in blot D. (G) Lactate estimation assay of STM-infected RAW 264.7 macrophages upon Sirt1 and Sirt3 knockdown condition in the presence of HIF-1α inhibitor, chetomine (50 nM) at 16 hr post-infection. Data is representative of N = 3, n = 3. Unpaired two-tailed Student’s t-test was performed to obtain the p-values (****p<0.0001, ***p<0.001, **p<0.01, *p<0.05). (H) An immunoblot depicting PDHA1 interaction with SIRT1 or SIRT3 post immunoprecipitation of PDHA1 in UI or STM-infected RAW 264.7 macrophages in SIRT3 knockdown condition at 16 hr post-infection. (I) Densitometric plot depicting the band intensities of SIRT3 interaction over total input in blot. Data is representative of N = 3. (J) An immunoblot depicting PDHA1 interaction with SIRT3 post immunoprecipitation of PDHA1 in UI or STM-infected RAW 264.7 macrophages at 16 hr post-infection under SIRT3 inhibitor (3-TYP, 1 µM) treatment at 16 hr post-infection. UT, untreated. (K) Densitometric plot depicting the band intensities of acetylated PDHA1 over total PDHA1 in blot I. Data is representative of N = 3. (L) Densitometric plot depicting the band intensities of SIRT3 interaction over total input in blot I. Data is representative of N = 3.
-
Figure 7—source data 1
Original files for western blot analysis displayed in Figure 7A.
- https://cdn.elifesciences.org/articles/93125/elife-93125-fig7-data1-v1.zip
-
Figure 7—source data 2
Original files for western blot analysis displayed in Figure 7B.
- https://cdn.elifesciences.org/articles/93125/elife-93125-fig7-data2-v1.zip
-
Figure 7—source data 3
Original files for western blot analysis displayed in Figure 7D.
- https://cdn.elifesciences.org/articles/93125/elife-93125-fig7-data3-v1.zip
-
Figure 7—source data 4
Original files for western blot analysis displayed in Figure 7H.
- https://cdn.elifesciences.org/articles/93125/elife-93125-fig7-data4-v1.zip
-
Figure 7—source data 5
Original files for western blot analysis displayed in Figure 7J.
- https://cdn.elifesciences.org/articles/93125/elife-93125-fig7-data5-v1.zip
-
Figure 7—source data 6
File containing original uncropped western blots for Figure 7A, indicating relevant bands and treatments.
- https://cdn.elifesciences.org/articles/93125/elife-93125-fig7-data6-v1.zip
-
Figure 7—source data 7
File containing original uncropped western blots for Figure 7B, indicating relevant bands and treatments.
- https://cdn.elifesciences.org/articles/93125/elife-93125-fig7-data7-v1.zip
-
Figure 7—source data 8
File containing original uncropped western blots for Figure 7D, indicating relevant bands and treatments.
- https://cdn.elifesciences.org/articles/93125/elife-93125-fig7-data8-v1.zip
-
Figure 7—source data 9
File containing original uncropped western blots for Figure 7H, indicating relevant bands and treatments.
- https://cdn.elifesciences.org/articles/93125/elife-93125-fig7-data9-v1.zip
-
Figure 7—source data 10
File containing original uncropped western blots for Figure 7J, indicating relevant bands and treatments.
- https://cdn.elifesciences.org/articles/93125/elife-93125-fig7-data10-v1.zip
Figure 8 with 1 supplement
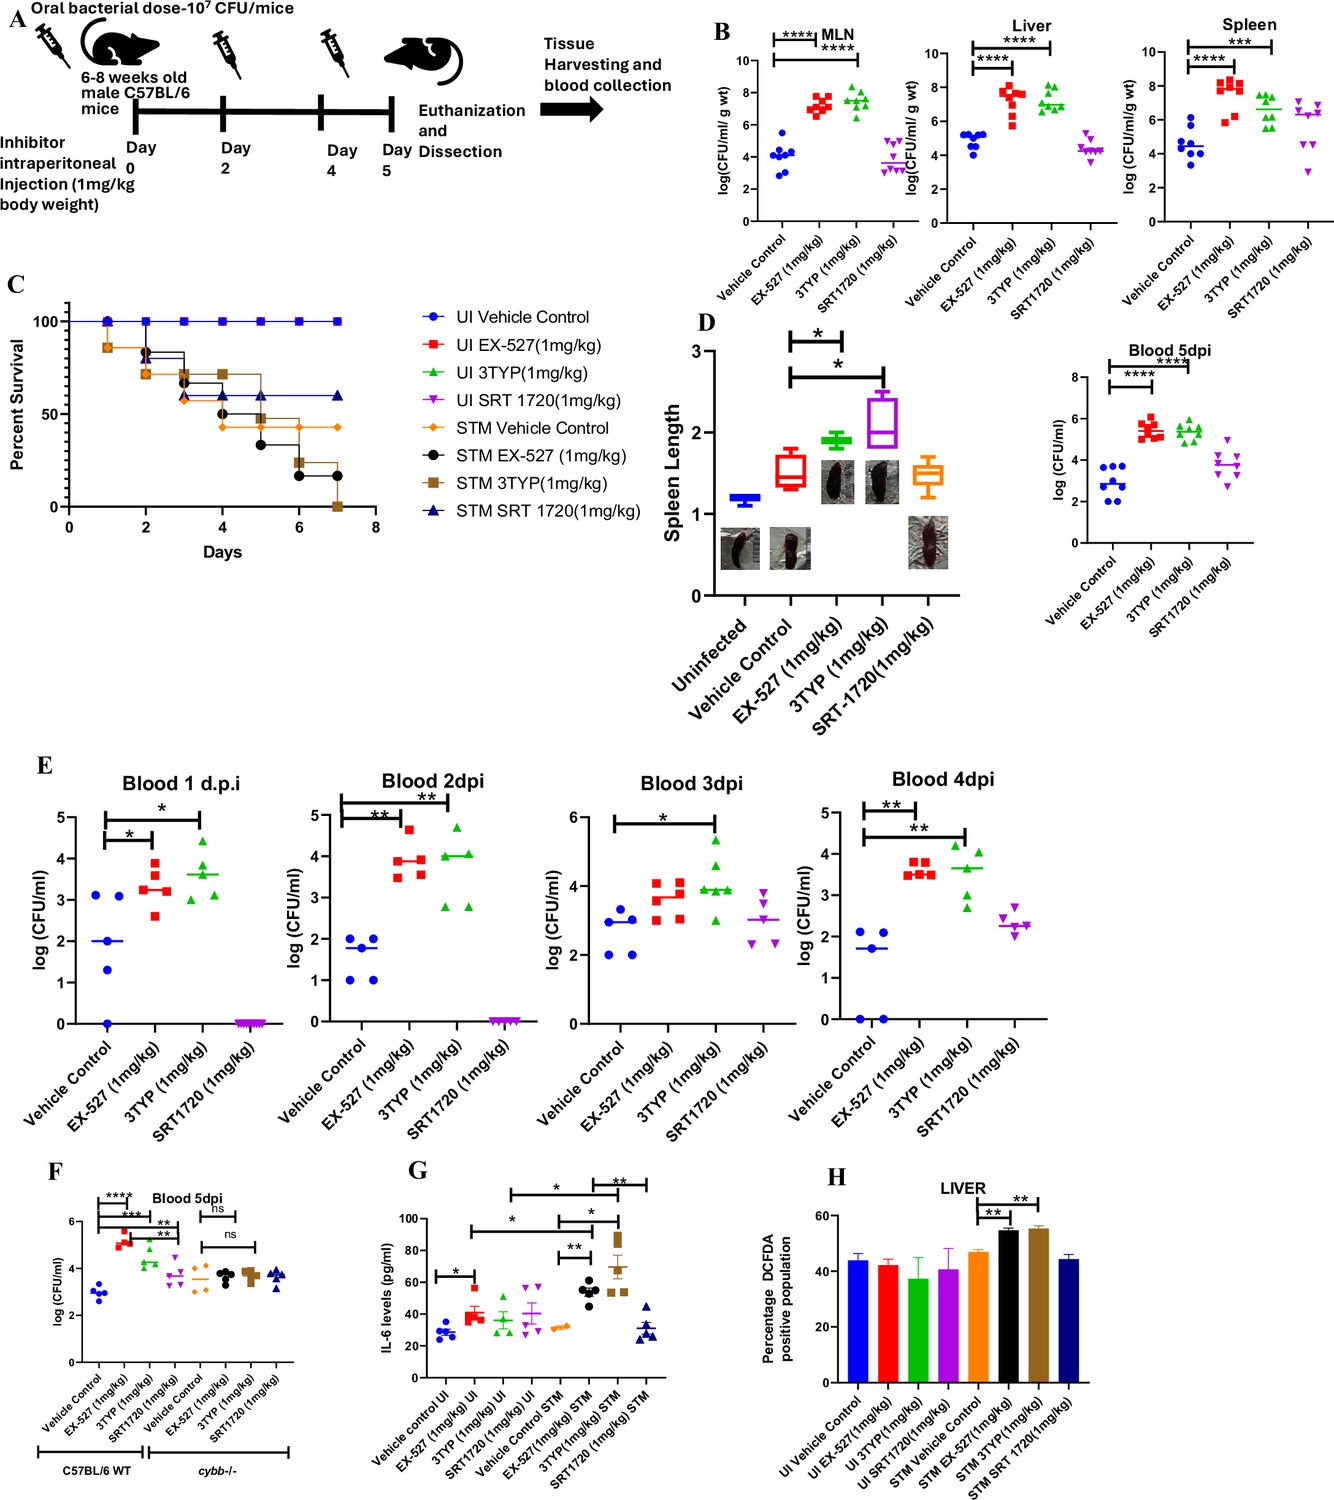
Effect of SIRT1 or SIRT3 inhibition on S. Typhimurium (STM)-infected C57BL/6 mice.
(A) The schematic representation of the experimental strategy for studying the effect of SIRT1 and SIRT3 on the in vivo pathogenesis of STM (WT). (B) In vivo organ burden of STM upon SIRT1 or SIRT3 inhibition in C57BL/6 mice on fifth day post- infection under specified dosage of inhibitor treatment. Data is representative of N = 4, n = 8. Mann Whitney test was performed to obtain the p- values (****p<0.0001, ***p<0.001, **p<0.01, *p<0.05). (C) Percent survival of STM- infected C57BL/6 mice upon SIRT1 or SIRT3 inhibitor treatment at a specific dose of inhibitor treatment. Data is representative of N = 4, n = 5. (D) Representation of splenic length of STM- infected spleen tissue harvested from C57BL/6 mice (males) on fifth day post- infection upon SIRT1 or SIRT3 inhibition at 1 mg/kg dosage. Data is representative of N = 4, n = 8 (**p<0.01, *p<0.05). (E) Bacterial load in blood at different days post- infection upon SIRT1 or SIRT3 inhibition at 1 mg/kg dosage in C57BL/6 mice (males). Data is representative of N = 3, n > 5 (**p<0.01, *p<0.05) Mann–Whitney test was performed to obtain the p- values (**p<0.01, *p<0.05). (F) Bacterial load in blood on fifth day post- infection upon SIRT1 or SIRT3 inhibition at 1 mg/kg dosage in C57BL/6 WT mice (males) and cybb-/- (males) mice. Data is representative of N = 3, n > 5. Mann–Whitney test was performed to obtain the p- values (**p<0.01, *p<0.05). (G) Serum IL- 6 levels of STM- infected C57BL/6 WT mice (males) mice treated with SIRT1(EX- 527) or SIRT3 (3TYP) inhibitors or SRT1720 (SIRT1 activator) at 1 mg/kg dosage on fifth day post- infection. Data is representative of N = 3, n > 5. Unpaired two- tailed Student’s t- test was performed to obtain the p- values (**p<0.01, *p<0.05). (H) Quantitative analysis of percentage population of cells within liver showing DCFDA- positive staining shown in Figure 8—figure supplement 1A. Data is representative of N = 3, n > 5. Unpaired two- tailed Student’s t- test was performed to obtain the p- values (** p<0.01).
Figure 8—figure supplement 1
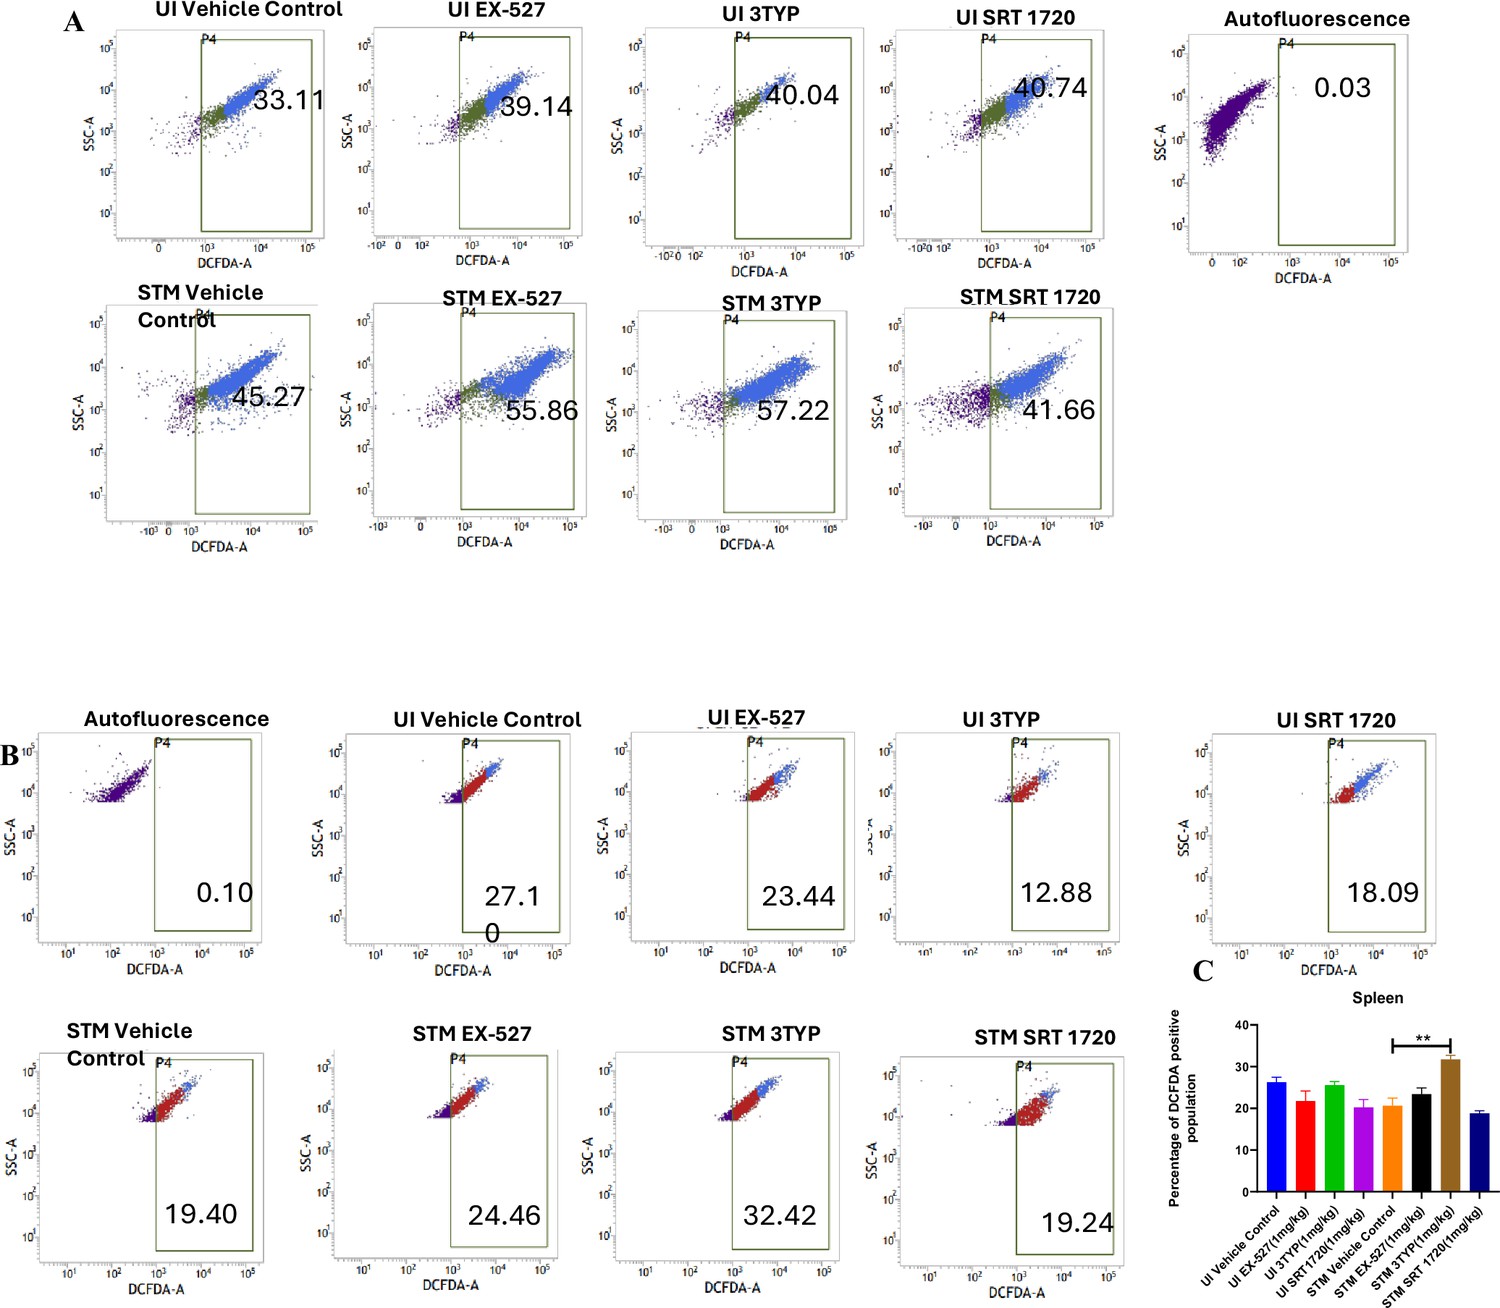
SIRT1 and SIRT3 inhibition led to enhanced ROS production within Salmonella-infected mice liver and spleen tissues.
(A) DCFDA fluorescence measured through flow cytometry in liver tissues homogenate harvested from adult male 6- to 8-week-old C57BL/6 mice (subjected to different chemical treatment – vehicle treated or SIRT1 [EX-527] or SIRT3 [3-TYP] inhibitor or SIRT1 activator SRT1720 treated at dose of 1 mg/kg) on fifth day post S. Typhimurium infection (108 CFU orally). Data is representative of N = 3, n = 2. (B) DCFDA fluorescence measured through flow cytometry in splenic tissues homogenate harvested from adult male 6- to 8-week-old C57BL/6 mice (subjected to different chemical treatment – vehicle treated or SIRT1 [EX-527] or SIRT3 [3-TYP] inhibitor or SIRT1 activator SRT1720 treated at dose of 1 mg/kg) on fifth day post S. Typhimurium infection. Data is representative of N = 3, n = 2. (C) Quantitative analysis of percentage population of splenocytes showing DCFDA-positive staining shown in splenic tissues homogenate harvested from adult male 6- to 8-week-old C57BL/6 mice as shown in (B). Unpaired two-tailed Student’s t-test was performed to obtain the p-values (**p<0.01).
Figure 9 with 3 supplements
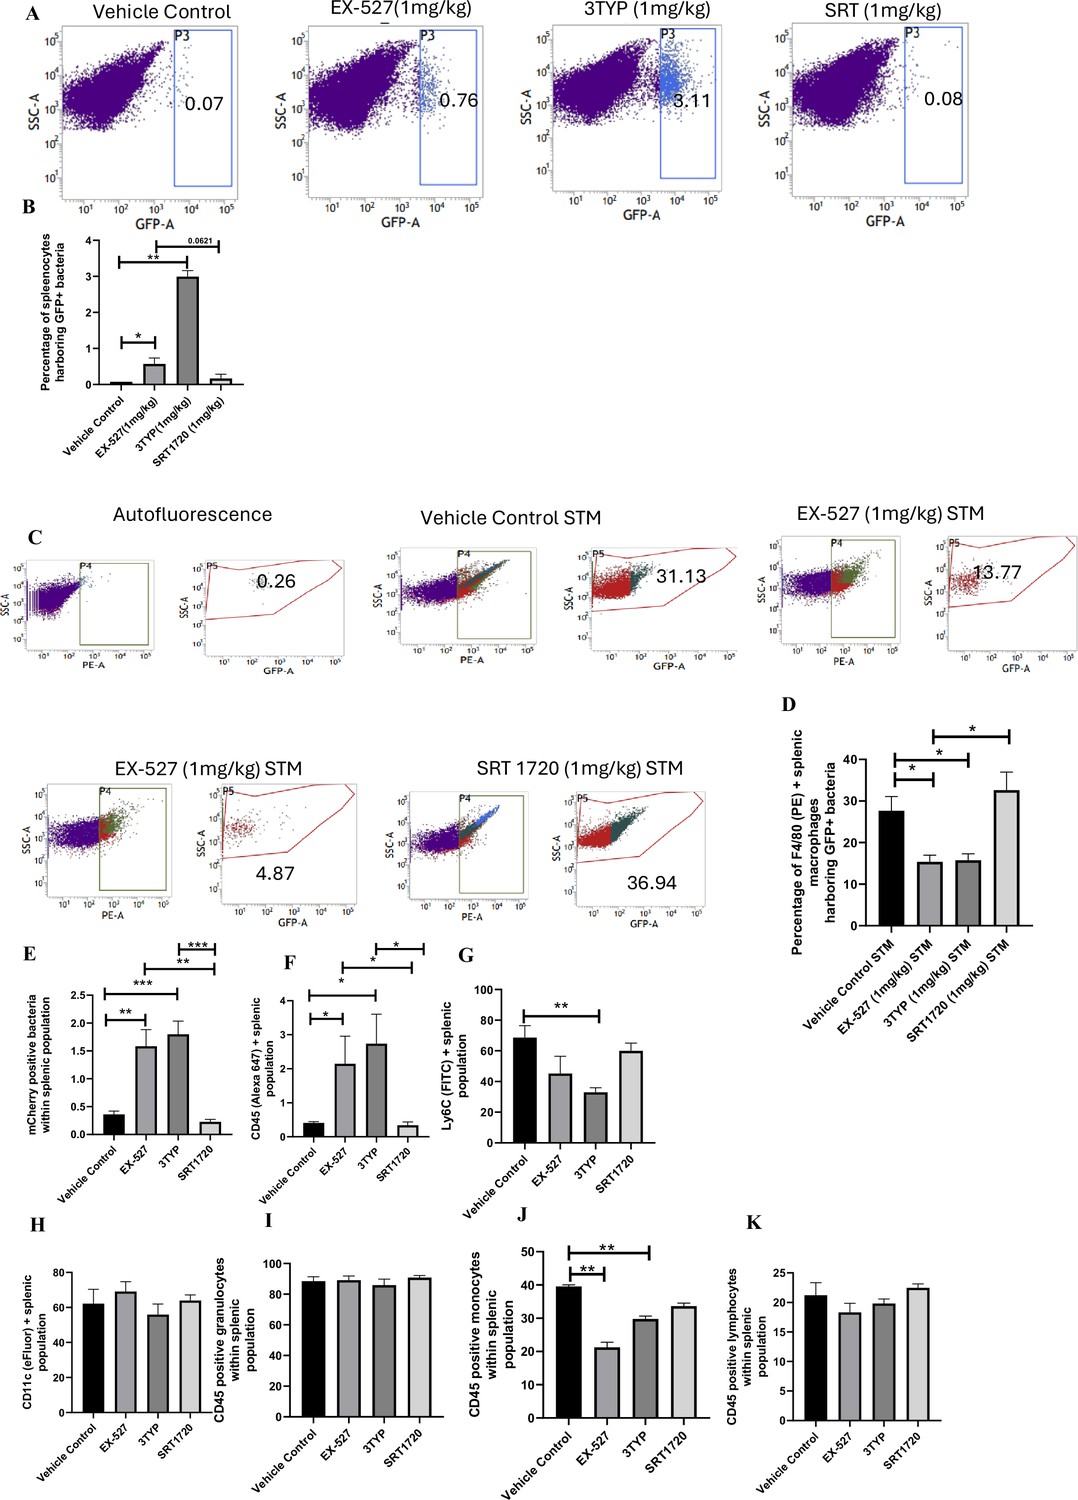
Effect of SIRT1 and SIRT3 inhibition on bacterial loads in diverse populations of S. Typhimurium-infected splenocytes.
(A) Enumeration of GFP-positive bacterial cells through flow cytometry in splenic tissues homogenate harvested from adult male 6- to 8-week-old C57BL/6 mice (subjected to different chemical treatment – vehicle treated or SIRT1 [EX-527] or SIRT3 [3-TYP] inhibitor or SIRT1 activator SRT1720 treated at a dose of 1 mg/kg) on fifth day post STM (expressing GFP) infection (107 CFU orally). Data is representative of N = 3, n > 5. Unpaired two-tailed Student’s t-test was performed to obtain the p-values (**p<0.01). (B) Quantitative analysis of the percentage population of splenic cells harbouring GFP+ bacterial cells shown in (A). Unpaired two-tailed Student’s t-test was performed (**p<0.01, *p<0.05). (C) Enumeration of GFP-positive bacterial cells through flow cytometry within F4/80-positive splenic macrophages present within splenic tissues homogenate harvested from adult male 6- to 8-week-old C57BL/6 mice (subjected to different chemical treatment – vehicle treated or SIRT1 [EX-527] or SIRT3 [3-TYP] inhibitor or SIRT1 activator SRT1720 treated at a dose of 1 mg/kg) on fifth day post STM infection. Data is representative of N = 3, n > 5. (D) Quantitative analysis of percentage population of F4/80-positive macrophage cells harbouring GFP+ bacteria shown in (C). Unpaired two-tailed Student’s t-test was performed to obtain the p-values. Data is representative of N= 3, n > 5 (*p<0.05). (E-K) Quantitative analysis of different mCherry-S. Typhimurium-infected splenic populations harbouring mCherry+ bacteria via flow cytometry depicted in Figure 9—figure supplement 1.
Figure 9—figure supplement 1
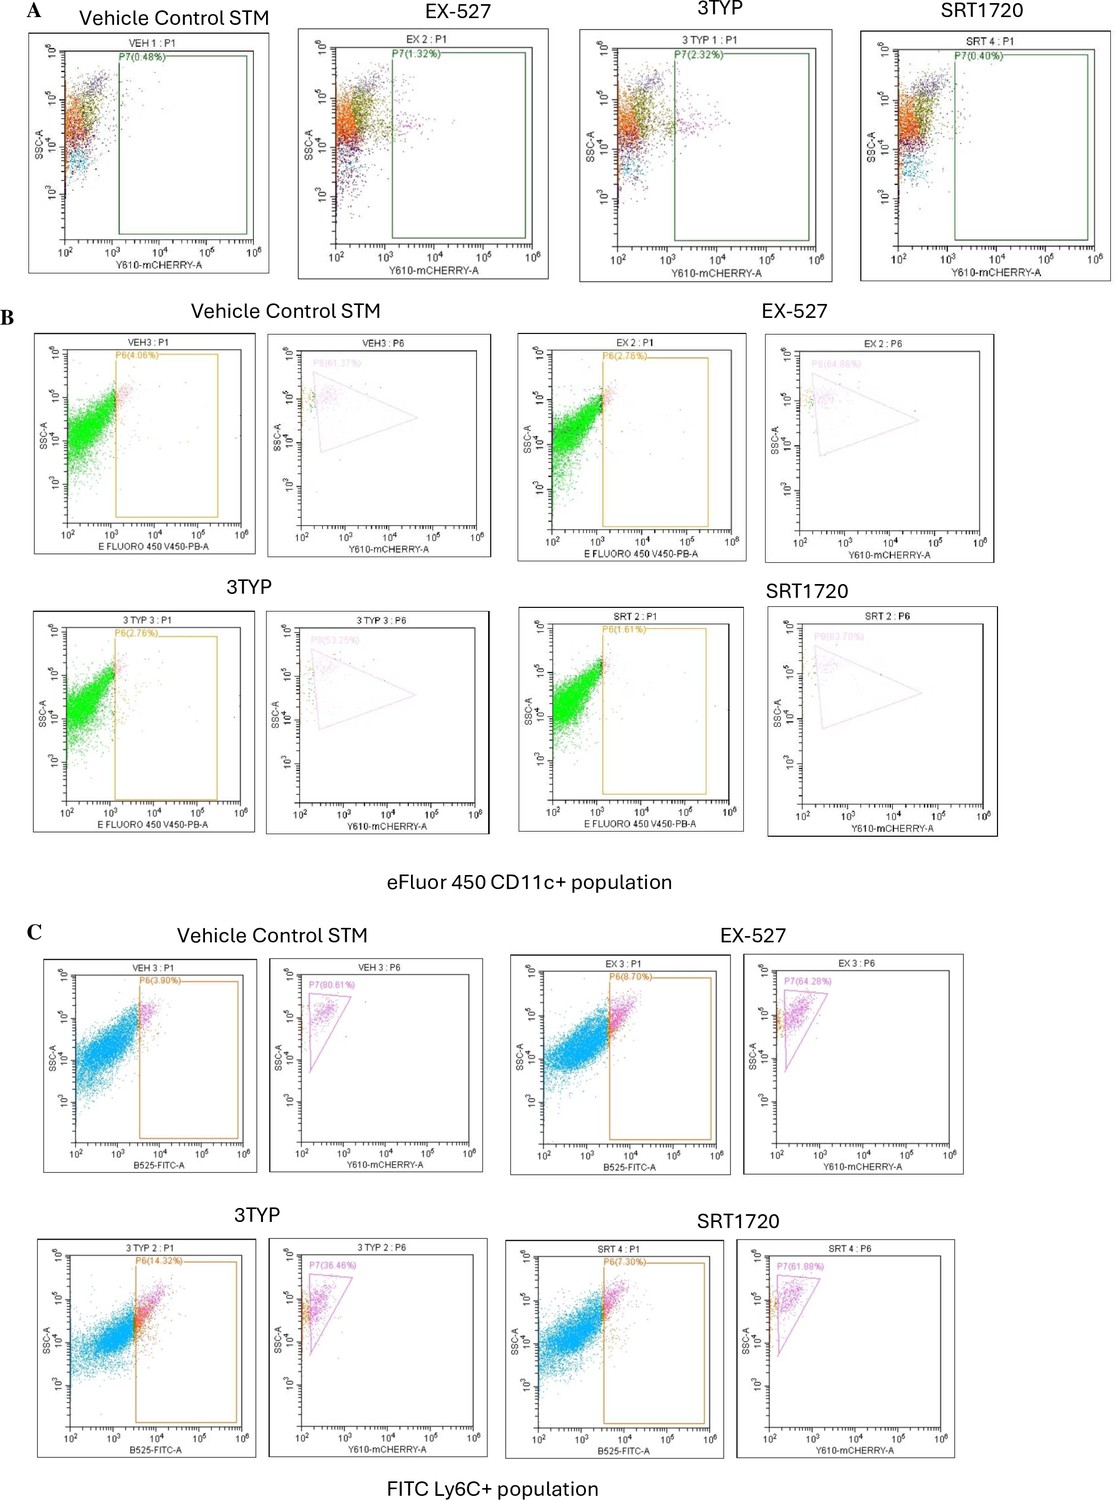
Flow cytometric analysis of different splenic populations within mCherry-labelled S. Typhimurium-infected mice cohorts upon SIRT1 or SIRT3 inhibitor treatment.
(A) Enumeration of mCherry-positive bacterial cells through flow cytometry in splenic tissues homogenate harvested from adult male 6- to 8-week-old C57BL/6 mice (subjected to different chemical treatment – vehicle treated or SIRT1 [EX-527] or SIRT3 [3-TYP] inhibitor or SIRT1 activator SRT1720 treated at a dose of 1 mg/kg) on fifth day post-S. Typhimurium infection (107 CFU orally). (B) Flow cytometric analysis of eFluor450-conjugated CD11c+ population within single-cell splenic suspension isolated from adult male 6- to 8-week-old C57BL/6 mice (subjected to different chemical treatment – vehicle treated or SIRT1 [EX-527] or SIRT3 [3-TYP] inhibitor or SIRT1 activator SRT1720 treated at a dose of 1 mg/kg) on fifth day post-mCherry-labelled S. Typhimurium infection (107 CFU orally). (C) Flow cytometric analysis of FITC-conjugated Ly6C+ population within single-cell splenic suspension isolated from adult male 6- to 8-week-old C57BL/6 mice (subjected to different chemical treatment – vehicle treated or SIRT1 [EX-527] or SIRT3 [3-TYP] inhibitor or SIRT1 activator SRT1720 treated at a dose of 1 mg/kg) on fifth day post-mCherry-labelled S. Typhimurium infection (107 CFU orally).
Figure 9—figure supplement 2
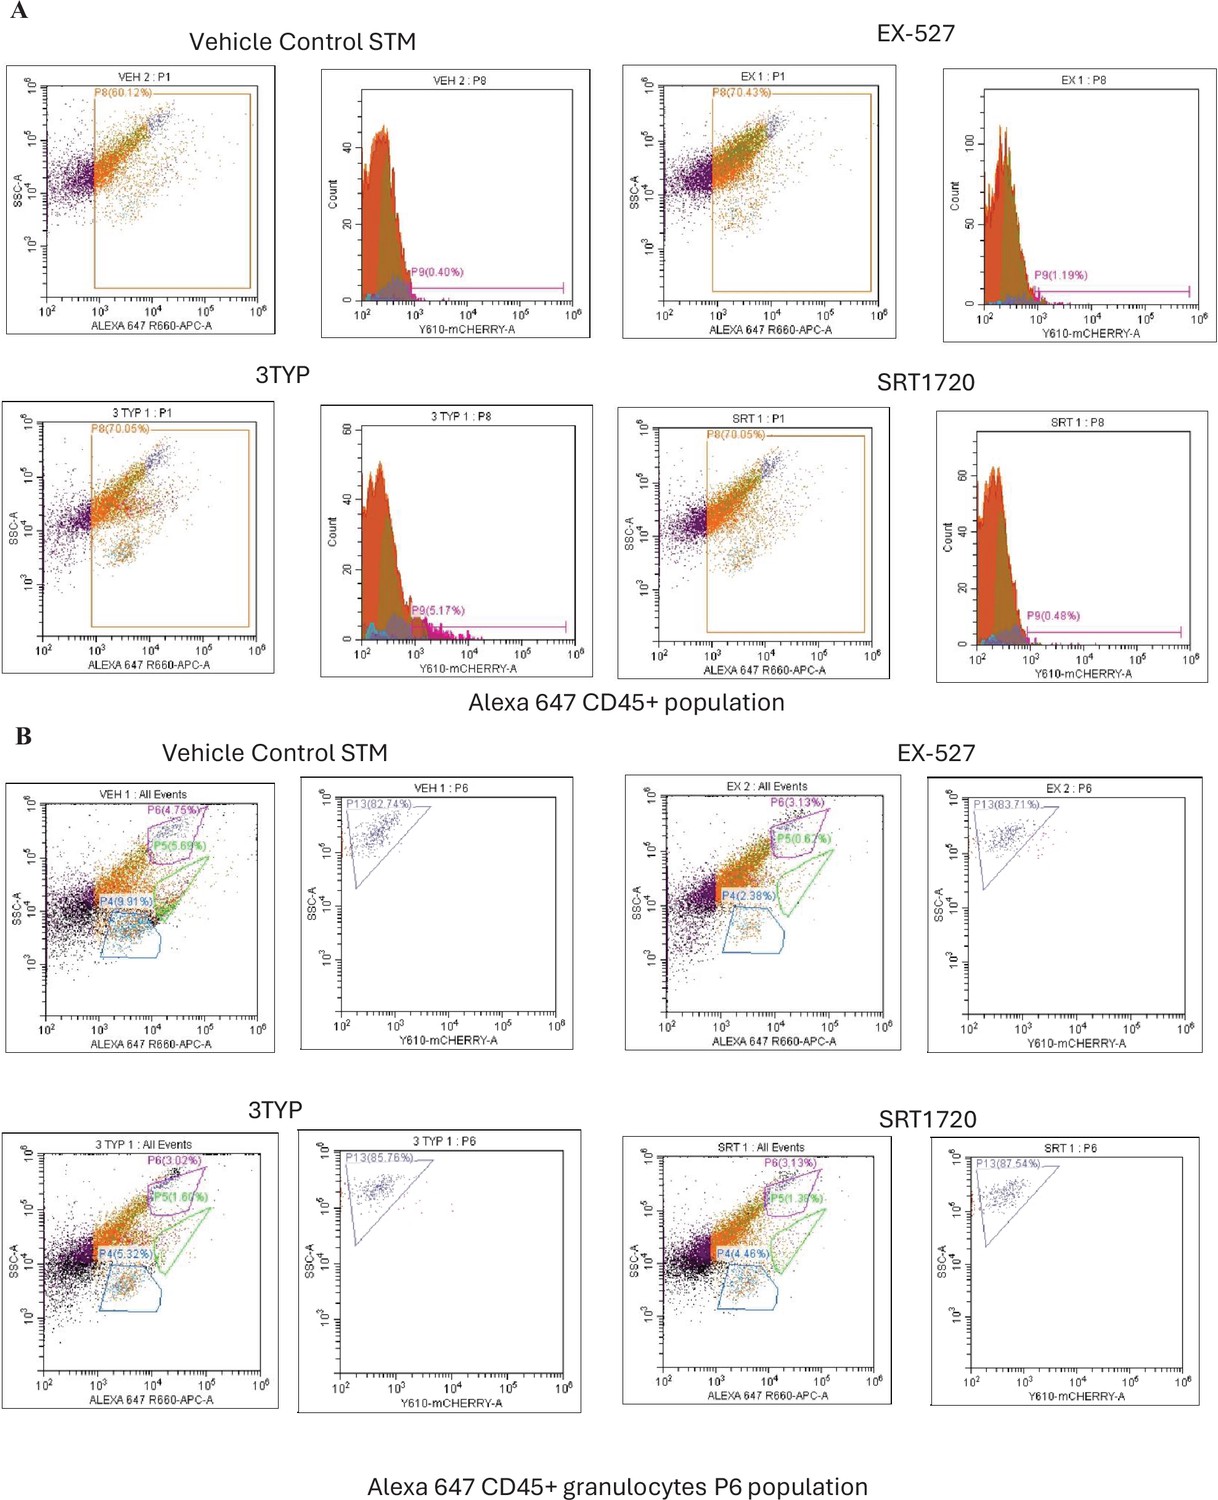
Flow cytometric analysis of different splenic populations within mCherry- labelled S. Typhimurium- infected mice cohorts upon SIRT1 or SIRT3 inhibitor treatment.
(A) Flow cytometric analysis of Alexa 647-conjugated CD45+ population within single cell splenic suspension isolated from adult male 6–8-week-old C57BL/6 mice (subjected to different chemical treatment-Vehicle treated or SIRT1 (EX-527) or SIRT3 (3-TYP) inhibitor or SIRT1 activator SRT1720 treated at a dose of 1mg/kg) at 5th day post-mCherry-labelled S. Typhimurium infection (107 CFU orally). (B) Alexa 647-conjugated CD45+ population (as shown in A) was gated as per granularity (Side Scatter versus Alexa 647 plot) into P6 population with high granularity (granulocytes), P5 (monocytes), and P4 population with low granularity (lymphocytes). Flow cytometric analysis of Alexa 647-conjugated CD45+ P6 (granulocyte) population within single cell splenic suspension isolated from adult male 6–8-week-old C57BL/6 mice (subjected to different chemical treatment-Vehicle treated or SIRT1 (EX-527) or SIRT3 (3-TYP) inhibitor or SIRT1 activator SRT1720 treated at a dose of 1mg/kg) at 5th day post-mCherry-labelled S. Typhimurium infection (107 CFU orally).
Figure 9—figure supplement 3
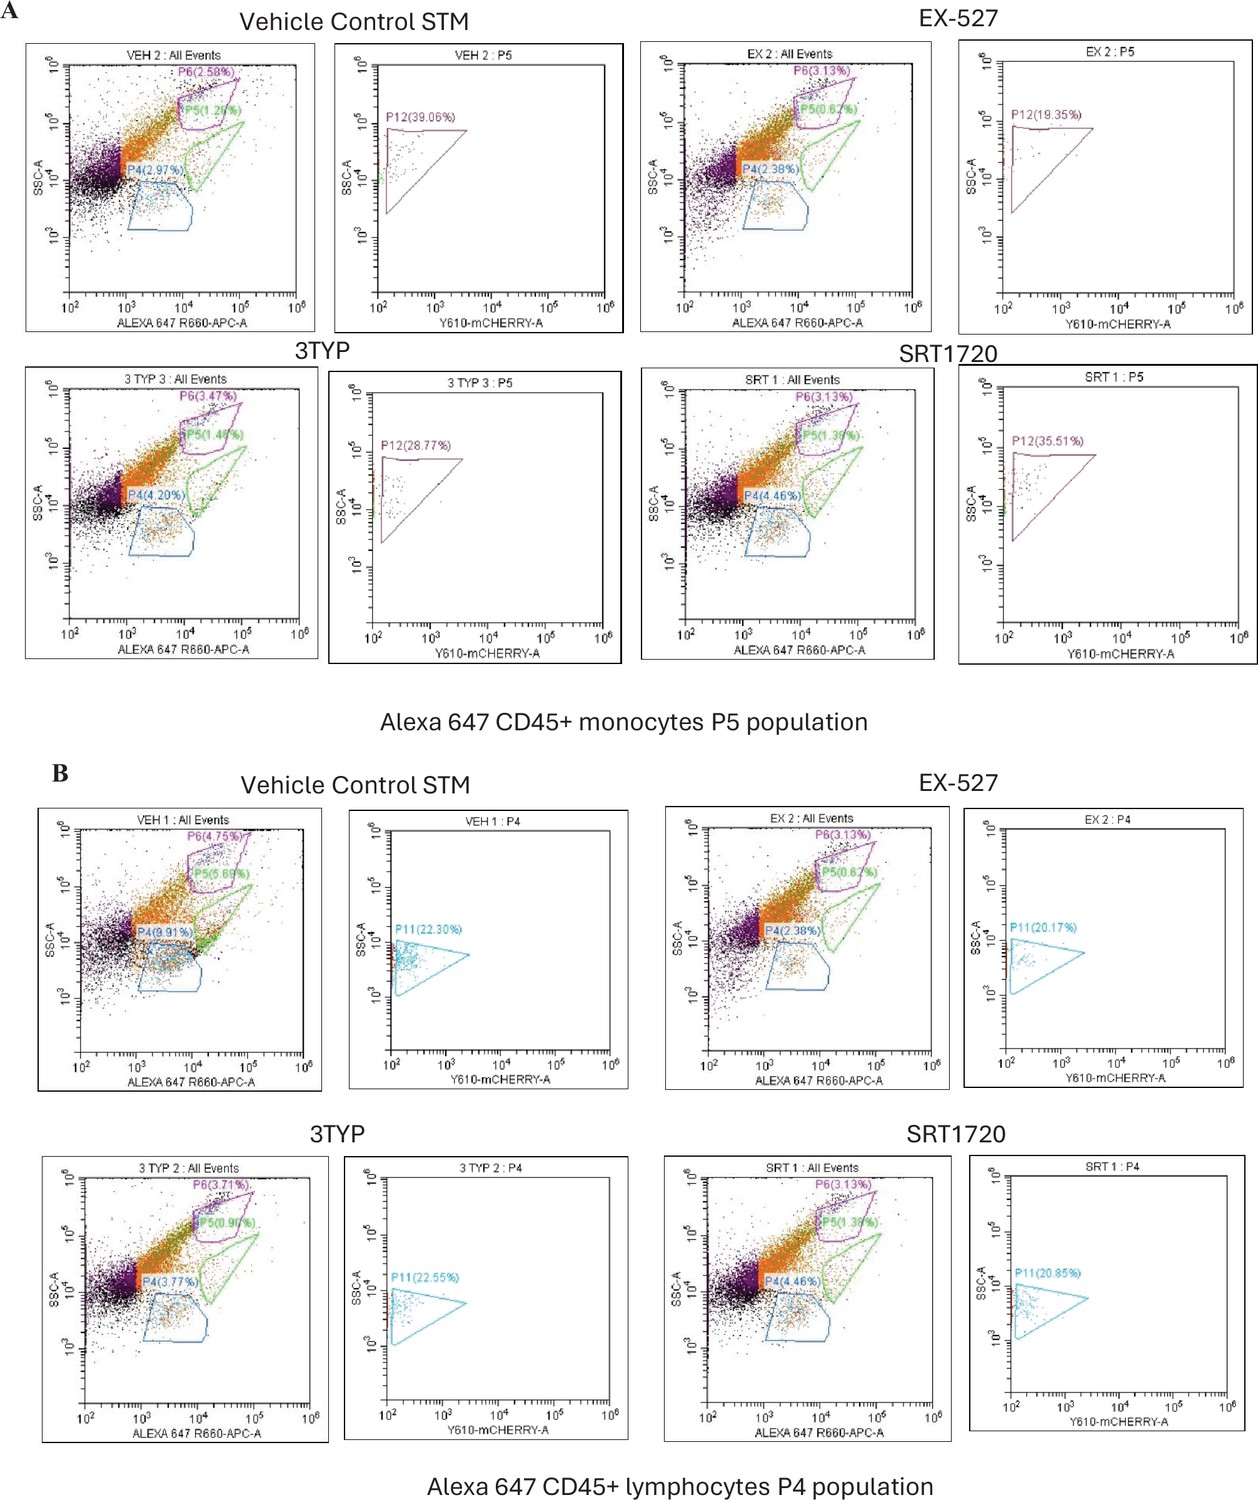
Flow cytometric analysis of different splenic populations within mCherry- labelled S. Typhimurium- infected mice cohorts upon SIRT1 or SIRT3 inhibitor treatment.
(A-B) Flow cytometric analysis of Alexa 647-conjugated CD45+ P5 (monocyte) (A), P4 (lymphocyte) (B) population (shown in Figure 9—figure supplement 2) within single cell splenic suspension isolated from adult male 6–8-week-old C57BL/6 mice (subjected to different chemical treatment-Vehicle treated or SIRT1 (EX-527) or SIRT3 (3-TYP) inhibitor or SIRT1 activator SRT1720 treated at a dose of 1mg/kg) at 5th day post-mCherry-labelled S. Typhimurium infection (107 CFU orally).
Figure 10 with 2 supplements
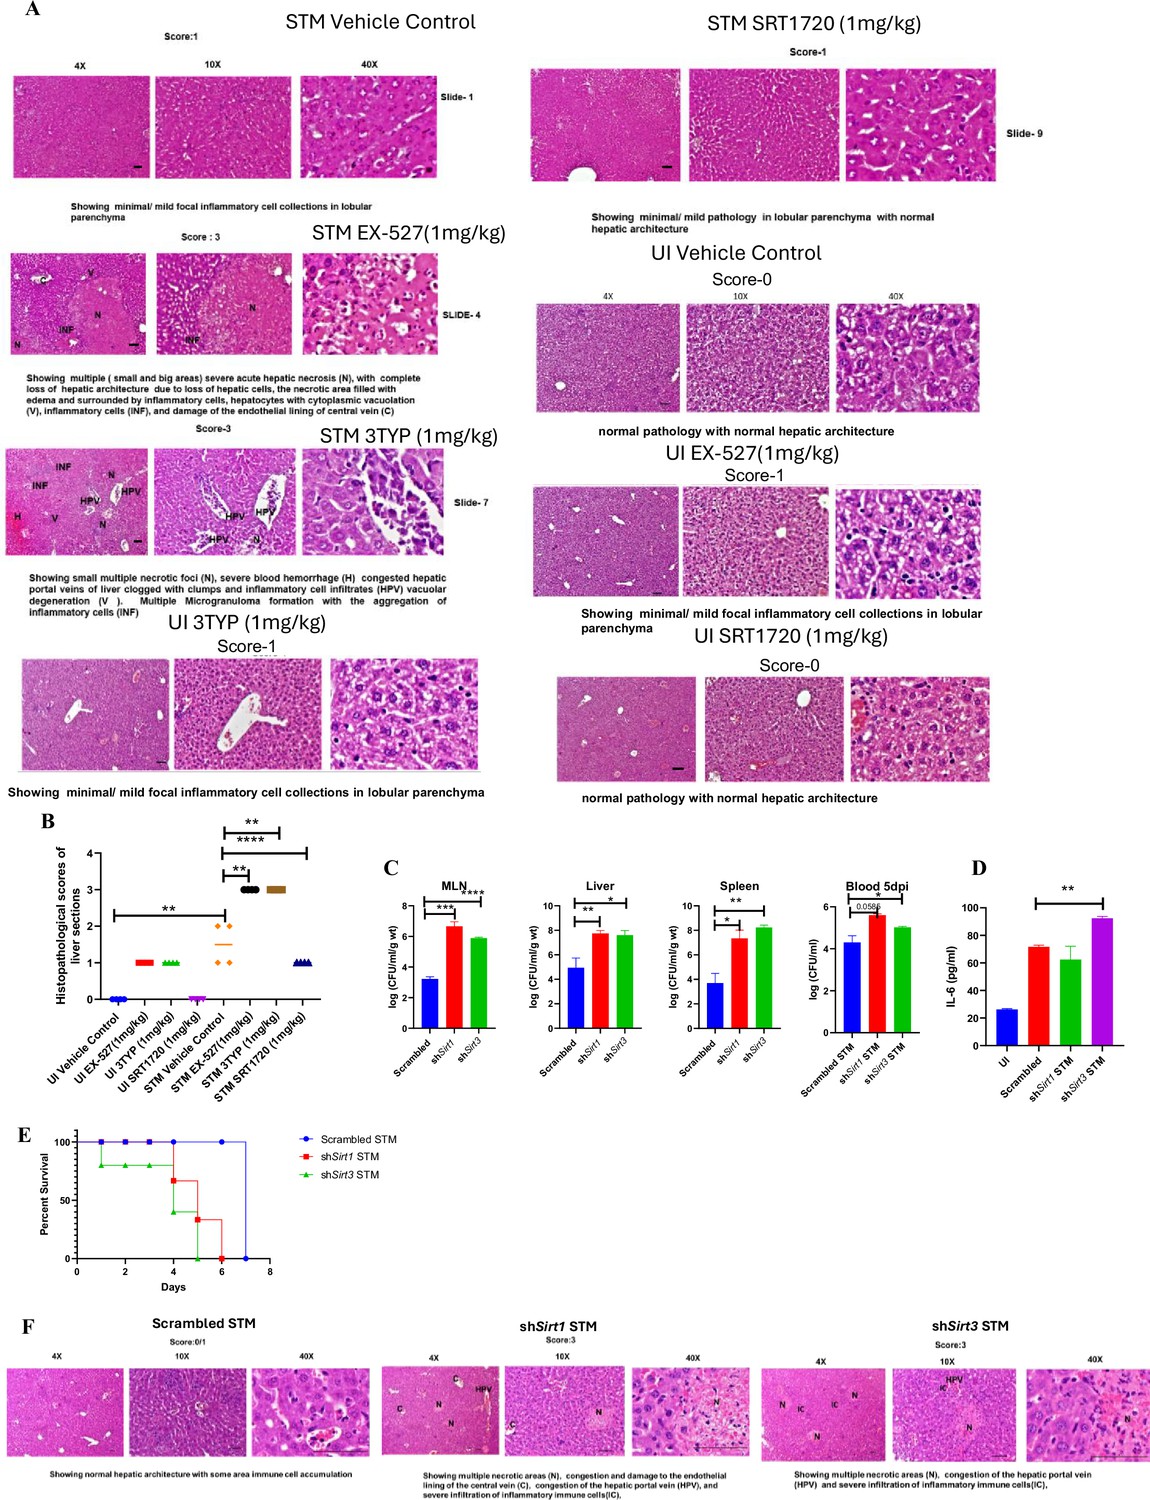
In vivo role of SIRT1 and SIRT3 inhibition and knockdown during S. Typhimurium infection.
(A) Representative image of haematoxylin-eosin-stained liver sections to assess the liver tissue architecture upon Salmonella infection on fifth days post-infection in different mice cohorts (UI, uninfected; STM, S. Typhimurium-infected, EX-527-SIRT1 inhibitor, 3TYP-SIRT3 inhibitor, SRT1720- SIRT1 activator, vehicle control, PBS containing 0.1% DMSO). Scale bar, 50 µm. Scoring system: according to pathological changes, the tissue sections are scored as 0 for normal pathology, 1 for mild/minor pathology, 2 for moderate pathology, and 3 for severe pathological changes. (B) Graph representing the histopathological scoring of the liver sections depicted in (A). Unpaired two-tailed Student’s t-test was performed to obtain the p-values (*p<0.05, ****p<0.0001, ***p<0.001, **p<0.01). (C) In vivo organ burden of STM upon Sirt1 or Sirt3 adenovirus-mediated in vivo knockdown in C57BL/6 mice on fifth day post-infection. Data is representative of N = 3, n > 3. Mann–Whitney test was performed to obtain the p-values (****p<0.0001, *** p<0.001, ** p<0.01, * p<0.05). (D) Serum IL-6 levels of STM-infected C57BL/6 WT mice (males) upon in vivo adenovirus-mediated Sirt1 or Sirt3 knockdown. Data is representative of N = 3, n > 3. Unpaired two-tailed Student’s t-test was performed to obtain the p-values (**p<0.01, *p<0.05). (E) Percent survival of STM -infected C57BL/6 mice upon in vivo adenovirus-mediated Sirt1 or Sirt3 knockdown. Data is representative of N = 3, n > 3. (F) Representative image of haematoxylin-eosin-stained liver sections upon Salmonella infection at 5th days post-infection in different mice cohorts. (Scrambled STM, shSirt1 STM, shSirt3 STM). Scale bar-50µm. Scoring system:- according to pathological changes the tissue sections are scored as 0 for normal pathology, 1 for mild/ minor pathology, 2 for moderate pathology, and 3 for severe pathological changes.
Figure 10—figure supplement 1
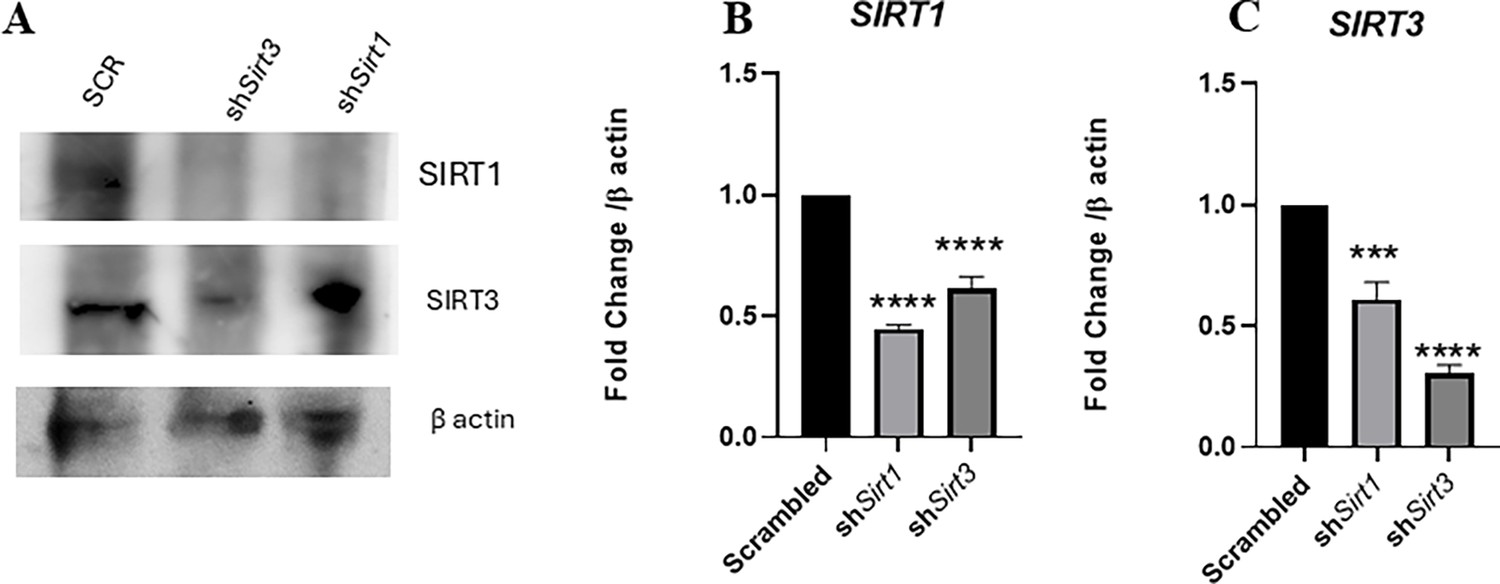
In vivo knockdown validation by western blotting and qPCR in liver.
(A) Immunoblotting of SIRT1 and SIRT3 in harvested liver samples upon AAV-mediated in vivo knockdown in mice. (B) qPCR-mediated gene expression of Sirt1 in harvested liver samples upon in vivo AAV-mediated gene inhibition in mice. Data is representative of N = 3,n = 3. Unpaired two-tailed Student’s t-test was performed to obtain the p-values. (****p<0.0001,***p<0.001, ** p<0.01, *p<0.05). (C) qPCR-mediated gene expression of Sirt3 in harvested liver samples upon in vivo AAV-mediated gene inhibition in mice. Data is representative of N = 3,n = 3. Unpaired two-tailed Student’s t-test was performed to obtain the p-values (****p<0.0001,***p<0.001, ** p<0.01, *p<0.05).
-
Figure 10—figure supplement 1—source data 1
Original files for western blot analysis displayed in Figure 10—figure supplement 1A.
- https://cdn.elifesciences.org/articles/93125/elife-93125-fig10-figsupp1-data1-v1.zip
-
Figure 10—figure supplement 1—source data 2
File containing original uncropped western blots for Figure 10—figure supplement 1A, indicating relevant bands and treatments.
- https://cdn.elifesciences.org/articles/93125/elife-93125-fig10-figsupp1-data2-v1.zip
Figure 10—figure supplement 2
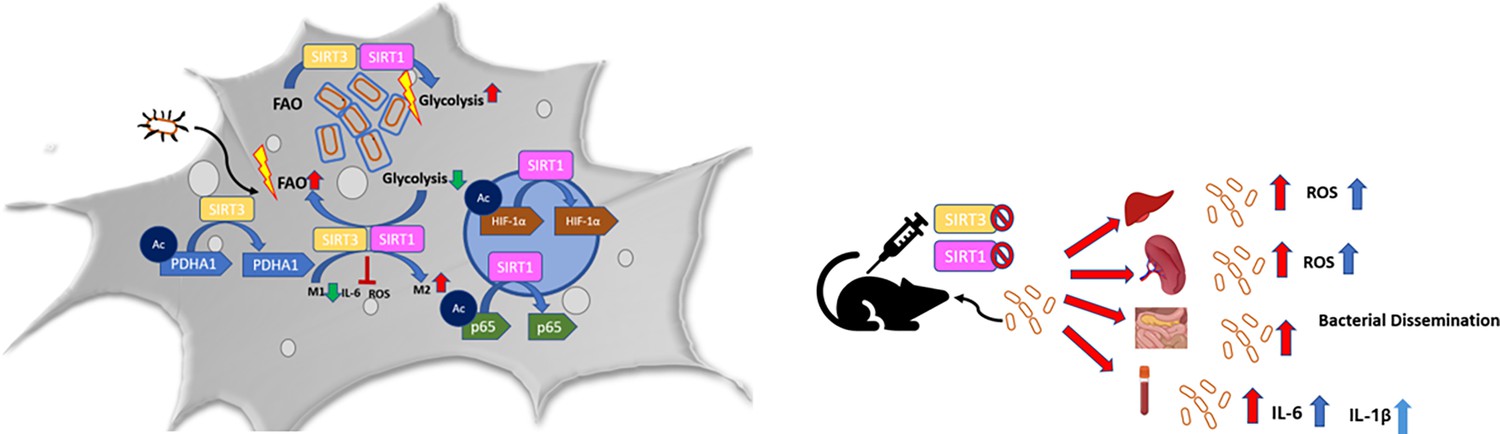
Schematic diagram – in murine macrophages, Salmonella infection drives an immuno-metabolic shift toward an immunosuppressive state with an increase in host fatty acid oxidation rate by modulating SIRT1 and SIRT3.
SIRT1 and SIRT3 regulate the acetylation status of NFκB p65 subunit, HIF-1α, PDHA1, thereby influencing host metabolism, which in turn impacts the intracellular Salmonella metabolism. Inhibition or knockdown of SIRT1 or SIRT3 triggers increased ROS, pro-inflammatory cytokine burst with a concomitant decline in host fatty acid oxidation and a corresponding increase in bacterial fatty acid oxidation together amounting to decreased intracellular bacterial replication. Contrastingly, in in vivo mice model of infection, SIRT1 and SIRT3 cause increased bacterial dissemination owing to increased ROS, IL-6, and IL-1β production.
Author response image 1

Uninfected.
Author response image 2

Vehicle control infected.
Author response image 3

EX-527 infected.
Author response image 4

3TYP infected.
Author response image 5

SRT 1720 infected.
Author response image 6

Alternate blot images for Fig. 7B-C.
Author response image 7

Alternate blot images for Fig. 7I, J.
Author response image 8
Author response image 9
Tables
Key resources table
| Reagent type (species) or resource | Designation | Source or reference | Identifiers | Additional information |
|---|---|---|---|---|
| Strain, strain background | Salmonella enterica serovar Typhimurium ATCC strain 14028S (STM) | ATCC strain 14028S – gfted by Prof. M. Hensel | ATCC strain 14028S | |
| Recombinant DNA reagent | pFPV:GFP-AmpR | Laboratory stock | ||
| Recombinant DNA reagent | pFPV:mCherry-AmpR | Laboratory stock | ||
| Recombinant DNA reagent | pLKO.2: shRNA-AmpR | Laboratory stock – gifted by Prof. Subba Rao | ||
| Recombinant DNA reagent | STM ∆ invC-KanR | Laboratory stock | ||
| Recombinant DNA reagent | STM ∆ ssaV-ChlR | Laboratory stock | ||
| Recombinant DNA reagent | STM ∆ steE-KanR | Laboratory stock | ||
| Cell line | RAW 264.7; macrophage; mouse (Mus musculus) | ATCC | ATCC-TIB-71 | |
| Antibody | SIRT1 polyclonal | Thermo Fisher Scientific | Cat# PA5-85921 | 1:1000 dilution (western), 1:100 (immunoprecipitation) |
| Antibody | SIRT3 monoclonal | Thermo Fisher Scientific | Cat# PA5-13222 | 1:1000 dilution (western), 1:100 (immunoprecipitation) |
| Antibody | CD86 monoclonal | Thermo Fisher Scientific | Cat# 12-086282PE | 1:100 dilution |
| Antibody | CD206 monoclonal | Thermo Fisher Scientific | Cat# 17-2069-42 | 1:100 dilution |
| Antibody | F4/80 monoclonal antibody | BD Horizon | Cat# 565411 | 1:100 dilution |
| Antibody | HIF-1α monoclonal | Santa Cruz | sc-13515 SCBT | 1:1000 dilution (western), 1:100 (immunoprecipitation) |
| Antibody | NF-κβ p65 monoclonal | CST (D14E12) | #8242 | 1:1000 dilution (western), 1:100 (immunoprecipitation) |
| Antibody | Acetylated-lysine antibody polyclonal | CST | Cat# 9441 | 1:1000 dilution |
| Antibody | PDHA1 monoclonal | ABclonal | Cat# A13687 | 1:1000 dilution (western), 1:100 (immunoprecipitation) |
| Antibody | HADHA monoclonal | ABclonal | Cat# A5346 | 1:1000 dilution |
| Antibody | ACOX1 monoclonal | ABclonal | Cat# A8091 | 1:1000 dilution |
| Antibody | PGK monoclonal | ABclonal | Cat# A12686 | 1:1000 dilution |
| Antibody | PFK monoclonal | ABclonal | Cat# A5477 | 1:1000 dilution |
| Antibody | β actin monoclonal | Sigma | A3854 | 1:50,000 dilution |
| Commercial assay or kit | Lactate Assay Kit | Sigma | Cat# MAK064 | |
| Commercial assay or kit | Fatty acid oxidation (FAO) Assay Kit | AssayGenie | Catalogue code BR00001 | |
| Commercial assay or kit | IL-6 | BD Bioscience | Cat# 555240 | |
| Commercial assay or kit | IL-10 | BD Bioscience | Cat# 555252 | |
| Commercial assay or kit | IL-1β | SARD Biosciences | Cat# SB-EKM1085 | |
| Antibody | CD16/32 monoclonal | eBioscience | Cat# 14-0161-82 | 1:100 dilution |
| Antibody | eFluor450-conjugated anti-mouse CD11c monoclonal | eBioscience | Cat# 48-0116-42 | 1:100 dilution |
| Antibody | FITC-conjugated anti-mouse Ly6C antibody monoclonal | BD Pharmingen | Cat# 553104 | 1:100 dilution |
| Antibody | Alexa 647-conjugated anti-mouse CD45 antibody mooclonal | BioLegend | Cat# 103124 | 1:100 dilution |
| Chemical compound, drug | SIRT1 inhibitor EX-527 | Sigma-Aldrich | E7034-5MG | |
| Chemical compound, drug | SIRT3 inhibitor 3TYP | Selleck Chemical | Cat# S8628 | |
| Chemical compound, drug | SIRT1 activator SRT1720 | Sigma-Aldrich | 567860-10MG | |
| Chemical compound, drug | N-Acetyl cysteine | Sigma-Aldrich | A9165 | |
| Chemical compound, drug | PEI Max 4000 | Polysciences | Cat# 24765 | |
| Chemical compound | Protease Inhibitor Cocktail | Roche | 04693132001 | |
| Chemical compound, drug | Saponin | Sigma | SAE0073 | |
| Chemical compound, drug | Chetomin | Sigma | C9623 | |
| Chemical compound, drug | SS agar | Himedia | M-108 | |
| Chemical compound, drug | Skimmed milk | Himedia | GRM-1254 |
Table 1
List of shRNA used for knockdown.
| Sirtuins | Construct ID | TRC ID | Sequence (5’–3’) |
|---|---|---|---|
| Sirt1 | C4 | TRCN0000218734 | GTACCGGCATGAAGTGCCTCAGATATTACTCGAGTAATATCTGAGGCACTTCATGTTTTTTG |
| Sirt1 | C12 | TRCN0000018979 | CCGGGCAAAGCCTTTCTGAATCTATCTCGAGATAGATTCAGAAAGGCTTTGCTTTTT |
| Sirt3 | E8 | TRCN0000038889 | CCGGCCCAACGTCACTCACTACTTTCTCGAGAAAGTAGTGAGTGACGTTGGGTTTTTG |
| Sirt3 | E12 | TRCN0000038893 | CCGGCCACCTGCACAGTCTGCCAAACTCGAGTTTGGCAGACTGTGCAGGTGGTTTTTG |
Table 2
List of primers.
| Primer name | Sequence (5’–3’) |
|---|---|
| Sirt1 FP | ACAAAGTTGACTGTGAAGCTGTAC |
| Sirt1 RP | GTTCATCAGCTGGGCACCTA |
| Sirt3 FP | GCTGCTTCTGCGGCTCTATAC |
| Sirt3 RP | GAAGGACCTTCGACAGACCGT |
| Ppard FP | CACAACGCTATCCGCTTTGG |
| Ppard RP | ATGCTCCGGGCCTTCTTTTT |
| Actb FP | CAGCAAGCAGGAGTACGATG |
| Actb RP | GCAGCTCAGTAACAGTCCG |
| Acadl FP | CTTGGGAAGAGCAAGCGTACT |
| Acadl RP | CTGTTCTTTTGTGCCGTAATTCG |
| Hadha FP | AGCAACACGAATATCACAGGAAG |
| Hadha RP | AGGCACACCCACCATTTTGG |
| Acox1 FP | TCGAAGCCAGCGTTACGAG |
| Acox1 RP | ATCTCCGTCTGGGCGTAGG |
| Pdha1 FP | TGTCGGTTCCCAGTCCATCA |
| Pdha1 RP | CGTTTCCTTTTCACAGCACATGA |
| Pfkl FP | GAACTACGCACACTTGACCAT |
| Pfkl RP | CTCCAAAACAAAGGTCCTCTGG |
| ptsG FP | TATCTGGGCTTCTTTGCGGG |
| ptsG RP | ACCAGGCAACGCTCGATAAA |
| fadA FP | TCTGGGATTGATGGAGCAGA |
| fadA RP | AGACCAATACACATCGTCGC |
| fadB FP | GTCCCCGAAGAGCAGTTAAG |
| fadB RP | CCAGTTTAGTTTCCGGCAGA |
| aceA FP | CGATCTGGTATGGTGCGAAA |
| aceA RP | TTCTGCCAGTTGAAGGATGG |
| aceB FP | AGCGTTTCAATCAACAGGGT |
| aceB RP | CCCGTATTTTTACCTGCCGA |
| Salmonella 16S rRNA FP | GTGAGGTAACGGCTCACCAA |
| Salmonella 16S rRNA RP | TAACCGCAACACCTTCCTCC |
Additional files
Download links
A two-part list of links to download the article, or parts of the article, in various formats.
Downloads (link to download the article as PDF)
Open citations (links to open the citations from this article in various online reference manager services)
Cite this article (links to download the citations from this article in formats compatible with various reference manager tools)
Salmonella-induced SIRT1 and SIRT3 are crucial for maintaining the metabolic switch in bacteria and host for successful pathogenesis
eLife 13:RP93125.
https://doi.org/10.7554/eLife.93125.4


