Shared structure facilitates working memory of multiple sequences
- School of Psychological and Cognitive Sciences, Peking University, China
- PKU-IDG/McGovern Institute for Brain Research, Peking University, China
- Beijing Key Laboratory of Behavior and Mental Health, Peking University, China
- Max Planck Institute for Human Cognitive and Brain Sciences, Germany
Figures
Figure 1
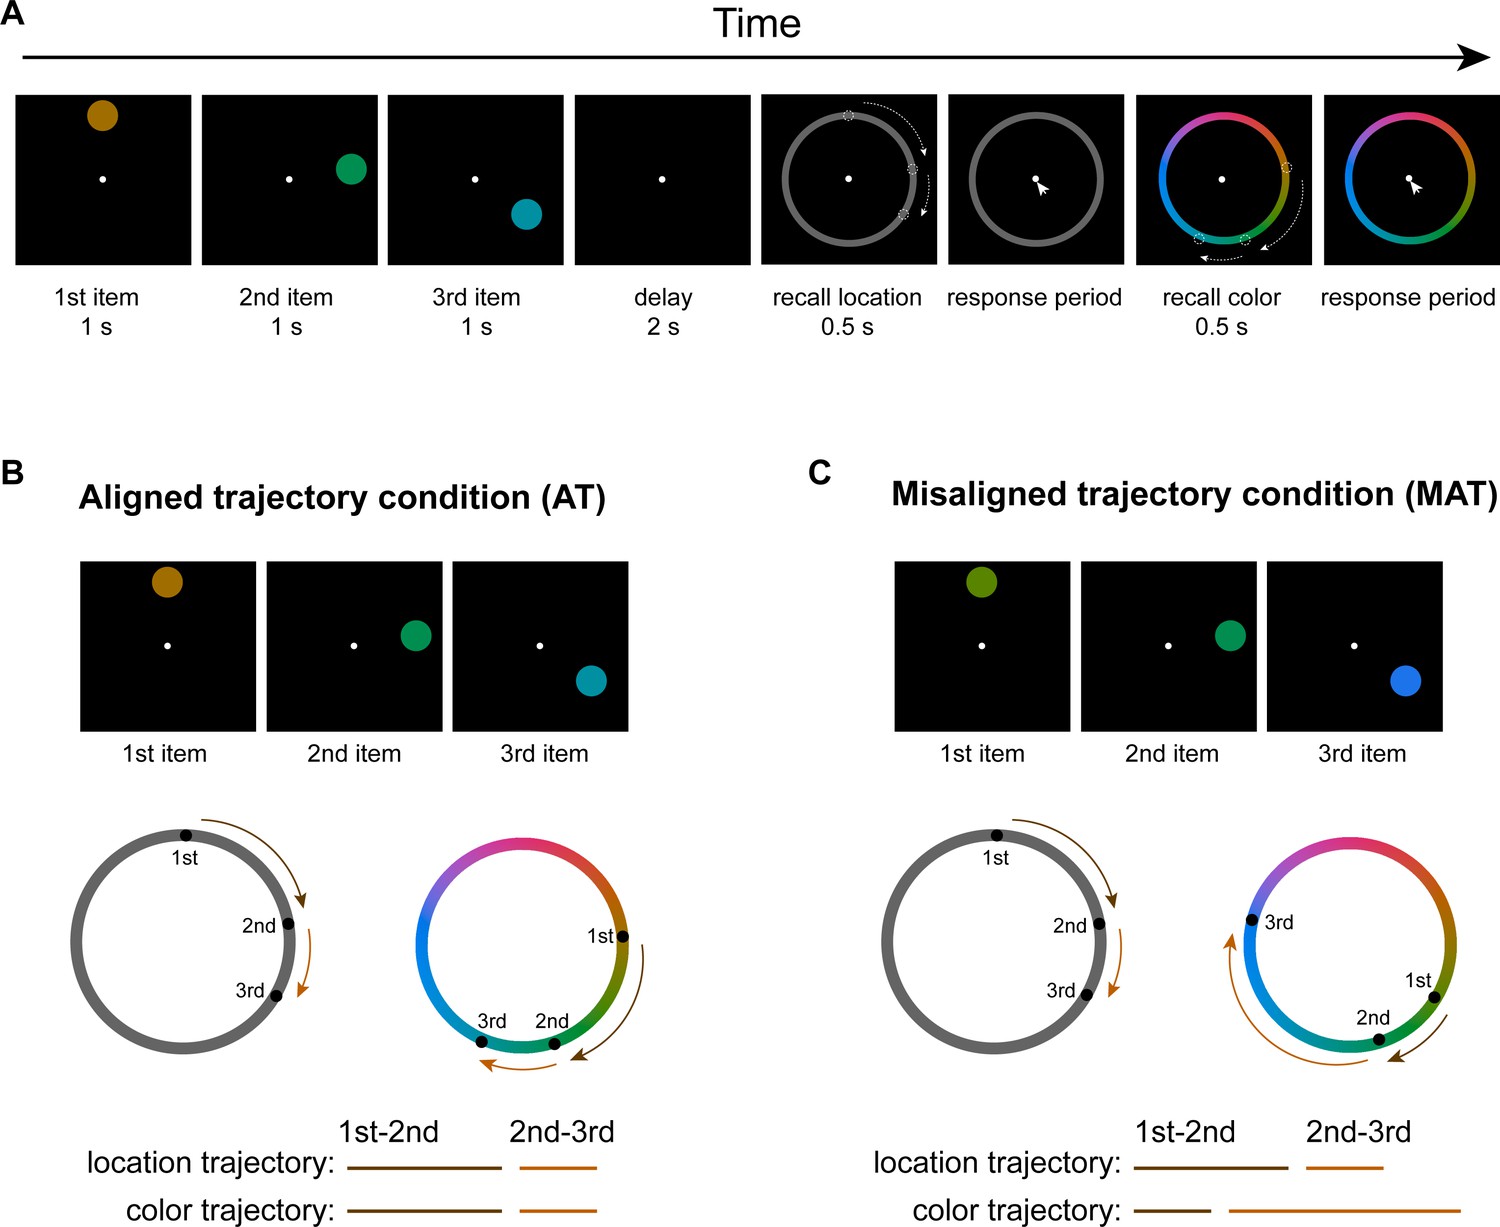
Experimental paradigm.
(A) Participants were presented with a sequence of disks of different colors and at different locations. They were asked to memorize both the location and color of the sequence and later reproduce the full location and color sequences one after another by clicking the corresponding positions on the respective report rings. During the ‘recall location’ phase, a gray ring appeared and participants prepared for subsequent location recall without motor movement, to ensure memory decoding without motor interventions. During the following ‘response period,’ subjects serially selected memorized spatial locations on a ‘location ring.’ Next, a color ring appeared (‘recall color’) for subjects to be ready for subsequent color recall. They then clicked the remembered colors on a ‘color ring’ (‘response period’). (B) Aligned trajectory condition (AT) wherein the trajectory distances between consecutive items (i.e. first to second,second to third) of location and color sequences are identical, although the two sequences occupy different locations within their respective rings. (C) Misaligned condition (MAT), wherein the trajectory distances between consecutive items are different for location and color sequences.
Figure 2 with 1 supplement
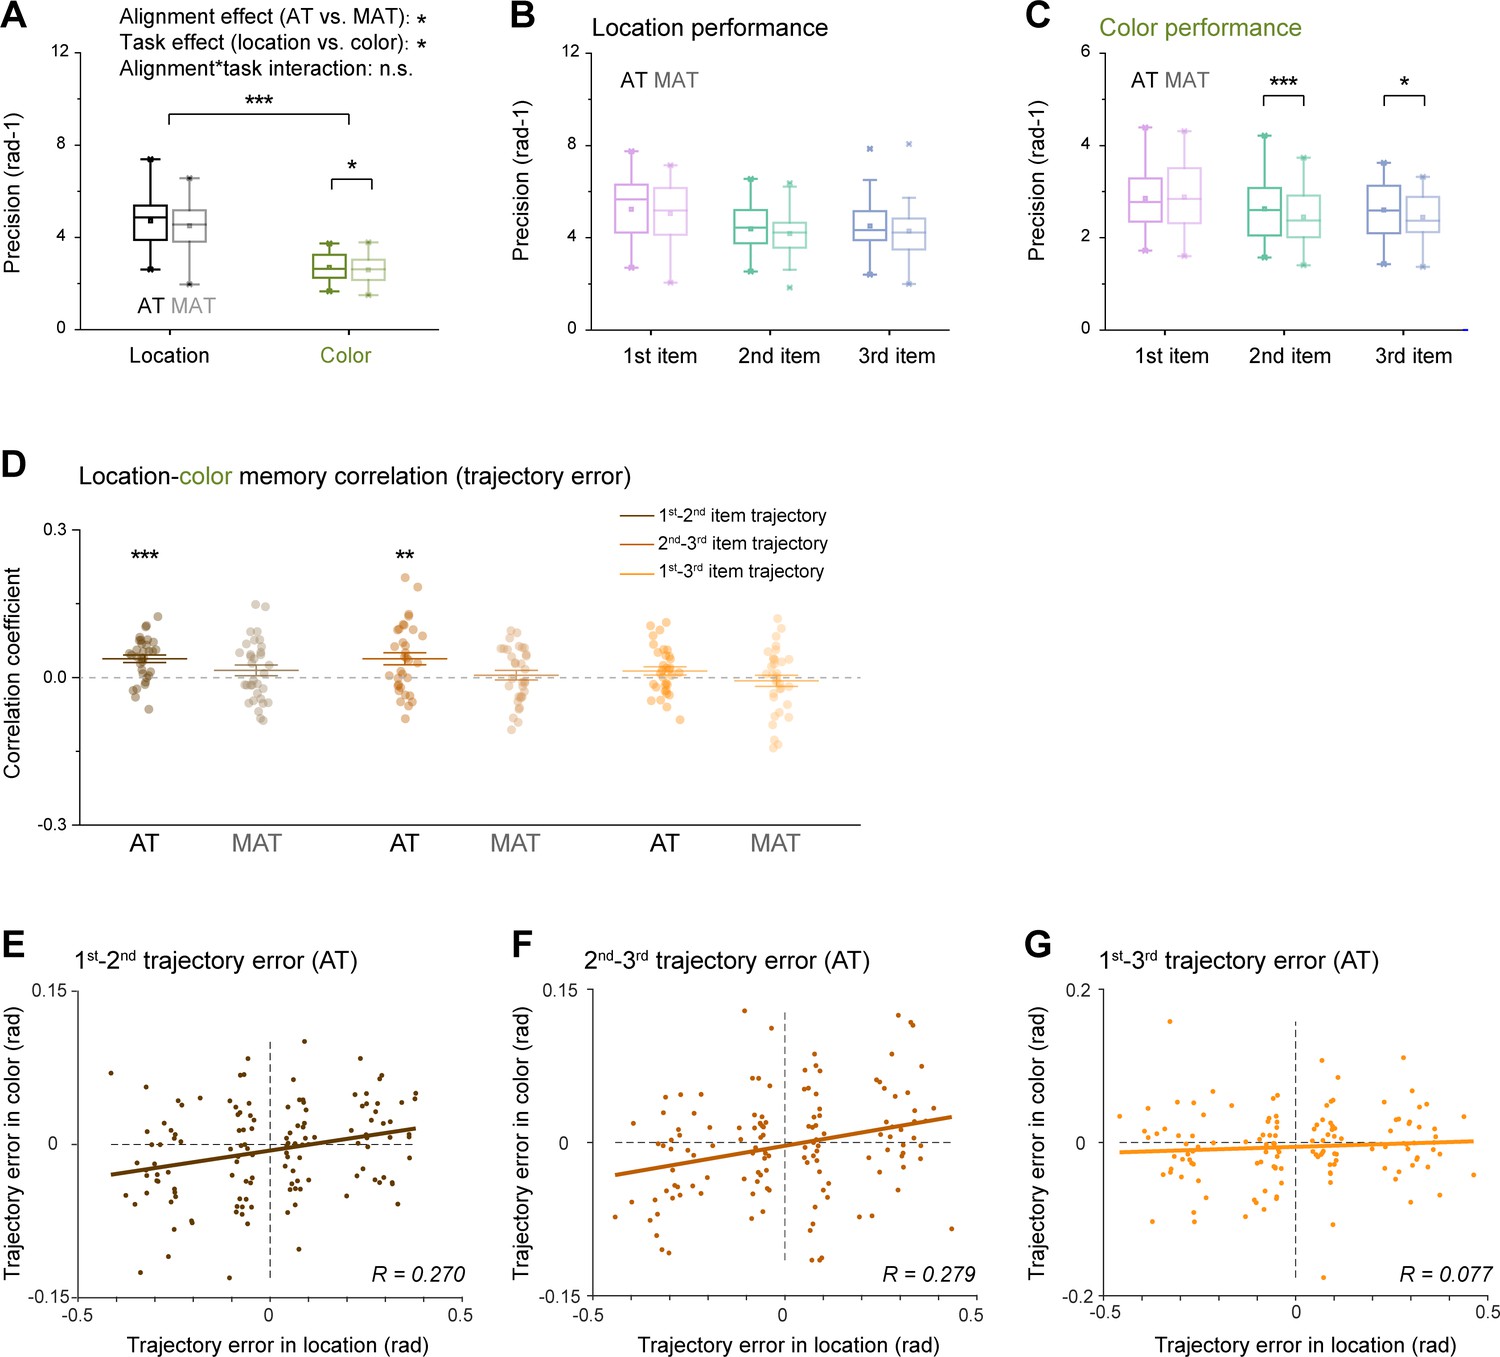
Behavioral performance.
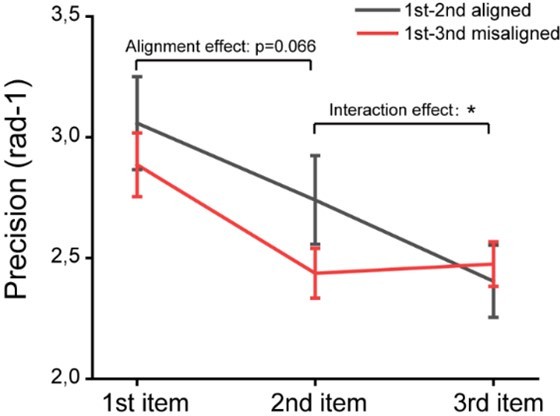
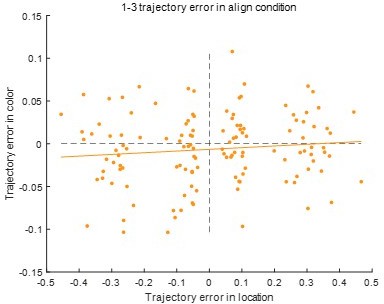
(A) Memory precision performance of location (black) and color (green) sequences for aligned trajectory (AT) (dark color) and misaligned condition (MAT) (light color) conditions. Horizontal line in the boxplots denotes the median; box outlines denote the 25th and 75th percentiles; whiskers denote 1.5 × the interquartile range. Extreme values are denoted by crosses. (N = 33, *p<0.05; **p<0.01; ***p<0.001). (B) Memory precision of first (purple), second (turquoise), and third (blue) items of location sequence, for AT (dark color) and MAT (light color) conditions. (C) Memory precision of first (purple), second (turquoise), and third (blue) items of color sequence, for AT (dark color) and MAT (light color) conditions. (D) Grand average (mean ± SEM) correlation coefficients of recalled trajectory error between location and color sequences, for first-to-second trajectory (brown), second -to-third trajectory (brickred), and first-to-third trajectory (orange), under AT (dark color) and MAT (light color) conditions. Dots indicate individual participants. (E) Scatterplot of first-to-second trajectory memory error for location sequence (X-axis) and Color sequence (Y-axis) under AT condition. Note that the trajectory error of all trials within each subject was divided into four bins according to the location trajectory error, resulting in 33 (subject number)*4 (bins) dots in the plot. The brown line represents the best linear fit. (F) Same as E, but for the second-to-third trajectory. (G) Same as E, but for the first-to-third trajectory.
Figure 2—figure supplement 1
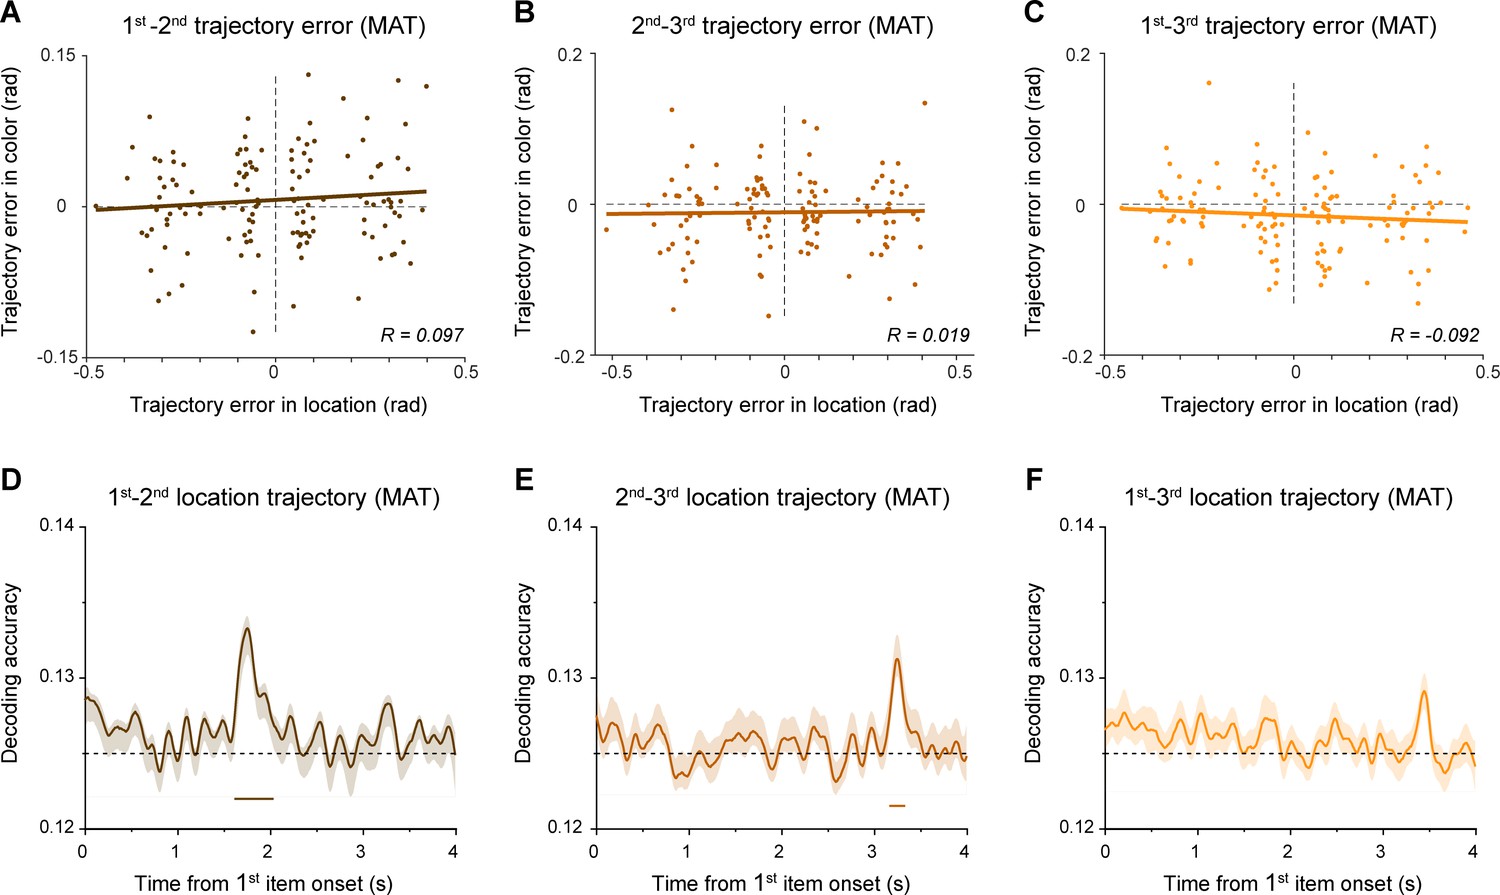
Behavioral performance and trajectory representation for misaligned condition.
(A) Scatterplot of first-to-second trajectory memory error for location sequence (X-axis) and Color sequence (Y-axis) under misaligned condition (MAT). Note that the trajectory error of all trials within each subject was divided into four bins according to the location trajectory error, resulting in 33 (subject number)*4 (bins) dots in the plot. The brown line represents the best linear fit. (B) Same as A, but for second-to-third trajectory. (C) Same as A, but for first-to-third trajectory. (D) Grand average (mean ± SEM) neural decoding of first-to-second as a function of time during the encoding period, for MAT condition. (E) Same as A, but for second-to-third trajectory. (F) Same as A, but for first-to-third trajectory.
Figure 3
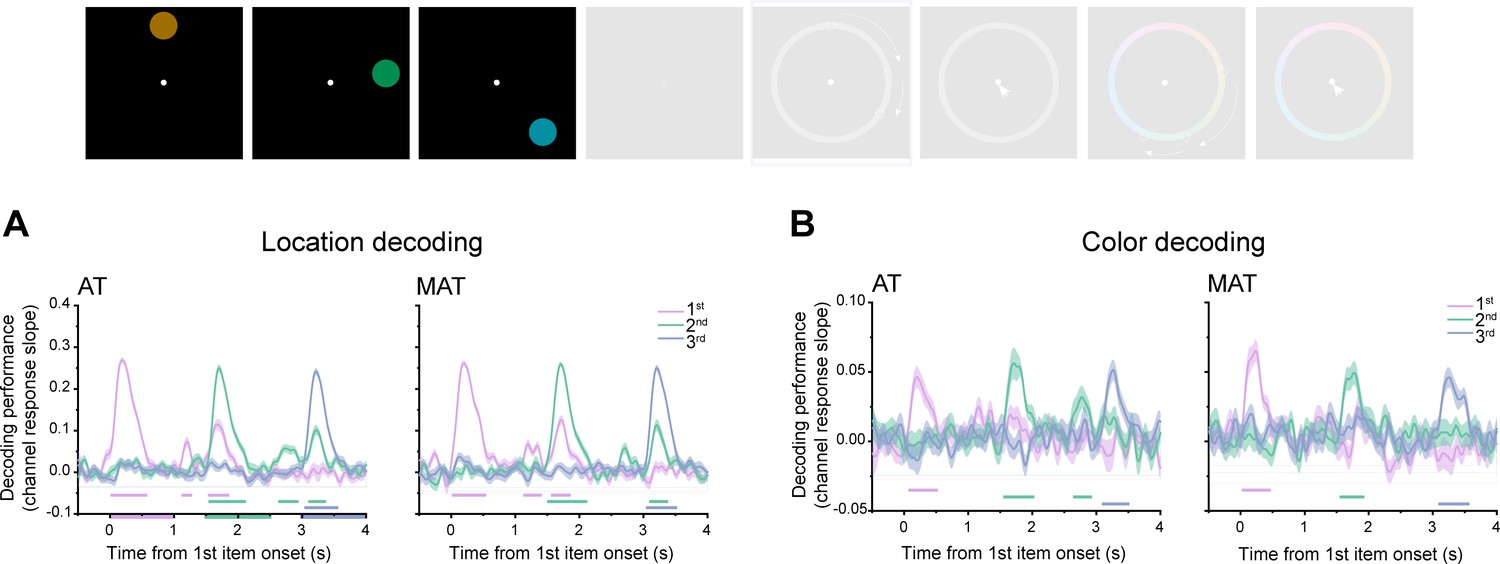
Neural representation of memory contents during the encoding period.
(A) Grand average (mean ± SEM) neural decoding (slope of channel response) of location information for the first (purple), second (turquoise), and third (blue) disk as a function of time during the encoding period, for aligned trajectory (AT) (left panel) and misaligned conditions (MAT) (right panel). Horizontal lines with corresponding colors denote significant time ranges (cluster-based permutation test, cluster-defining threshold p<0.001, corrected significance level p<0.001) (B) Same as A, but for color feature decoding.
Figure 4 with 2 supplements
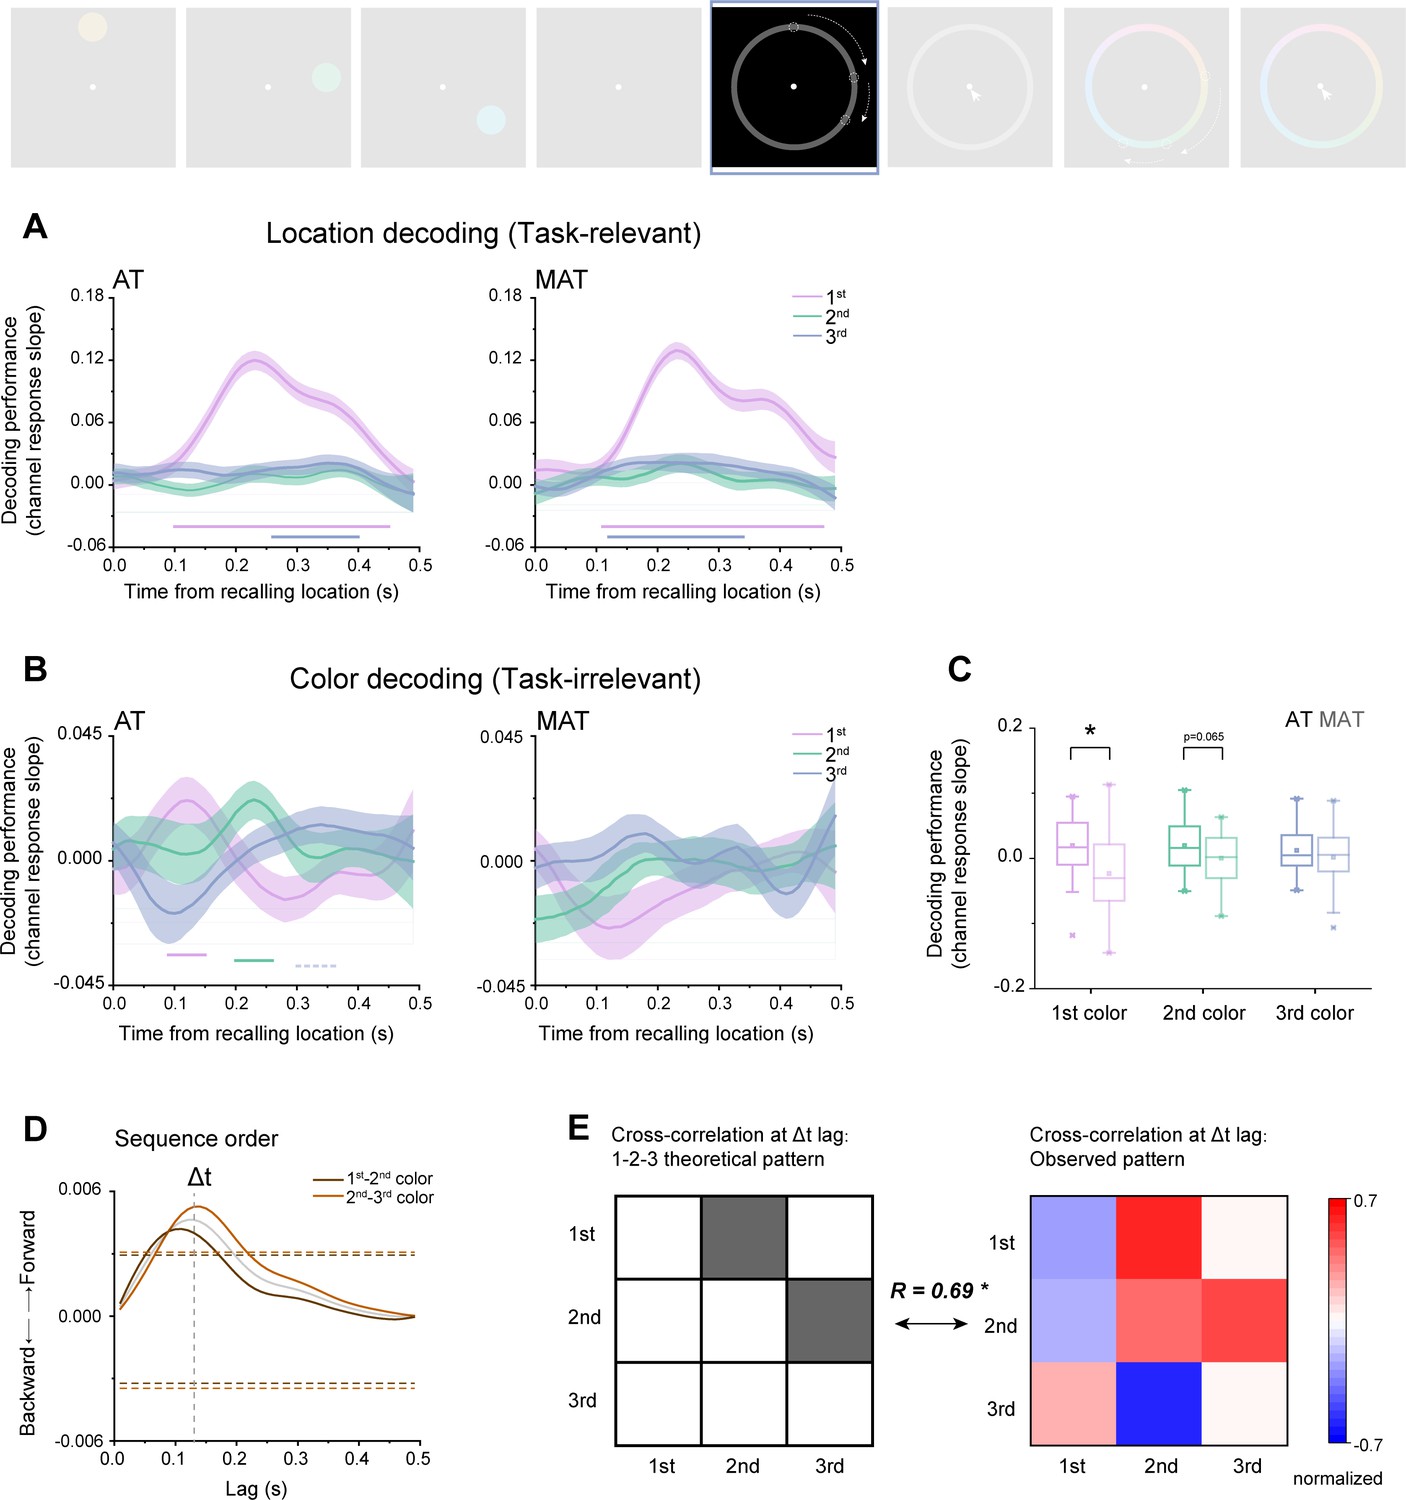
Spontaneous color sequence replay during ‘location recall’.
(A) Grand average (mean ± SEM) decoding performance for first (purple), second (turquoise), and third (blue) locations as a function of time during the ‘“recall location’ period, for aligned trajectory (AT) (left panel) and misaligned (MAT) conditions (right panel). (B) Grand average (mean ± SEM) decoding performance for first (purple), second (turquoise), and third (blue) colors as a function of time during ‘recall location’ period, for AT (left panel) and MAT conditions (right panel). (Horizontal solid line: cluster-based permutation test, cluster-defining threshold p<0.05, corrected significance level p<0.05; Horizontal dashed line: marginal significance, cluster-defining threshold p<0.1, 0.05<cluster p<0.1) (C) Grand average decoding performance within the respective significant time range, for first (purple), second (turquoise) and third (blue) colors, under AT (dark color) and MAT (light color) conditions. (D) Cross-correlation coefficient, calculated to quantify the extent of the neural representations of adjacent two items followed a forward (positive y) or backward (negative y) transition as a funciton of time lag, between first and second colors (brown color) and between second and third (brick red color) colors, and their average (gray color). Dashed vertical line denotes the peak of the averaged cross-correlation time courses. Dashed horizontal lines denote the nonparametric statistical significance threshold (p<0.05, permutation test). (E) Left panel: theoretical transition pattern for three-item forward replay, i.e., first-second-third, characterized by cross-correlation at certain time lag. Right panel: empirical transitional pattern (actual cross-correlation matrix) at 130 ms time lag. A significant correlation was found between the two matrices (r=0.690, p=0.040), further confirming the forward replay of color sequence.
Figure 4—figure supplement 1
Color and location representations during "color recall".
(A) Left panel: grand average (mean ± SEM) time courses of the decoding performance for the first (purple), second (turquoise), and third (blue) working memory (WM) colors during color recalling period. Right panel: grand average (mean ± SEM) time courses of the decoding performance in misaligned condition (MAT) condition. (B) Left panel: grand average (mean ± SEM) time courses of the decoding performance for the first, second, and third WM locations during color recalling period. Right panel: grand average (mean ± SEM) time courses of the decoding performance in MAT condition. (Horizontal solid line: cluster-based permutation test, cluster-defining threshold p<0.05, corrected significance level p<0.05; Horizontal dashed line: marginal significance, cluster-defining threshold p<0.1, 0.05<cluster p<0.1).
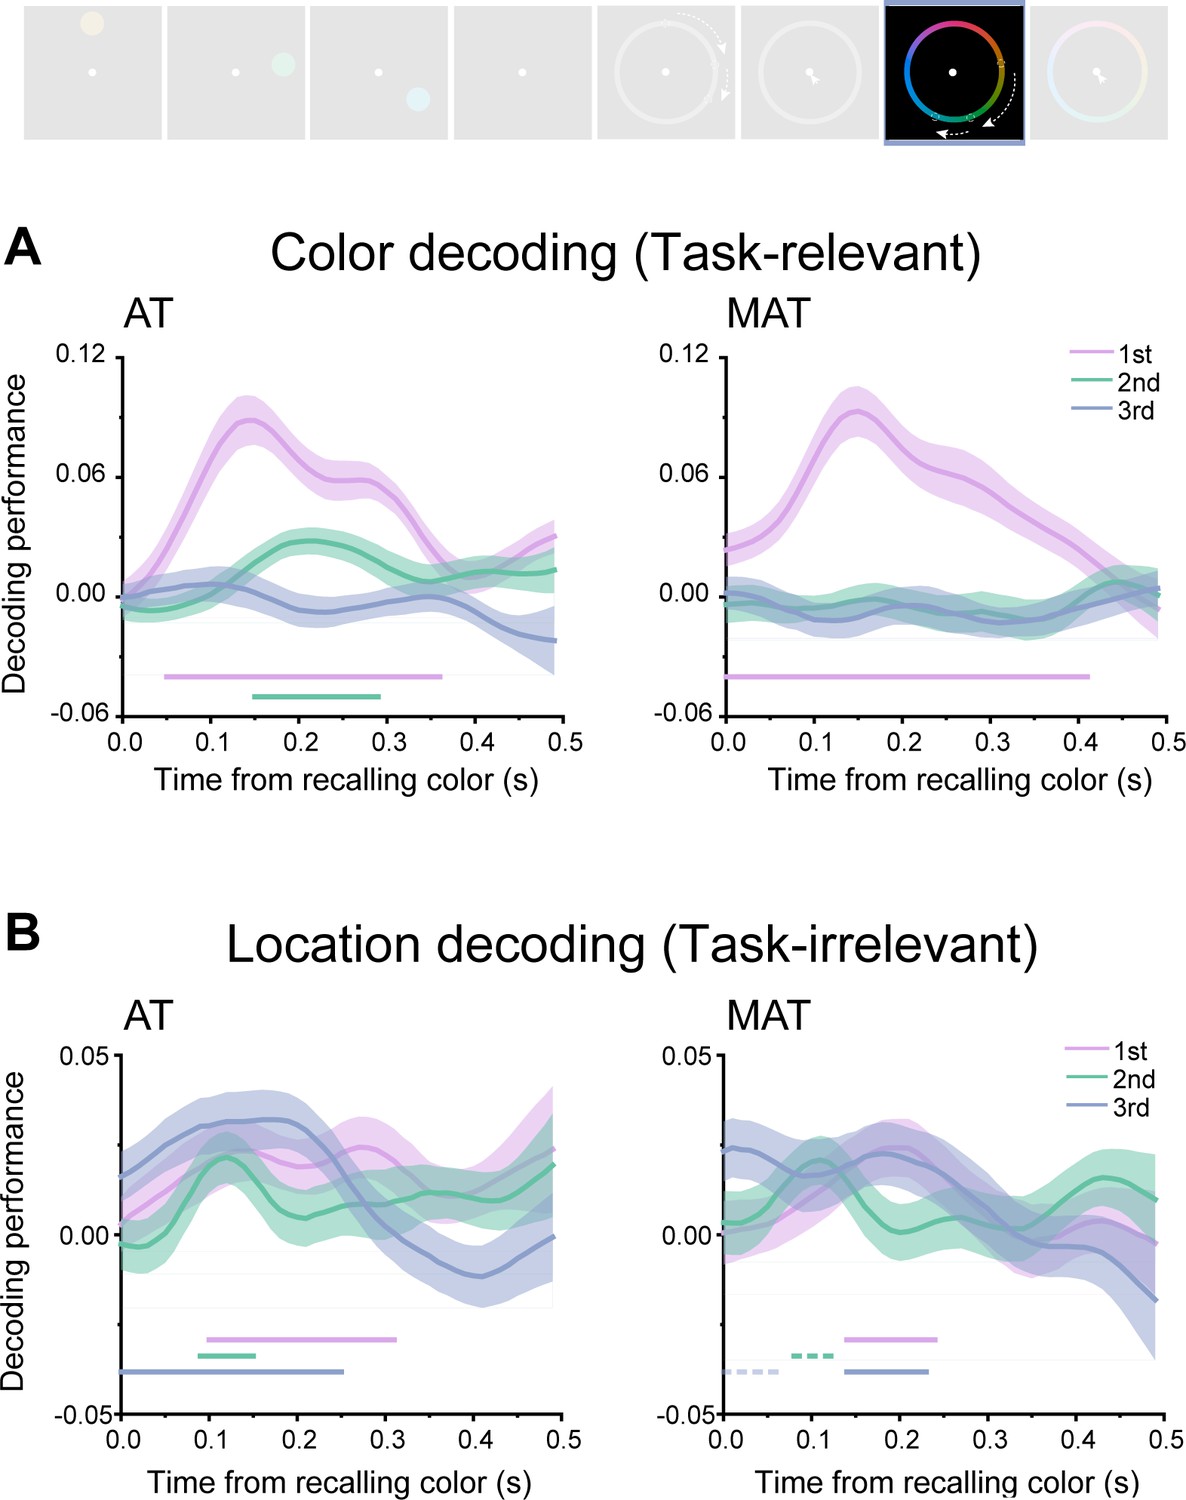
Figure 4—figure supplement 2
Participants were divided into two groups based on the average of trajectory decoding performance within the respective significant time range.
(A) Grand average (mean ± SEM) time courses of the decoding performance for the first, second and third colors during location recalling period for high trajectory representation group. (B) Left panel: theoretical transition pattern for three-item forward replay. Right panel: empirical transitional pattern (actual cross-correlation matrix) at 130 ms time lag defined in Figure 4D. A significant correlation was found between the two matrices (r=0.715, p=0.030), further confirming the forward replay of color sequence for high trajectory representation group. (C) Same as A, but for low trajectory representation group. (D) Same as B, but for low trajectory representation group, nonsignificant correlation between the two matrices was observed (r=0.230, p=0.553). (Horizontal solid line: time window with significnat activation t-test, p<0.05, without correction across time).
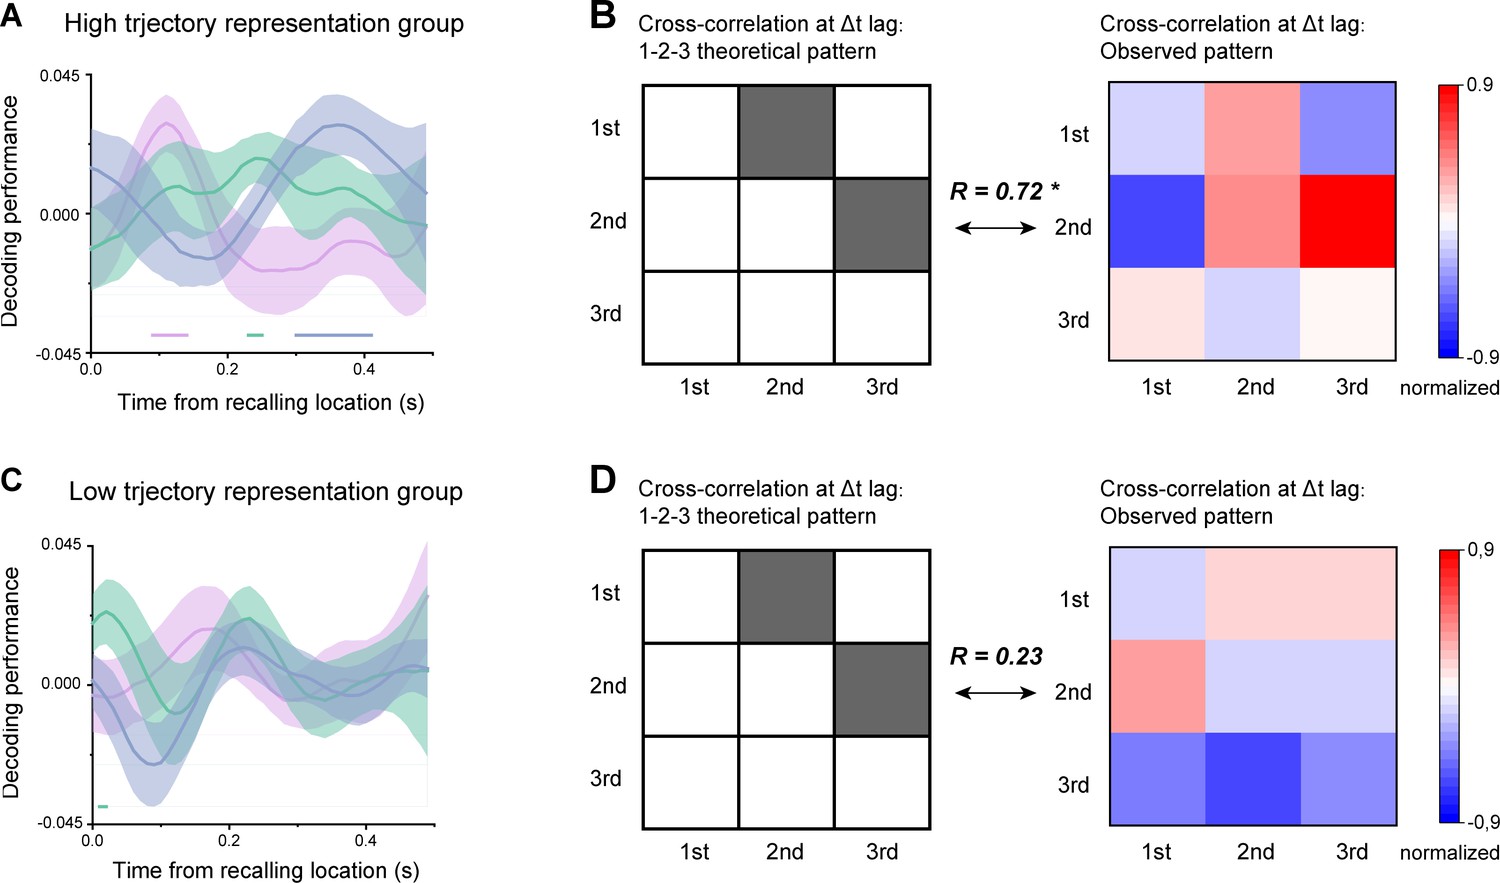
Figure 5 with 1 supplement
Common trajectory representation and its behavioral relevance.
(A) Grand average (mean ± SEM) neural decoding of first-to-second as a function of time during the encoding period, for aligned trajectory (AT) condition. (B) Same as A, but for second-to-third trajectory. (C) Same as A, but for first-to-third trajectory. (D) Participants were divided into two groups (higher-correlation group and lower-correlation group), based on their first-to-second color-location trajectory memory behavioral correlation. Grand average (mean ± SEM) neural decoding of first-to-second trajectory as a function of time, for higher-correlation group (n=16; left panel) and lower-correlation group (n=16; right panel). (Horizontal solid line: cluster-based permutation test, cluster-defining threshold p<0.05, corrected significance level p<0.05; Horizontal dashed line: cluster-based permutation test, cluster-defining threshold p<0.05, corrected significance level p<0.1).
Figure 5—figure supplement 1
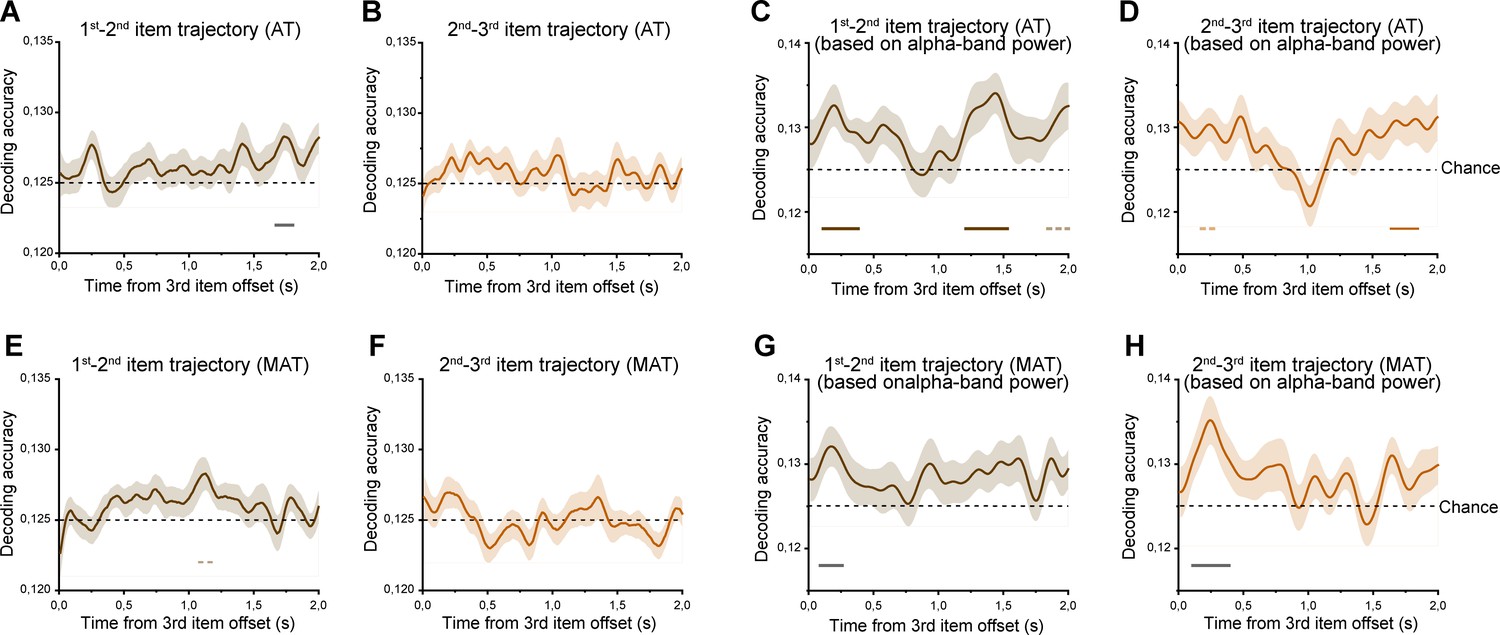
Trajectory representation during memory maintaining period.
(A) Grand average (mean ± SEM) neural decoding of first-to-second as a function of time during maintaining period, for aligned trajectory (AT) condition. Significant reactivation was observed during a relatively late stage of memory maintenanace. (B) Same as A, but for second-to-third trajectory. No significant reactivation was observed. (C, D) Condidering alpha-band power plays a crucial role in holding information during maintaining period, we also applied the same decoding approach on alpha band power during maintaining period. Specifically, we first conducted a time-frequency analysis using Morlet wavelets with a width of seven cycles (Fieldtrip toolbox) and then extracted alpha-band (8–12 Hz) power time courses. A linear support vector machine (SVM) was then employed on alpha-band power. Both first-to-second and second-to-third trajectories showed significant reactivation. (E, F) Same as A, B, but for misaligned trajectory condition. (G, H) Same as CD, but for misaligned trajectory condition. (Horizontal solid line: cluster-based permutation test, cluster-defining threshold p<0.05, corrected significance level p<0.05; Horizontal dashed line: cluster-based permutation test, cluster-defining threshold P<0.05, corrected significance level p<0.1).
Author response image 1
Author response image 2
Additional files
Download links
A two-part list of links to download the article, or parts of the article, in various formats.
Downloads (link to download the article as PDF)
Open citations (links to open the citations from this article in various online reference manager services)
Cite this article (links to download the citations from this article in formats compatible with various reference manager tools)
Shared structure facilitates working memory of multiple sequences
eLife 12:RP93158.
https://doi.org/10.7554/eLife.93158.3


