Metastatic small cell lung cancer arises from TP53/RB1-deficient and MYC overproduction hESC-derived PNECs
- Meyer Cancer Center, Weill Cornell Medicine, United States
- The Pritzker School of Molecular Engineering, The University of Chicago, United States
- The Ben May Department for Cancer Research, The University of Chicago, United States
- Caryl and Israel Englander Institute for Precision Medicine, Weill Cornell Medicine, United States
- Department of Pathology and Laboratory Medicine, Weill Cornell Medicine, United States
- Institute for Computational Biomedicine, Weill Cornell Medicine, United States
Figures
Figure 1
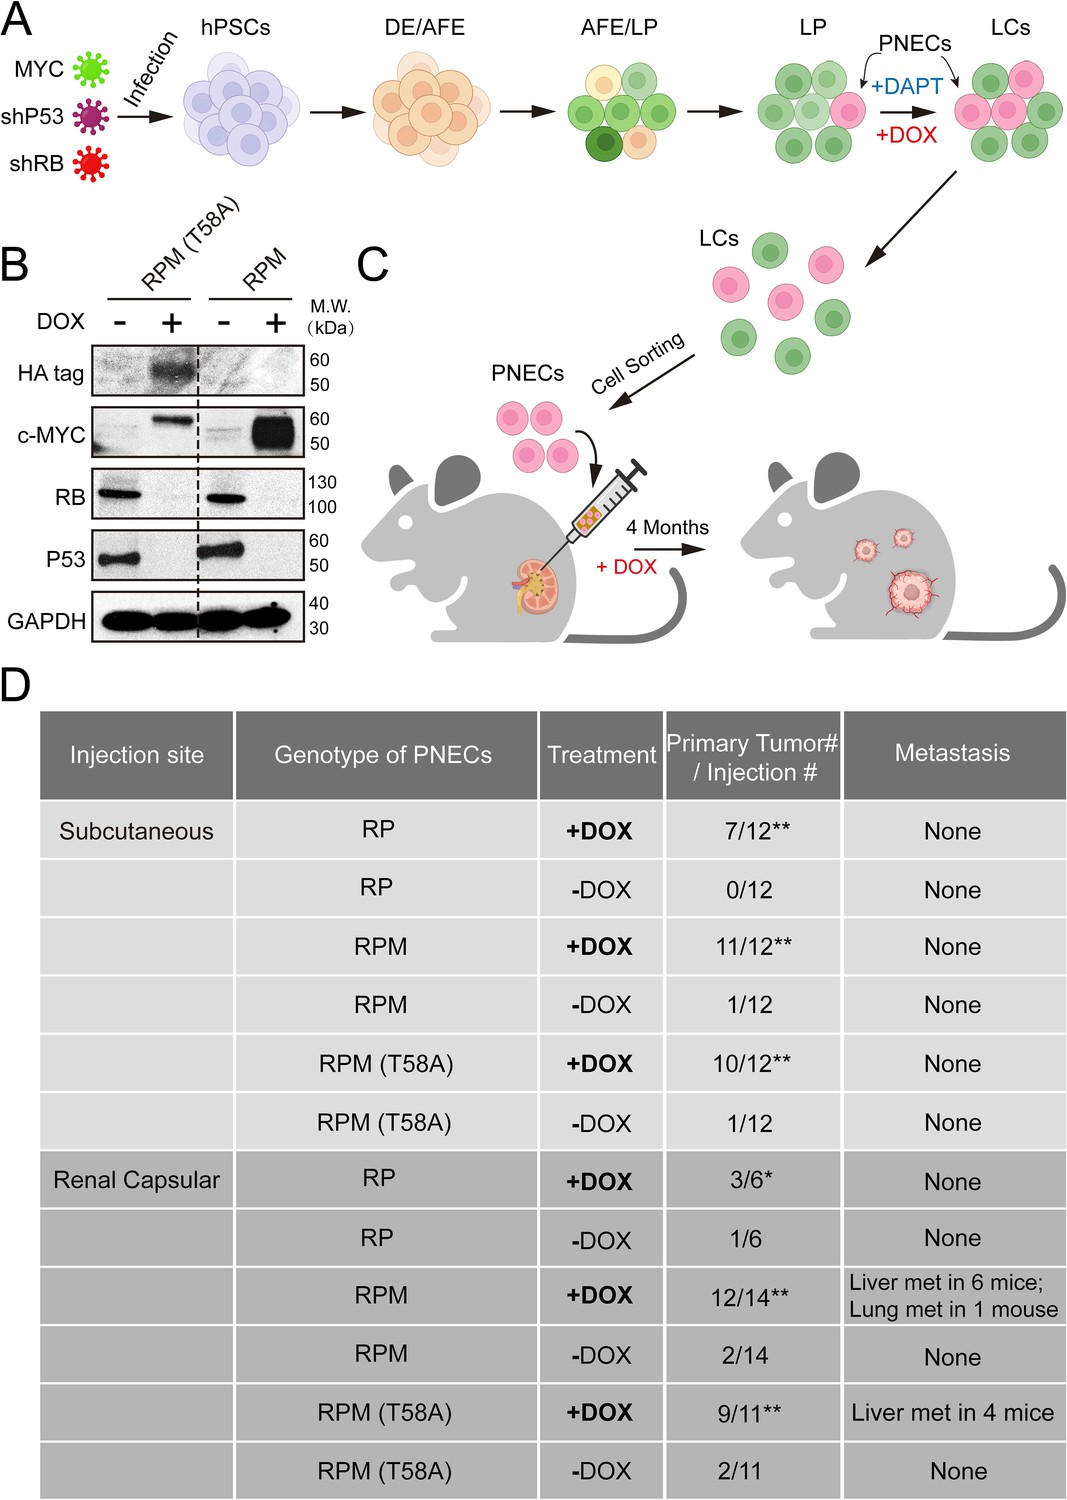
Generation and characterization of human embryonic stem cell (hESC)-derived lung cells and formation of xenografts with RPM cells.
(A) Schematic of the protocol used to generate pulmonary neuroendocrine cells (PNECs) by stepwise differentiation of human pluripotent stem cells (hPSCs) to form: definitive endoderm (DE), day 3; anterior foregut endoderm (AFE), day 6; and lung progenitor cells (LPs) days 15–25. LPs were further differentiated into the types of lung cells (LCs) found in mature human lung parenchyma and airway epithelium, days 25–55. DAPT (10 μM) encourages the formation of PNECs, and addition of doxycycline (1 μM; DOX) induces expression of shRNAs against RB1 and TP53 mRNAs, as well as expression of MYC or MYC (T58A), as described in the text. (B) Western blot of extracts of RUES2 LCs at day 25 of differentiation protocol treated with DOX (1 μM for 72 hr); cells unexposed to DOX served as negative expression controls. Apparent differences in MYC protein levels may be attributable to the HA-tagged version of MYC (T58A), which migrates slightly slower than wild-type MYC protein. (C) Schematic representation of tumorigenesis experiments comparing injection sites (renal capsule or subcutaneous), DOX treatment (+/-DOX diet), and genotypes (see Materials and methods for additional details). Total numbers of animals are six to seven per experimental arm with two injection sites per mouse (right and left flank). Renal capsule injections were performed on a single kidney. Transgenic lines of RUES2 hESCs were differentiated and grown in DAPT (10 μM) from days 25 to 55. At day 55, PNECs were separated from other LCs by sorting for PE+ CGRP-expressing cells (see Materials and methods). PNECs were then injected either subcutaneously or into the renal capsular space in NOG mice, half of which then received DOX in their feed as described in Materials and methods. (D) Table summary of experiments with xenografted mice, indicating the number of animals that developed visible tumors (≥250 mm3 in volume) at the site of injection or the number of visible metastases in the liver or lung. *, p<0.05; **, p<0.01 by Fisher’s test to denote significant differences between mice that did not receive DOX diet. As before, abbreviations for cell lines are: RP = shRB1+shTP53; RPM = shRB1+shTP53+WT MYC; RPM (T58A)=shRB1+shTP53+MYC (T58A).
-
Figure 1—source data 1
Raw data of western blot bands in Figure 1.
- https://cdn.elifesciences.org/articles/93170/elife-93170-fig1-data1-v1.zip
-
Figure 1—source data 2
Raw data of Figure 1.
- https://cdn.elifesciences.org/articles/93170/elife-93170-fig1-data2-v1.zip
Figure 2
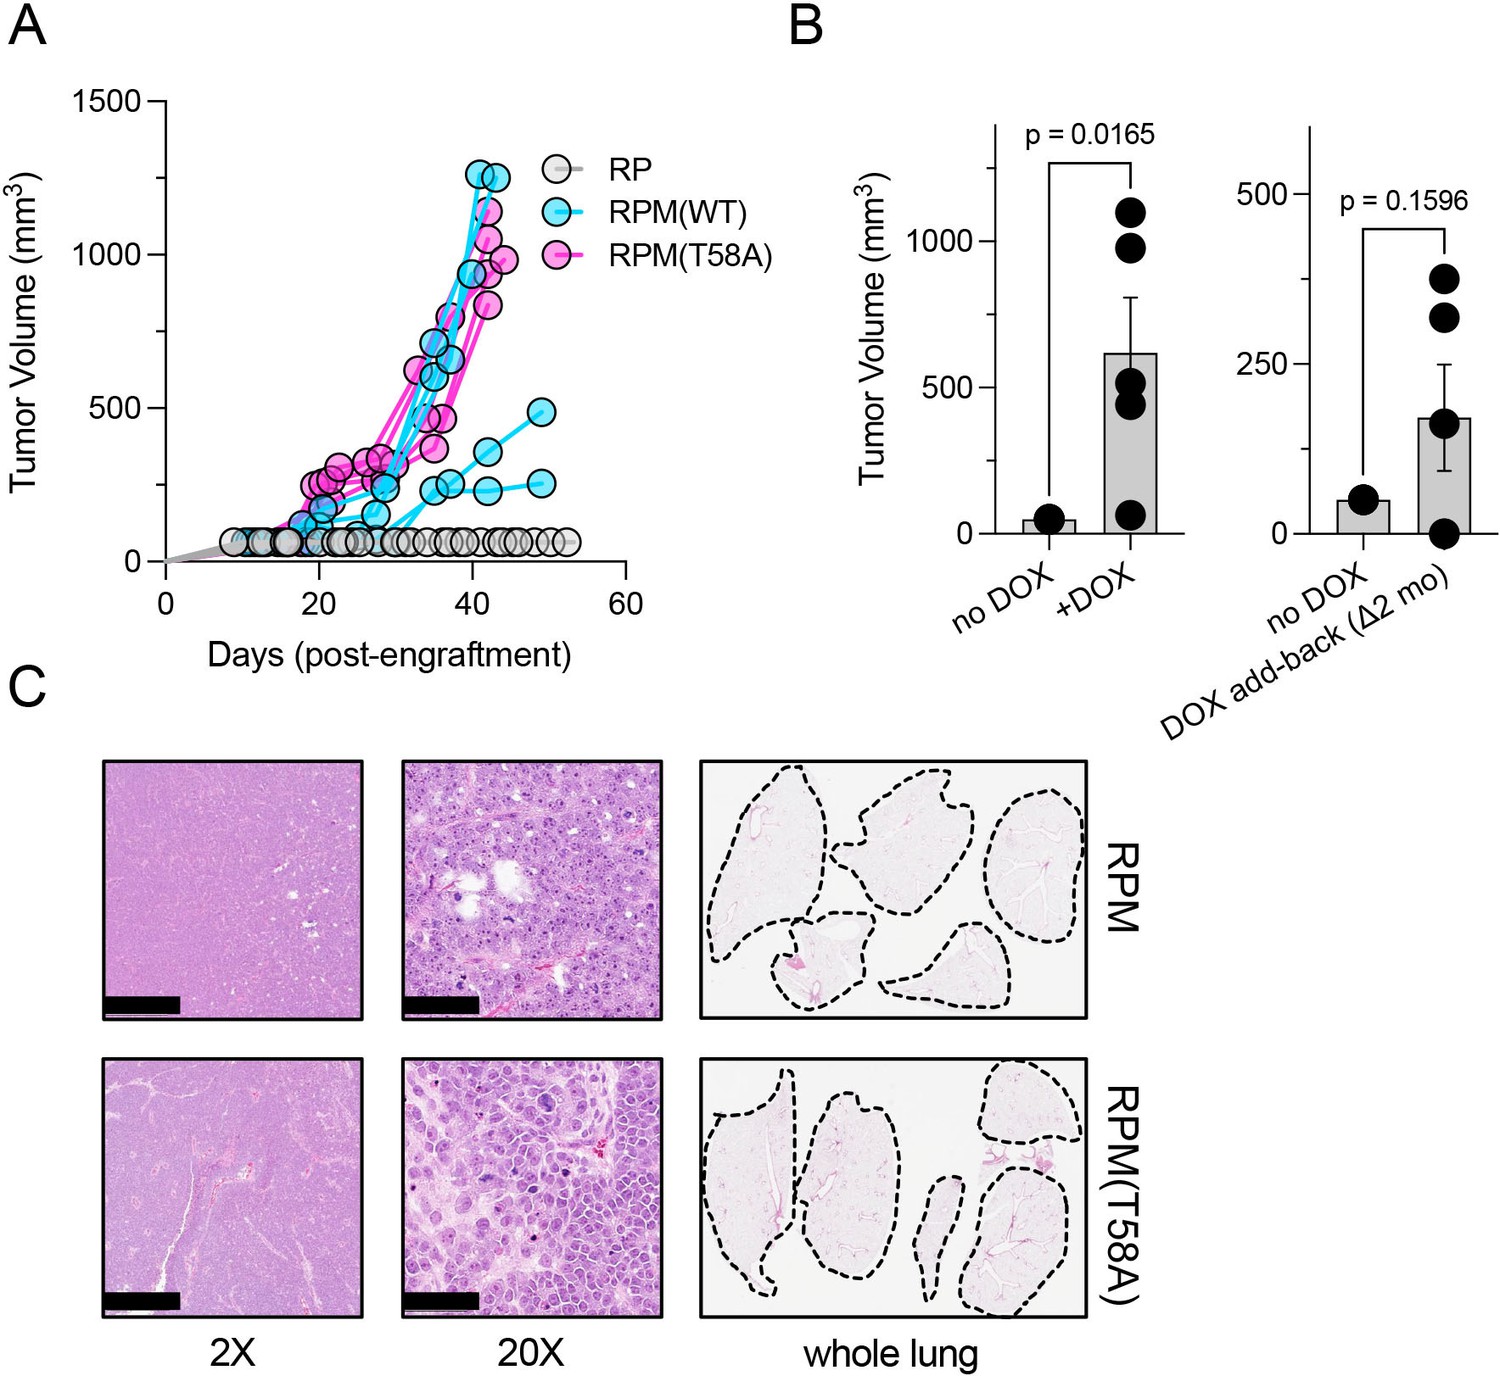
Dox-dependent growth of RUES2-derived RPM and RPM (T58A) subcutaneous tumors.
(A) Subcutaneous engraftment of 106 viable cells at ~day 50 of RUES2 lung differentiation protocol from indicated genotypes. Cells were cultured in the presence of media containing 1 μM doxycycline (DOX) and 10 μM DAPT from days 25 to 55. All immunocompromised mice were maintained on the DOX diet throughout this study; n=5/arm. (B) Left: subcutaneous engraftment of 106 viable RPM tumor cells from the first passage (mouse-to-mouse passage) into immunocompromised mice (NSG) maintained on DOX or normal chow; n=5 animals per arm with single flank engraftments, ± standard error of the mean (SEM). **p<0.05. Right: after 1 month on normal chow, mice were placed on DOX chow (DOX ‘add-back’); tumor volumes were measured 1 month later (2 months on study). Paired t-test p-values are shown for each comparison. (C) Representative H&E tumor histology from RPM or RPM (T58A) engraftments; 2× (scalebar 1 mm) and 20× (scalebar 100 µm). Representative whole lung sagittal sections showed no evidence of gross metastasis from subcutaneous injections inthe flank at study endpoints; n=3 analyzed per genotype. Dashed lines shown for boundaries of lung lobes.
-
Figure 2—source data 1
High resolution source data of Figure 2.
- https://cdn.elifesciences.org/articles/93170/elife-93170-fig2-data1-v1.zip
Figure 3
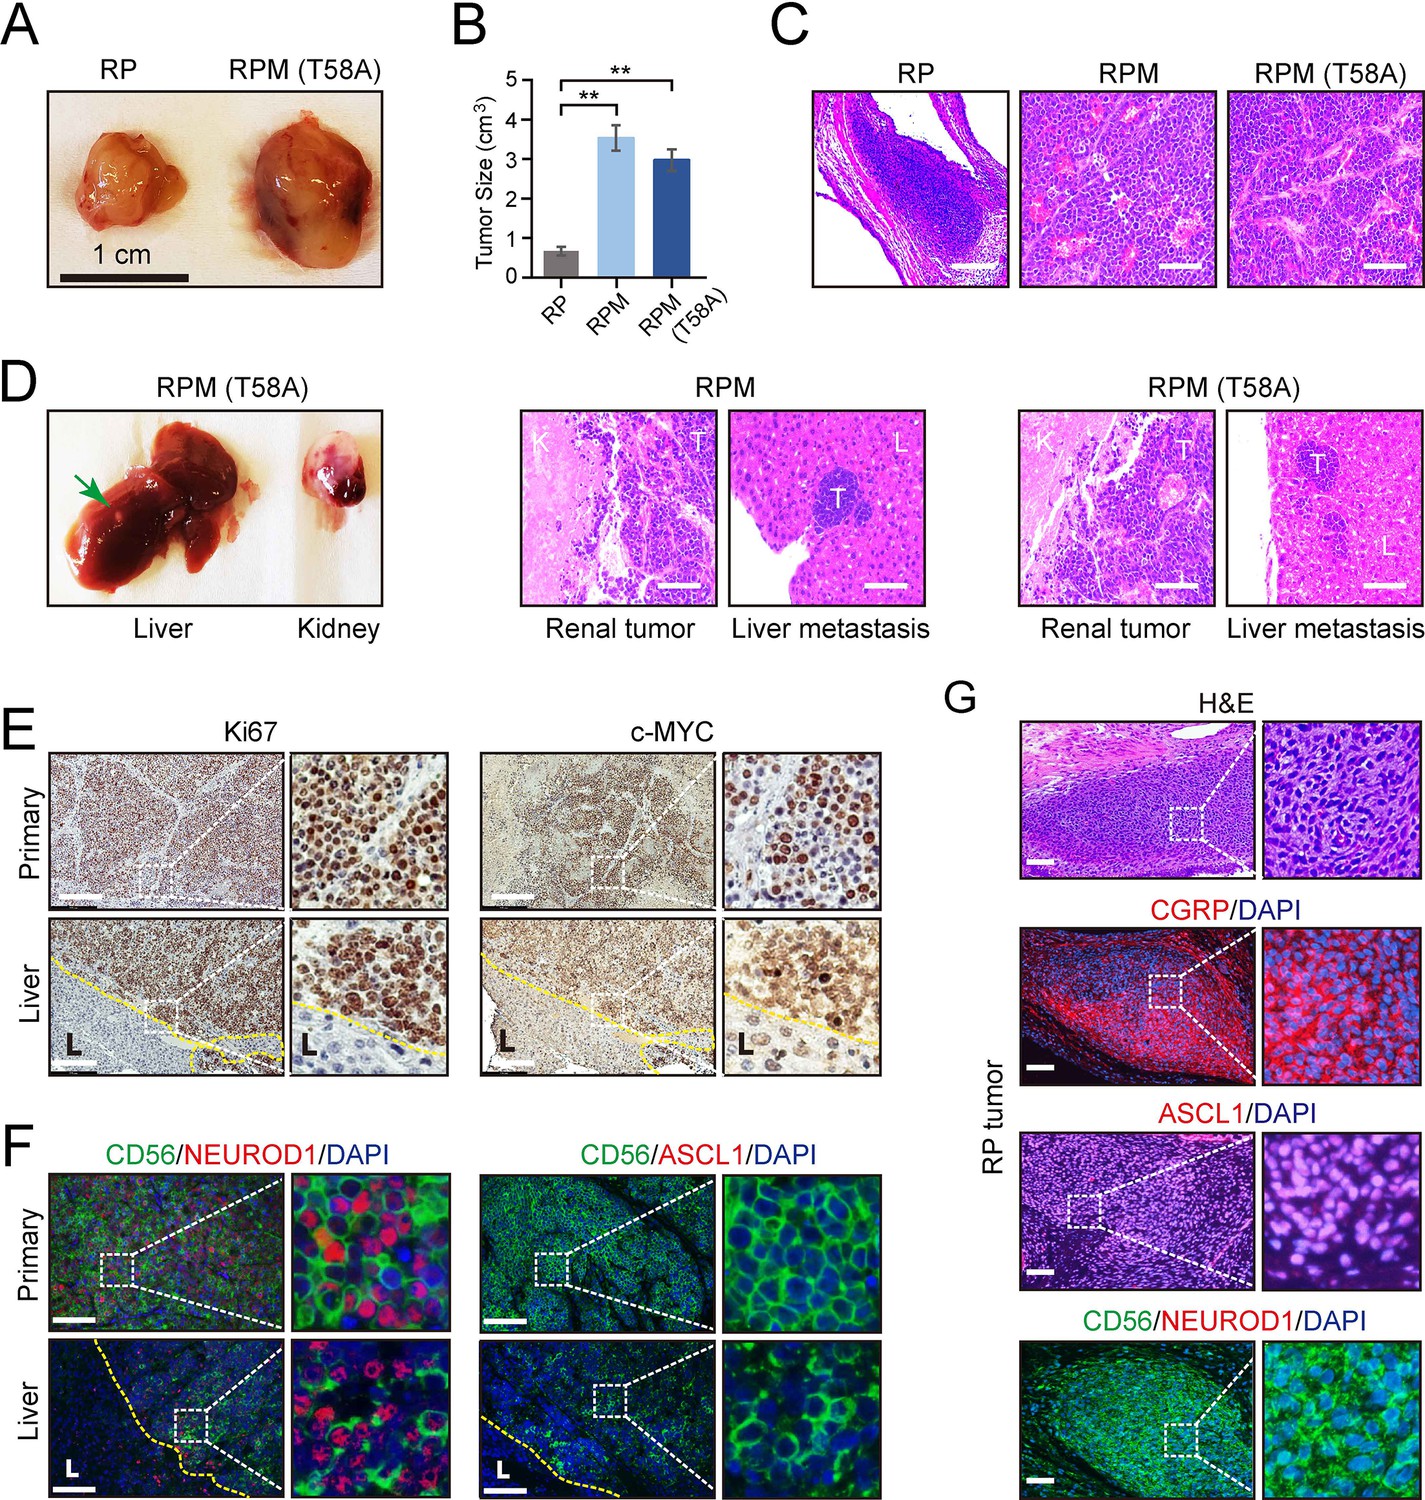
Effects of MYC on the gross and histopathological appearance of xenografts grown in immunodeficient mice fed with doxycycline (DOX) for 3–4 months.
(A) Subcutaneous xenografts formed with human embryonic stem cell (hESC)-derived pulmonary neuroendocrine cells (PNECs) with RP, RPM, or RPM (T58A) genotypes. Photographs of representative tumors formed with cells of the indicated genotypes are shown for RP and RPM; indicated scale of 1 cm. (B) Quantification of the tumor sizes and paired comparisons for a secondary in vivo experiment; n=5 animals per arm with single subcutaneous engraftments; **p<0.01. (C) H&E staining of the indicated tumors from panel B. (D) Gross and histologic pathology of renal capsular xenografts and liver metastases formed with the RPM or RPM (T58A) cells. Left panels, gross appearance of representative tumors within the liver (metastasis) or kidney (primary); right panels, H&E staining of primary and metastatic tumors (T) formed in kidney (K) and liver (L) in the RPM (left) or RPM (T58A) model. (E) Immunostaining of tumor samples from D. Samples of primary peri-renal tumors and hepatic metastases in mice injected with hESC-derived PNECs programmed to reduce levels of TP53 and RB1 mRNA and to express wild-type MYC were stained with antisera for Ki67 (left) or MYC (right). (F) Immunofluorescence staining for neuroendocrine markers ASCL1, NEUROD1, and CD56 from sections in E of the RPM tumors. (G) Immunofluorescence staining for neuroendocrine markers, CGRP, ASCL1, NEUROD1, and CD56 in the RP tumors. H&E staining serves as the bright-field comparison of the indicated tumors.
-
Figure 3—source data 1
High resolution source data of Figure 3.
- https://cdn.elifesciences.org/articles/93170/elife-93170-fig3-data1-v1.zip
Figure 4 with 2 supplements
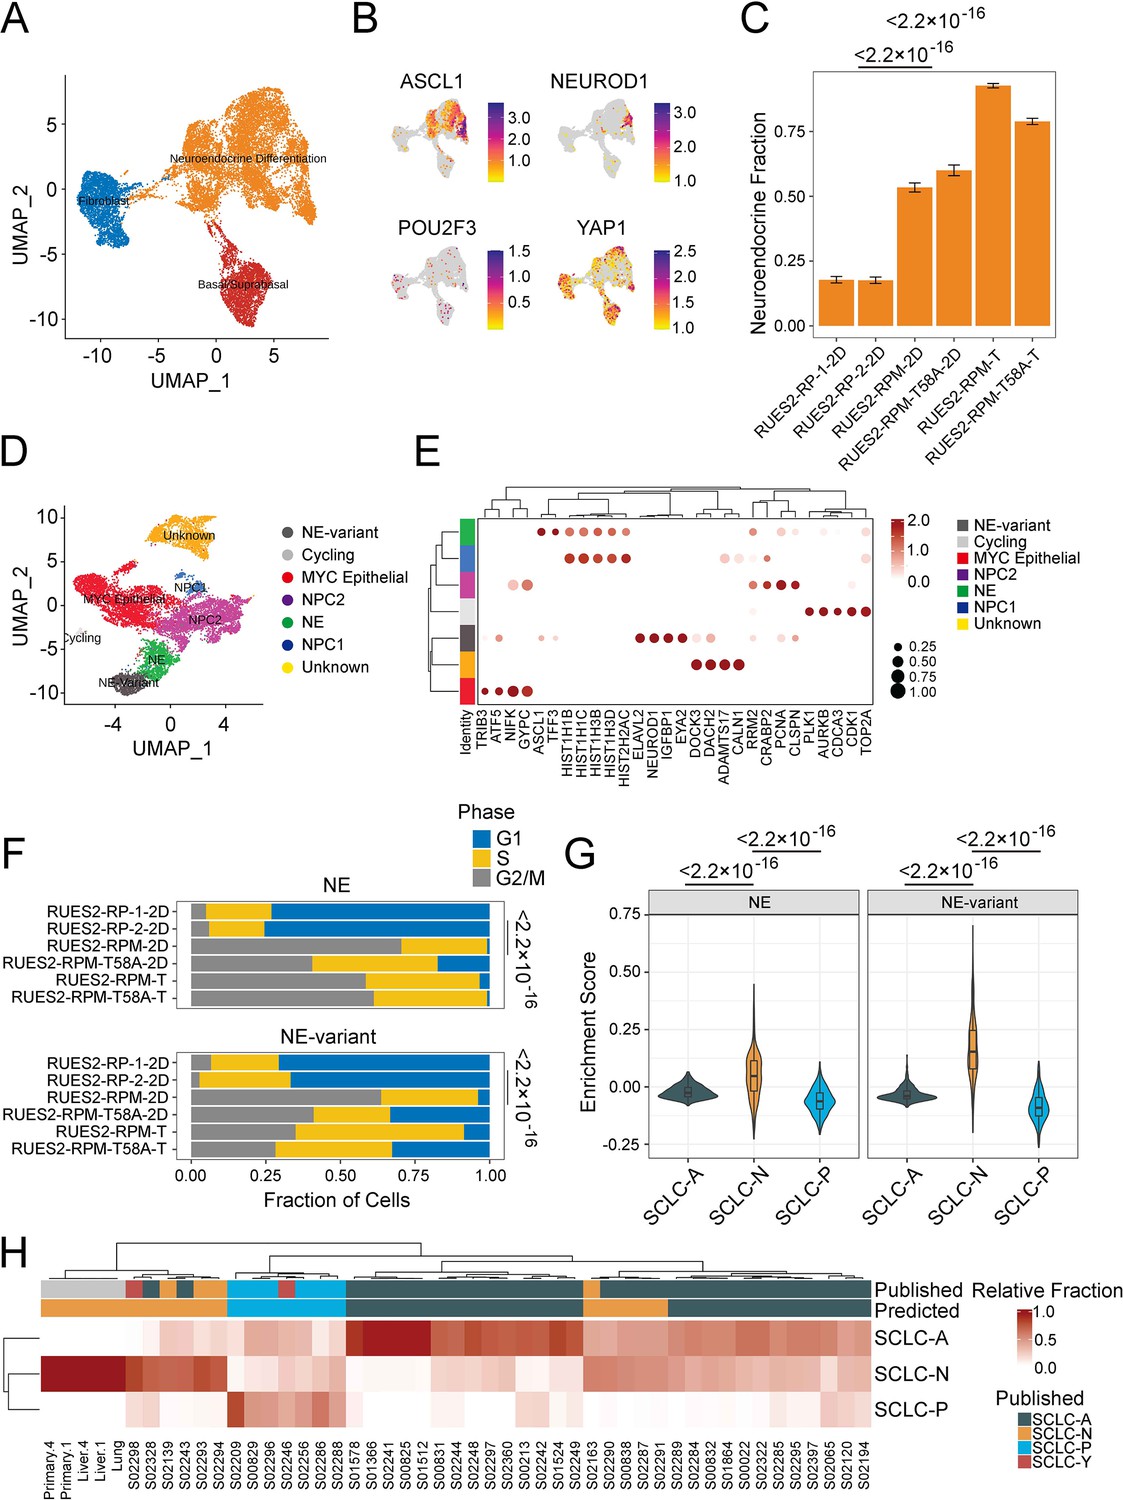
Single-cell and bulk RNA profiling of RUES2-derived RPM tumors and comparison with primary human small cell lung cancer (SCLC).
(A) Uniform Manifold Approximation and Projection (UMAP) of cultured RP samples from Morse et al., 2019, and RPM samples (this study) with three major cellular lineages annotated by color. (B) Expression of SCLC subtype markers across dataset in A. (C) Neuroendocrine fraction of cells by sample ID. (D) Subclustering of the ‘neuroendocrine differentiation’ cluster from A. (E) Dot plot of differential cluster markers in the subclustering analysis from E. (F) Cell cycle evaluation of NE and NE-variant clusters indicated by color and fraction of cells. (G) SCLC subtype enrichment scores from Chan et al., 2021; cluster markers in NE and NE-variant cells from RPM tumors. (H) Bulk RNA-sequencing subtype estimation based on Chan et al., 2021, SCLC subtypes from RPM primary or metastatic tumors as compared to published primary SCLC data. Published labels were obtained from Rudin et al., 2019. Bulk patient RNA-sequencing data (reads per kilobase per million mapped reads [RPKM]) were compared to bulk RNA-sequencing of select RPM tumors and metastatic samples. Primary tumor and liver metastases were obtained from two pairs (animals #1 and #4) of mice engrafted with RUES2-derived RPM tumor cells into the renal capsule and grossly macro-dissected during necropsy.
-
Figure 4—source data 1
High resolution source data of Figure 4.
- https://cdn.elifesciences.org/articles/93170/elife-93170-fig4-data1-v1.zip
Figure 4—figure supplement 1

Gene expression and characterization of RUES2-derived tumors.
(A) EGFP expression across the full dataset integrating RP and RPM cells in addition to RPM tumor cells. (B) Individual sample IDs and relative contribution (weighted; red) to initial clustering distribution for the six sample sets used in this combined analysis. (C) MYC, MYCN, and MYCL expression across the full dataset. (D) Differential gene expression (DEG) between NE-variant and NE cluster. Select genes are called out in red. (E) Select gene set enrichment analysis for top 3 differentially expressed programs between NEUROD1-high (NE-variant) and ASCL1-high (NE) subsets of cells from only RPM tumor cells; shown as normalized enrichment scores (NES). Positive enrichment is greater activation in the NE-variant subset (i.e. the NEUROD1+ subset), whereas negative enrichment is greater in the NE subset. (F) Cellular density of co-expression patterns for ASCL1 and NEUROD1 across the neuroendocrine differentiation subset. (G) Scatter density plot of MYC and NEUROD1 expression across all cells in the neuroendocrine differentiation cluster. (H) Plot of MYC and NEUROD1 expression in bulk expression data derived from RPM tumors; data are shown as log2 of transcripts per million (TPM). (I) Enrichment score for SCLC subtype markers in NE and NE-variant cells from RP cell cultures (2D), demonstrating preferably enrichment of the SCLC-A subtype in the absence of overexpression of a MYC transgene.
-
Figure 4—figure supplement 1—source data 1
MYC family member expression correlates in RUES2-derived RPM tumors.
- https://cdn.elifesciences.org/articles/93170/elife-93170-fig4-figsupp1-data1-v1.zip
Figure 4—figure supplement 2

MYC family member expression correlates in RUES2-derived RPM tumors.
(A) Expression correlation of EGFP for MYC, MYCN, or MYCL1 from the neuroendocrine differentiation cluster identified in Figure 4A. (B) Similar to A, but now for the neuroendocrine differentiation cluster. Scatter plots depict correlation in NE and non-NE clusters. (C) Expression correlation of ASCL1 and MYC in the neuroendocrine differentiation cluster. All sample pools were included in this correlation. Each data point is a single cell. Correlation (R value) and significance (p-value) shown for each individual comparison.
-
Figure 4—figure supplement 2—source data 1
MYC family member expression correlates in RUES2-derived RPM tumors.
- https://cdn.elifesciences.org/articles/93170/elife-93170-fig4-figsupp2-data1-v1.zip
Tables
Key resources table
| Reagent type (species) or resource | Designation | Source or reference | Identifiers | Additional information |
|---|---|---|---|---|
| Cell line (human) | Embryonic stem cell – Rockefeller University Embryonic Stem Cell Line 2 (RUES2) | WiCell Research Institute, Inc | NIH approval number NIH hESC-09-0013, Registration #0013 | Passages 7–10 |
| Cell line (human) | Embryonic stem cell – ES02 (HES2) | WiCell Research Institute, Inc | NIH registry | Passages 3–7 |
| Cell line (mouse) | Mouse embryonic fibroblasts (MEF) | Global Stem | GSC-6001G | – |
| Antibody | Anti-RB1 (Clone 4H1) | Cell Signaling | Cat# 9309 | 1:500 (WB) |
| Antibody | Anti-P53 (Clone DO-1) | Santa Cruz Biotechnology | Cat# Sc-126 | 1:500 (WB) |
| Antibody | Anti-MYC (Clone D84C12) | Cell Signaling | Cat# 5605 | 1:500 (WB) |
| Antibody | Anti-HA (Clone 6E2) | Cell Signaling | Cat# 2367 | 1:500 (WB) |
| Antibody | Anti-CGRP (Clone CD8) | Sigma | Cat# c9487 | 1:150 (IHC/IF) |
| Antibody | Anti-ASCL1 (Clone 2D9) | Sigma | Cat# SAB1403577 | 1:150 (IHC/IF) |
| Antibody | Anti-NCAM1/CD56 | R&D Systems | Cat# AF2408 | 1:150 (IHC/IF) |
| Antibody | Anti-Ki67 (Clone D2H10) | Cell Signaling | Cat# 9027 | 1:150 (IHC/IF) |
| Antibody | Anti-NEUROD1 (Clone 3H8) | Sigma-Aldrich | Cat# WH004760M1 | 1:150 (IHC/IF) |
| Recombinant DNA reagent | pSLIK sh human Rb 1534 hyg (Julien Sage) | Addgene | RRID:Addgene_31500 | TET-inducible RB1 shRNA |
| Recombinant DNA reagent | FUW-tetO-hMYC (Rudolf Jaenisch) | Addgene | RRID:Addgene_20723 | TET-inducible wild-type MYC |
| Recombinant DNA reagent | pLV-tetO-myc T58A (Konrad Hochedlinger) | Addgene | RRID:Addgene_19763 | T58A mutant MYC with 3X-HA tag |
| Chemical compound, drug | Paraformaldehyde | Sigma | P6148 | Fixative |
| Chemical compound, drug | Triton X-100 | Sigma | X-100 | Permeabilization agent |
| Chemical compound, drug | Bovine serum albumin (BSA) | Life Technologies | A9647 | – |
| Chemical compound, drug | Accutase | STEMCELL Technology | 07920 | – |
| Chemical compound, drug | Y-27632 | R&D Systems | 1254 | – |
| Chemical compound, drug | Human BMP4 | R&D Systems | 314-BP-010 | – |
| Chemical compound, drug | Human bFGF | R&D Systems | 233-FB | – |
| Chemical compound, drug | Human Activin A | R&D Systems | 338-AC | – |
| Chemical compound, drug | Dorsomorphin dihydrochloride | Sigma | AMBH2D6FB2F5 | – |
| Chemical compound, drug | SB431542 | R&D Systems | TB1614-GMP | – |
| Chemical compound, drug | IWP2 | Sigma | I0536 | – |
| Chemical compound, drug | CHIR99021 | R&D Systems | 5439-DK | – |
| Chemical compound, drug | Human FGF10 | R&D Systems | Qk003-0050 | – |
| Chemical compound, drug | Human FGF7 | R&D Systems | 251-KG | – |
| Chemical compound, drug | All-trans retinoic acid (ATRA) | Sigma | 554720 | – |
| Chemical compound, drug | Dexamethasone | Sigma | 265005 | – |
| Chemical compound, drug | 8-Bromo-cAMP | Sigma-Aldrich | TA9H9A9A7499 | – |
| Chemical compound, drug | 3,7-Dihydro-1-methyl-3-(2-methylpropyl)-1H-purine-2,6-dione (IBMX) | Sigma-Aldrich | TA9H98DB18B1 | – |
| Chemical compound, drug | DAPT | Sigma-Aldrich | D5942 | – |
| Chemical compound, drug | Monothioglycerol | Sigma | M6145 | |
| Other | mTeSR1 | STEMCELL Technologies | 85850 | hESC maintenance for transduced hESC culture |
| Other | Matrigel | Corning | 354277 | ECM-coated plates for maturation |
| Other | DMEM/F-12 | Gibco | 10565-018 | Medium |
| Other | N2 | Gibco | 17502001 | Supplement |
| Other | B27 | Gibco | 17504044 | Supplement |
| Other | Ascorbic acid | Sigma | 1043003 | |
| Other | GlutaMAX | Life Technologies | 35050061 | Supplement |
| Other | 0.05% Trypsin/0.02% EDTA | Life Technologies | 25300062 | Enzyme |
Additional files
-
MDAR checklist
- https://cdn.elifesciences.org/articles/93170/elife-93170-mdarchecklist1-v1.docx
-
Supplementary file 1
Supplementary tables.
(a) Differentially expressed transcripts used to identify major cell type clusters in single cell RNA-seq data. (b) Differentially expressed transcripts from neuroendocrine component sub-clustering and groupings. (c) Differentially expressed transcripts used to compare NE and NE-variant sub-clustering.
- https://cdn.elifesciences.org/articles/93170/elife-93170-supp1-v1.xlsx
-
Source code 1
Source code file.
- https://cdn.elifesciences.org/articles/93170/elife-93170-code1-v1.zip
Download links
A two-part list of links to download the article, or parts of the article, in various formats.
Downloads (link to download the article as PDF)
Open citations (links to open the citations from this article in various online reference manager services)
Cite this article (links to download the citations from this article in formats compatible with various reference manager tools)
Metastatic small cell lung cancer arises from TP53/RB1-deficient and MYC overproduction hESC-derived PNECs
eLife 13:RP93170.
https://doi.org/10.7554/eLife.93170.3


