Mapping the molecular motions of 5-HT3 serotonin-gated channel by voltage-clamp fluorometry
- Institut Pasteur, Université Paris Cité, CNRS UMR 3571, Channel-Receptors Unit, France
Figures
Figure 1 with 2 supplements
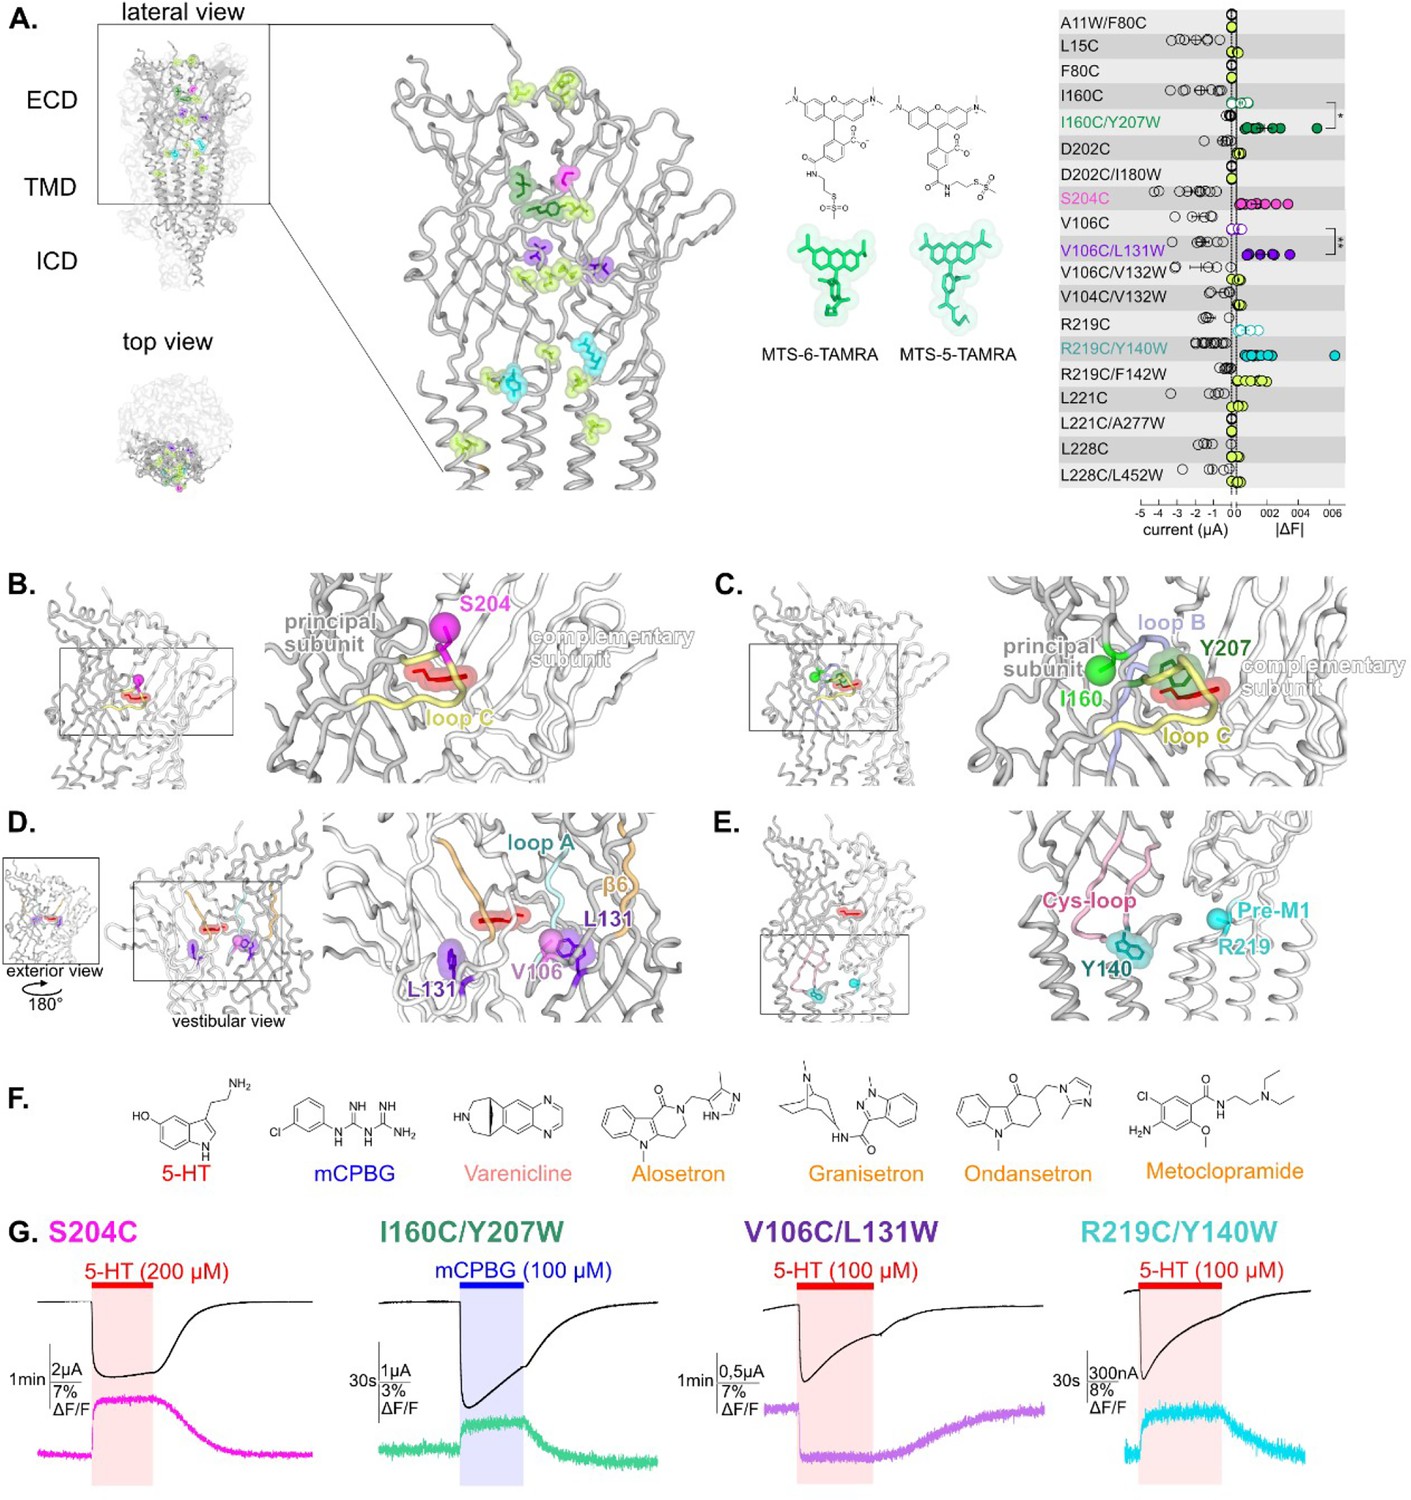
Screening of residues located along the extracellular domain (ECD) of m5-HT3AR as potential anchors for fluorescent probes and establishment of four reporter sensors.
(A) Left panel: visualization of the residues mutated, TAMRA-labeled and tested for variation of current and fluorescence on the apo cryo-electron microscopy (cryo-EM) structure of m5-HT3A (from Basak et al., 2018a), in lateral (zoom on the ECD) and top view with two subunits in cartoon representation and the three others represented in surface mode (PDB: 6BE1). Middle panel: representation of the two isomers of the labeling fluorescent probe mixture used in this study, MTS-TAMRA (5(6)-carboxytetramethylrhodamine methanethiosulfonate). Right panel: representation of currents evoked by 50–100 µM of 5-HT on the mutants and of the absolute values of variation of fluorescence (difference between the baseline fluorescence and steady-state fluorescence upon 5-HT perfusion) recorded simultaneously (error bars are +/- SEM, n = 5 to 13). Note the representation of the four selected sensors: in dark green, I160C/Y207W; in magenta, S204C; in purple, V106C/L131W, and in cyan, R219C/Y140W. (B) The sensor S204C, shown on 5-HT-bound conformation (5-HT represented in red; PDB: 6DG8), is located on loop C. Note that the fluorescence variation is significatively increased by the addition of the tryptophan in the sensors I160C/Y207W and V106C/L131W (unpaired t-tests, I160C/Y207W versus I160C p-value = 0.013 (*); V106C/L131W versus V106C p-value = 0,0081 (**)) (C). The sensor I160C/Y207W where I160C is the point of labeling with MTS-TAMRA and is represented in ball representation in fluorescent green, Y207 is mutated into tryptophan and colored in dark green. (D) The sensor V106C/L131W where V106C is represented in ball representation in purple and L131 is mutated into tryptophan and colored in purple. Note the vestibular positioning of this sensor. (E) The sensor R219C/Y140W, where R219C, located in pre-M1 loop, is represented in ball representation in cyan and Y140, located in the Cys-loop, is mutated into tryptophan, and colored in dark cyan. (F) Molecular structures of the ligands used in this study: agonists (in red, 5-HT; in blue, m-chlorophenylbiguanide [mCPBG]; in salmon, varenicline) and antagonists (all represented in orange, A: alosetron, G: granisetron, O: ondansetron, M: metoclopramide). (G) Effect of desensitization on the dynamic of the fluorescence recordings. Examples of desensitizing currents promoted by prolonged perfusion of strong agonists (to elicit robust desensitization): mCPBG perfused on the sensor I160C/Y207W or 5-HT perfused on the sensors S204C, V106C/L131W, and R219C/Y140W. Traces show that the fluorescent signal remains stable during desensitization for all the sensors. Note that the differences in the desensitization kinetics of the displayed traces are due to the variability of different oocyte batches, since the four conditions do not show significant differences in desensitization kinetics (Figure 1—figure supplement 2, Figure 1—source data 1).
-
Figure 1—source data 1
Source data containing fluorescence values for Figure 1A right panel.
- https://cdn.elifesciences.org/articles/93174/elife-93174-fig1-data1-v1.xlsx
Figure 1—figure supplement 1
Controls.
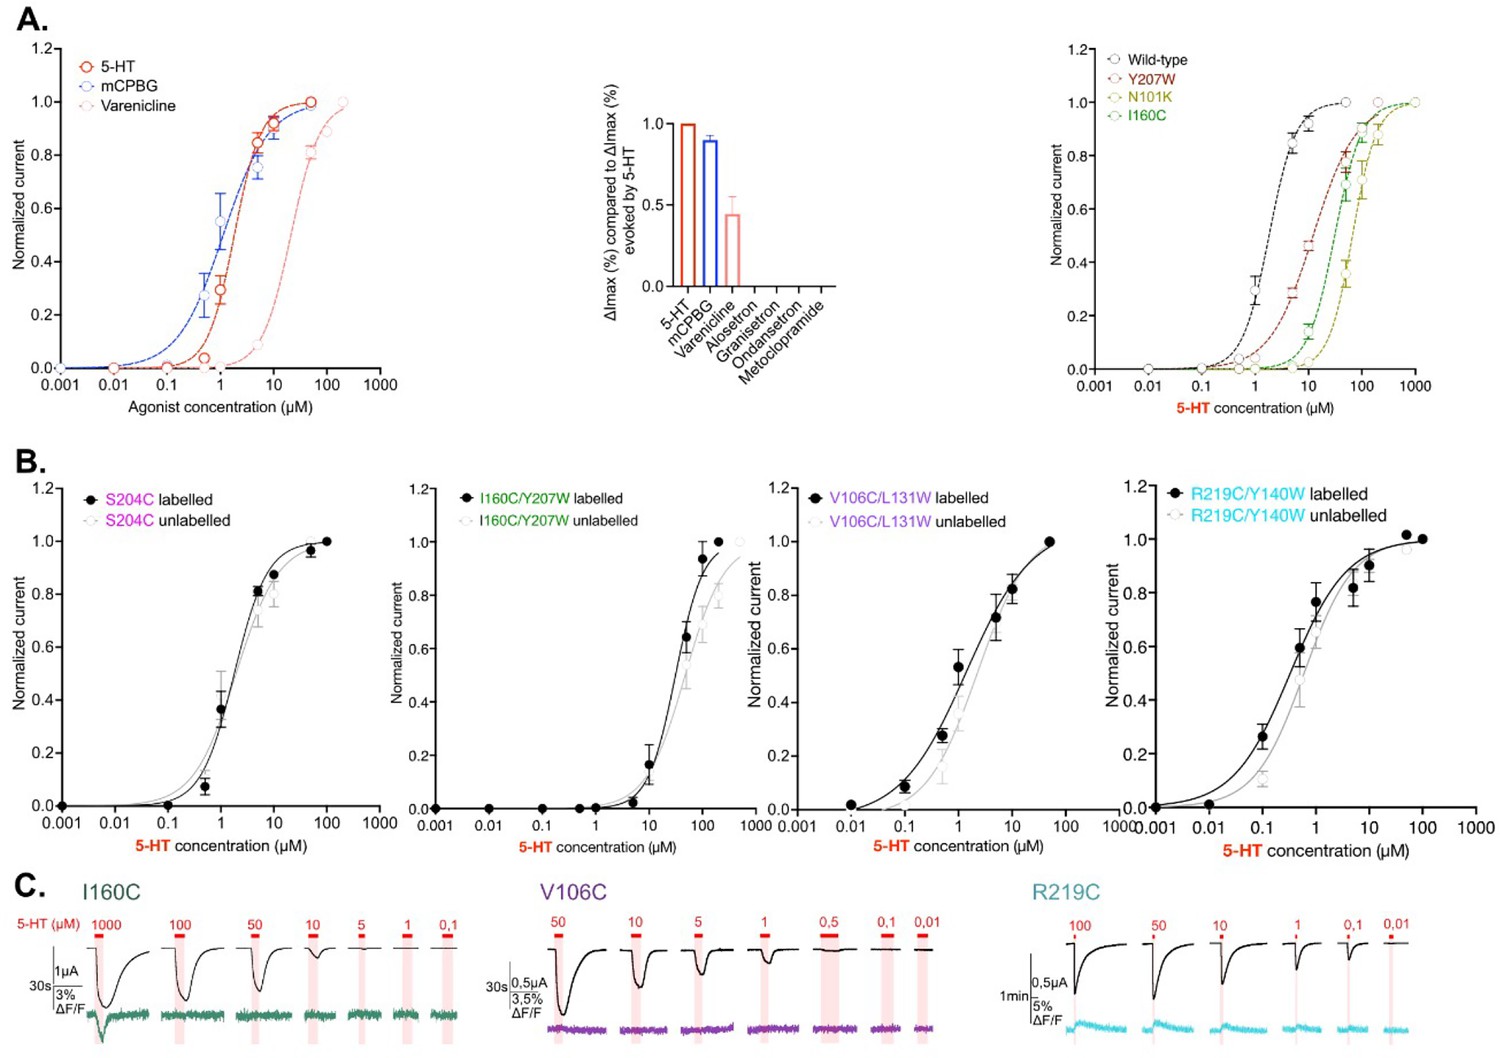
(A) Left panel: wild-type receptor currents dose-response curves for 5-HT (red), m-chlorophenylbiguanide (mCPBG) (blue), and varenicline (salmon) on the voltage-clamp fluorometry (VCF) setup. Middle panel: comparison of maximal current variations evoked by saturating concentrations of 5-HT, mCPBG, varenicline, alosetron, granisetron, ondansetron, and metoclopramide. Values are normalized with the maximal current variations evoked by 5-HT. Left panel: effect of each loss-of-function mutation: Y207W in burgundy, I160C in green, and N101K in khaki. Dose-response curves for 5-HT obtained on the VCF setup. (B) Characterization of the potential effect of MTS-TAMRA labeling on the four sensors developed in this study. Dose-response curves of current with (black curve and dots) and without labeling (gray curve and dots) are shown. (C) Representative recordings of I160C (left, green), V106C (middle, purple), and R219C (right, cyan) labeled with MTS-TAMRA upon different concentrations of 5-HT. Note that on the left panel (I160C), the direct fluorescence quenching evoked by high concentration of 5-HT (1000 μM) is highly visible, which is not the case at lower concentrations. For the entire figure n = 5 to 8 and error bars are representated as +/- SEM. (Figure 1—figure supplement 1—source data 1).
-
Figure 1—figure supplement 1—source data 1
Electrophysiological recordings of wild-type construct upon application of the different agonists and antagonists stated in this study and electrophysiological measurements of the different mutants tested in this study.
- https://cdn.elifesciences.org/articles/93174/elife-93174-fig1-figsupp1-data1-v1.xlsx
Figure 1—figure supplement 2
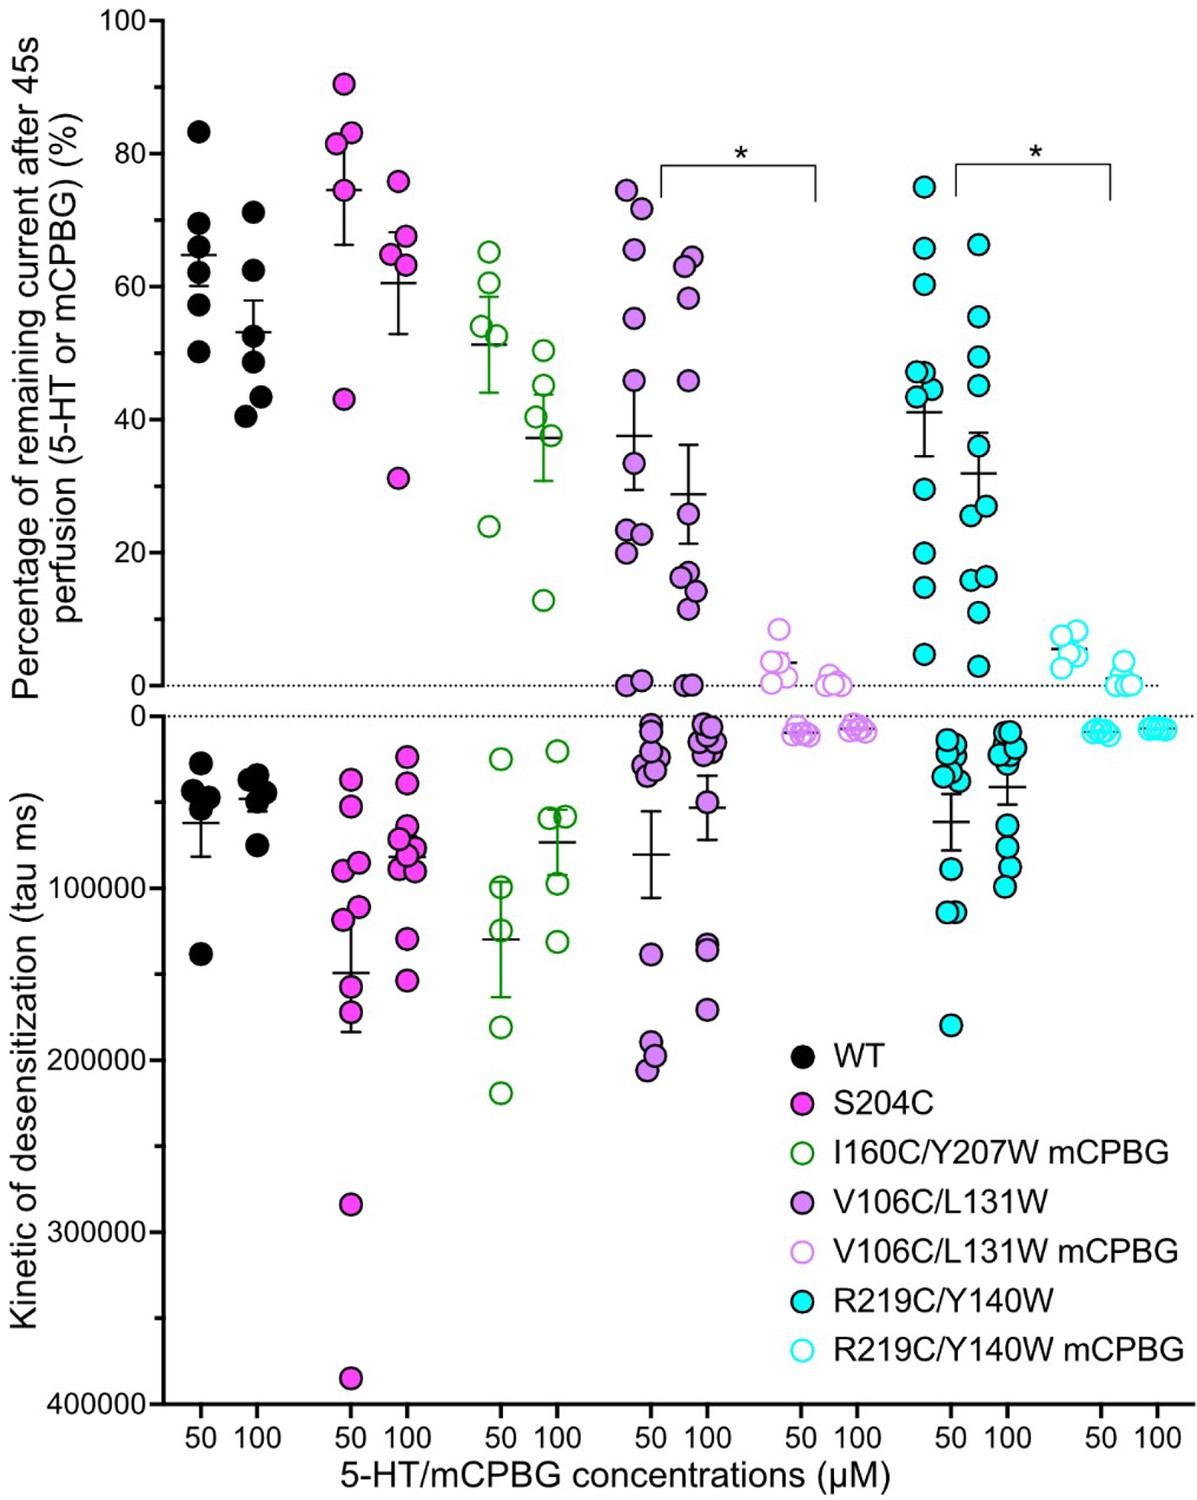
Desensitization properties.
Desensitization properties for the four sensors studied by two-electrode voltage-clamp electrophysiology (TEVC). Top panel: graphical representation of the remaining current recorded after 45 s of constant perfusion of 5-HT (when nothing is mentioned) or m-chlorophenylbiguanide (mCPBG) (see legends on the graph) at 50 and 100 µM. The remaining current (in %) is normalized to the maximum current obtained for each application. Bottom panel: graphical representation of desensitization constants tau obtained by mono-exponential fitting on the desensitization part of the recordings during long application of 5-HT or mCPBG. Note the significative difference between desensitization properties evoked by 5-HT and mCPBG on V106C/L131W and R219C/Y140W (unpaired t-tests). For the entire figure, n = 5 to 11 and error bars are representated as +/- SEM. (Figure 1—figure supplement 2—source data 1).
-
Figure 1—figure supplement 2—source data 1
Tau values and calculated percent of desensitization for the constructs mentioned in this study.
- https://cdn.elifesciences.org/articles/93174/elife-93174-fig1-figsupp2-data1-v1.xlsx
Figure 2
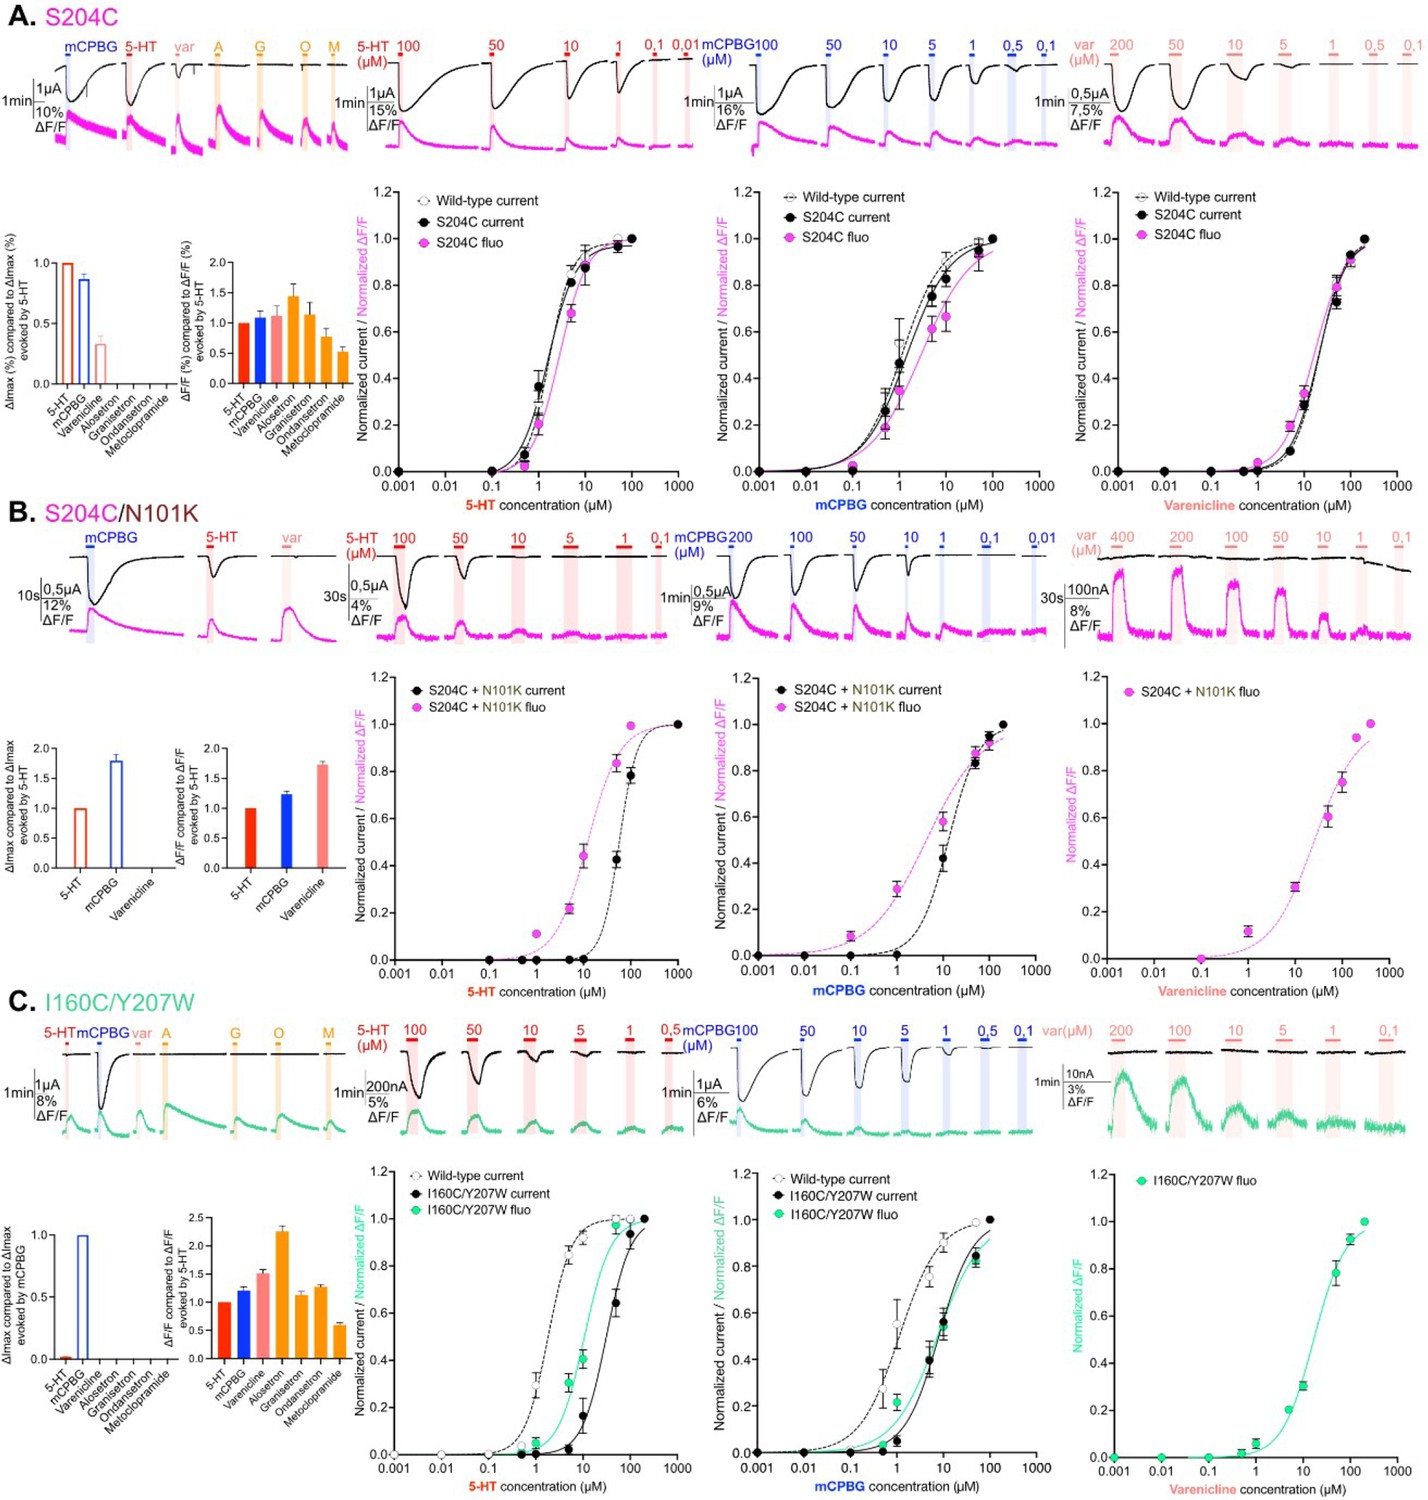
Electrophysiological and fluorescence characterization of S204C and I160C/Y207W, two sensors located in proximity to the ligand-binding site.
(A) Exploration and characterization of the sensor S204C. Left upper panel: macroscopic ligand-gated currents (in black) and fluorescence (in magenta) recorded at –60 mV on S204C labeled with MTS-TAMRA evoked by saturating concentrations of agonists (in red, 5-HT, 200 µM; in blue, m-chlorophenylbiguanide [mCPBG], 200 µM; in salmon, varenicline, 400 µM) and antagonists (all represented in orange, A: alosetron, G: granisetron, O: ondansetron, M: metoclopramide, all at 3 µM). Left bottom panel: graphical representation of ligand-induced relative changes of current and fluorescence compared to 5-HT. The normalized values for all the ligands are compared with the mean values obtained for 5-HT. Middle left top panel: representative recording of current and fluorescence variations of S204C labeled with MTS-TAMRA upon different concentrations of perfused 5-HT. Middle left bottom panel: dose-response curves for ΔI (black) and ΔF (magenta) with mean and SEM (normalized by the maximum current of each oocytes) for application of 5-HT. Middle right top panel: representative recording of current and fluorescence variations of S204C labeled with MTS-TAMRA upon different concentrations of perfused mCPBG. Middle right bottom panel: dose-response curves for ΔI (black) and ΔF (magenta) for application of mCPBG. Right top panel: representative recording of current and fluorescence variations of S204C labeled with MTS-TAMRA upon different concentrations of perfused varenicline. Right bottom panel: dose-response curves for ΔI (black) and ΔF (magenta) for application of varenicline. (B) Effect of loss-of-function mutation N101K on the sensor S204C. Same experiments and legends as for panel A, but the construct here is the sensor S204C with the additional loss-of-function mutation N101K. (C) Exploration and characterization of the sensor I160C/Y207W. Same experiments and legends as for panel A, but here currents are represented in black and fluorescence in green. Note also that for the left lower panel, currents and fluorescence have been compared to mCPBG instead of 5-HT (panels A and B, Figure 2—source data 1; panel C, Figure 2—source data 2). For the entire figure, n are at least 5 and error bars are representated as +/- SEM.
-
Figure 2—source data 1
Electrophysiological and fluorescence measurements of the constructs explored in Figure 2 -1.
- https://cdn.elifesciences.org/articles/93174/elife-93174-fig2-data1-v1.xlsx
-
Figure 2—source data 2
Electrophysiological and fluorescence measurements of the constructs explored in Figure 2 -2.
- https://cdn.elifesciences.org/articles/93174/elife-93174-fig2-data2-v1.xlsx
Figure 3
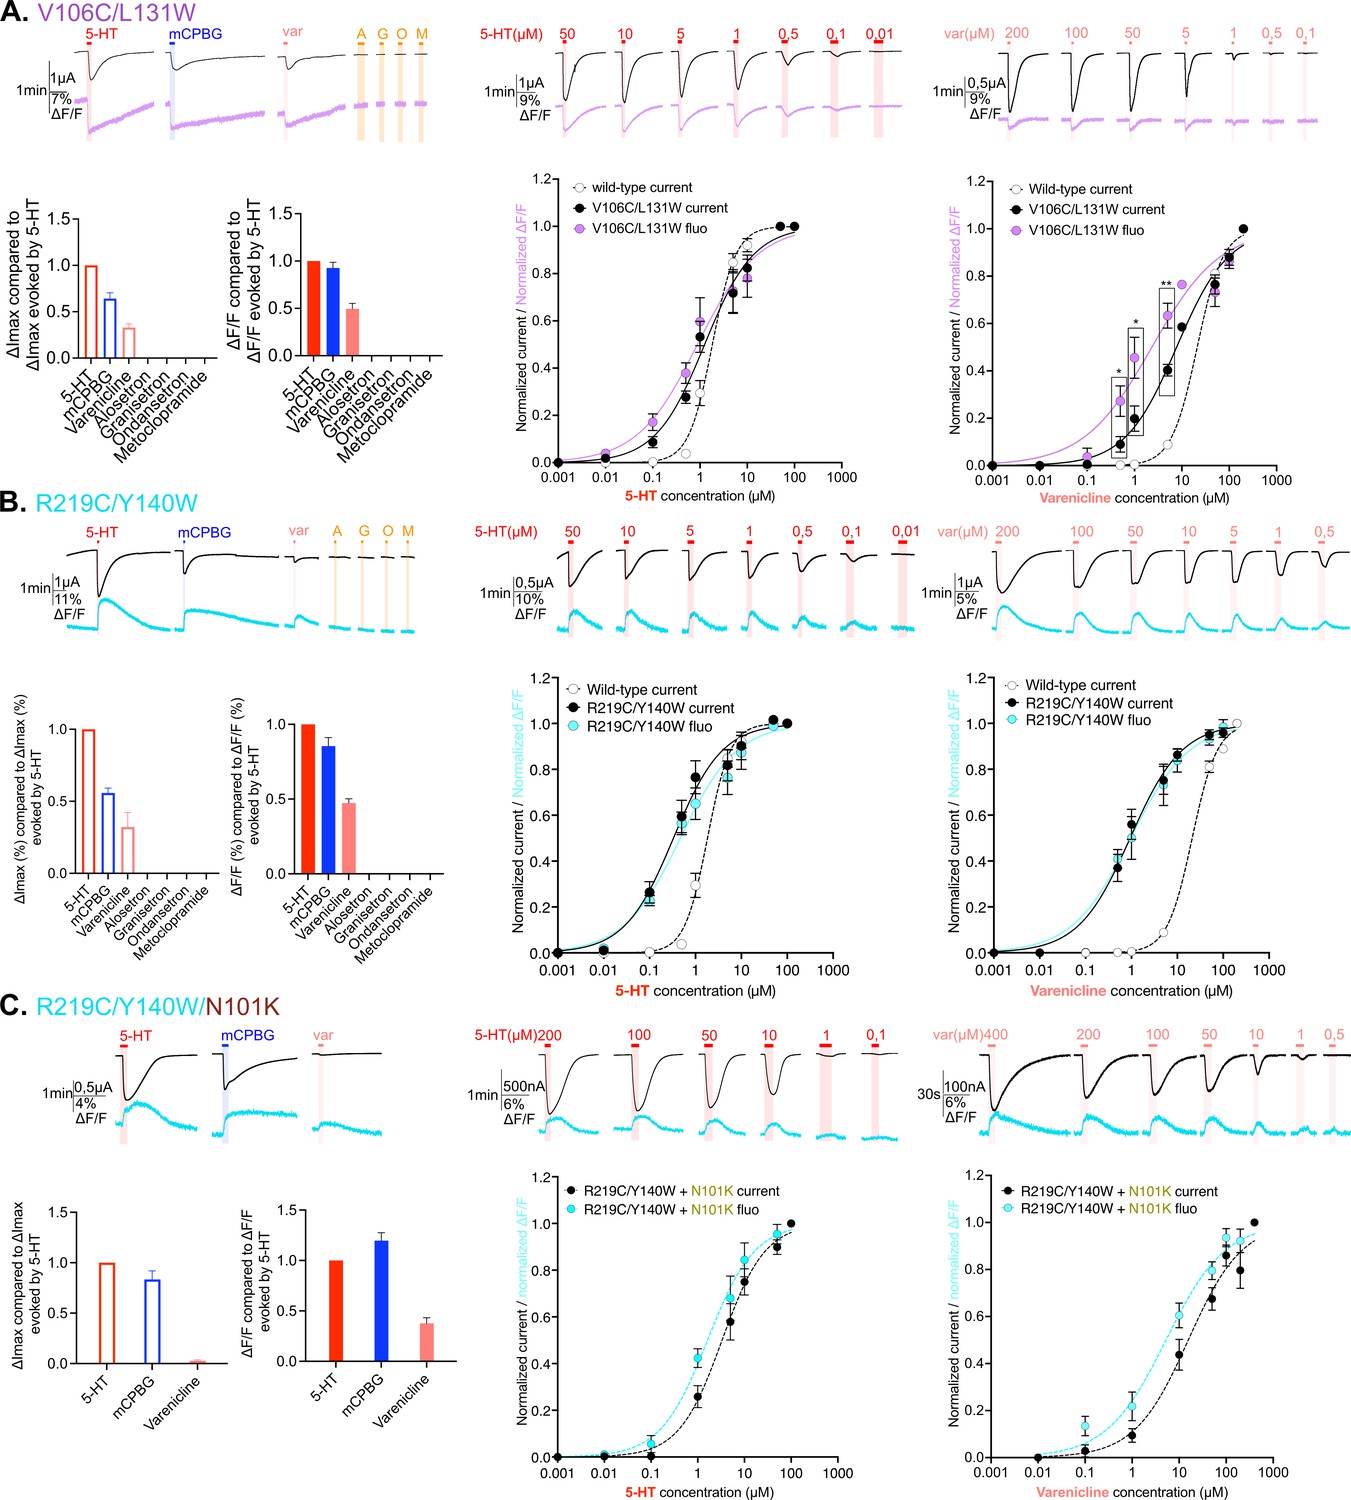
Electrophysiological and fluorescence characterization of V106C/L131W, located in the extracellular vestibular area and R219C/Y140W positioned at the interface area between extracellular domain (ECD) and transmembrane domain (TMD).
(A) Exploration and characterization of the sensor V106C/L131W. Left top panel: macroscopic ligand-gated currents (in black) and fluorescence (in purple) recorded at –60 mV on the construct with the sensor V106C/L131W labeled with MTS-TAMRA evoked by saturating concentrations of agonists (in red, 5-HT; in blue, m-chlorophenylbiguanide [mCPBG]; in salmon, varenicline) and antagonists (all represented in orange, A: alosetron, G: granisetron, O: ondansetron, M: metoclopramide). Left bottom panel: graphical representation of ligand-induced relative changes of current and fluorescence compared to 5-HT. The normalized values for all the ligands are compared with the mean values obtained for 5-HT. Middle top panel: representative recording of current and fluorescence variations of V106C/L131W labeled with MTS-TAMRA upon different concentrations of perfused 5-HT. Middle bottom panel: dose-response curves for ΔI (black) and ΔF (purple) with mean and SEM (normalized by the maximum current of each oocyte) for application of 5-HT. Right top panel: representative recording of current and fluorescence variations of V106C/L131W labeled with MTS-TAMRA upon different concentrations of perfused varenicline. Right bottom panel: dose-response curves for ΔI (black) and ΔF (magenta) with mean and SEM (normalized by the maximum current of each oocyte) for application of varenicline. Note the significative difference between dose response of current and fluorescence at 0.5, 1, and 5 µM of perfused varenicline (unpaired t-test). (B) Exploration and characterization of the sensor R219C/Y140W. Same experiments and legends as for panel A, but the construct here is the sensor R219C/Y140W, current is represented in black and fluorescence in cyan (in trace recordings and dose-response representations). (C) Effect of loss-of-function mutation N101K on the sensor R219C/Y140W. Same experiments and legends as for the panel A, but the construct here is the sensor R219C/Y140W with the additional loss-of-function mutation N101K, current is represented in black and fluorescence in cyan (in trace recordings and dose-response representations) (panel A, Figure 3—source data 1; panels B and C, Figure 3—source data 2). For the entire figure, n are at least 5 and error bars are representated as +/- SEM.
-
Figure 3—source data 1
Electrophysiological and fluorescence measurements of the constructs explored in Figure 3 -1.
- https://cdn.elifesciences.org/articles/93174/elife-93174-fig3-data1-v1.xlsx
-
Figure 3—source data 2
Electrophysiological and fluorescence measurements of the constructs explored in Figure 3 -2.
- https://cdn.elifesciences.org/articles/93174/elife-93174-fig3-data2-v1.xlsx
Figure 4 with 1 supplement
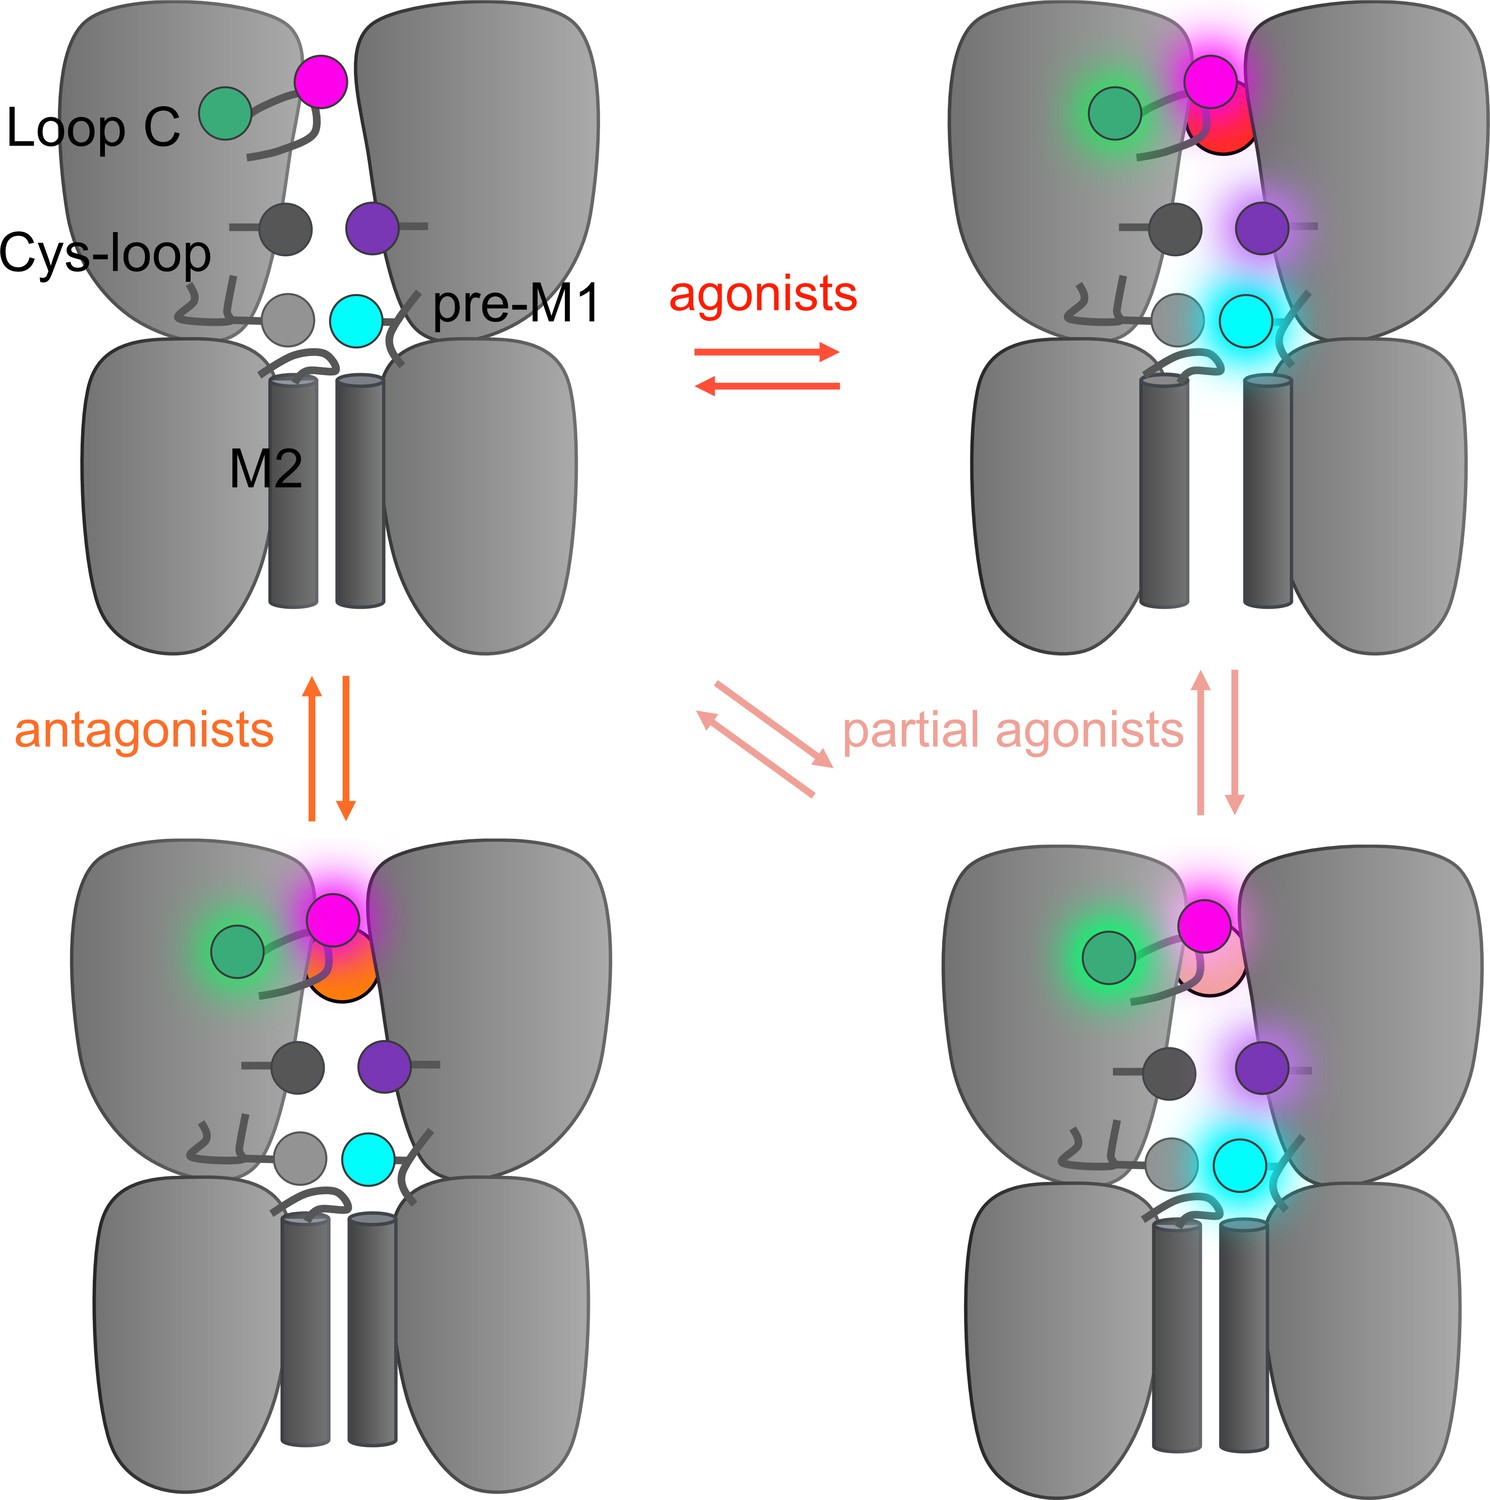
Hypothetical integrative model of voltage-clamp fluorometry (VCF) data.
Schematic representation of the 5-HT3R representing two subunits in side-view with the orthosteric site and ion channel M2 helices highlighted. The four fluorescent sensors are represented as hexagons following the color code of Figure 1 (S204C in magenta, I160C/Y207W in green, V106C/L131W in purple, R219C/Y140W in cyan). Ligand-elicited fluorescence changes are represented as a light halo. VCF data identifies four different conformations whose fluorescence patterns match known high-resolution structures. These conformations are called resting (matching apo structures, PDB 4PIR, 6BE1, 6H5B, 6Y59), inhibited (matching setron-bound structures, PDB 6HIS, 6W1J, 6W1M, 6W1Y, 6Y1Z), intermediate (matching I1 and state 1, PDB 6HIO, 6DG7), and active (matching F, state 2, and open, PDB 6HIN, 6DG8, 6Y5A).
Figure 4—figure supplement 1
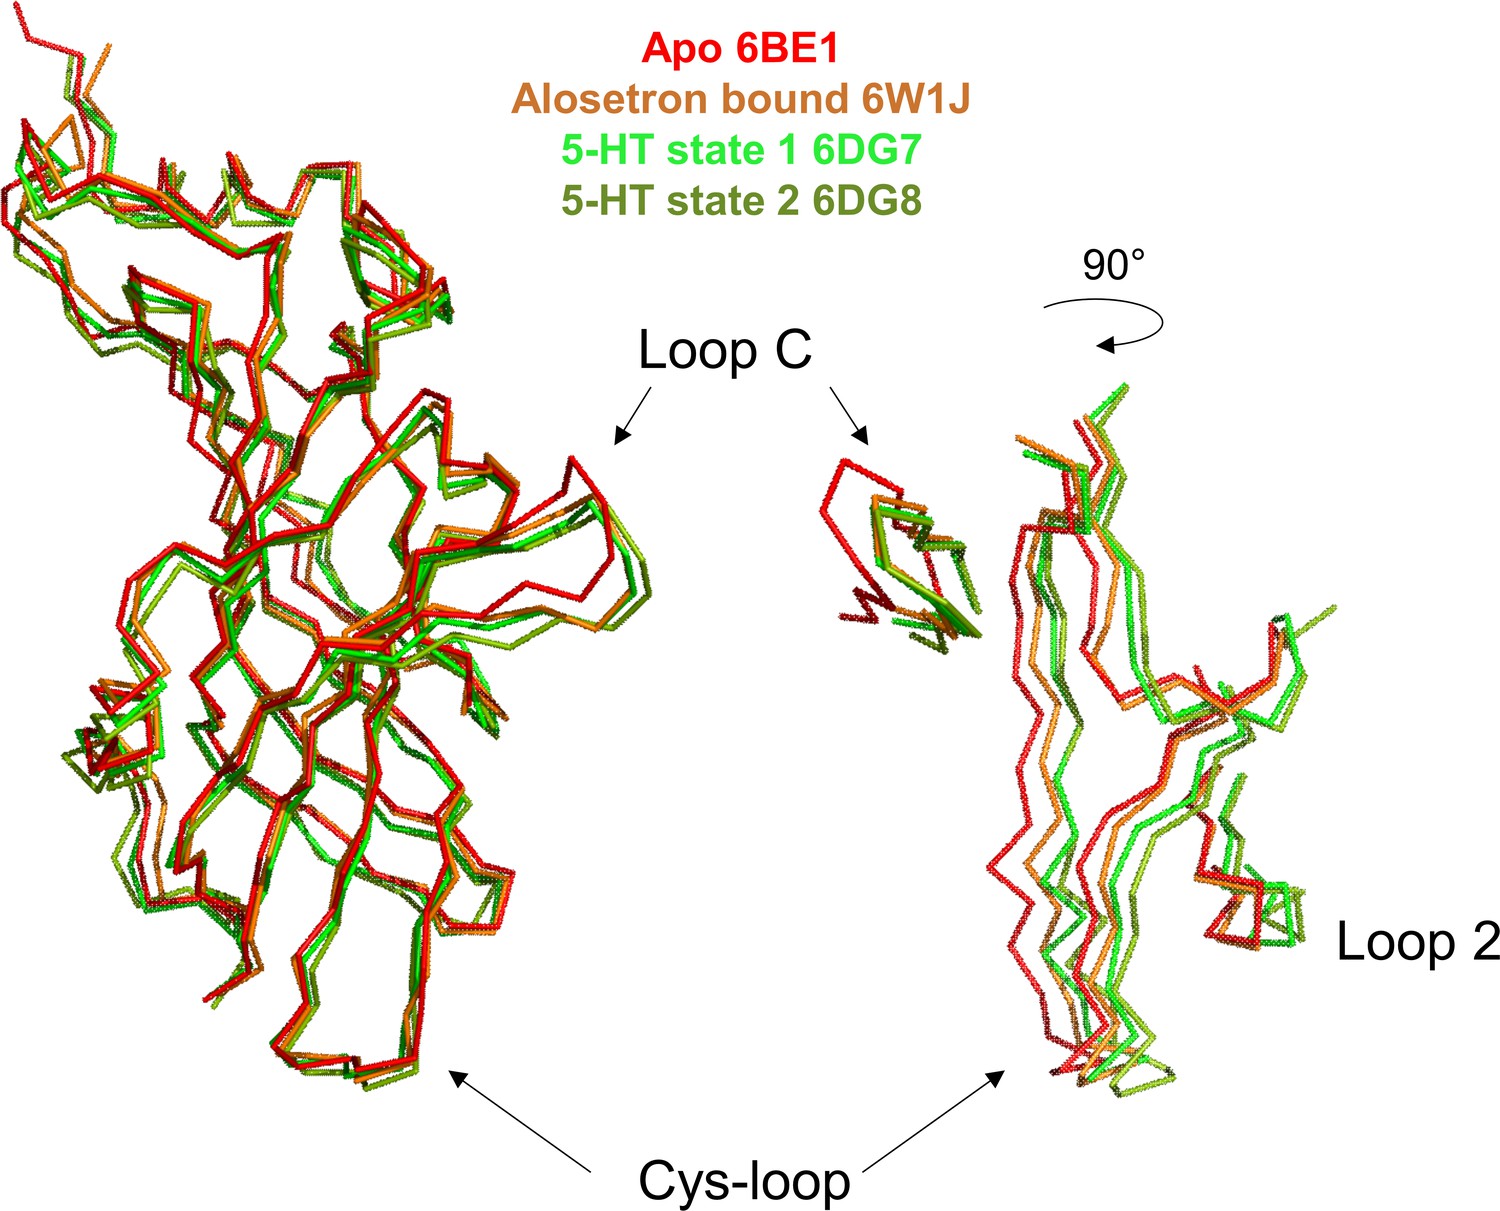
Structural comparison of representative cryo-electron microscopy (cryo-EM) structures.
Superimposition of 5-HT3R structures in apo, alosetron-bound, 5-HT-bound state 1 (closed channel) and state 2 (open channel). On the pentamers, structures are superimposed at the level of the extracellular domain (ECD) of the subunit adjacent to the one shown (chain B) (the so-called complementary subunit facing loop C, chain A). The superimposition highlights that Alo and 5-HT equally promote the capping of loop C, but that Alo binding is associated with weak reorganization of the lower part of the ECD especially at the level of the Cys-loop and loop 2 near the ECD-transmembrane domain (TMD) interface. In contrast, both 5-HT-bound states show a similar reorganization regardless of whether the channel being open or closed.
Tables
Table 1
EC50 values for current (EC50c) and fluorescence (EC50f) responses to agonists (5-HT, m-chlorophenylbiguanide [mCPBG], varenicline) at labeled and unlabeled m5-HT3A mutants.
The top part of the table represents the characterization of the sensors with different ligands and the associated controls (rows 1–13) and the second part the additional allosteric mutations added (rows 14–16).
| Construct | Molecule | EC50c (µM) ± SEM | nHillc ± SEM | EC50f (µM) ± SEM | nHillf ± SEM | n |
|---|---|---|---|---|---|---|
| Wild-type (WT) | 5-HT | 1.83±0.12 | 1.74±0.13 | / | / | 8 |
| mCPBG | 1.13±0.15 | 1.02±0.14 | / | / | 6 | |
| Varenicline | 21.09±1.03 | 1.595±0.07 | / | / | 5 | |
| WT+MTS-TAMRA | 5-HT | 3.43±0.24 | 1.98±0.12 | / | / | 5 |
| I160C/Y207W+MTS-TAMRA | 5-HT | 31.22±2.76 | 1.69±0.18 | 10.73±0.62 | 1.56±0.14 | 7 |
| mCPBG | 7.99±0.58 | 1.19±0.105 | 7.46±0.755 | 0.92±0.08 | 8 | |
| Varenicline | No current | / | 16.80±0.76 | 1.29±0.06 | 7 | |
| I160C/Y207W unlabeled | 5-HT | 47.33±4.72 | 1.19±0.135 | / | / | 6 |
| mCPBG | 2.73±0.17 | 1.59±0.11 | / | / | 8 | |
| Varenicline | No current | / | / | / | / | |
| I160C+MTS-TAMRA | 5-HT | 31.01±1.64 | 1.73±0.11 | / | / | 5 |
| S204C+MTS-TAMRA | 5-HT | 1.78±0.13 | 1.39±0.11 | 2.86±0.248 | 1.51±0.14 | 6 |
| mCPBG | 1.45±0.18 | 0.94±0.10 | 2.90±0.40 | 0.80±0.08 | 6 | |
| Varenicline | 20.67±0.705 | 1.48±0.05 | 16.31±0.78 | 1.29±0.06 | 7 | |
| S204C unlabeled | 5-HT | 1.93±0.25 | 1.08±0.12 | / | / | 6 |
| mCPBG | 0.54±0.02 | 1.94±0.16 | / | / | 6 | |
| Varenicline | 17.105±1.12 | 1.385±0.07 | / | / | 7 | |
| V106C/L131W+MTS-TAMRA | 5-HT | 1.25±0.155 | 0.84±0.08 | 0.88±0.16 | 0.68±0.08 | 5 |
| Varenicline | 7.745±0.775 | 0.80±0.05 | 2.33±0.45 | 0.60±0.06 | 5 | |
| V106C/L131W unlabeled | 5-HT | 1.91±017 | 0.99±0.07 | / | / | 9 |
| Varenicline | 6.06±0.32 | 1.47±0.12 | / | / | 5 | |
| V106C+MTS-TAMRA | 5-HT | 4.47±0.55 | 1.08±0.13 | / | / | 5 |
| R219C/Y140W+MTS-TAMRA | 5-HT | 0.33±0.05 | 0.82±0.10 | 0.47±0.07 | 0.71±0.07 | 8 |
| Varenicline | 0.94±0.12 | 0.77±0.08 | 0.96±0.19 | 0.68±0.10 | 6 | |
| R219C/Y140W unlabeled | 5-HT | 0.60±0.01 | 0.94±0.10 | / | / | 7 |
| Varenicline | 1.575±0.28 | 0.875±0.12 | / | / | 6 | |
| R219C+ MTS-TAMRA | 5-HT | 0.11±0.03 | 0.92±0.21 | 0.185±0.04 | 0.94±0.15 | 6 |
| WT+N101K | 5-HT | 66.67±3.11 | 1.95±0.185 | / | / | 6 |
| S204C+N101K | 5-HT | 57.11±1.49 | 2.33±0.17 | 12.19±0.90 | 1.285±0.11 | 6 |
| Varenicline | No current | / | 25.30±2.46 | 0.94±0.07 | 7 | |
| mCPBG | 13.10±-0.79 | 1.345±0.10 | 4.365±0.495 | 0.72±0.05 | 7 | |
| R219C/Y140W+N101K | 5-HT | 3.32±0.39 | 0.94±0.10 | 1.62±0.27 | 0.86±0.11 | 9 |
| Varenicline | 15.65±2.70 | 0.76±0.09 | 5.25±0.95 | 0.69±0.07 | 6 |
Table 2
Current and fluorescence maximum evoked by ligands (agonist and antagonists) on m5-HT3A mutants.
| Construct | Molecule | ΔImaxmolecule compared to ΔImax5-HT ± SEM | ΔFmax molecule compared to ΔFmax5-HT ± SEM | n |
|---|---|---|---|---|
| Wild-type | mCPBG | 0.92±0.03 | / | 6 |
| Varenicline | 0.39±0.06 | / | ||
| Alosetron | 0 | / | ||
| Granisetron | 0 | / | ||
| Ondasetron | 0 | / | ||
| Metoclopramide | 0 | / | ||
| S204C+MTS-TAMRA | mCPBG | 0.89±0.04 | 1.09±0.105 | 6 |
| Varenicline | 0.33±0.06 | 1.12±0.16 | ||
| Alosetron | 0 | 1.44±0.20 | ||
| Granisetron | 0 | 1.14±0.19 | ||
| Ondasetron | 0 | 0.78±0.13 | ||
| Metoclopramide | 0 | 0.52±0.08 | ||
| I160C/Y207W+MTS-TAMRA | mCPBG | *5-HT – 0.02±0.004 | 1.21±0.06 | 8 |
| Varenicline | *0 | 1.52±0.06 | ||
| Alosetron | *0 | 2.26±0.10 | ||
| Granisetron | *0 | 1.12±0.07 | ||
| Ondasetron | *0 | 1.27±0.03 | ||
| Metoclopramide | *0 | 0.60±0.04 | ||
| V106C/L131W+MTS-TAMRA | mCPBG | 0.64±0.06 | 0.93±-0.06 | 6 |
| Varenicline | 0.33±0.04 | 0.49±0.06 | ||
| Alosetron | 0 | 0 | ||
| Granisetron | 0 | 0 | ||
| Ondasetron | 0 | 0 | ||
| Metoclopramide | 0 | 0 | ||
| R219C/Y140W+MTS-TAMRA | mCPBG | 0.62±0.07 | 0.94±0.09 | 6 |
| Varenicline | 0.34±0.08 | 0.47±0.02 | ||
| Alosetron | 0 | 0 | ||
| Granisetron | 0 | 0 | ||
| Ondasetron | 0 | 0 | ||
| Metoclopramide | 0 | 0 | ||
| S204C+N101K-MTS-TAMRA | mCPBG | 1.80±0.11 | 1.23±0.05 | 8 |
| Varenicline | 0 | 1.73±0.05 | ||
| R219C/Y140W+N101K-MTS-TAMRA | mCPBG | 0.83±0.08 | 1.20±0.08 | 7 |
| Varenicline | 0.03±0.01 | 0.38±0.06 |
-
Here : *comparison with values obtained with mCPBG (in contrast with all the other values in this table that where compared to values obtained with 5-HT).
-
/ : not applicable.
Key resources table
| Reagent type (species) or resource | Designation | Source or reference | Identifiers | Additional information |
|---|---|---|---|---|
| Gene (Mus musculus) | HTR3A, mouse 5-HT3A | Derived from doi: https://doi.org/10.1038/s41586-018-0672-3 | Uniprot: P23979 | |
| Biological sample (Xenopus laevis) | Xenopus laevis dissociated oocytes | Ecocyte Bioscience (Dortmund-Germany) | ||
| Biological sample (Xenopus laevis) | Xenopus laevis ovarian fragments | Portsmouth European Xenopus Resource Centre | ||
| Recombinant DNA reagent | Mouse 5-HT3A in pcDNA5 vector | DOI: https://doi.org/10.1038/s41586-018-0672-3 | ||
| Chemical compound, drug | Serotonin (5-HT), 5-hydroxytryptamin hydrochloride | Merck (Sigma) | CAS: 153-98-0 | |
| Chemical compound, drug | mCPBG hydrochloride | Merck (Sigma) | CAS: 2113-05-5 | |
| Chemical compound, drug | Varenicline tartrate (var) | Merck (Sigma) | CAS: 375815-87-5 | |
| Chemical compound, drug | Alosetron hydrochloride | Merck (Sigma) | CAS: 122852-69-1 | |
| Chemical compound, drug | Granisetron hydrochloride | Merck (Sigma) | CAS: 107007-99-8 | |
| Chemical compound, drug | Ondansetron hydrochloride dihydrate | Merck (Sigma) | CAS: 103639-04-9 | |
| Chemical compound, drug | Metoclopramide | Merck (Sigma) | CAS: 364-62-5 | |
| Chemical compound, drug | MTS-TAMRA | Clinisciences | Catalog Number: 91030 | MTS-5(6)-carboxytetramethylrhodamine, mixed isomers |
| Chemical compound, drug | DMSO | Merck (Sigma) | CAS: 67-68-5 | Anhydrous |
| Software, algorithm | Prism | GraphPad | ||
| Software, algorithm | Clampfit | Molecular Devices | ||
| Other | Custom-made recording chamber for VCF | DOI: https://doi.org/10.1038/s41467-023-36471-7 | Custom compartment chamber for VCF recordings used in this study |
Additional files
-
Supplementary file 1
Contains Table S1.
Values of τrise obtained from rise time kinetic analyses for current and fluorescence on labeled m5-HT3A mutants.
- https://cdn.elifesciences.org/articles/93174/elife-93174-supp1-v1.docx
-
MDAR checklist
- https://cdn.elifesciences.org/articles/93174/elife-93174-mdarchecklist1-v1.pdf
Download links
A two-part list of links to download the article, or parts of the article, in various formats.
Downloads (link to download the article as PDF)
Open citations (links to open the citations from this article in various online reference manager services)
Cite this article (links to download the citations from this article in formats compatible with various reference manager tools)
Mapping the molecular motions of 5-HT3 serotonin-gated channel by voltage-clamp fluorometry
eLife 12:RP93174.
https://doi.org/10.7554/eLife.93174.3


