Optogenetic control of a GEF of RhoA uncovers a signaling switch from retraction to protrusion
- Laboratoire Physico Chimie Curie, Institut Curie, PSL Research University, Sorbonne Université, France
Figures
Figure 1 with 1 supplement
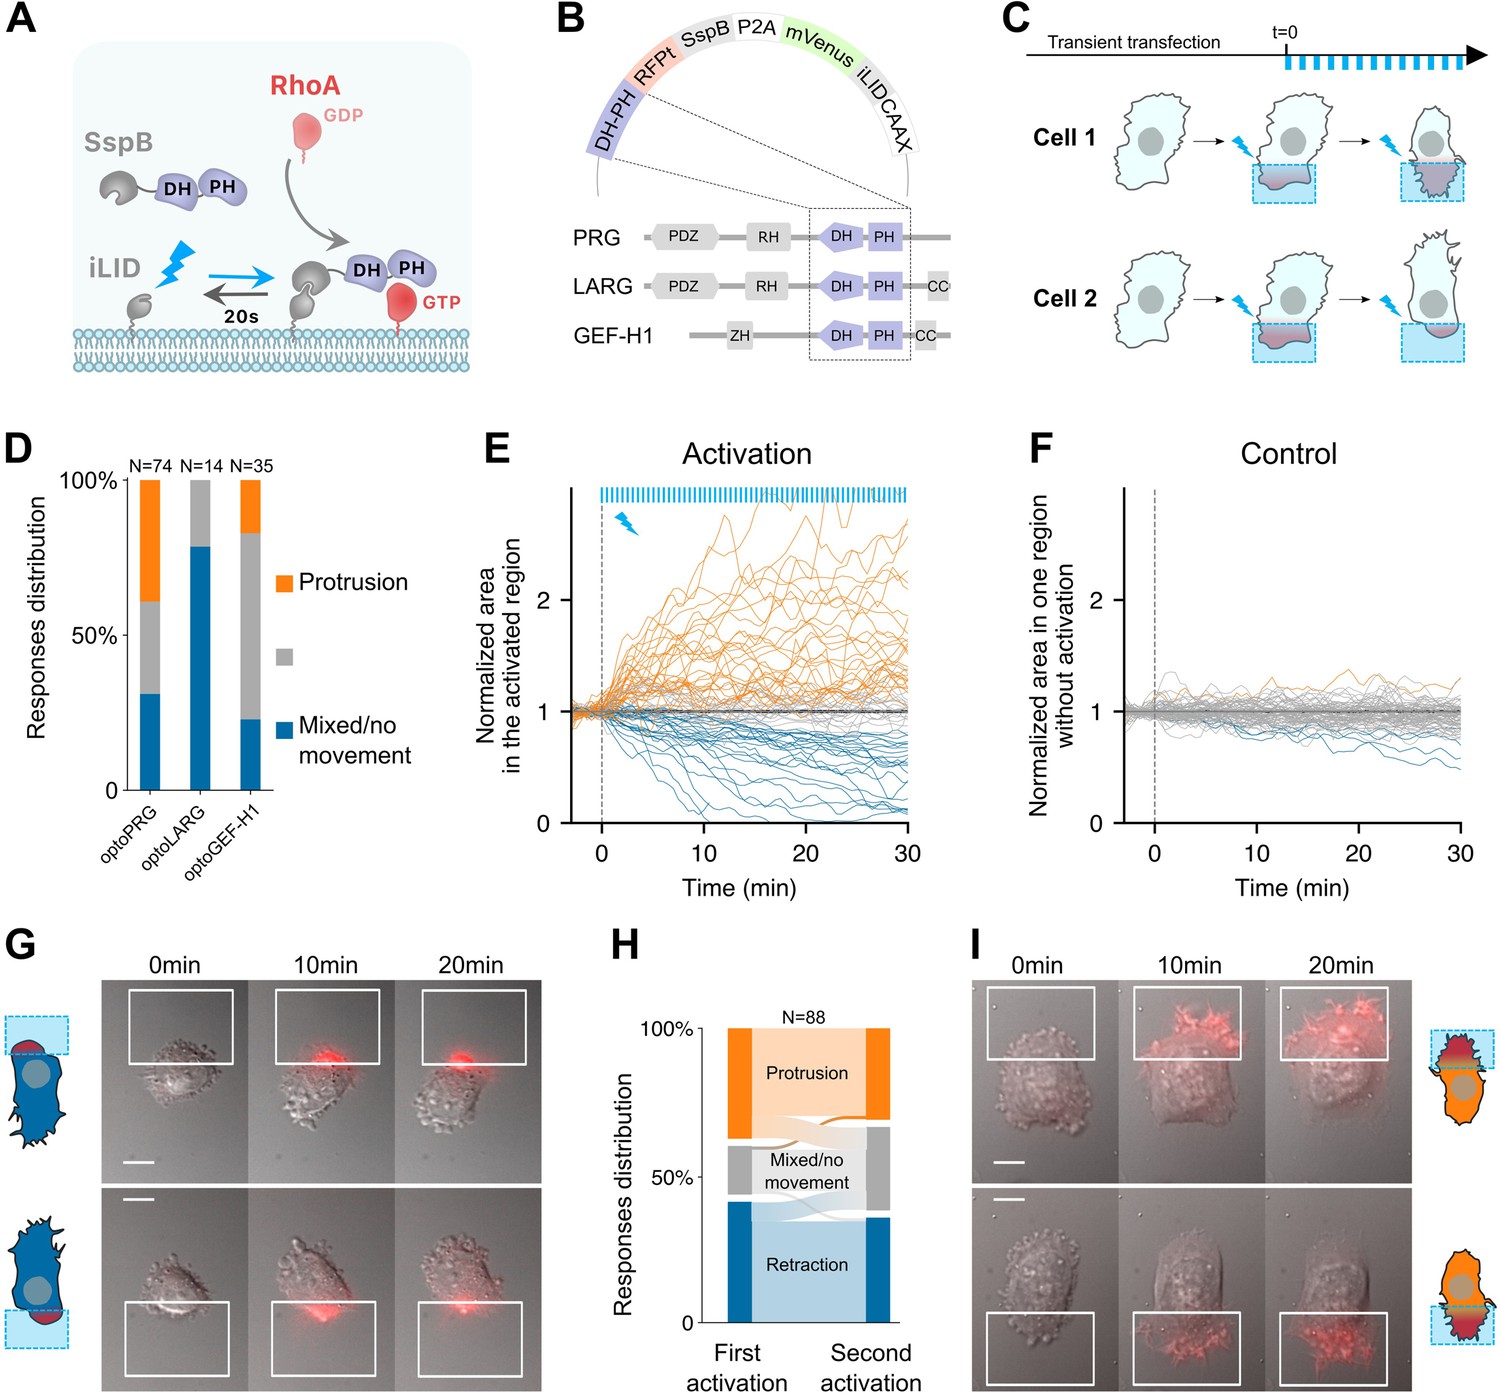
Optogenetic activation of RhoA leads to protrusion or retraction.
(A) Scheme of the optogenetic tool. Optogenetic dimer (in gray) dimerizes upon blue light activation (blue arrow), and dissociates in the dark with an off rate of 20 s (black arrow). DH–PH domain is fused to the SspB moiety (purple), which recruitment to the plasma membrane through iLID triggers RhoA activation, from GDP (light red) to GTP (dark red) state. (B) The three opto plasmids, with DH–PH domains (purple) shown in their wildtype position in the different RhoA GEFs used here. (C) Experimental timeline. Transient transfection is done at least 30 hr before local activation (blue squares). Activation is done by pulses (blue bars, top) at different frequencies, intensities and durations. Cells are observed for 30–60 min. (D) Responses distributions for each optogenetic tool. Area over time of the cell in the activated region (E) or without activation (F), normalized by the mean initial area. t = 0 is the starting point of the activation, each blue bar on top representing one light impulse. Orange: protruding cells, blue: retracting cells, gray: nonmoving cells or mixed phenotype (labeled by hand). (G, I) Representative cells doing retraction (on the left) and protrusion (on the right) upon optogenetic activations on two different side of the cell. Scale bar: 10 μm. White squares: area of activation. Red color: RFPt channel (optogenetic tool). (H) Sankey diagram representing the proportion of cells doing a protrusion (orange), retraction (blue), or a mixed phenotype (gray) at one side (first activation) or the other side (second activation).
Figure 1—figure supplement 1
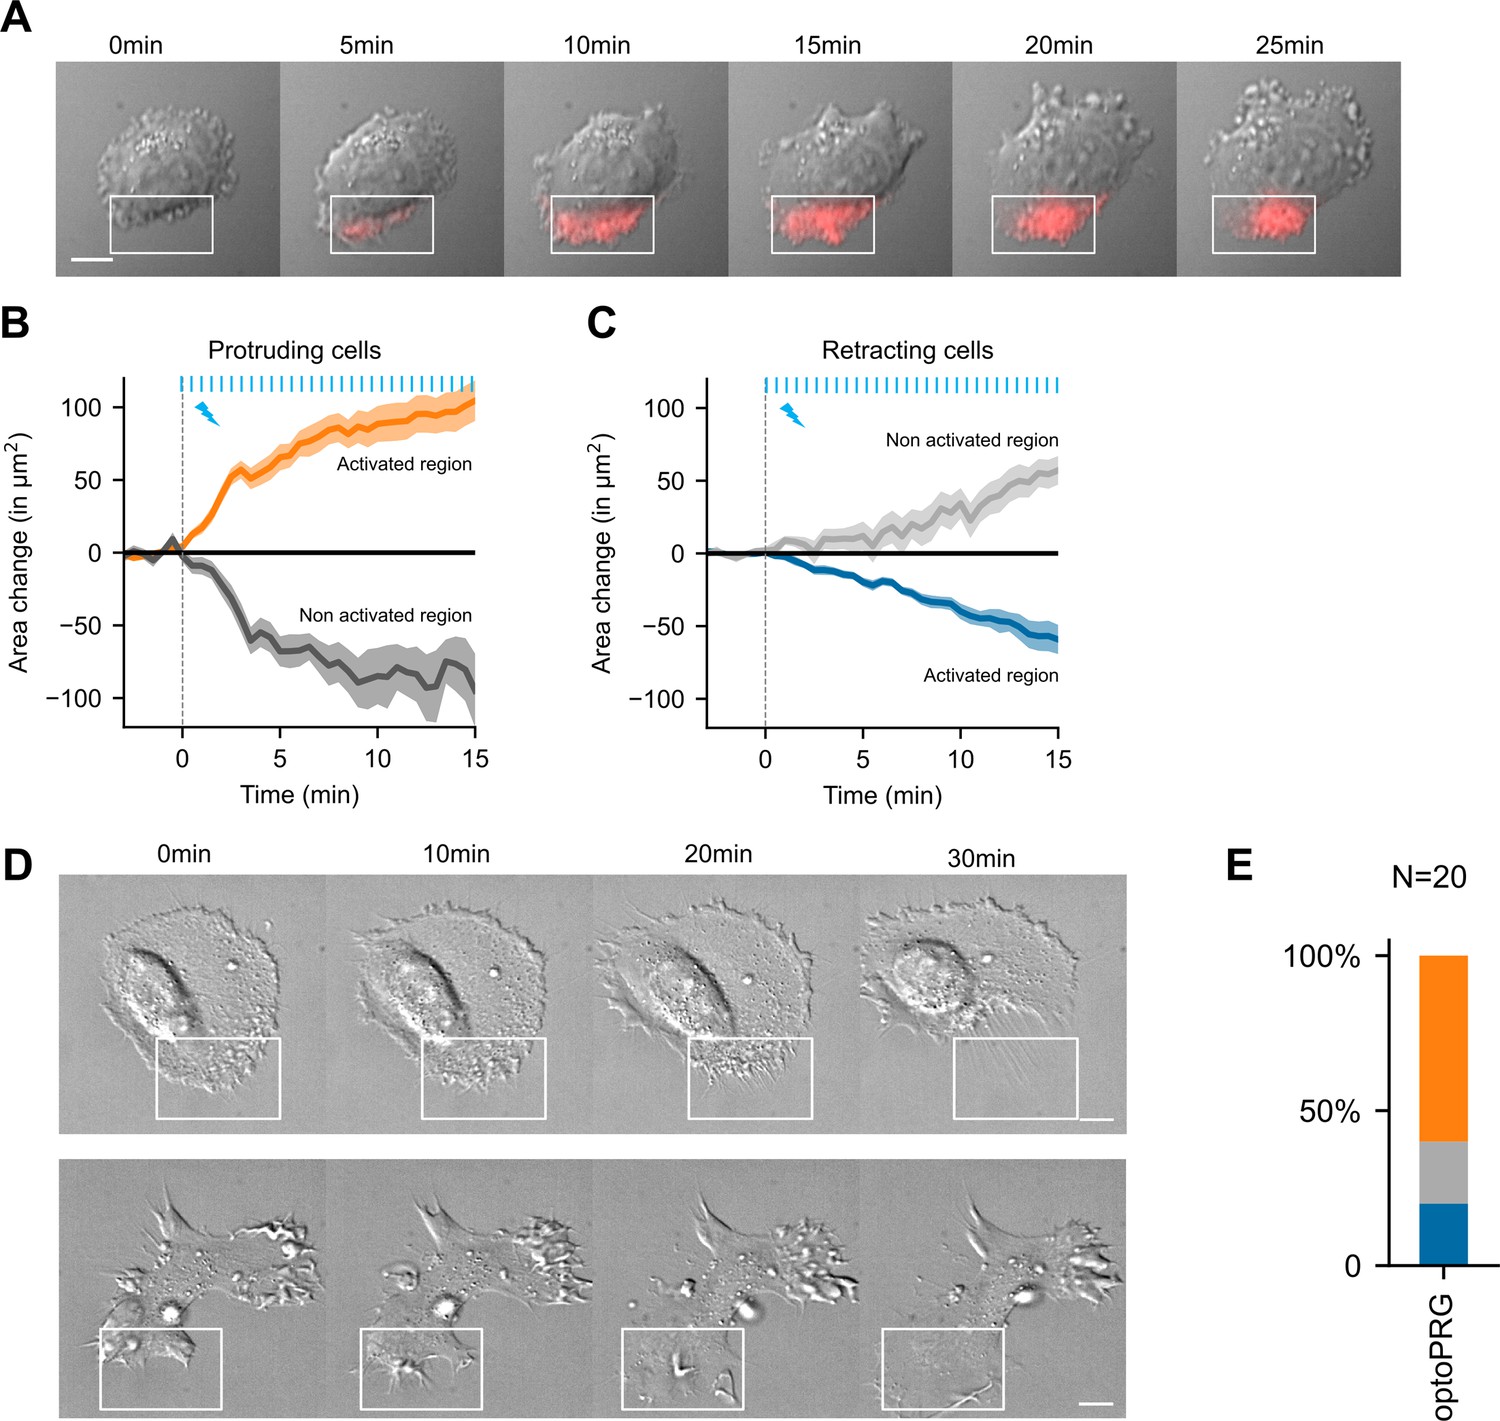
Mixed phenotype, cell polarity, and dual phenotype in another cell line.
(A) Representative example of a mixed phenotype: here we see first protrusions (from 5 to 10 min) and then retraction with blebby structures forming at the opposite side of the cell. Scale bar: 10 μm. White squares: area of optogenetic activation. Red color: RFPt channel (optogenetic tool). Evolution of the cell areas in the activated region and on the opposite side of the cell for protruding (B) and retracting cells (C). (D) Representative Hela cells doing retraction (on the top) and protrusion (on the bottom) upon optogenetic activation. Scale bars: 10 μm. (E) Proportion of Hela cells doing a protrusion (orange), retraction (blue), or a mixed phenotype (gray) upon optogenetic activation.
Figure 2 with 1 supplement
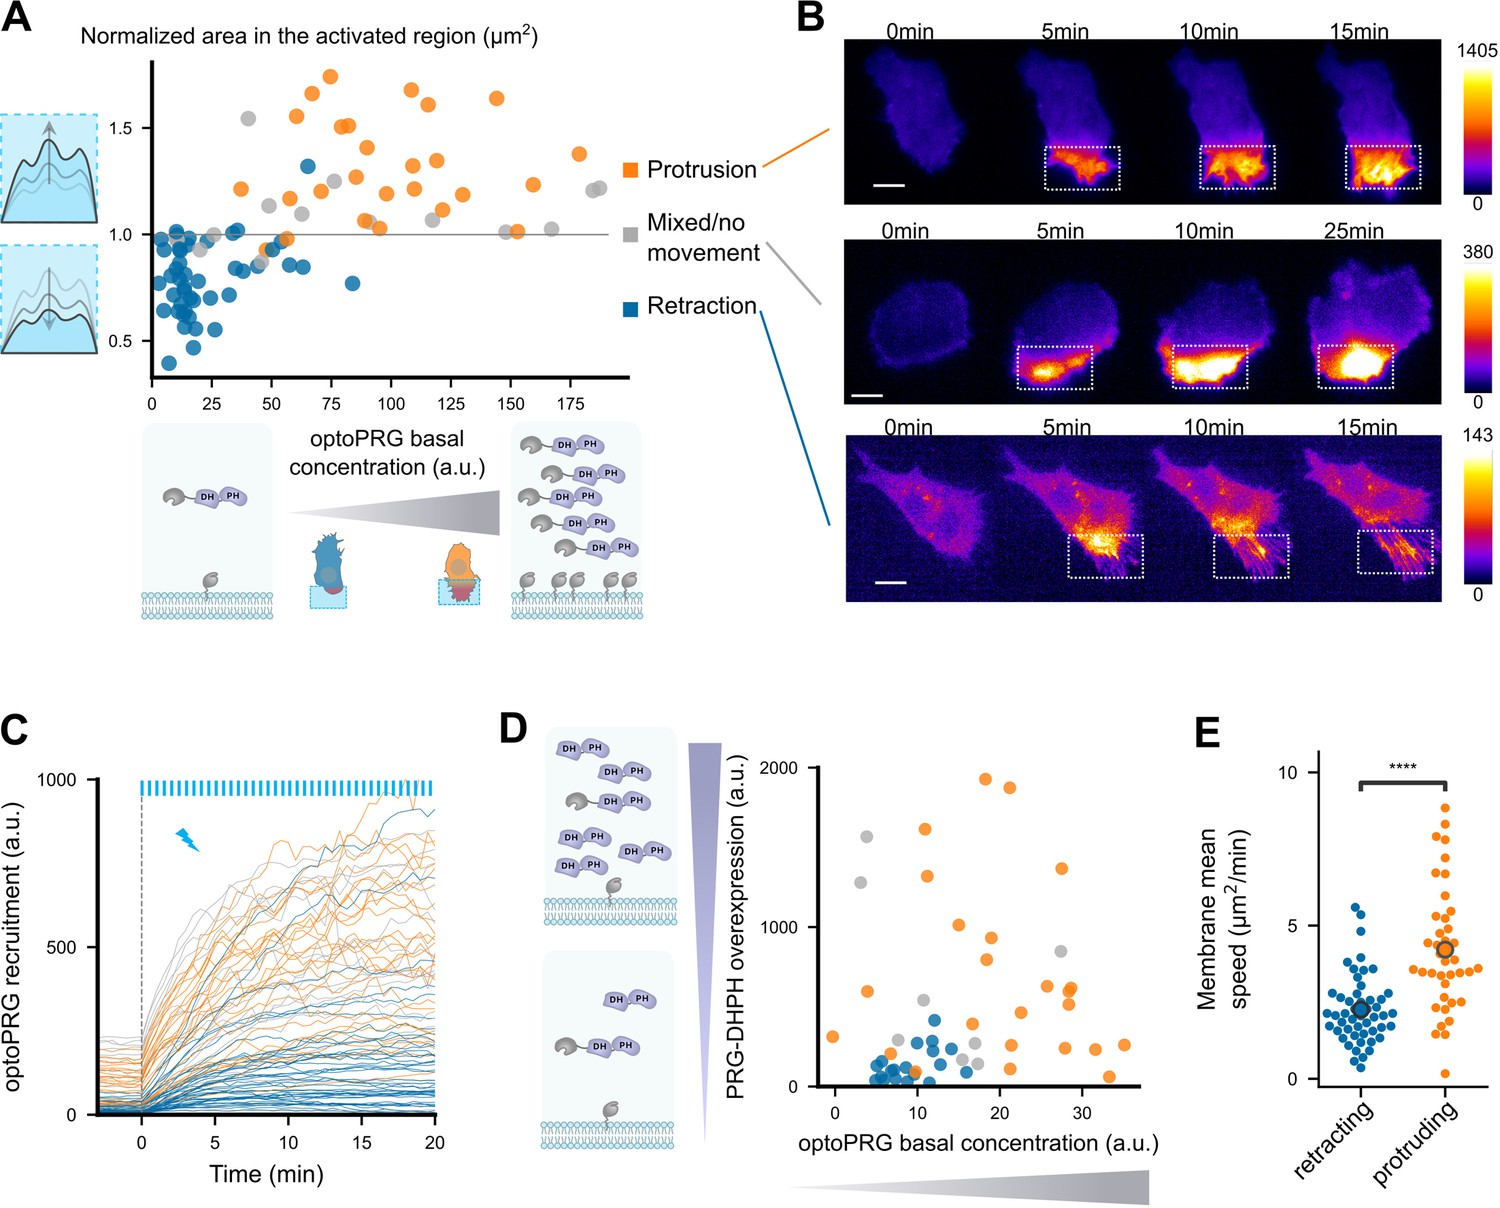
Cell phenotype depends on the initial optoPRG concentration.
(A) Phenotype dependence on initial cytosolic optoPRG concentration. The normalized area in the activated region after 5 min is plotted against the mean fluorescence intensity for each cell, which color is labeled by hand depending on the observed phenotype. Schemes on the bottom represent high and low levels of expression (P2A plasmids implies approximately a one-to-one ratio of iLID against SspB). (B) Three representative time lapse images of transiently transfected cells, one retracting (top), one showing a mixed phenotype (middle), and one protruding (bottom). Intensities are very different, as seen by the dynamic range of the colormaps presented on the right. (C) Absolute fluorescence intensity of recruited optoPRG, before (t < 0) and after (t > 0) activation. Blue bars: activation pulses. (D) Phenotype depending on both optoPRG concentration and PRG DH–PH overexpression, measured both by fluorescence intensity (a.u.). Increasing recruitable and non-recruitable DH–PH domain of PRG both lead to protruding phenotypes. Phenotypes are manually labeled. (E) Membrane mean absolute displacement to compare membrane activity between retracting (blue) and protruding (orange) cells (Mann–Whitney U test. ****<0.0001).
Figure 2—figure supplement 1
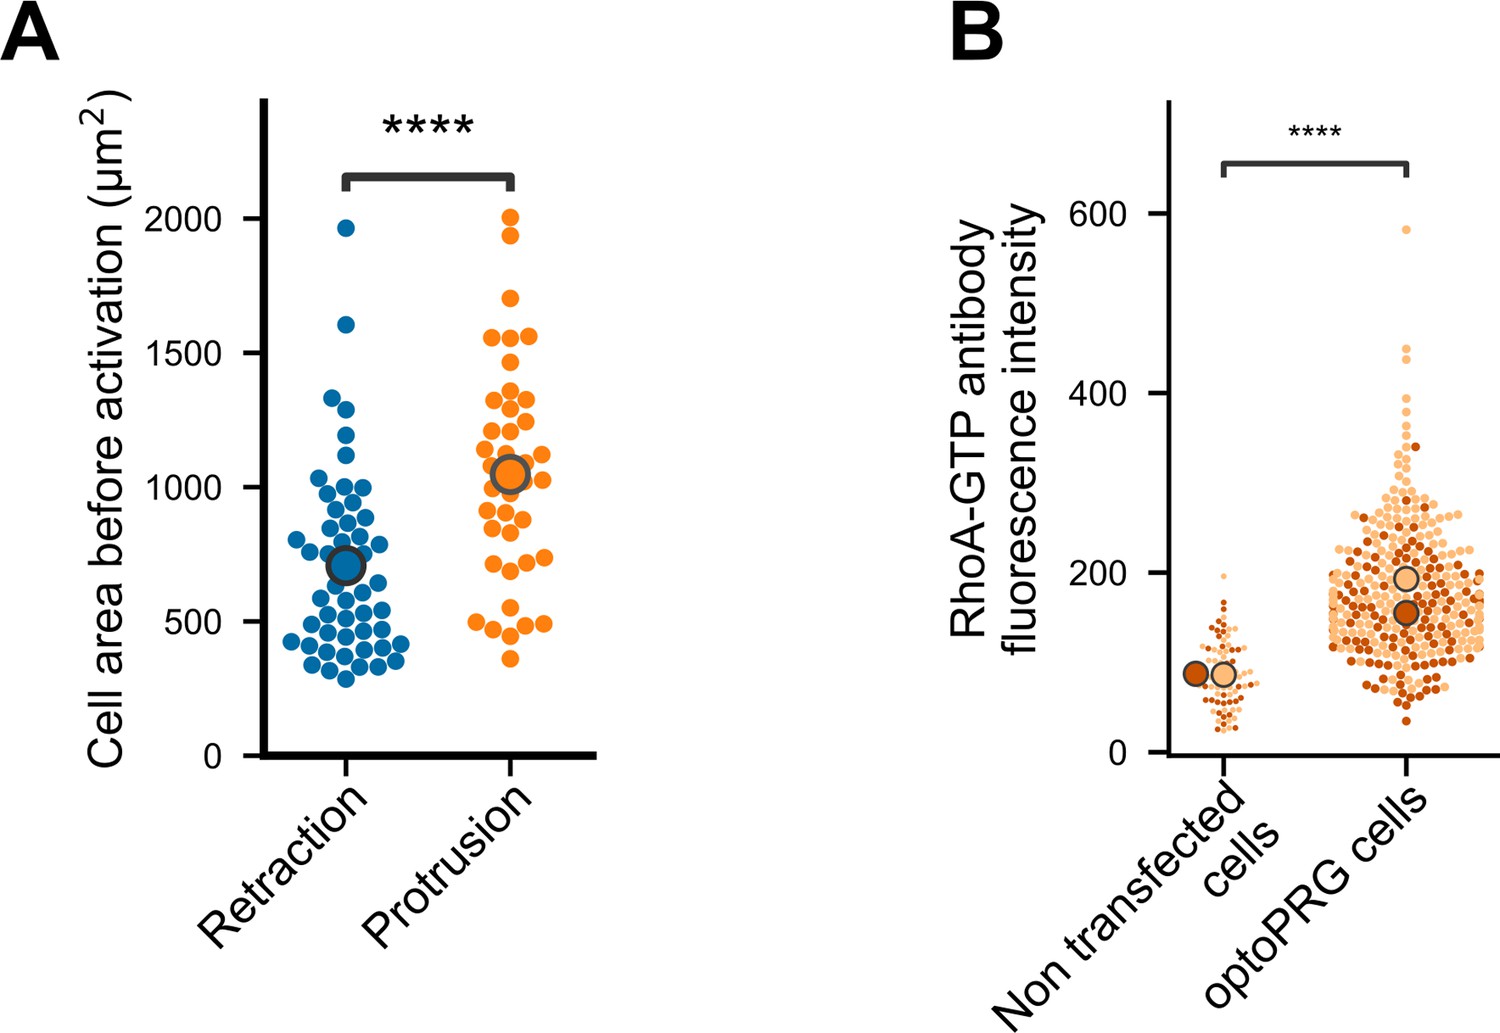
OptoPRG expression leads to an increase of cell area and RhoA activity.
(A) Cell area before activation for retracting (blue) and protruding (orange) cells. (B) Quantification of RhoA basal activity in control and optoPRG overexpressing cells, using antibody staining against RhoA-GTP after fixation. Each dot is a single cell, and the two colors correspond to two independent experiments. ****p < 0.0001 (Mann–Whitney).
Figure 3
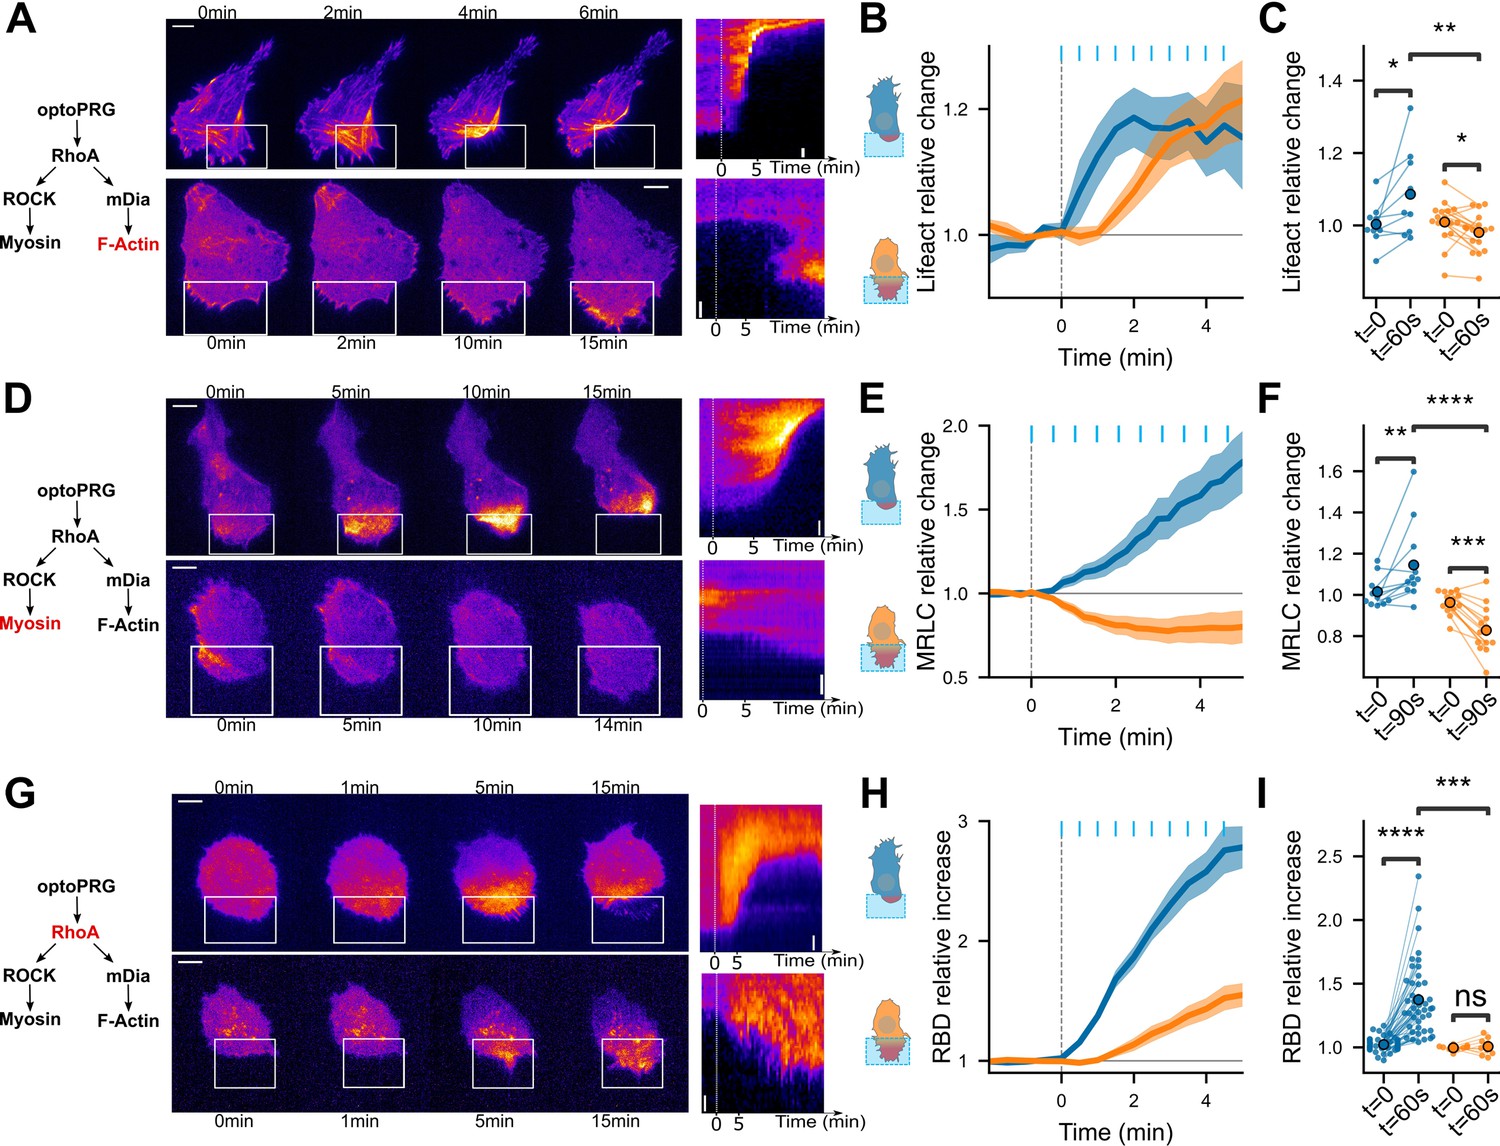
Downstream effectors show that cell phenotype is set immediately.
Distinct pathways are triggered from the first timepoint. (A,D,G) Representative timelapse images and kymographs of retracting (top) and protruding (bottom) cells labeled with Lifeact-iRFP (A), MRLC-iRFP (D), and RBD-2xTdTomato biosensor (G), activated with optoPRG starting at t = 0 min. White rectangles are areas of optogenetic activation. Scale bars are 10 μm. (B, E, H) Corresponding mean normalized intensities are plotted against time (mean ± s.e.m.), blue for retracting cells and orange for protruding one. (C, F, I) Corresponding pairwise comparison for each cell of the signal inside the region of activation between the initial time and 60 s (Lifeact-iRFP and RhoA biosensor) or 90 s (MRCL-iRFP). Data are grouped by phenotype. *p < 0.05, **p < 0.01, ***p < 0.001, ****p < 0.0001 (Wilcoxon test to compare t = 0 and t > 0, independent t-test otherwise).
Figure 4 with 1 supplement
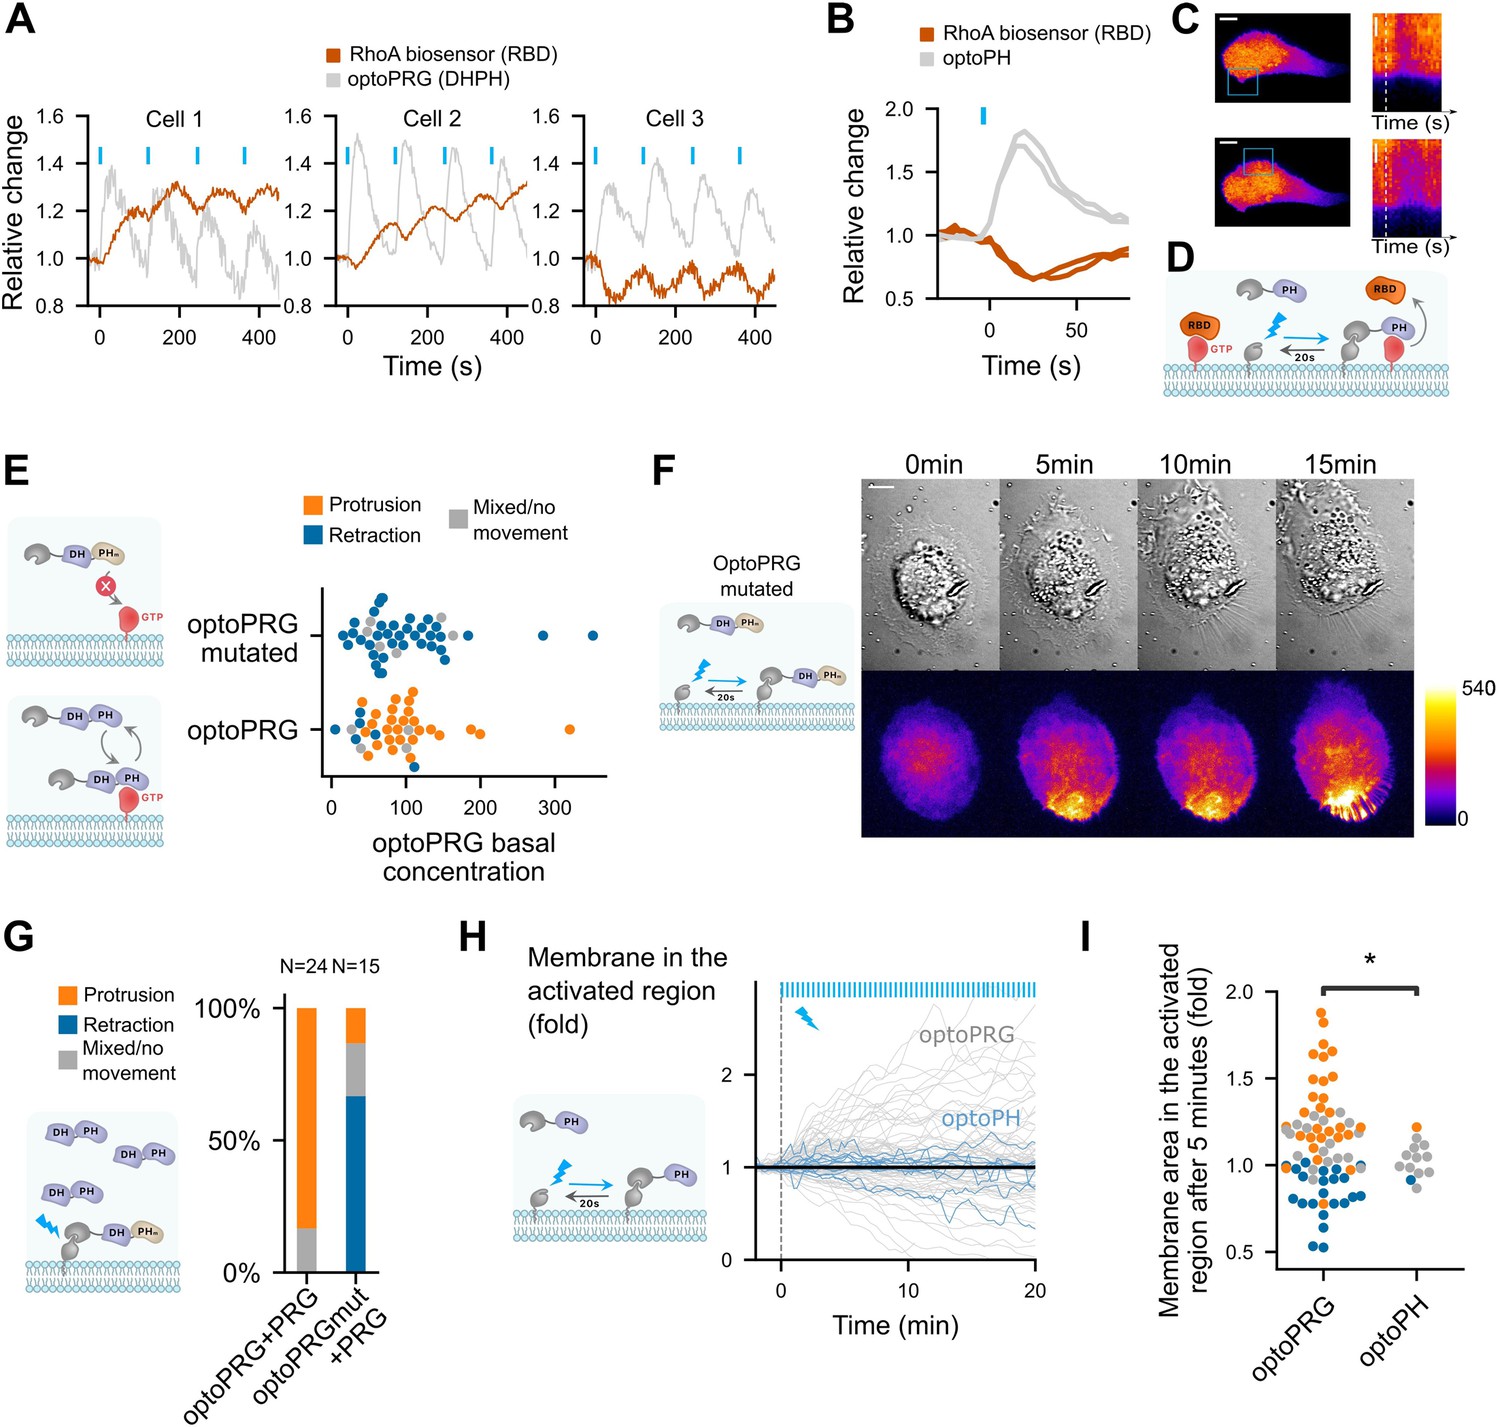
PH domain of PRG is triggering inhibition of RhoA at high PRG concentration and is necessary but not sufficient for protruding phenotype.
(A) Three representative cells that show very different responses to optoPRG pulsatile activation. Cell 1 has a low optoPRG expression, while cells 2 and 3 have high concentration of optoPRG. Intensities are normalized by the mean intensity before the first activation (t = 0). (B) Quantification of the relative change in RhoA biosensor (RBD) after one pulse of optogenetic recruitment of the PH domain of PRG. In gray, optoPH recruitment, in red, RhoA biosensor. Light pulses are shown with blue bars. (C) Image of the corresponding cell. On the right, kymograph taken within the activation region. White dotted line shows the starting point of the activation. Scale bar: 10 μm. Region of activation is shown is the blue rectangle. (D) Scheme of the probable mechanism of PH domain dominant negative effect on RhoA. (E) Phenotype after optogenetic activation for optoPRG (bottom) and optoPRG with the PH mutated for no binding to RhoA-GTP (top). On the left, schemes of the expected behavior of the corresponding proteins. (F) Representative image of a cell transfected with the optoPRG with mutated PH, doing a retraction despite the high optoPRG concentration. (G) Quantification of protruding and retracting phenotypes in cells highly overexpressing non-recruitable PRG, comparing mutated and non-mutated optoPRG, with a scheme of the experiment on the left. See Figure 4—figure supplement 1B, C for the selected cells. (H) Membrane displacement of optoPH cells (in blue) with overexpressed DH–PH domain of PRG, compared to optoPRG cells (in gray). No specific protrusion can be seen. (I) Normalized membrane area after 5 min in the activated for optoPRG and optoPH cells. Orange: protruding cells, gray: mixed phenotype or no movement, blue: retracting cells. *p < 0.05 (Levene test to compare variance).
Figure 4—figure supplement 1
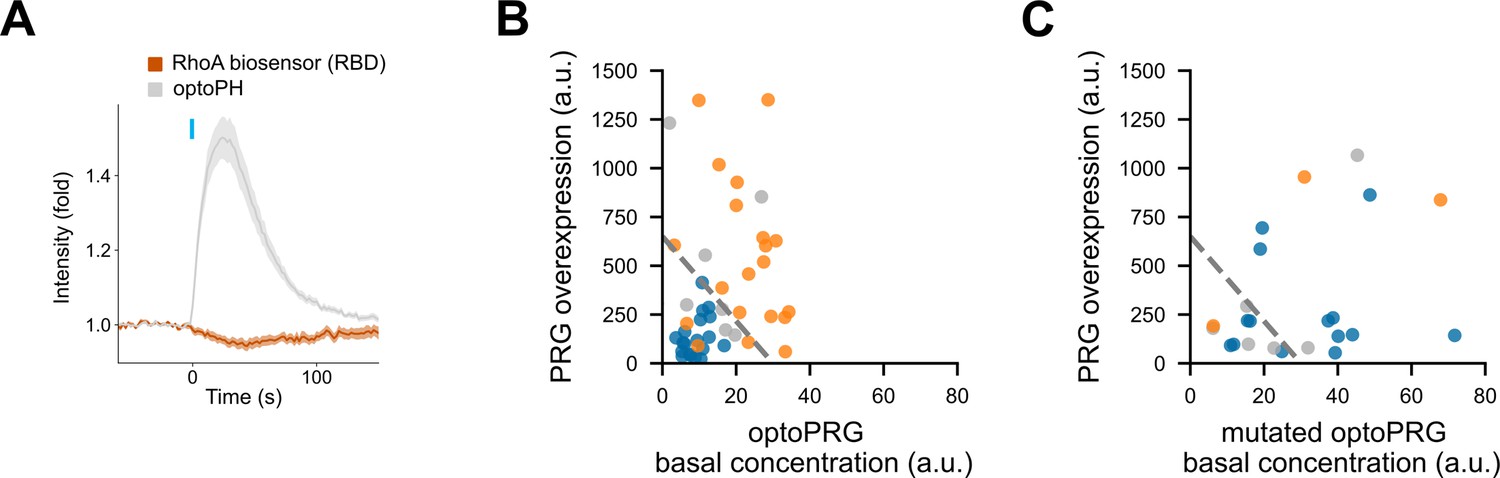
Membrane recruitment of the PH domain lowers active RhoA but is not sufficient to induce protrusion.
(A) Mean ± s.e.m. of fold recruitment of optoPH and RBD biosensor evolution over 26 cells. Light pulse is shown with the blue bar. (B, C) Overexpression of the non-recruitable PRG together with the optogenetic tools. Control experiment (B) with recruitment of optoPRG and overexpressed non-recruitable PRG, and (C) same experiment with the mutated PH. Dashed line separates retracting and protruding phenotypes in control experiment.
Figure 5
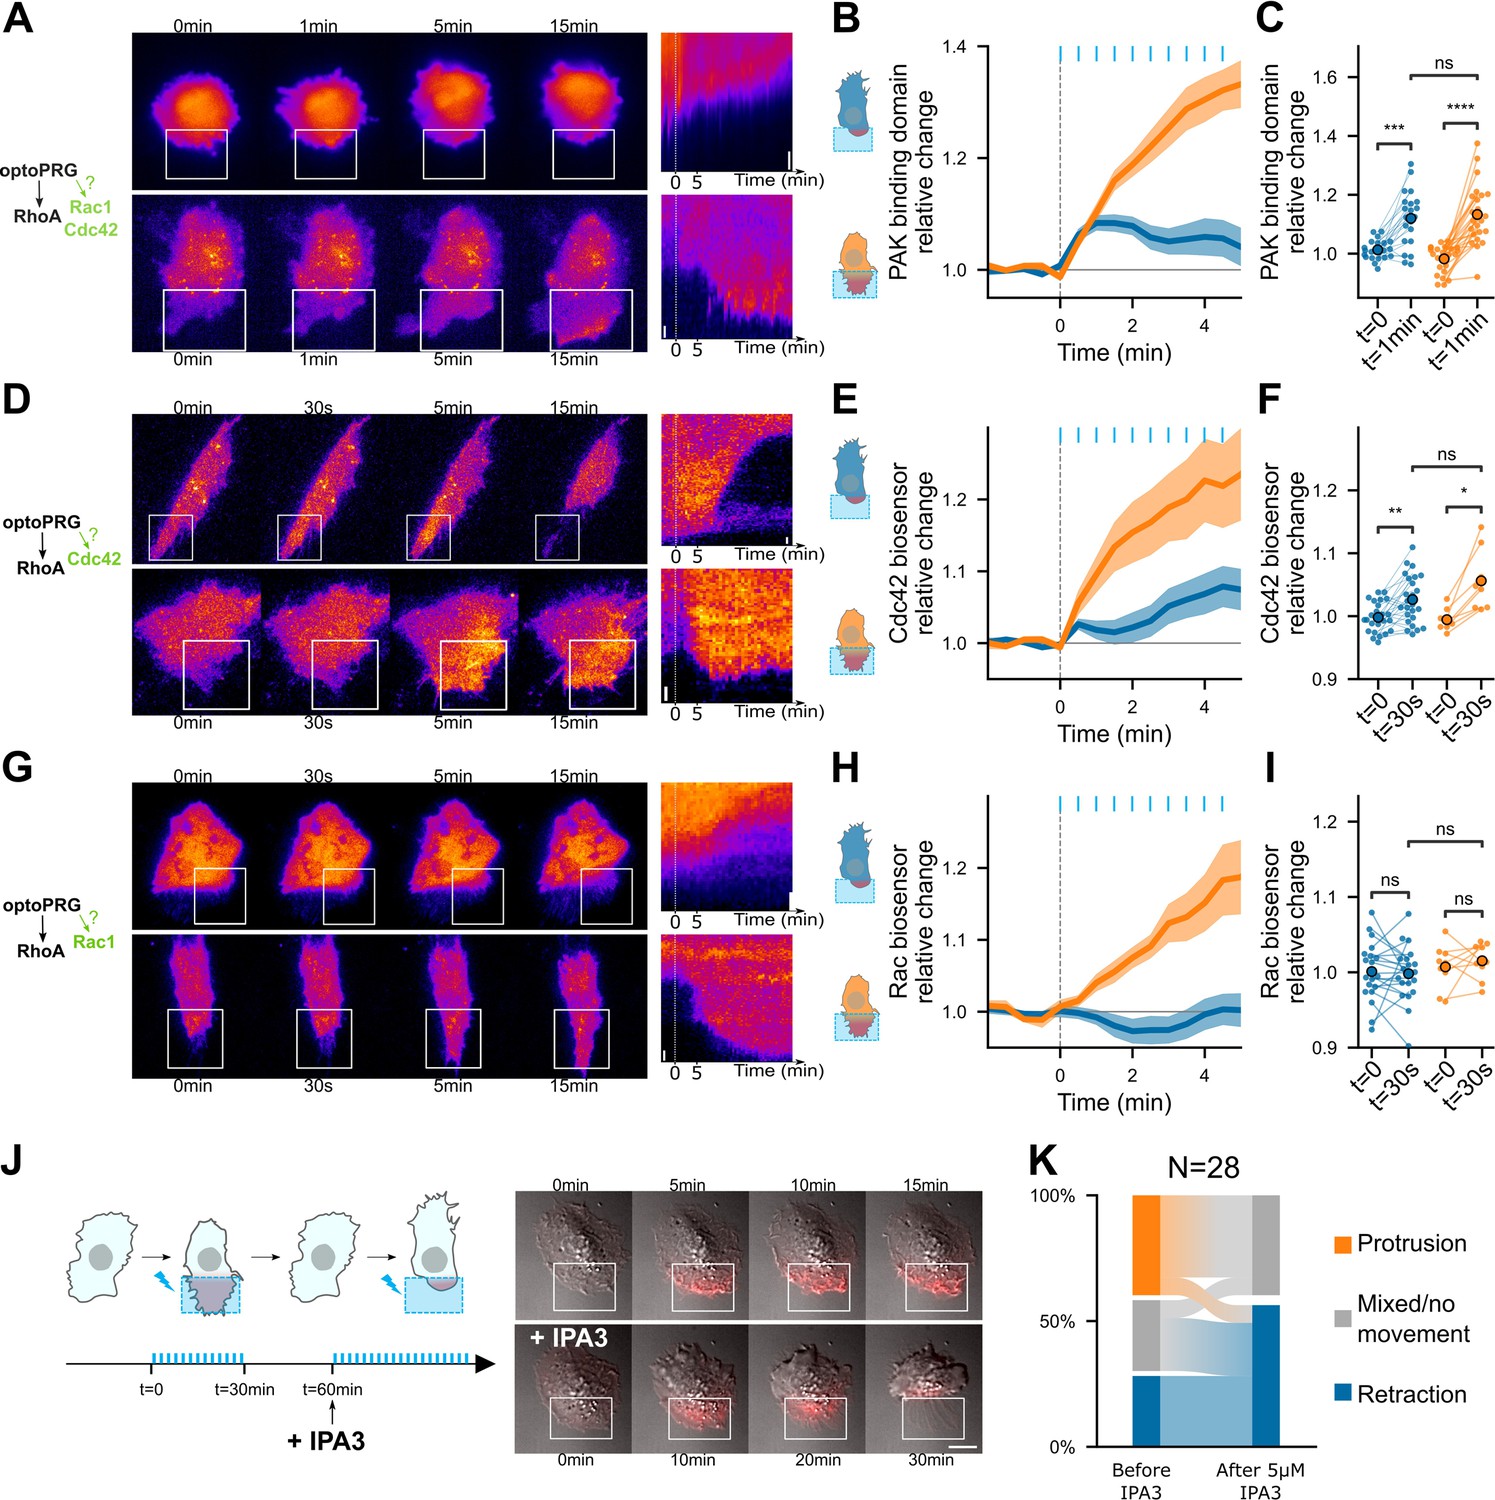
PRG activates Cdc42 and Cdc42 downstream activity is necessary for the protrusive phenotype.
Representative timelapse images and kymographs of retracting (top) and protruding (bottom) cells labeled with PBD-iRFP (A), delCMV-mCherry-WaspGBD (D), and mCherry-3xp67Phox (G) biosensors (Nanda et al., 2023), activated with optoPRG starting at t = 0 min. White rectangles are areas of optogenetic activation. Scale bars are 10 μm. (B, E ,H) Corresponding mean normalized intensities are plotted against time (mean ± s.e.m.), blue for retracting cells and orange for protruding one. (C, F, I) Corresponding pairwise comparison for each cell of the signal inside the region of activation between the initial time and 60 s (PBD biosensor) or 30 s (Cdc42 and Rac1 biosensors). Data are grouped by phenotype. *p < 0.05, **p < 0.01, ***p < 0.001, ****p < 0.0001 (Wilcoxon test to compare t = 0 and t > 0, independent t-test otherwise). (J) Left, scheme describing the IP3 experiment. Blue bars represent optogenetic pulses (every 30 s). Half an hour after the first experiment, IPA3 is added at 5 μM. Right, representative cell showing a protruding phenotype with ruffles (top), and a retracting phenotype after addition or IPA3 (bottom). (K) Quantification of phenotype switches.
Figure 6 with 1 supplement
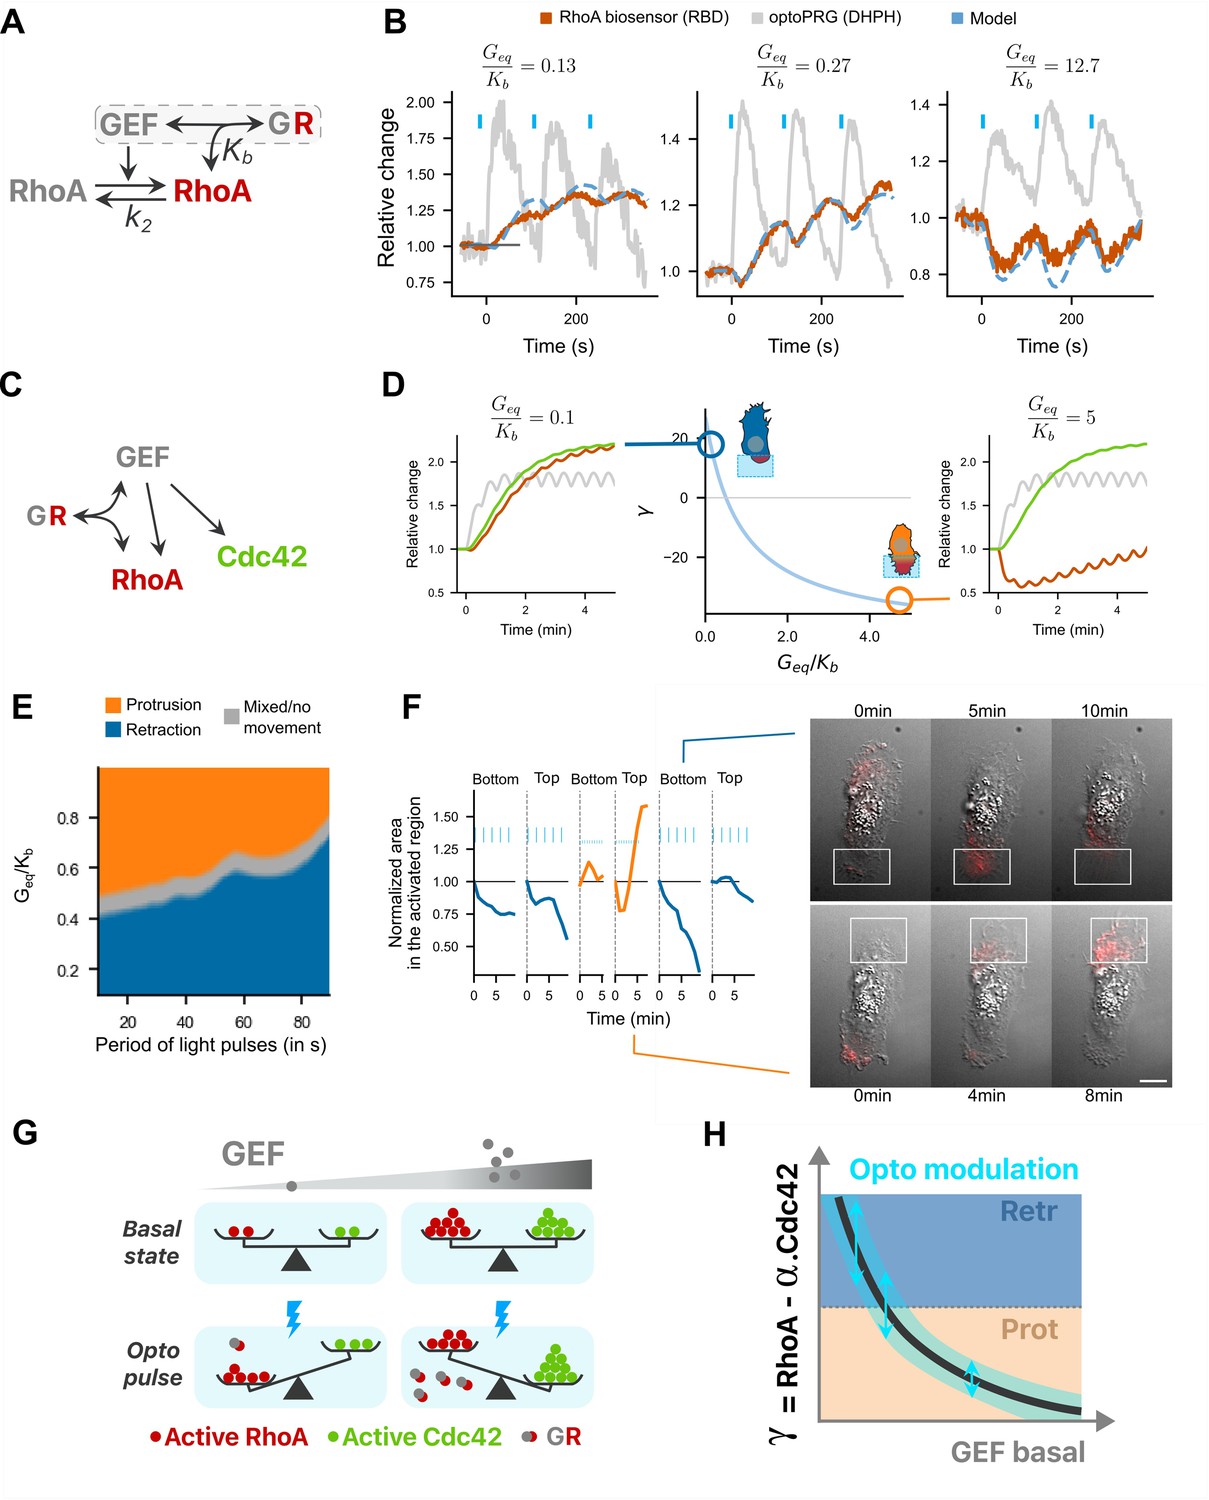
A minimal model recapitulates RhoA activity dynamics and the phenotypic switch.
(A) Model for active RhoA dynamics. Interactions are represented with arrows, with the two main parameters of the model. (B) The three different RhoA dynamics are well fitted with one single free parameter, . Dotted blue line: fitted curve, with gray line taken as input (optoPRG recruitment). Red line: RBD biosensor. (C) Complete model, adding Cdc42 to (A): the GEF PRG can activate both RhoA and Cdc42, but can also inhibit RhoA by directly binding to it. (D) Center, evolution of describing the phenotype (positive for retraction and negative for protrusion) against the free parameter . Two representative dynamics are shown on the right and on the left for the same input , for a low and high . In gray, optoPRG recruitment to the membrane, in green, Cdc42 activity, in red, RhoA activity. (E) Map of the phenotype as function of the free parameter and of the duration time between two pulses. (F) One example of two phenotypes controlled in the same cell. On the left, first 10 min of the cell area in the illuminated region for different frequencies and intensities of activation (low frequency high power every 30 s, high frequency low power every 15 s). On the right, two representative timelapse of retraction (top) and protrusion (bottom), activation is shown with the white rectangle. Scale bar: 10 μm. (G, H) Graphical conclusion on the model. (G) Balance between RhoA and Cdc42 activity is represented in function of GEF basal concentration (gray gradient), both at the basal state (top) and after optogenetic activation (bottom, with blue lightning). At low concentrations RhoA takes over. At high concentration, optoPRG binds to active RhoA and inhibits it (complex GR), which enables Cdc42 to take over. (H) Curve showing the difference between RhoA and Cdc42 activity as a function of the basal intensity of the GEF. Phenotypes are marked with the colors (blue, retraction and orange, protrusion). Optogenetic modulation happens on vertical line, with the blue range, which limits the possibility of switching from one phenotype to the other.
Figure 6—figure supplement 1
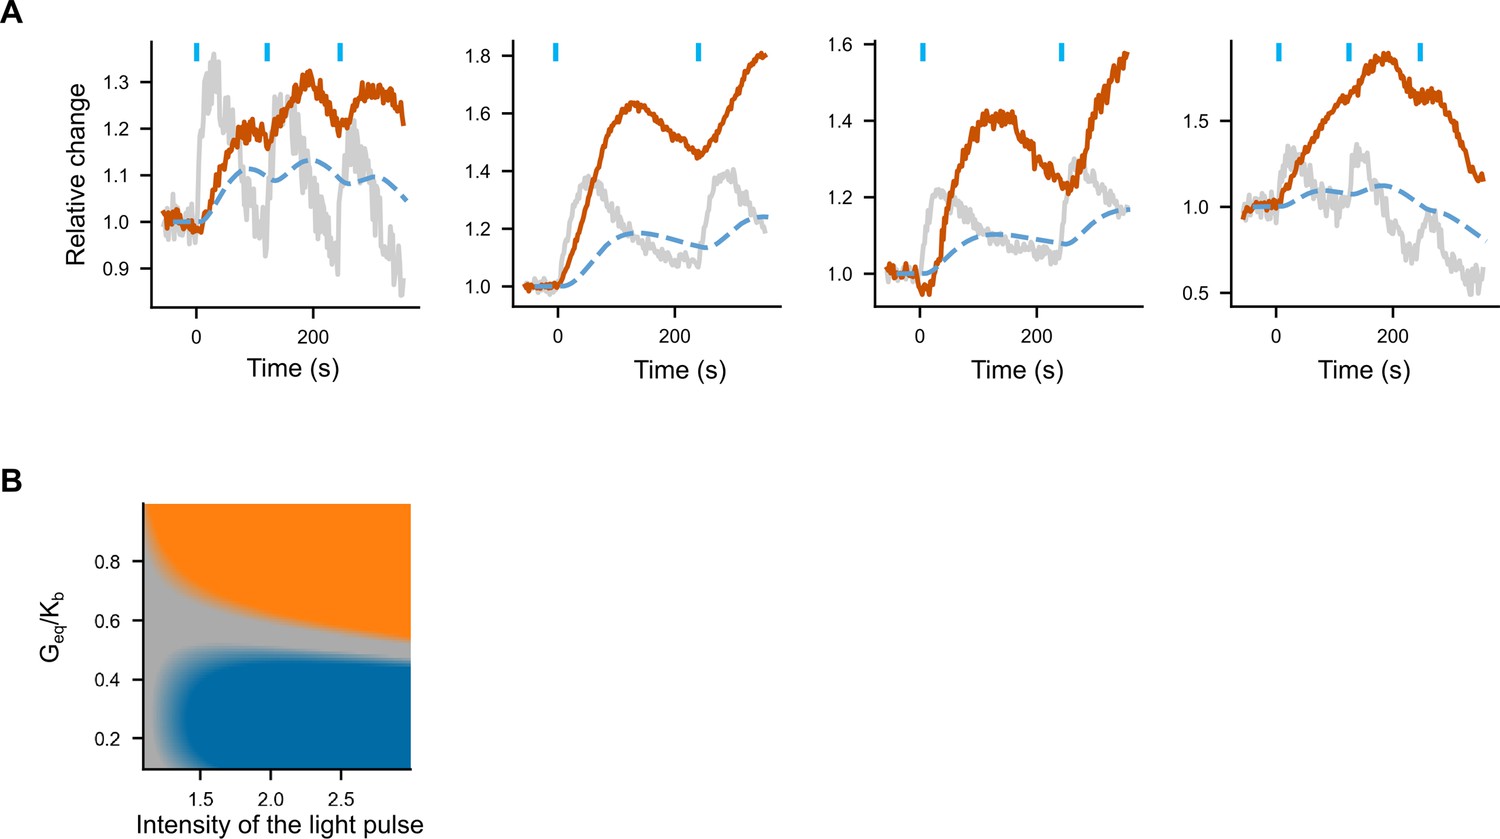
Example of RhoA biosensor dynamics not captured by the model and independence of the phenotype with regards to the intensity of the activating light.
(A) Some biosensor dynamics, shown here, are not well recapitulated by the model. Dotted blue line: fitted curve, with gray line taken as input (optoPRG recruitment). Red line: RBD biosensor. Chosen value for Geq/Kb is 0.001 for all these plots. (B) Phenotype in function of the pulses intensity and Geq/Kb. Protruding (orange), retracting (blue), or mixed (gray) phenotypes are represented in function of the free parameter Geq/Kb (y-axis) and the intensity of the optogenetic pulses, represented by the fold increase on the x-axis. There is no way to change from retraction to protrusion or vice versa by changing only the intensity of the light pulse (which would equivalent to moving along a line parallel to the x-axis).
Appendix 1—figure 1
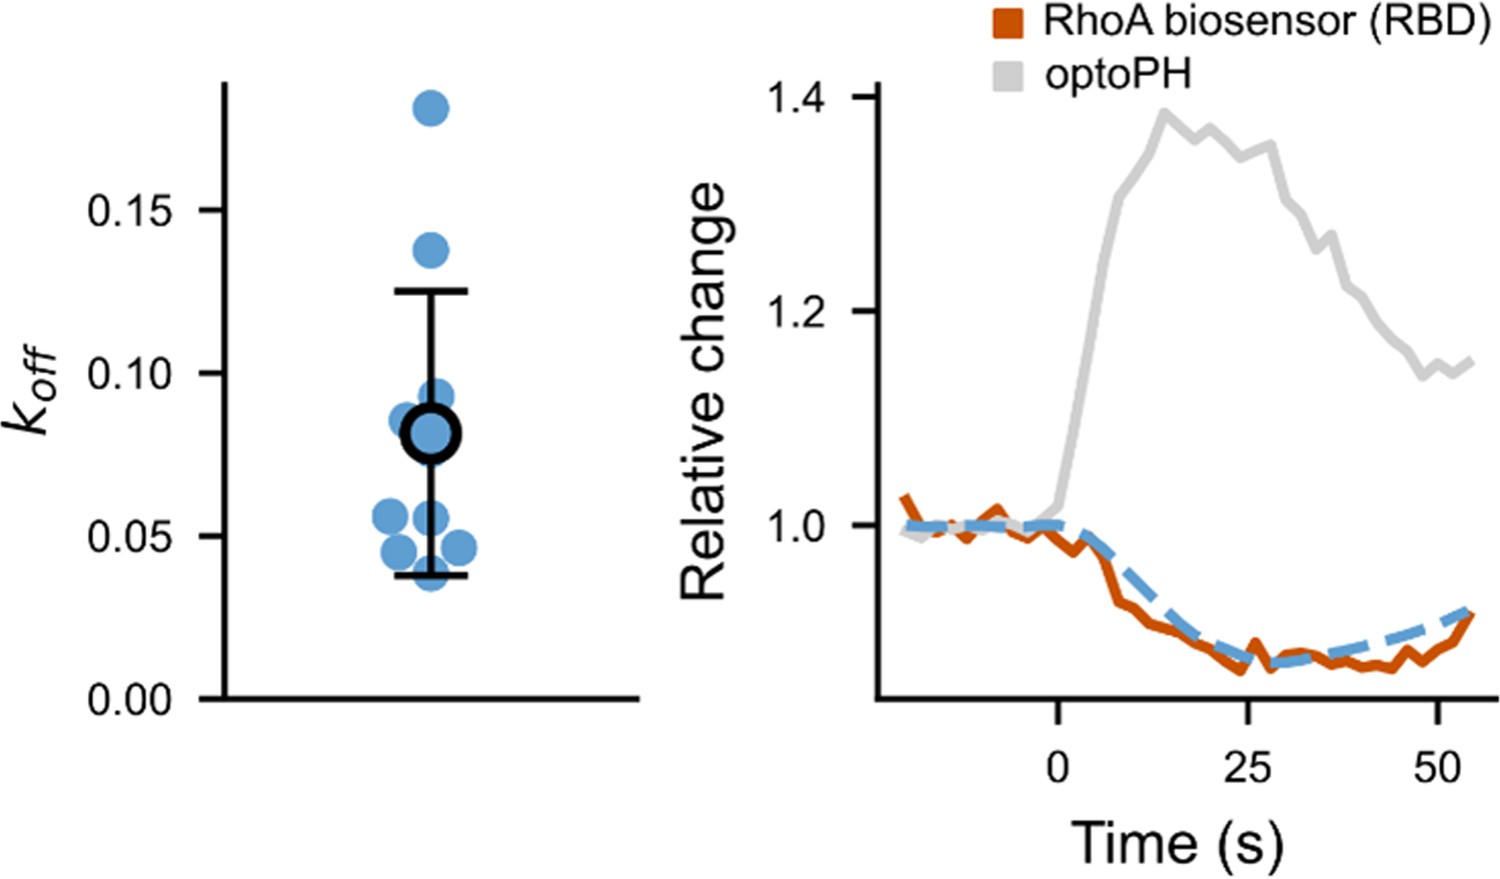
Fit of the biosensor .
On the left, values fitted from different cells (N = 3 cells, with repeated measurements). On the right, an example of a fitted RBD curve (fit in blue, data in brown), plotted together with the normalized optoPH recruitment (gray curve).
Appendix 1—figure 2
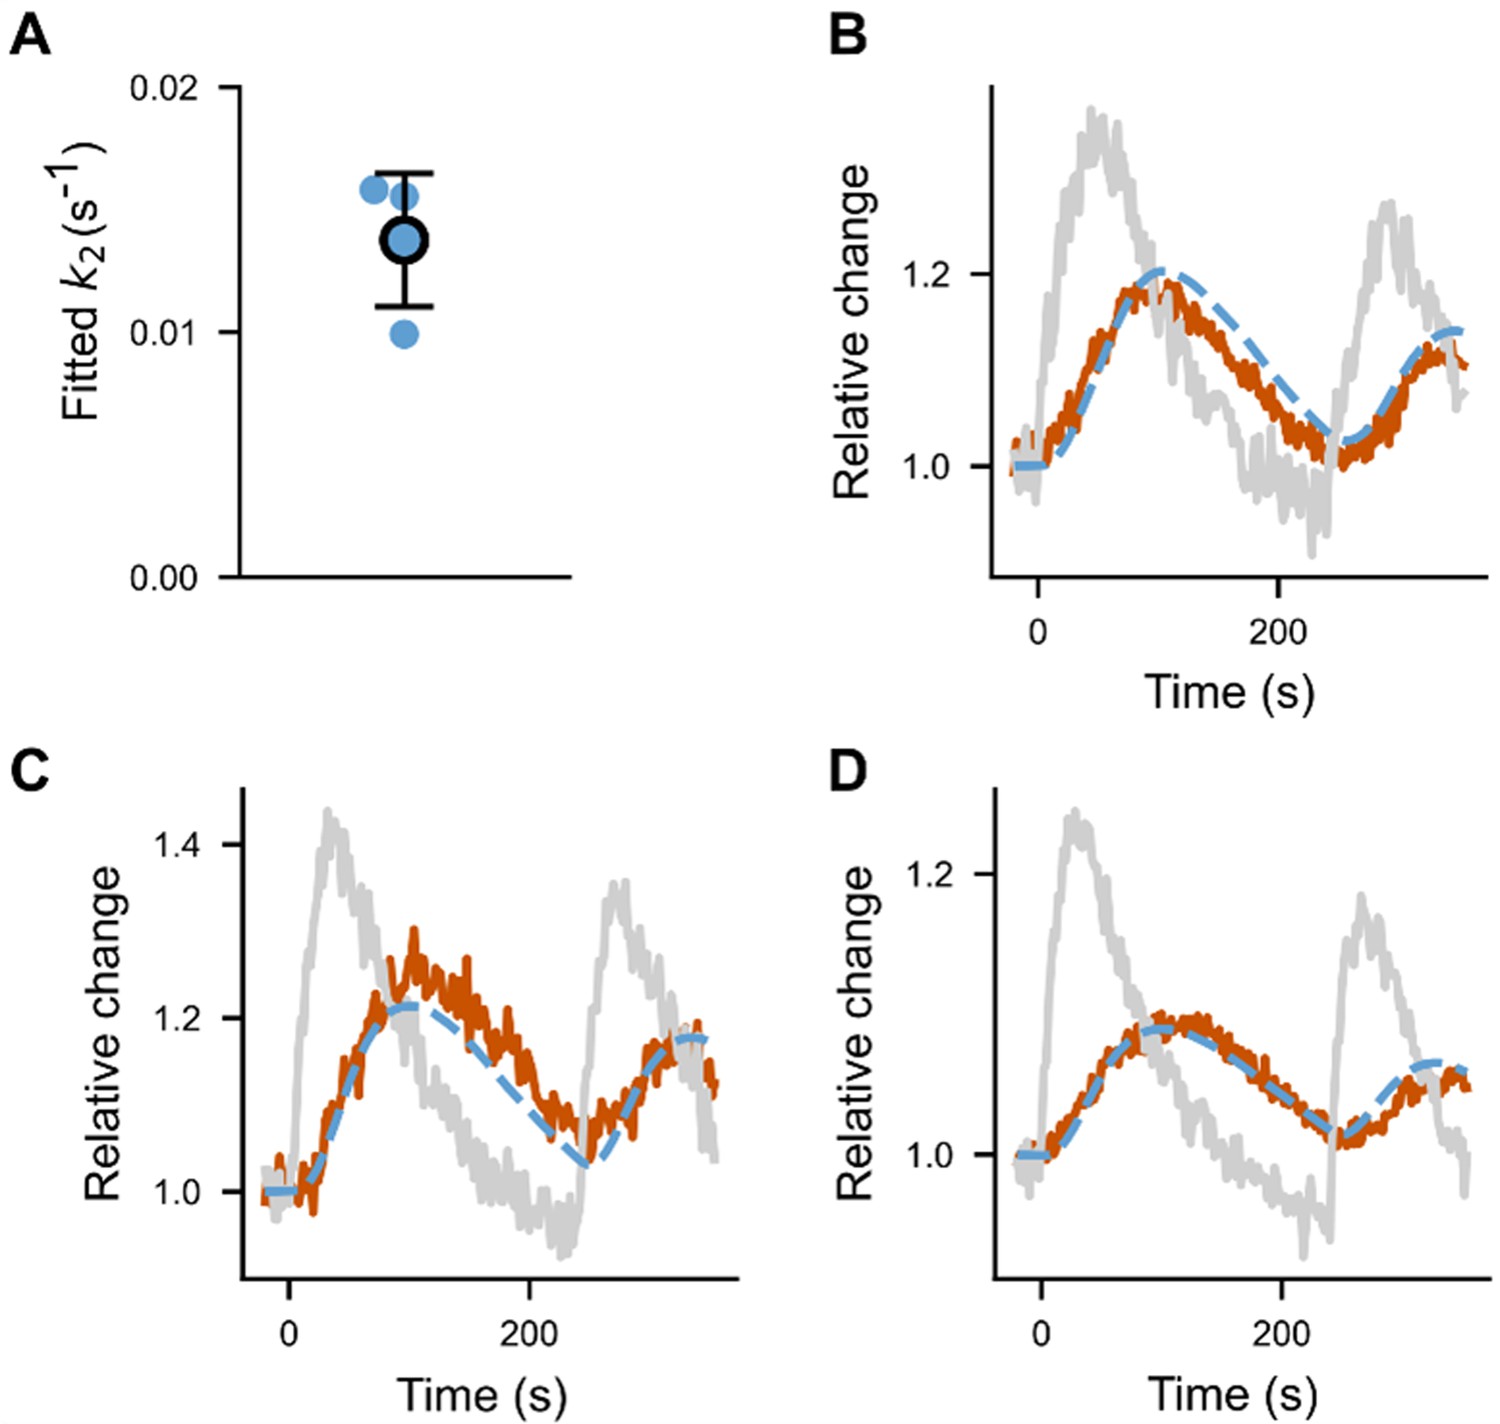
Fit of .
(A) fitted for different cells (N = 3 cells). (B–D) The three fitted curves (fit in dotted blue, data in brown), plotted together with the normalized optoPH recruitment (gray curve).
Appendix 1—figure 3

Fit of f and koff for pulses of optogenetics recruitment.
Pulses of light every 120 s lead to highly reproducible optogenetic recruitments that can be fitted with the model previously described. The values here are and , which are the chosen values for the model.
Videos
Video 1
Example of five protruding (top) and five retracting (bottom) cells activated with optoLARG (white box).
Differential interference contrast (DIC) transmitted light overlayed with TIRFM optoLARG signal in red. Scale bar: 10 μm.
Video 2
Example of a blebbing cell upon optoLARG activation, and two examples of protruding and retracting cells upon optoGEFH1 activation (white box).
Differential interference contrast (DIC) transmitted light overlayed with TIRFM optoLARG signal in red. Scale bar: 10 μm.
Video 3
Actin, myosin, and RhoA biosensor dynamics upon optoLARG activation (white box).
Scale bar: 10 μm.
Video 4
RhoA biosensor dynamics upon two consecutive optoPH activation (white box).
The corresponding signal quantification in the activation region is shown on the right. Scale bar: 10 μm.
Video 5
PBD (Rac1/Cdc42), Cdc42, and Rac1 biosensor dynamics upon optoLARG activation (white box).
Scale bar: 10 μm.
Video 6
Example of a cell protruding upon optoLARG activation (white box), and then retracting upon optoLARG activation (white box) after incubation with 5 µM of IPA.
Differential interference contrast (DIC) transmitted light overlayed with TIRFM optoLARG signal in red. Scale bar: 10 μm.
Video 7
Example of a cell showing the two opposite phenotypes.
The cell first protrude and then contract. Differential interference contrast (DIC) transmitted light overlayed with TIRFM optoLARG signal in red. Scale bar: 10 μm.
Tables
Key resources table
| Reagent type (species) or resource | Designation | Source or reference | Identifiers | Additional information |
|---|---|---|---|---|
| Cell line (Homo sapiens) | hTERT RPE1 (immortalized, normal, female) | ATCC | ATCC Cat# CRL-4000, RRID:CVCL_4388 | |
| Cell line (H. sapiens) | HeLa (adenocarcinoma, female) | ATCC | ATCC Cat# CCL-2, RRID:CVCL_0030 | |
| Transfected construct (H. sapiens) | pLVX: MRLC-iRFP | Coppey lab | Plasmid to label myosin regulatory light chain | |
| Transfected construct (H. sapiens) | pLVX: Lifeact-iRFP | Coppey lab | Plasmid to label polymerizing actin | |
| Transfected construct (H. sapiens) | pLVX: PBD-iRFP | Coppey lab | Plasmid for a biosensor of Rac and Cdc42 activity | |
| Transfected construct (H. sapiens) | pCMV:PRG(DHPH)-RFPt-SspB-P2A-mVenus-iLID-CAAX | Casano lab | Plasmid for an optogenetic construct recruiting the DH–PH of PRG to the membrane | |
| Transfected construct (H. sapiens) | pLL7:PRG(DHPH)-iRFP-SspB-P2A-mVenus-iLID-CAAX | Coppey lab | Plasmid for an optogenetic construct recruiting the DH–PH of PRG to the membrane | |
| Transfected construct (H. sapiens) | pLL7:VenusiLID-CAAX. pCMV:PRG(PH)-iRFP-SspB-P2A-mVenus-iLID-CAAX | Coppey lab | Plasmid for an optogenetic construct recruiting the PH of PRG to the membrane | |
| Transfected construct (H. sapiens) | pCMV:PRG(PH)-RFPt-SspB-P2A-mVenus-iLID-CAAX | Coppey lab | Plasmid for an optogenetic construct recruiting the PH of PRG to the membrane | |
| Transfected construct (H. sapiens) | delCMV-mCherry-3xp67Phox | Dehmelt lab | Plasmid for a biosensor of Rac activity | |
| Transfected construct (H. sapiens) | delCMV-mCherry-WaspGBD | Dehmeltlab | Plasmid for a biosensor of Cdc42 activity | |
| Chemical compound, drug | IPA-3 | Calbiochem | CAS 42521-82-4 | 5 µM |
| Software, algorithm | Python | Python Software Foundation | RRID:SCR_008394 | |
| Software, algorithm | Fiji, ImageJ | RRID:SCR_002285 | ||
| Software, algorithm | MetaMorph | Molecular Devices | RRID:SCR_002368 |
Additional files
Download links
A two-part list of links to download the article, or parts of the article, in various formats.
Downloads (link to download the article as PDF)
Open citations (links to open the citations from this article in various online reference manager services)
Cite this article (links to download the citations from this article in formats compatible with various reference manager tools)
Optogenetic control of a GEF of RhoA uncovers a signaling switch from retraction to protrusion
eLife 12:RP93180.
https://doi.org/10.7554/eLife.93180.4


