Mediodorsal thalamic nucleus mediates resistance to ethanol through Cav3.1 T-type Ca2+ regulation of neural activity
- Institute for Basic Science, Center for Cognition and Sociality, Republic of Korea
- Korea Institute of Science and Technology, Center for Functional Connectomics, Republic of Korea
Figures
Figure 1 with 2 supplements
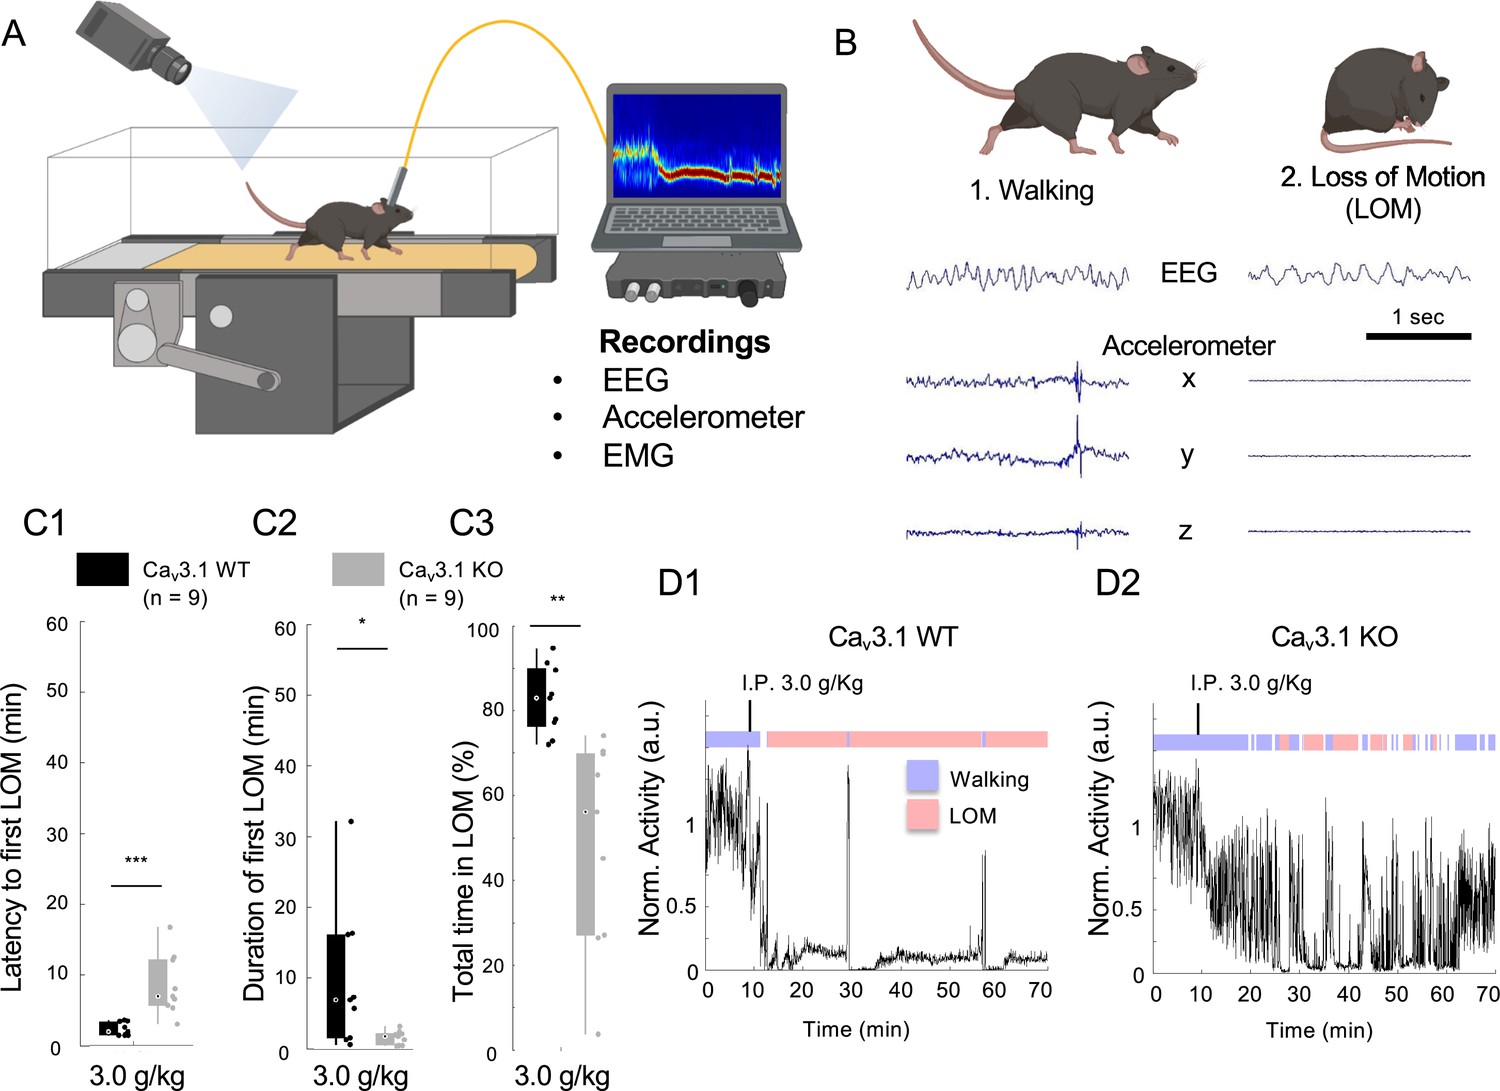
Mice lacking Cav3.1 showed increased ethanol resistance on the forced walking task (FWT).
(A) The schematic of the FWT setup. Mice are habituated and trained on a constantly moving treadmill (6 cm/s). Following a baseline walking recording (~10 min), the mouse is carefully picked up and injected with ethanol (i.p.). Once placed back on the treadmill, the loss of consciousness is evaluated using normalized moving index using either video analysis (differential pixel motion), on-head accelerometer-based motion, or neck electromyograms over a period of 60 min. (B) Representative EEG (parietal) and three-axis accelerometer (Acc) traces for walking and loss of movement (LOM) in a Cav3.1 wild-type (WT) mouse. (C) Quantification for the latency to first LOM (fLOM; i.e. delay between i.p. injection and LOM; C1), the duration of the fLOM (C2), and the total time spent in LOM state (C3) over a recording duration of 60 min following 3.0 g/kg i.p. injection of ethanol in Cav3.1 WT and Cav3.1 knockout (KO) mice; data is represented as boxplot with individual mice as scatter plot. * is for p<0.05, ** is for p<0.01, and *** is for p<0.001. (D) Representative normalized motor activity over time for Cav3.1 WT (D1) and Cav3.1 KO (D2) mice post i.p. injection of 3.0 g/kg. Blue and red boxes above the graph indicate the state interpretation for walking and LOM, respectively.
-
Figure 1—source data 1
Two-way analysis of variance (ANOVA) for latency to and duration of first loss of movement (fLOM), and total time spent in LOM; main factor gene, two levels (Cav3.1 wild-type [WT] and Cav3.1 knockout [KO]); main factor dose, three levels (2.0 g/kg, 3.0 g/kg, and 4.0 g/kg).
- https://cdn.elifesciences.org/articles/93200/elife-93200-fig1-data1-v1.xlsx
Figure 1—figure supplement 1

The forced walking task (FWT) is an uninterrupted assessment of the mouse sedative state equivalent to the loss of righting reflex (LORR).
(A) Representative recording for the FWT with a 10 min baseline walking and 60 min observation after intraperitoneal (i.p.) injection; EEG power spectrogram depicting the typical theta rhythm (4–6 Hz) associated with the ethanol hypnotic state (upper panel), normalized root mean square of accelerometer activity (RMS; bottom panel) and interpreted mouse activity using the normalized RMS (see experimental procedures for details) highlighted in blue (walking) and red (loss of movement; LOM) on a constantly running treadmill (6 cm/s) with plexiglass walls and no resting area; the black tick indicates the time of i.p. injection of ethanol (3.0 g/kg). (B) Latency to and duration of an episode of LORR or LOM shows less variability in FWT assessment with similar values indicating equivalence in assessment power.
Figure 1—figure supplement 2

Cav3.1 mutant mice show a dose-dependent ethanol resistance.
(A) Representative motor activity and loss of motion (LOM) over time for Cav3.1 wild-type (WT) mice post intraperitoneal (i.p.) injection of 2.0, 3.0, and 4.0 g/kg. (B) Representative motor activity and LOM over time for Cav3.1 knockout (KO) mice post i.p. injection of 2.0, 3.0, and 4.0 g/kg. (C) Latency to first LOM (fLOM; C1), duration of the first LOM (C2), and total time spent in LOM state (C3) over a recording duration of 1 hr following 2.0, 3.0, and 4.0 g/kg i.p. injection of ethanol in Cav3.1 WT and Cav3.1 KO mice; data is represented as boxplot with individual mice as scatter plot. Group and dose effects were assessed using a two-way analysis of variance (ANOVA). Post hoc group comparison was performed using a Holm-Sidak correction for multiple comparison. * is for p<0.05, ** is for p<0.01, *** is for p<0.001, and n.s. is for nonsignificant.
Figure 2 with 2 supplements
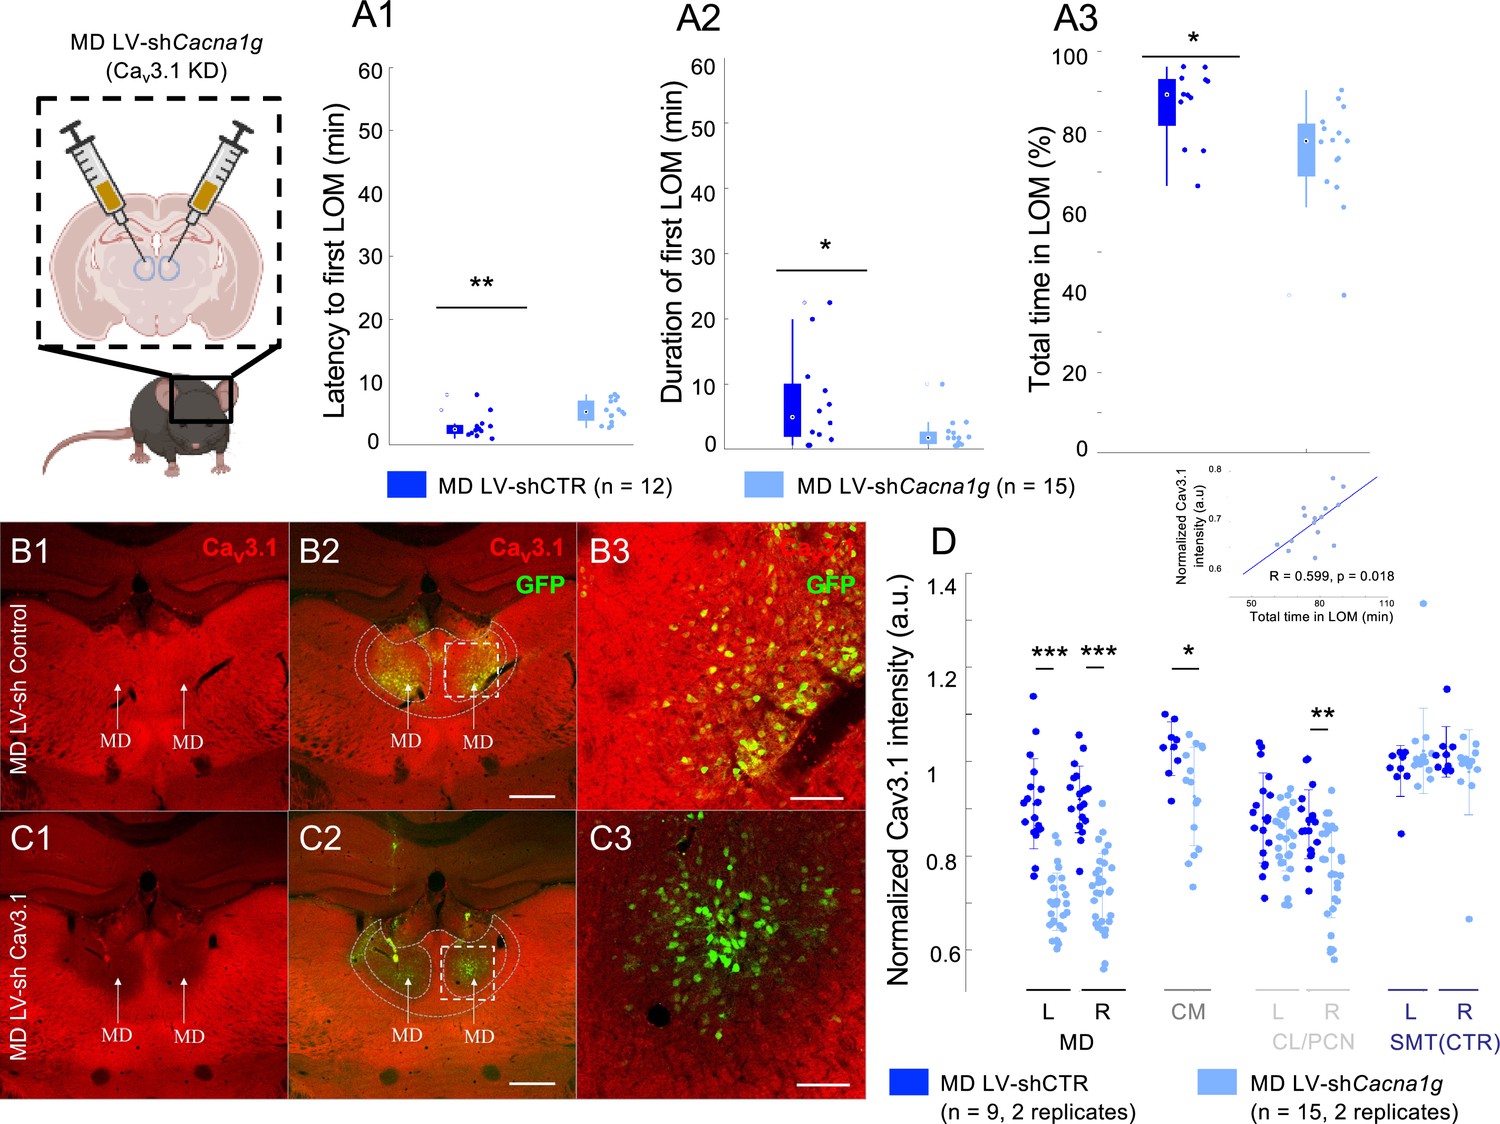
Cav3.1 knockdown in mediodorsal thalamic nucleus (MD) increased ethanol resistance in mice.
(A) Quantification for the latency to first loss of movement (fLOM; A1), the duration of the first LOM (A2), and the total time spent in LOM state (A3) over a recording duration of 60 min post intraperitoneal (i.p.) injection of ethanol (3.0 g/kg) in lentivirus (LV)-shControl and shCacna1g (Cav3.1 knockdown) mice for MD; data is represented as a boxplot with individual mice shown as a scatter plot. * and ** indicate p<0.05 and p<0.01, respectively. (B) Representative brain coronal section stained using Cav3.1 antibody (B1), showing the endogenous thalamic expression of Cav3.1 in the MD of LV-shControl-injected mice; Cav3.1 and GFP merging (B2) and higher magnification of the white dashed square in B2 (B3). Scale bars in (B2) and (B3) indicate 500 μm and 100 μm, respectively. (C) Representative brain coronal section showing the reduced Cav3.1 expression in the MD of LV-shCacna1g (Cav3.1 knockdown) injected mice (C1); Cav3.1 and GFP positive merging (C2) and higher magnification of the white dashed square in C2 (C3). Scale bars in (C2) and (C3) indicate 500 μm and 100 μm, respectively. (D) Normalized Cav3.1 intensity estimated for the nuclei MD, CM (centromedian), CL/PCN (centrolateral/paracentral) and SMT (submedial thalamic nucleus). The quantification was performed as intensity per area for two replicates per side per mouse. *, **, and *** indicate p<0.05, p<0.01, and p<0.001, respectively (two-sample t-test). The data is shown as a scatter plot for all values and superposed with the mean and standard deviation error bars. Inset: We noted a positive correlation between the total LOM duration and the Cav3.1 intensity in MD (R=0.599, p=0.018).
Figure 2—figure supplement 1

Mice with ventrobasal nucleus (VB) Cav3.1 knockdown (KD) did not show increased ethanol resistance.
(A) Latency to first loss of movement (fLOM; A1), duration of the first LOM (A2), and total time spent in LOM state (A3) over a recording duration of 60 min post intraperitoneal (i.p.) injection of 3.0 g/kg i.p. injection of EtOH in lentivirus (LV)-shControl and shCacna1g (Cav3.1 KD) mice for mediodorsal thalamic nucleus (MD); data is represented as boxplot with individual mice as scatter plot. *, **, and n.s. are for p<0.05, p<0.01, and nonsignificant, respectively. (B) Representative brain coronal section stained for Cav3.1 antibody (B1), showing the wide thalamic expression of the T-type calcium channel in the VB LV-shControl-injected mice; Cav3.1 and GFP merging (B2) and higher magnification of the white dashed square in B1–B2 (B3). Scale bars in (B2) and (B3) indicate 500 μm and 100 μm, respectively. (C) Representative brain coronal section stained for Cav3.1 antibody (C1), showing the reduction in T-type calcium channel expression in the VB LV-shCacna1g (Cav3.1 KD) injected mice; Cav3.1 and GFP merging (C2) and higher magnification of the white dashed square in C1––C2 (C3). Scale bars in (C2) and (C3) indicate 500 μm and 100 μm, respectively.
Figure 2—figure supplement 2

Representative activity of mice with Cav3.1 knockdown (KD) in mediodorsal thalamic nucleus (MD) and ventrobasal nucleus (VB).
(A) Representative activity separated in walking (blue) and loss of movement (LOM) (red) over time for MD lentivirus-shControl (A1) and MD lentivirus-shCacna1g (Cav3.1 KD) (A2). (B) Representative activity separated in walking (blue) and LOM (red) over time for VB lentivirus-shControl (B1) and VB lentivirus-shCacna1g (Cav3.1 KD) (B2). (C) Boxplot of total distance moved over 30 min for Cav3.1 wild-type (WT), Cav3.1 knockout (KO), MD LV-shControl, and MD LV-shCacna1g (Cav3.1 KD) mice; * is for p<0.05, ** is for p<0.01, and *** is for p<0.001.
Figure 3 with 2 supplements
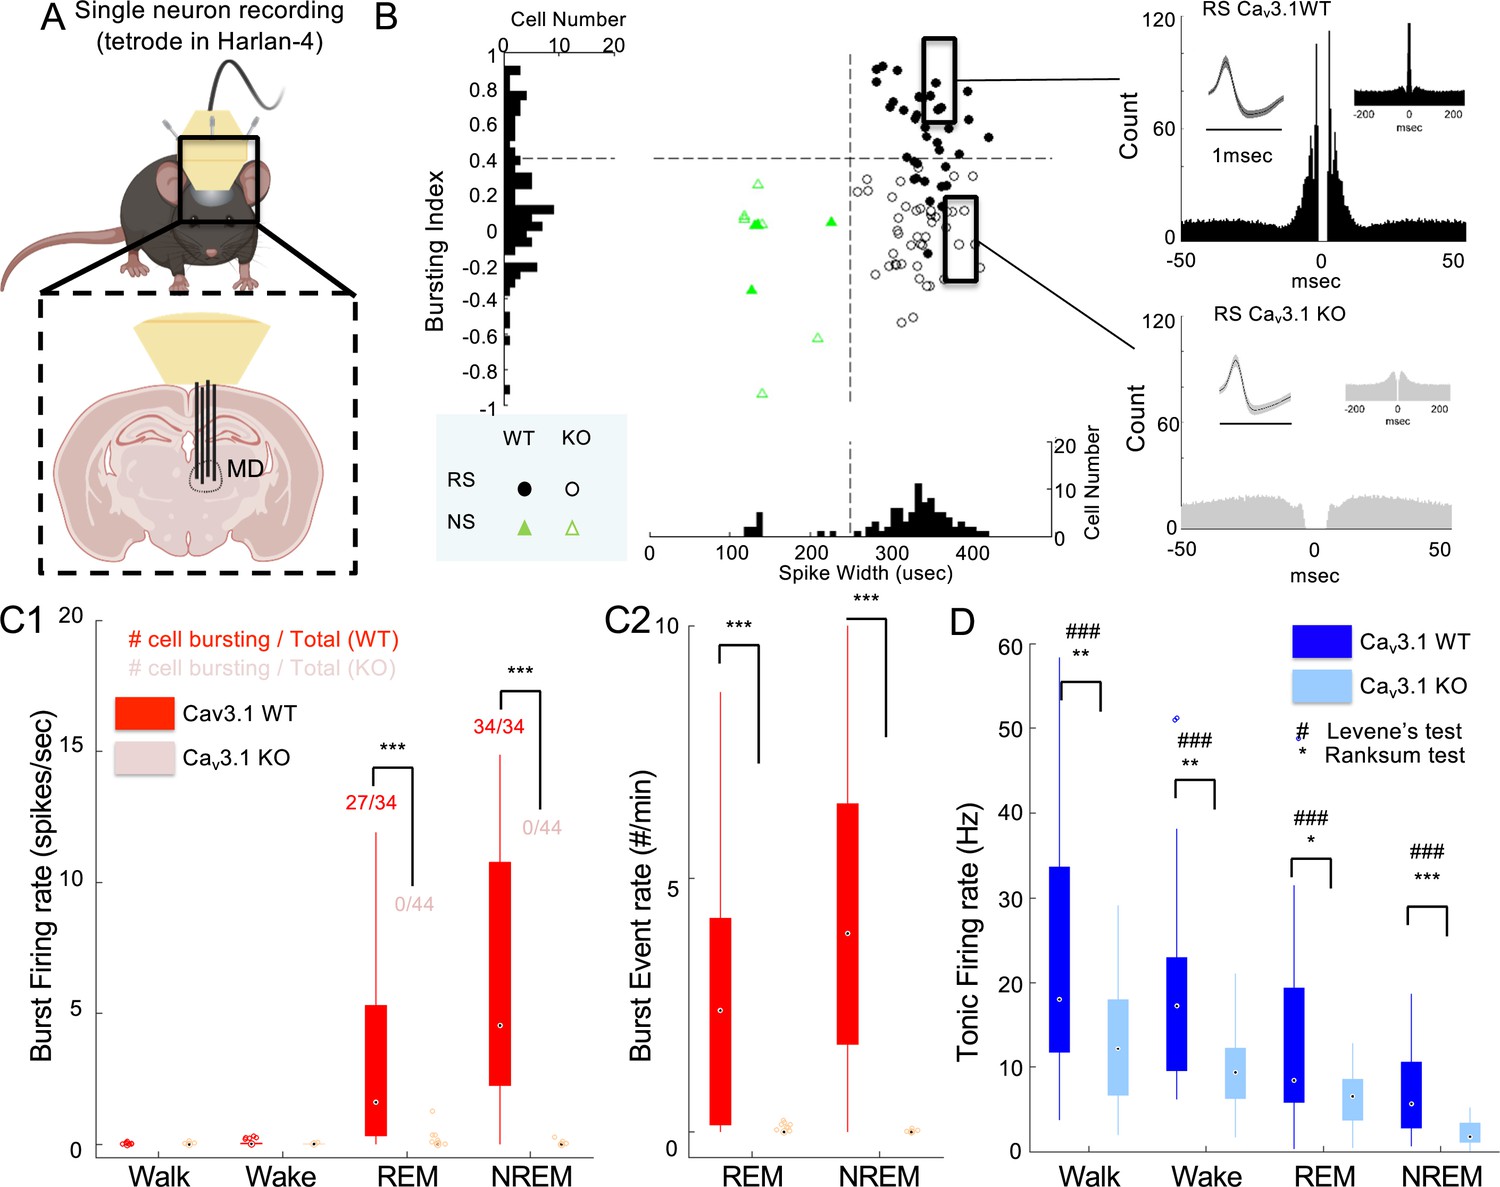
Lack of Cav3.1 removed burst firing and reduced neural activity and its variability in mediodorsal thalamic nucleus (MD) across natural conscious and unconscious states.
(A) Mice were implanted unilaterally with four tetrode wires to record single-unit activity in the MD while in home cage (wake, sleep: non-rapid eye movement [NREM], rapid eye movement [REM]) and forced walking task (FWT) under ethanol (walk). (B - Left panel) Scatter distribution of spike width vs bursting index of MD regular spiking (RS, round shape) and narrow spiking (NS, triangle shape) neurons. Cav3.1 wild-type (WT) and Cav3.1 knockout (KO) neurons are marked as filled and empty shapes, respectively. The histogram of the pooled Cav3.1 WT and Cav3.1 KO distribution is projected on each axis. (B - Right panel) Representative autocross-correlograms of an RS neuron showing the presence and absence of fast spiking interval (burst firing) in Cav3.1 WT and mutant mice, respectively. (C) Boxplots of Cav3.1 wild and mutant burst firing rate (spikes/s; burst spikes-only averaged over a state duration) (C1) and burst event rate (#/min; number of burst events averaged over a state duration; see burst definition in Methods section) (C2) in RS neurons of the MD during NREM sleep, a stage known for the presence of bursting firing mode in thalamic neurons, for Cav3.1 WT and Cav3.1 KO mice. The inset numbers in C1 indicate the number of neurons showing burst firing (more than 1 event in 10 min) over the total number of single neurons identified. (D) Boxplots of Cav3.1 wild and mutant tonic firing rate (spikes/s) in RS neurons of the MD during walking (FWT), wake (home cage), REM and NREM sleep (home cage) for Cav3.1 WT and Cav3.1 KO mice. Group and brain state effect and interaction were assessed using a two-way repeated-measures analysis of variance (ANOVA). For post hoc, two-sample rank-sum test comparison *, **, and *** indicate p-value lower than 0.05, 0.01, and 0.001, respectively. For the two-sample Levene’s test for homoscedasticity, #, ##, and ### indicate p-value lower than 0.05, 0.01, and 0.001, respectively. Pearson’s rank-sum correlations between brain state and total firing for Cav3.1 WT and Cav3.1 KO are indicated above boxplots.
Figure 3—figure supplement 1

Representative positioning of single-unit recording in the mouse mediodorsal thalamic nucleus (MD).
(A) Summary localization of tetrode ending tips in the MD using postmortem histological analysis. Each tetrode wire applied a 10 s 1 mA current to create an electrolesion at the end tip prior to euthanasia. (B) Representative electrolesion in the central (B1) and ventral (B2) MD.
Figure 3—figure supplement 2

Representative putative neurons and burst firing properties in mediodorsal thalamic nucleus (MD).
(A) Representative waveform and autocross-correlogram of a regular spiking (wider spike waveform), expected to represent putative excitatory neurons from Cav3.1 wild-type (WT) (A1) and Cav3.1 knockout (KO) (A2). Representative waveform and autocross-correlogram of a narrow spiking neuron, expected to represent putative inhibitory neurons (central thalamus or projecting parvalbumin neurons from the thalamic reticular nucleus) from Cav3.1 WT (A3) and Cav3.1 KO (A4). (B) Probability of spike per burst estimated during non-rapid eye movement (NREM) and rapid eye movement (REM) sleep in Cav3.1 WT mice. (C) Boxplot of intra-burst inter-spike interval for the five first observed spikes and above. On average, the first four spikes of inter-spike interval (ISI) remain below 6 ms (intra-burst frequency >166 Hz).
Figure 4 with 1 supplement

Resistance to the loss of consciousness in Cav3.1 mutant is associated with maintenance of neural activity and absence of burst.
(A) Representative time plot for, from top to bottom, the normalized activity, single-unit raster plot (blue and red dots for tonic and burst firing, respectively), population mean firing (spikes/s), and burst-to-total spike ratio (%) for Cav3.1 wild-type (WT) (A1) and Cav3.1 knockout (KO) mice (A2). (B) Boxplots of Cav3.1 wild and mutant burst firing rate (spikes/s) (B1) and burst event rate (#/min) (B2) in regular spiking (RS) neurons of the mediodorsal thalamic nucleus (MD) during forced walking task (FWT) walk (pre intraperitoneal [i.p.] injection) and during FWT first loss of movement (fLOM, post i.p. injection) for Cav3.1 WT and Cav3.1 KO mice. The inset numbers in B1 indicate the ratio of the number of neurons showing burst firing over total neurons. Multiple comparisons were performed using two-sample rank-sum test or paired signed-rank test with Holm-Bonferroni correction. *** indicates a p-value<0.001. (C) Boxplots of tonic firing rate (spikes/s) in RS neurons of the MD during FWT walk (pre i.p. injection) and during FWT fLOM (post i.p. injection) for Cav3.1 WT and Cav3.1 KO mice. Group and brain state effect and interaction were assessed using a two-way repeated-measures analysis of variance (ANOVA). Post hoc multiple comparison performed using two-sample rank-sum test or paired signed-rank test with Holm-Bonferroni correction. *** indicates a p-value<0.001. (D) Normalized Z-score firing during fLOM with respect to wake state (home cage) firing (D1) mean and standard deviation is shown for WT (n = 31) and KO (n = 33). WT and mutant distribution and cell count based on fLOM Z-score showing increase (>1.96), no change (<1.96 and >−1.96) or decrease (<−1.96) in firing in Cav3.1 WT and Cav3.1 KO mice (D2). (E) UMAP (uniform manifold approximation and projection) two-dimensional representation of wakeful states (walk: +symbol; wake: x symbol; left panel), sleep states (rapid eye movement [REM]: empty triangle symbol; non-rapid eye movement (NREM): empty round symbol; middle panel) and fLOM state (filled round symbol; right panel) of Cav3.1 WT (blue symbols) and Cav3.1 KO (red symbols) mice. The all-state overlay is depicted on the far-right panel.
Figure 4—figure supplement 1

Mediodorsal thalamic nucleus (MD) neuron activity remains within wakefulness level during first loss of movement (fLOM) in Cav3.1 mutant.
(A) Mean MD firing Z-score traces (normalized with respect to wakeful state) during walking and fLOM for wild-type (WT) (A1) and mutant mice (A2); data is represented as mean ± s.e.m.; dashed lines represent Z-score significance level Z = ±1.96. (B) Distribution of tonic firing rate of MD regular spiking (RS) neurons of Cav3.1 WT during walk (B1), wake (B2), and fLOM (B3) and Cav3.1 knockout (KO) during walk (B4), wake (B5), and fLOM (B6) mice; inner panels in B1, B2, and B3 represent the comparative plot of cumulative distribution of tonic firing between WT and mutant MD RS neurons.
Figure 5 with 5 supplements
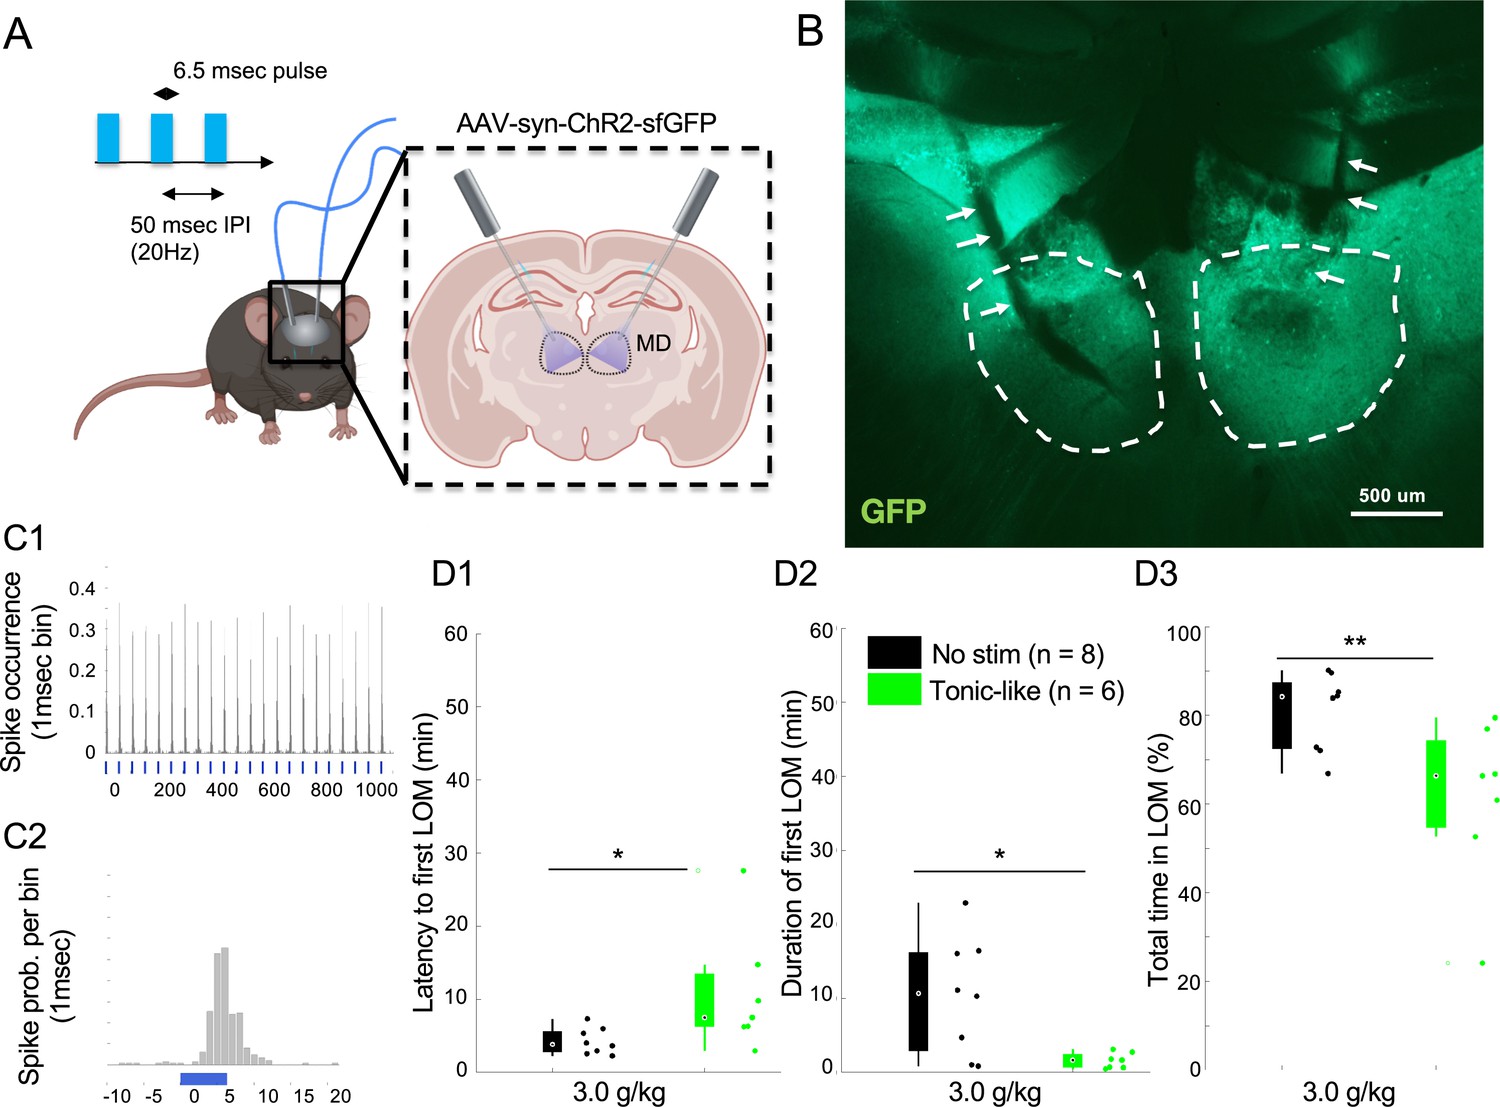
Optogenetic 20 Hz stimulation of mediodorsal thalamic nucleus (MD) in wild-type (WT) mice mimics ethanol resistance.
(A) Mice were transduced bilaterally in the MD with an AAV-SYN-CHR2-sfGFP and implanted with bilateral optic fibers targeting MD with an entry angle of 30 degree relative to the sagittal plane. We used a stimulation protocol of tonic-like pulses at 20 Hz with 50 ms inter-pulse interval (IPI) and 6.25 ms pulse duration. (B) Representative expression of ChR2-sfGFP in the MD (dashed white lines) with fiber optic ending (white arrows). (C) In vivo response of MD regular spiking (RS) neurons to the 20 Hz tonic stimulation protocol using 6.25 ms pulse at 20 Hz and laser power of 6.0 mW (C1); magnification of the peristimulus response of the neuron around the laser pulse (1 ms bin; C2). (D) Latency to first loss of movement (LOM) (D1), duration of the first LOM (D2), and total time spent in LOM state (D3) over a recording duration of 1 hr post i.p. injection of 3.0 g/kg of ethanol are shown for the control group (no stim) and stimulated group (tonic-like). * is for p<0.05, ** is for p<0.01, *** is for p<0.001. Data is represented as boxplot with individual mice as scatter plot.
Figure 5—figure supplement 1

Optogenetic stimulation-induced sustained response in mediodorsal thalamic nucleus (MD).
(A) Evoked spike response during optogenetic stimulation of MD regular spiking (RS) neurons for 300 trial/stimulation at 20 Hz (pulse width = 6.25 s). (B) Peri-stimulus histogram (PSTH) of the evoked response shown in using a 1 ms bin. (C) Boxplot of total distance moved over 30 min for no stimulation and tonic-like stimulation; * is for p<0.05, ** is for p<0.01, and *** is for p<0.001. (D) Coronal section showing lesion at the site of tetrode recording (white arrow) and puncture due to optical fiber cannula (gray arrows); green fluorescence indicates GFP expression after syn-AAV9-ChR2-sfGFP virus infection. (E) Success rate of stimulation estimated for the protocol of different frequencies stimulation; data is represented as mean ± s.e.m. (F) Estimation of delay between laser pulse onset (time equal 0) and the first evoked spikes for different frequency stimulation; data is represented as mean ± s.e.m.; the gray horizontal line indicates the end of the laser pulse.
Figure 5—figure supplement 2

Positioning summary of optic fiber cannula used for optogenetic stimulation.
(A) Summary of optic fiber cannula positioning used for bilateral optogenetic stimulation of Cav3.1 wild-type (WT) mice injected with syn-AAV9-ChR2-sfGFP. (B) Representative GFP images of ChR2-sfGFP expression and optic fiber cannula position (white arrows).
Figure 5—figure supplement 3

Positioning summary of electrodes used for electric stimulation.
(A) Summary of positioning used for bilateral bipolar electrical stimulation of Cav3.1 wild-type (WT) mice. (B) Representative bright-field images of stimulation electrode positioning.
Figure 5—figure supplement 4

Electrical 20 Hz stimulation of the mediodorsal thalamic nucleus (MD) increases ethanol resistance in wild-type (WT) mice.
(A) Electric stimulation protocol for the 20 Hz (tonic-like) and burst-like stimulation. (B) Latency to first loss of movement (LOM) (B1), duration of the first LOM (B2) and total time spent in LOM state, data is represented as boxplot with individual mice as scatter plot. (B3) over a recording duration of 1 hr post intraperitoneal (i.p.) injection of 3.0 g/kg of ethanol for optogenetic stimulation. * is for p<0.05, ** is for p<0.01, *** is for p<0.001, and n.s. is for nonsignificant.
Figure 5—figure supplement 5

1 s ON-OFF optogenetic inhibition of mediodorsal thalamic nucleus (MD) increases loss of movement (LOM) duration in wild-type (WT) mice.
(A) WT mice were transduced with an AAV-syn-ARCH3.0-eYFP to express archaerhodopsin and implanted with bilateral optic fibers as in the channelrhodopsin experiment. A phasic stimulation of 1 s ON-OFF was then performed to promote inhibition and possible rebound burst (Paz et al., 2013; Abdelaal et al., 2022). A lower dose of ethanol (2.0 g/kg) was used to test the prolongation of the hypnotic effect by the phasic inhibition of MD. (B) Latency to (B1), duration of (B2), and total time in LOM. Data is represented as boxplot with individual mice as scatter plot.
Additional files
Download links
A two-part list of links to download the article, or parts of the article, in various formats.
Downloads (link to download the article as PDF)
Open citations (links to open the citations from this article in various online reference manager services)
Cite this article (links to download the citations from this article in formats compatible with various reference manager tools)
Mediodorsal thalamic nucleus mediates resistance to ethanol through Cav3.1 T-type Ca2+ regulation of neural activity
eLife 13:RP93200.
https://doi.org/10.7554/eLife.93200.3


