Glutamate neurotransmission from leptin receptor cells is required for typical puberty and reproductive function in female mice
- Department of Molecular and Integrative Physiology, University of Michigan–Ann Arbor, United States
- Elizabeth W. Caswell Diabetes Institute, University of Michigan–Ann Arbor, United States
- Department of Internal Medicine, Division of Metabolism, Endocrinology and Diabetes, University of Michigan–Ann Arbor, United States
- Department of Obstetrics and Gynecology, University of Michigan–Ann Arbor, United States
Figures
Figure 1
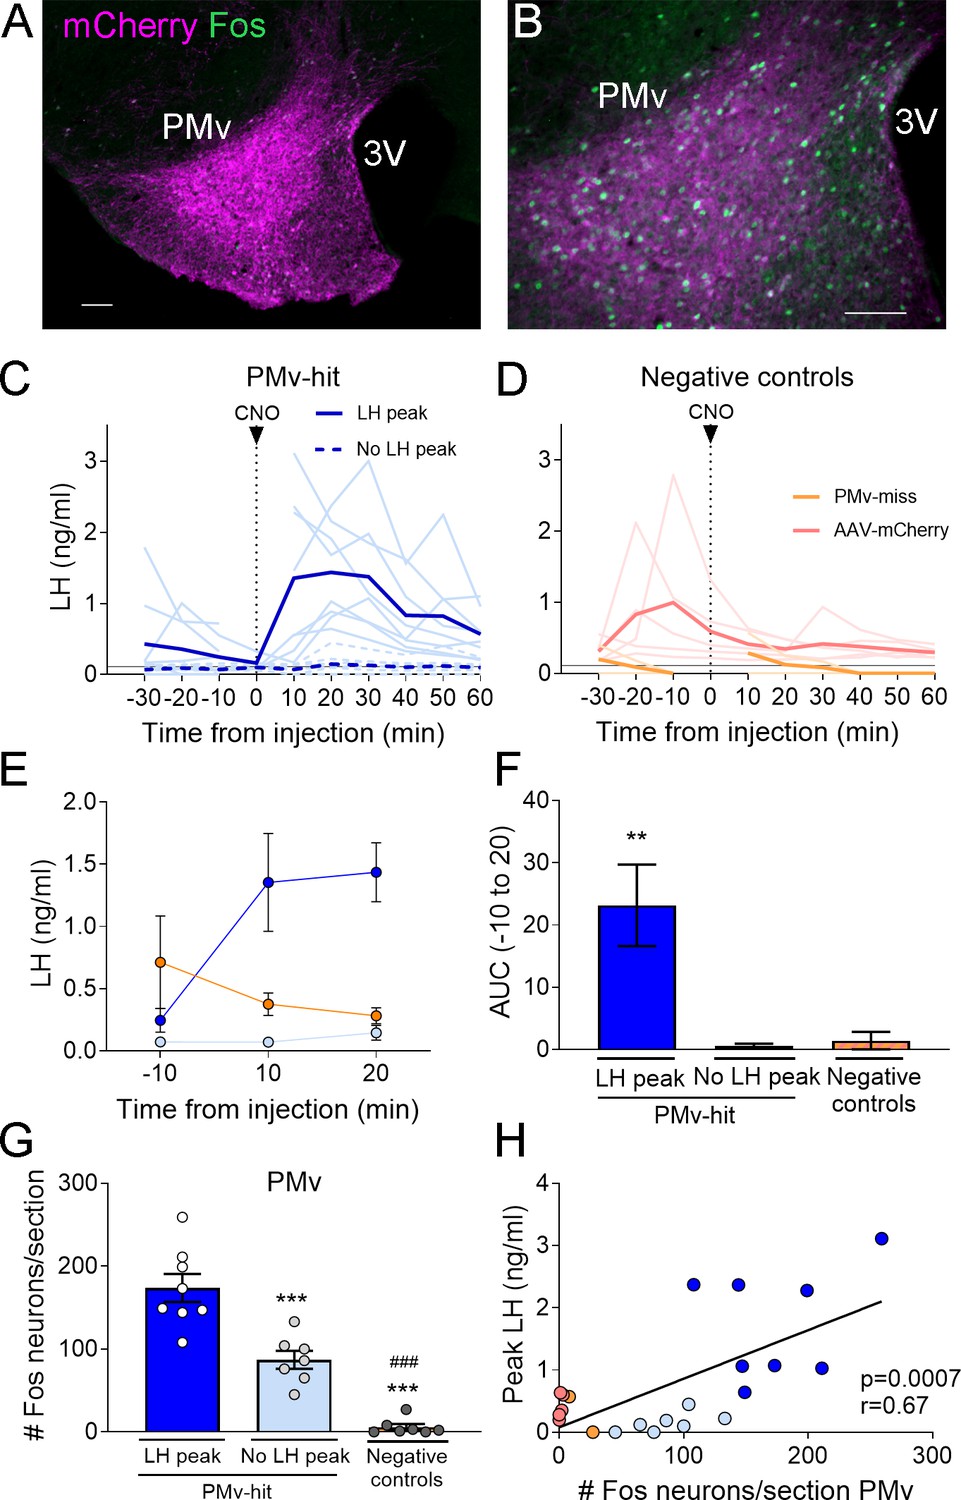
Chemogenetic activation of leptin receptor neurons in the ventral premammilary nucleus (PMv) induces luteinizing hormone (LH) release.
(A, B) Representative fluorescent photomicrographs of unilateral AAV-hM3Dq PMv injection. Low (A) and high (B) magnification of an animal correctly targeted to the PMv. Magenta: mCherry-immunoreactivity (-ir); green: Fos-ir. (C) LH levels in ‘PMv-hit’ animals unilaterally expressing hM3Dq in the PMv following an intravenous (iv.) injection of clozapine-N-oxide (CNO) at time = 0 (n = 15). Continuous lines: animals showing an increase in LH had maximum LH levels ranging from 0.65 to 3.11 ng/ml. Dashed lines: animals showing no detectable increase in LH. Light blue lines represent individual values. Dark blue lines represent averaged values. (D) LH levels in negative control animals (n = 7), including ‘PMv-miss’ (orange) and AAV-mCherry (pink) animals following an iv. injection of CNO at time = 0. Light colored lines represent individual values. Dark colored lines represent average values. A gap is shown in the LH profile lines in animals that had a missing value at time 0 in C and D. (E) Average LH levels at −10, 10, and 20 min for all three groups: ‘PMv-hit’ with LH increase (n = 8, dark blue), ‘PMv-hit’ with no LH increase (n = 7, light blue), negative controls (including ‘PMv-miss’ and AAV-mCherry, n = 7, orange). (F) Positive area under the curve (AUC) of the values represented in E. One-sample t-tests (‘PMv-hit’ with LH increase: t7 = 3.54, p = 0.009; ‘PMv-hit’ with no LH increase: t6 = 1.37, p = 0.22; negative controls: t6 = 1.00, p = 0.36), **p < 0.01 compared to ‘0’. (G) Number of Fos-ir neurons per section in the PMv in ‘PMv-hit’ animals with (n = 9) or without (n = 7) an increase in LH and in negative control animals, including ‘PMv-miss’ and AAV-mCherry animals (n = 7) 2 hr after the CNO injection (one-way analysis of variance [ANOVA], F2,19 = 81.66; p < 0.0001). **p < 0.01 and ***p < 0.001 vs. PMv-hit LH increase group; ###p < 0.001 vs. PMv-hit no LH increase group. (H) Correlation between the number of Fos-ir neurons per section in the PMv and the peak LH level in the three groups (Pearson r = 0.67; p = 0.0007). 3V: third ventricle. Scale bars: 100 µm.
Figure 2
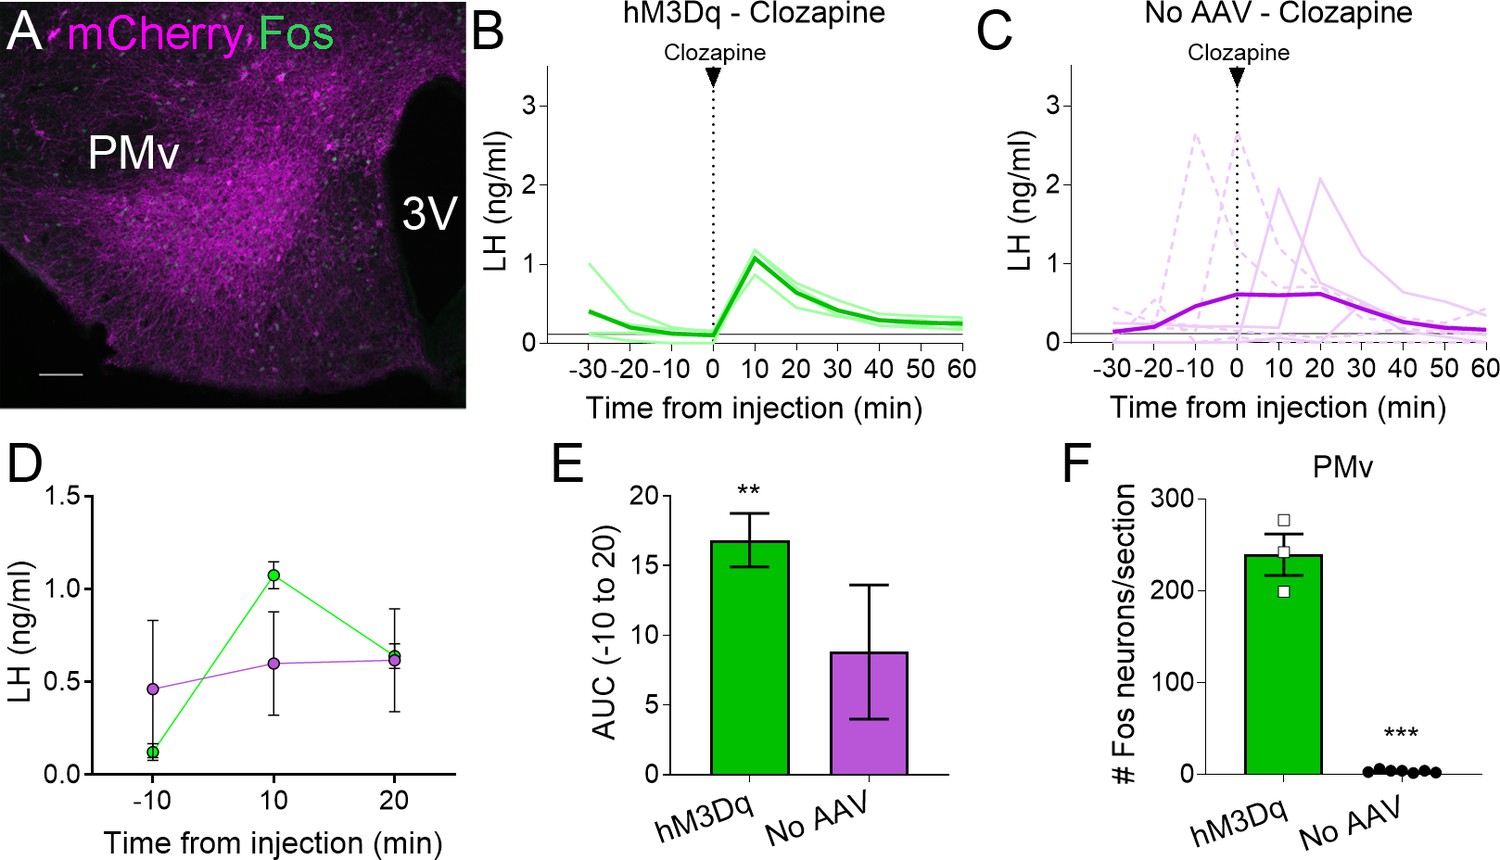
Clozapine induces Fos expression in the ventral premammillary nucleus (PMv) of animals expressing hM3Dq and luteinizing hormone (LH) release.
(A) Representative fluorescent photomicrograph of a unilateral AAV-hM3Dq PMv injection in a clozapine injected animal. Magenta: mCherry-immunoreactivity (-ir); green: Fos-ir. (B) LH levels in animals unilaterally expressing hM3Dq in the PMv following an intravenous (iv.) injection of clozapine at time = 0 (n = 4). Light green lines represent individual values. Dark green line represents averaged values. (C) LH levels in animals not carrying any AAV following an iv. injection of clozapine at time = 0 (n = 7). Light magenta lines represent individual values. Dark magenta line represents averaged values. Continuous lines: animals with LH increase after the injection. Discontinuous lines: animals with no increase in LH after the injection. (D) Average LH levels at −10, 10, and 20 min for both groups injected with clozapine. hM3Dq: green; No AAV: magenta. (E) Positive area under the curve (AUC) of the values represented in D. One-sample t-tests (hM3Dq: t3 = 8.79, p = 0.003; No AAV: t6 = 1.83, p = 0.12), **p < 0.01 compared to ‘0’. (F) Number of Fos-ir neurons per section of the PMv in AAV-hM3Dq and no AAV animals 2 hr after a clozapine injection (t8 = 17.46; p < 0.0001). ***p < 0.001. 3V: third ventricle. Scale bars: 100 µm.
Figure 3
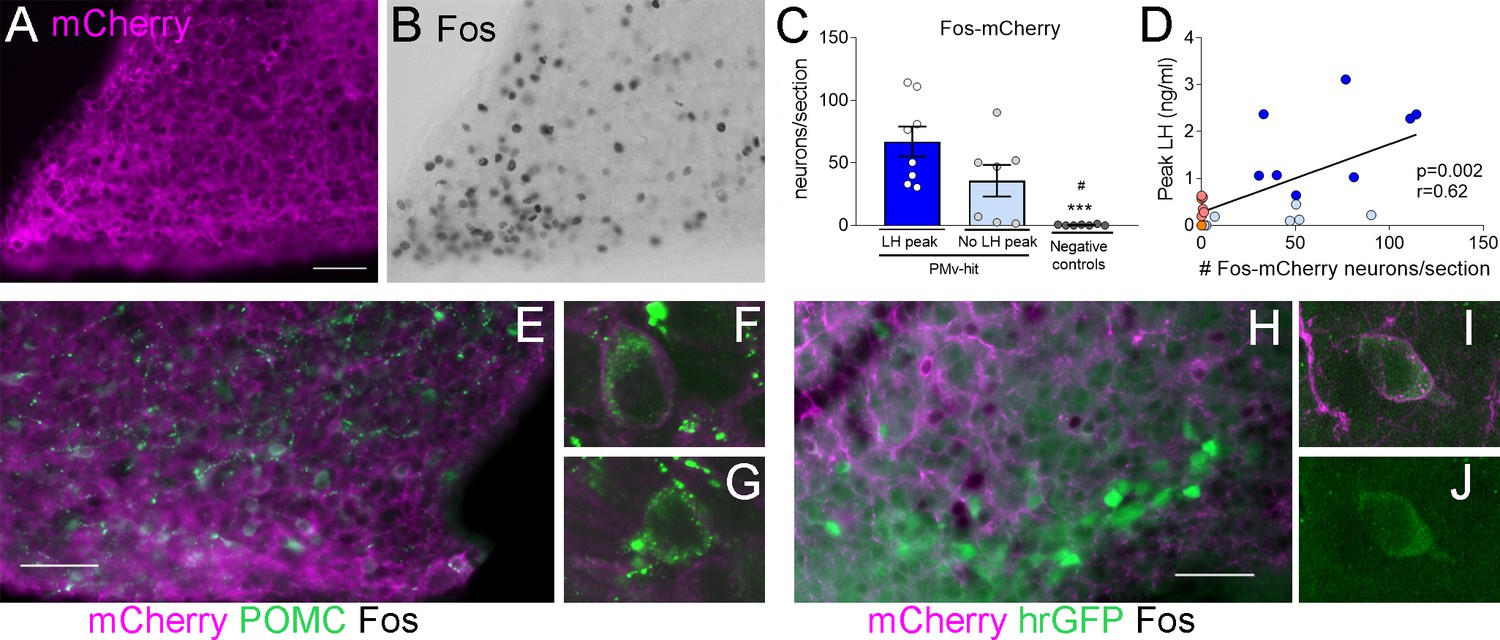
Clozapine-N-oxide (CNO) induction of luteinizing hormone (LH) secretion may have a mild contribution of pro-opiomelanocortin (POMC), but not KNDy, neurons.
Representative images of (A) mCherry-immunoreactivity (-ir) and (B) Fos-ir of an animal with strong AAV contamination of the posterior Arc. (C) Number of Fos-ir neurons with mCherry-ir colocalization per section in the posterior Arc in the three groups 2 hr after the CNO injection. (Kruskal–Wallis test = 14.63; p < 0.0001), ***p < 0.001 vs. PMv-hit LH increase group, #p < 0.05 vs. PMv-hit no LH increase group. (D) Correlation between the number of mCherry-/Fos-ir neurons observed in the posterior Arc and the peak LH level in the three groups (Pearson r = 0.62; p = 0.002). (E) POMC-ir (green) in a mouse with viral contamination of the posterior Arc. Arrows: Fos-ir neurons (black) that coexpressed POMC and mCherry (magenta). Arrowheads: Fos-ir neurons that coexpressed POMC, but no mCherry, (F) Confocal high magnification image of a Fos-ir neuron coexpressing POMC and mCherry. (G) Confocal high magnification image of a Fos-ir neuron coexpressing POMC, but not mCherry. (H) GFP-ir (green) in a Kiss1hrGFP animal with viral contamination of the posterior Arc. Arrows: Fos-ir (black) neurons that coexpressed Kiss1hrGFP (green) and mCherry (magenta). (I, J) Confocal high magnification images of a Fos-ir neuron (arrow in H) coexpressing Kiss1hrGFP (green) and mCherry (magenta). Scale bars: 50 µm.
Figure 4
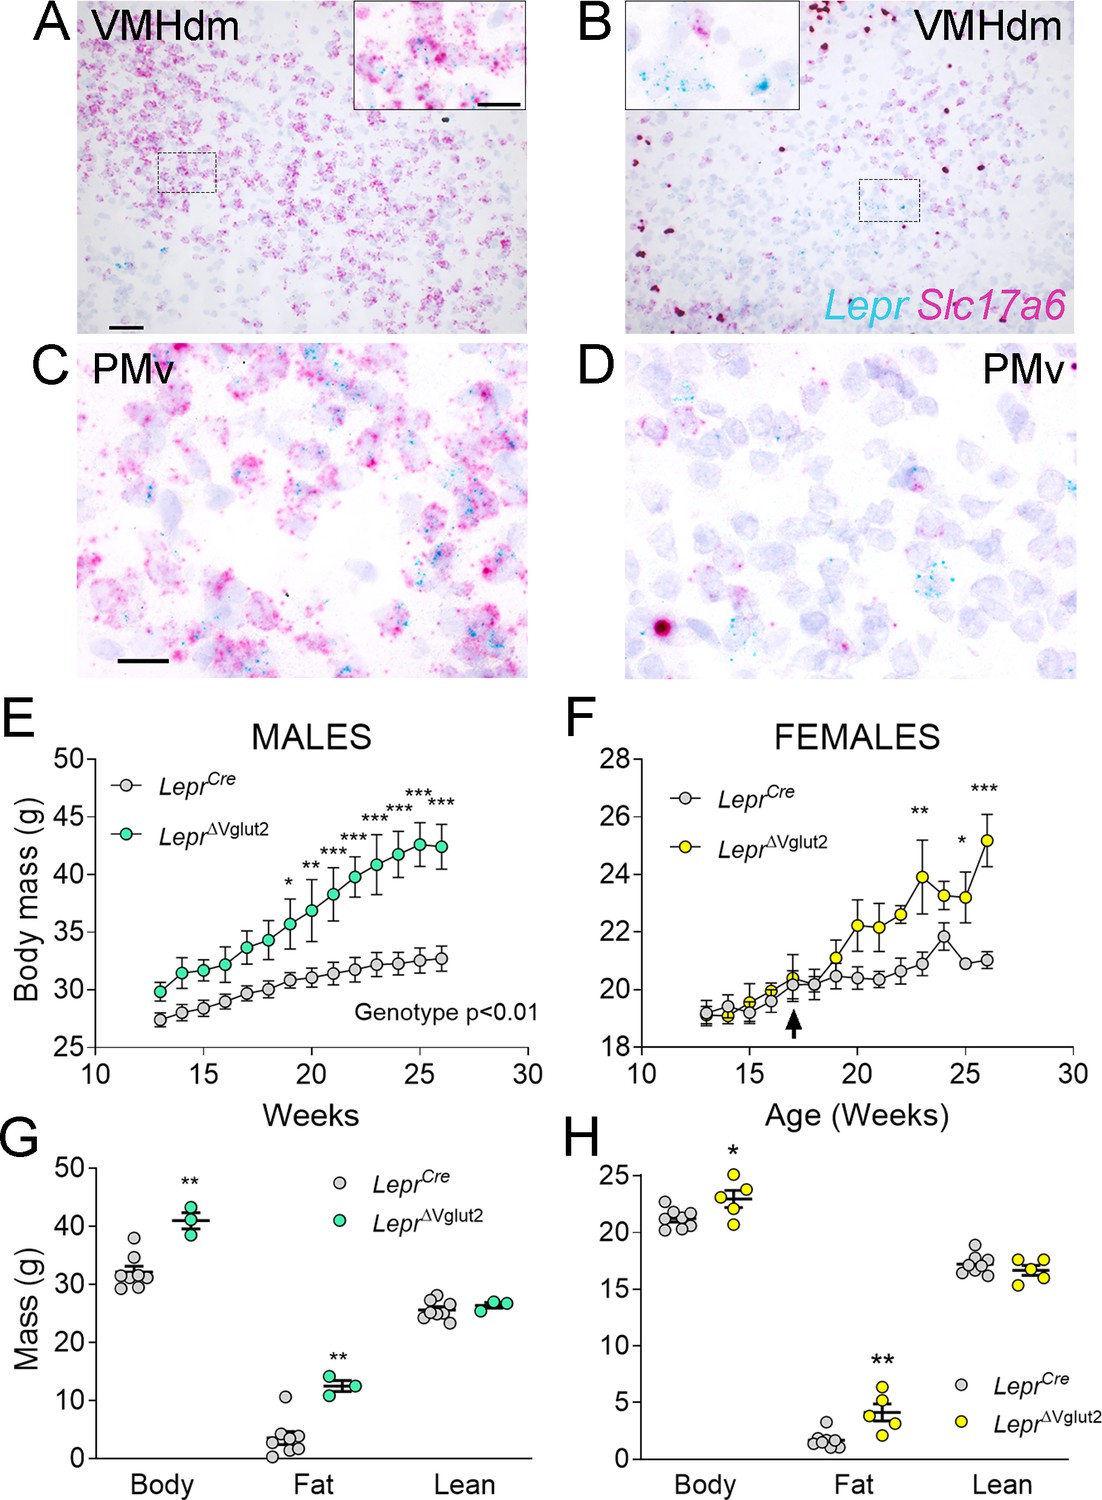
Adult LeprΔVglut2 animals show an obese phenotype.
(A–D) Micrographs of in situ hybridization showing colocalization between Lepr (cyan) and Slc17a6 (magenta) gene expression. Dorsomedial region of the ventromedial hypothalamic nucleus (VMHdm) in control LeprCre (A), but no colocalization in experimental LeprΔVglut2 (B) females. Insets show high magnification images for the area in the dashed rectangles (C, D). Ventral premammillary nucleus (PMv) at large magnification in control LeprCre (C), and experimental LeprΔVglut2 (D). Scale bars: 50 µm for A, B and 20 µm for insets and C, D. (E) Body mass in adult LeprCre and LeprΔVglut2 males (genotype main effect; F1,10 = 13.1; p = 0.0047, post hoc comparison: week 20: t140 = 3.27; p = 0.019; week 26: t140 = 5.47; p < 0.0001). (F) Body mass in adult LeprCre and LeprΔVglut2 females (genotype main effect; F1,11 = 4.34; p = 0.06; post hoc comparisons: week 23: t154 = 4.05; p = 0.0011; week 25: t154 = 3.1; p = 0.03; week 26: t154 = 5.59; p < 0.0001). The arrow indicates the age at which estrus cycling follow-up finished in this cohort. (G) Body composition in males (fat mass: t9 = 3.77; p = 0.004) and (H) in females (fat mass: t11 = 3.7; p = 0.0035). *p < 0.05, **p < 0.01, ***p < 0.001.
-
Figure 4—source data 1
All data measured and analyzed for Figure 4.
- https://cdn.elifesciences.org/articles/93204/elife-93204-fig4-data1-v1.xlsx
Figure 5
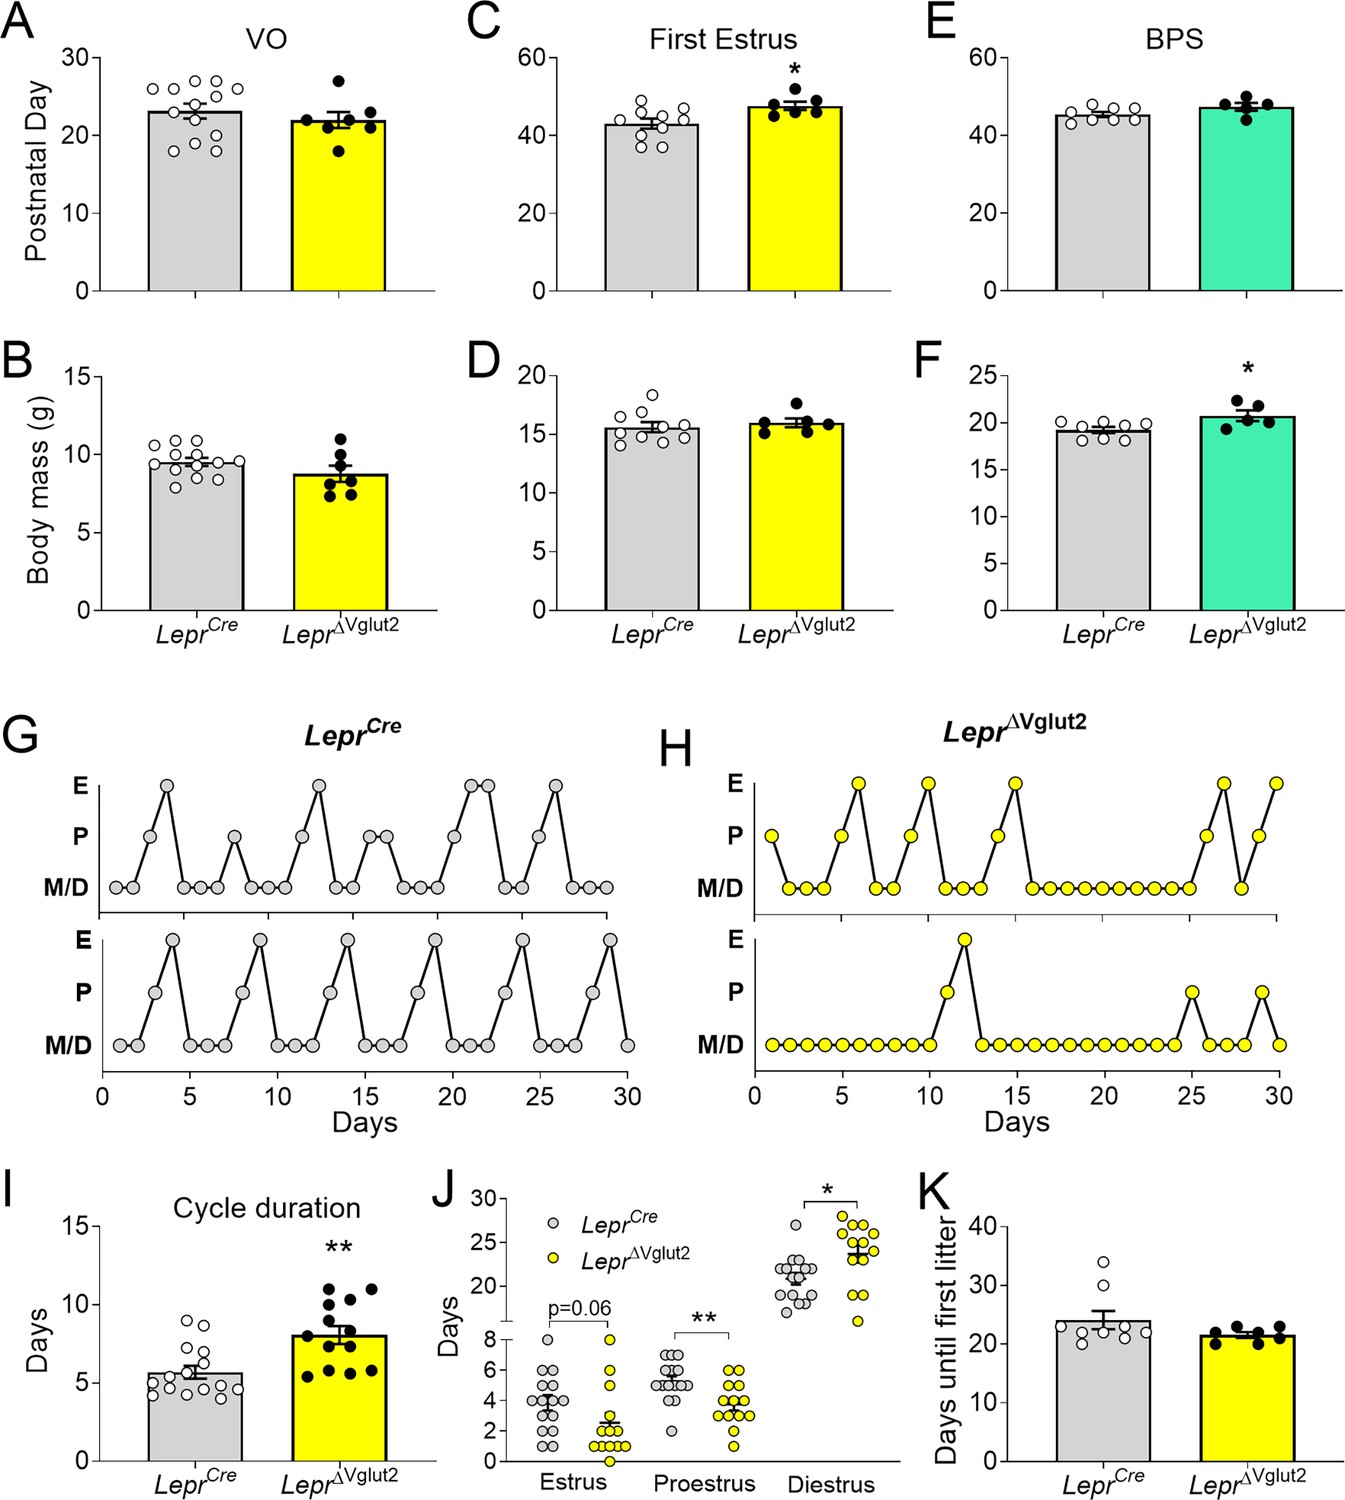
Reproductive development and estrus cycles are altered in LeprΔVglut2 females.
(A) Age of vaginal opening (VO; t18 = 0.84; p = 0.41) and (B) body mass at vaginal opening (VO) (t18 = 1.47; p = 0.16) in females. (C) Age of first estrus (t14 = 2.45; p = 0.028) and (D) body mass at first estrus (t14 = 0.59; p = 0.56) in females. (E) Age of complete balanopreputial separation (BPS; t11 = 1.80; p = 0.1) and (F) body mass at BPS (t11 = 2.43; p = 0.033) in males. (G) Representative estrus cycle profiles from control LeprCre and (H) experimental LeprΔVglut2 females (E: estrus, P: proestrus, M/D: metestrus/diestrus). (I) Cycle duration in adult females (t25 = 3.71; p = 0.001). (J) Time spent in each phase of the cycle during the 30 days studied. Estrus (t26 = 1.97; p = 0.059), proestrus (t26 = 2.81; p = 0.009), and diestrus (t26 = 2.39; p = 0.024). (K) Days spent from mating until the first litter was observed in females paired with proven male breeders (Mann–Whitney test; p = 0.32). *p < 0.05, **p < 0.01.
-
Figure 5—source data 1
All data measured and analyzed for Figure 5.
- https://cdn.elifesciences.org/articles/93204/elife-93204-fig5-data1-v1.xlsx
Figure 6
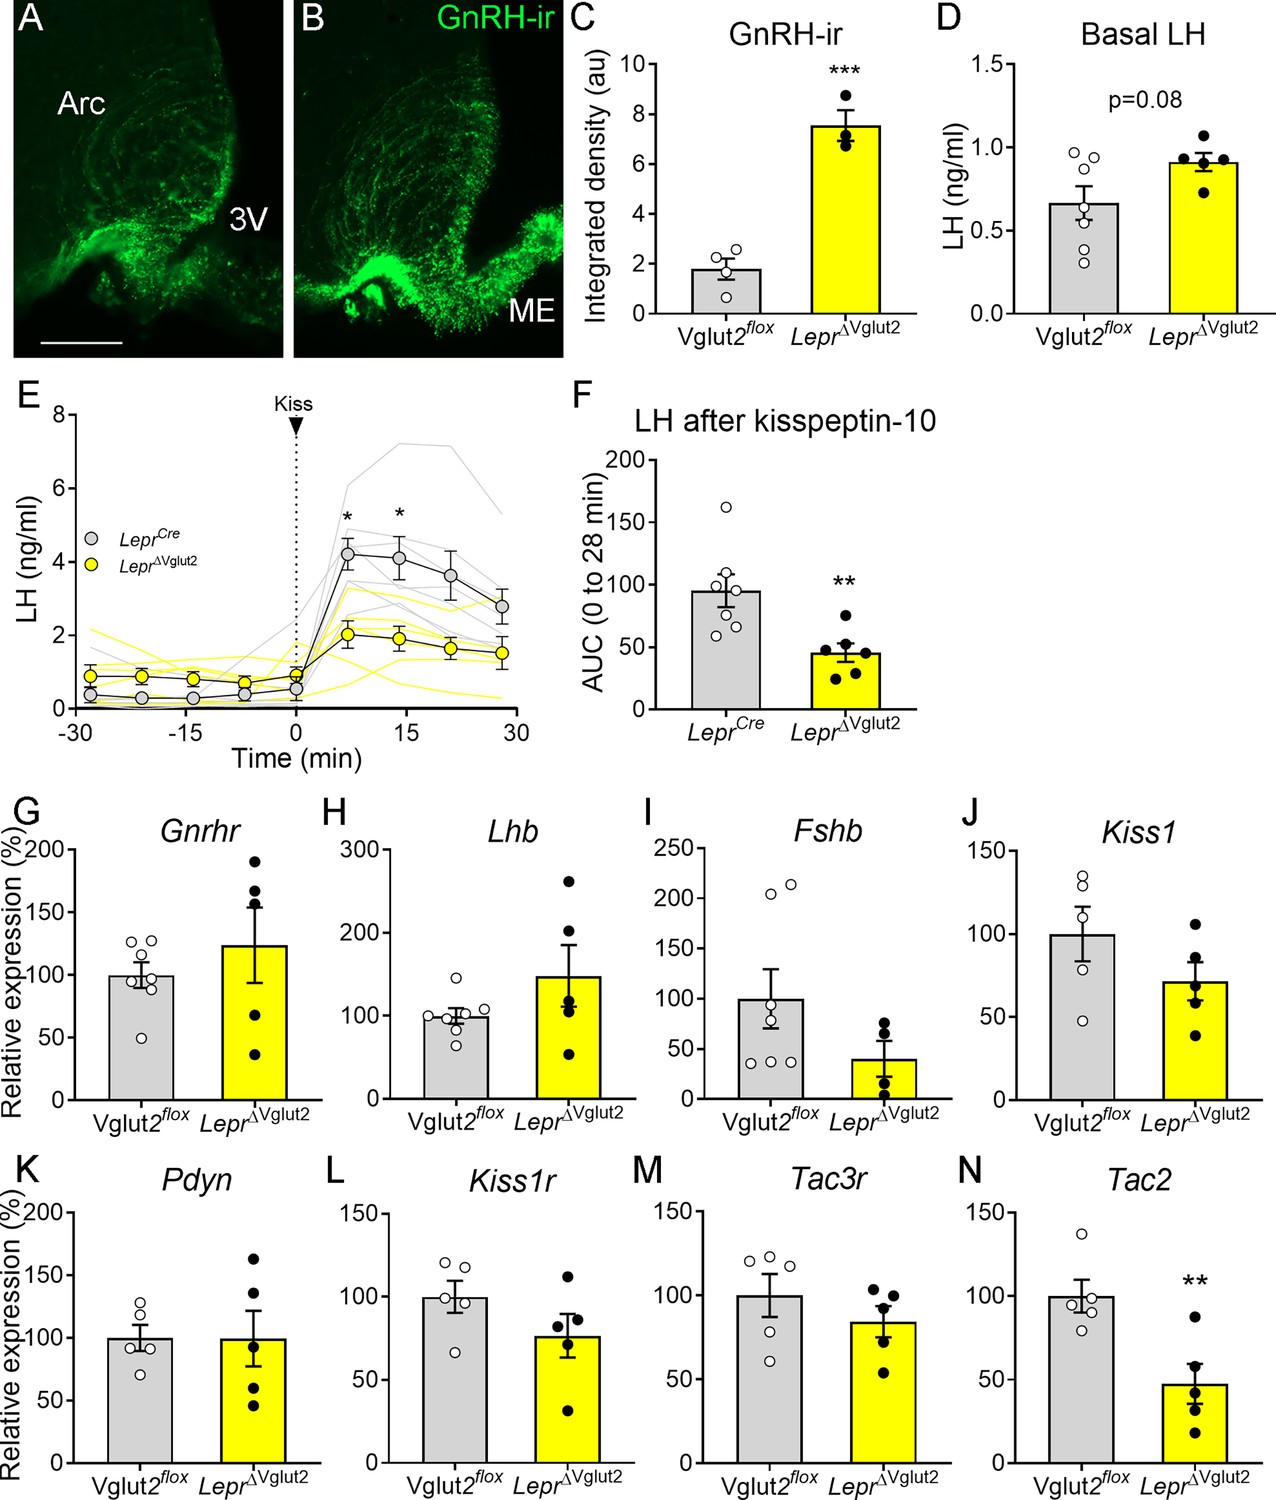
Gonadotropin-releasing hormone (GnRH) content in terminals and luteinizing hormone (LH) secretion are altered in LeprΔVglut2 female mice.
Representative fluorescent photomicrograph of GnRH-immunoreactivity (-ir) in the arcuate nucleus (Arc) and median eminence (ME) in (A) control Vglut2flox and (B) LeprΔVglut2 diestrous females. Scale bar: 100 µm. (C) GnRH-ir integrated density in the Arc in Vglut2flox (n = 4) and LeprΔVglut2 (n = 3) females (t5 = 8.01; p = 0.0005). (D) Basal LH levels in Vglut2flox (n = 7) and LeprΔVglut2 (n = 5) females (t10 = 1.91; p = 0.08). (E) LH levels in LeprCre (n = 7) and LeprΔVglut2 (n = 6) females before and after a kisspeptin-10 (65 µ/kg) intraperitoneal (ip.) injection of kisspeptin at time = 0. Light gray: individual LeprCre females, Light yellow: individual LeprΔVglut2 females. After the injection (time 7–28), LH levels were higher in control than in floxed females Mixed effects model: main effect for ‘time’ F1.14, 12.19 = 15.91, p = 0.001; ‘genotype’ F1, 11 = 8.26, p = 0.015; ‘time × genotype’ interaction: F3, 32 = 5.00, p = 0.006; Sidak’s post hoc effect for 7 min (t10.97 = 3.79, p = 0.01) and for 14 min (t9.4 = 3.22, p = 0.04). (F) Area under the curve (AUC) of LH levels after the kisspeptin injection (t11 = 3.14; p = 0.009). (G) Gnrhr (t10 = 0.86, p = 0.41), (H) Lhb (t10 = 1.47, p = 0.17), and (I) Fshb (t9 = 1.63, p = 0.14) relative to Actin B (Actb) mRNA levels in the pituitary of Vglut2flox (n = 7) and LeprΔVglut2 (n = 5) females. (J) Kiss1 (t8 = 1.42, p = 0.19), (K) Pdyn (t8 = 0.02; p = 0.98), (L) Kiss1r (t8 = 1.44, p = 0.19), (M) Tac3r (t8 = 0.99, p = 0.35) and (N) Tac2 (t8 = 3.39, p = 0.009), relative to β-2-microglobulin (B2m) mRNA levels in the mediobasal hypothalamus of Vglut2flox (n = 5) and LeprΔVglut2 (n = 5) females. *p < 0.05; **p < 0.01; ***p < 0.001.
-
Figure 6—source data 1
All data measured and analyzed for Figure 6.
- https://cdn.elifesciences.org/articles/93204/elife-93204-fig6-data1-v1.xlsx
Figure 7
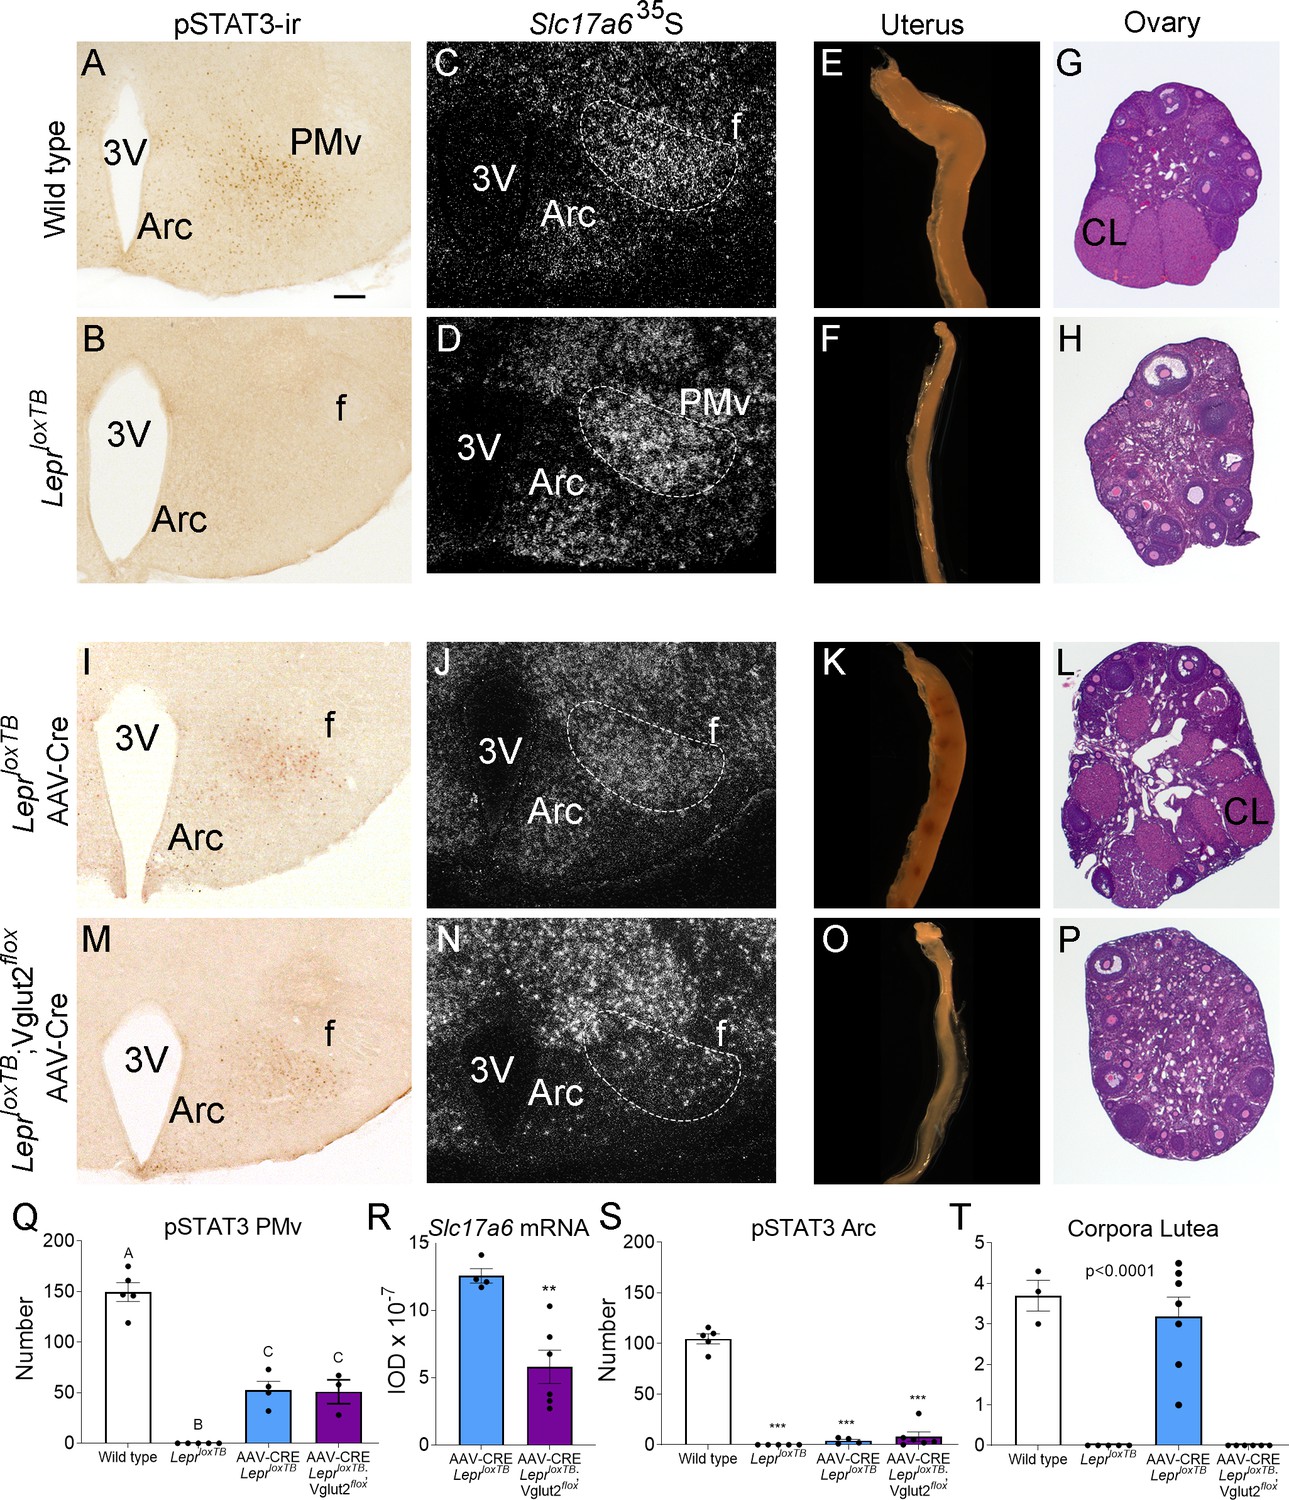
Glutamate signaling from the ventral premammillary nucleus (PMv) is required for leptin effect on pubertal development in female mouse.
(A, B, I, M) Microphotographs of the PMv showing pSTAT3-ir following leptin administration. Note lack of pSTAT3-ir in LeprloxTB mouse. (C, D, J, N) Darkfield microphotographs showing Slc17a6 mRNA (silver grains) in the PMv. Note decreased Slc17a6 mRNA expression in LeprloxTB;Vglut2flox mice injected with AAV-Cre. (E, F, K, O) Microphotographs of representative single uterine horns. Note lack of uterine growth in LeprloxTB mouse and in LeprloxTB;Vglut2flox mouse injected with AAV-Cre. (G, H, L, P) Microphotographs of representative ovary sections. Note lack of corpora lutea in LeprloxTB mouse and in LeprloxTB;Vglut2flox mouse injected with AAV-Cre. 3V: third ventricle, Arc: arcuate nucleus, f: fornix, CL: Corpus luteum. Scale bars: 100 µm. (Q) Number of pSTAT3 expressing cells in the PMv in wild-type (n = 5), LeprloxTB (n = 5), AAV-CRE injected LepRloxTB (n = 4), and AAV-CRE injected LeprloxTB;Vglut2flox (n = 3) (F3,13 = 73.53, p < 0.0001). Different capital letters indicate groups that are significantly different to the others (at least p<0.01) (R) Quantification of the Slc17a6 hybridization signal in the PMv AAV-CRE injected LeprloxTB (n = 4), and AAV-CRE injected LeprloxTB;Vglut2flox (n = 6) (t8 = 4.20; p = 0.003). (S) Number of pSTAT3 expressing cells in the Arc (F3,16 = 171.8, p < 0.0001). (T) Number of corpora lutea in the ovary (F3,17 = 31.16, p < 0.0001). **p < 0.01; ***p < 0.001.
-
Figure 7—source data 1
All data measured and analyzed for Figure 7.
- https://cdn.elifesciences.org/articles/93204/elife-93204-fig7-data1-v1.xlsx
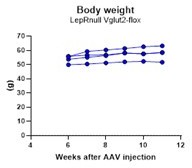
Author response image 1
Tables
Table 1
Experimental groups in the study of chemogenetic activation of LeprCre cells in the ventral premammillary nucleus (PMv).
| AAV vector | Drug | Injection site | LH increase 10–20 min | Group name | Color in Figure 1E–H, Figures 2 and 3 |
|---|---|---|---|---|---|
| AAV-hM3Dq (18) | CNO | Hit in PMv (15) | Yes (8) | ‘PMv-hit’ with LH increase |  |
| No (7) | ‘PMv-hit’ with no LH increase |  | |||
| Missed PMv (2) | No | Negative controls |  | ||
| No Fos in mCherry cells. Removed from analysis (1). | |||||
| AAV-mCherry (5) | CNO | Hit in PMv | No | Negative controls |  |
| AAV-hM3Dq (4) | Clozapine | Hit in PMv | Yes | Clozapine hM3Dq |  |
| No AAV (7) | Clozapine | No injection | (2/7) | Clozapine no AAV |  |
Table 2
Antibodies.
| Antibody | Protein target | Host organism | Dilution used | Vendor and cat# | RRID |
|---|---|---|---|---|---|
| Anti-GFP (Chicken Antibodies, IgY Fraction) | Recombinant GFP null | Chicken | 1:10,000 | Aves Labs Cat# GFP-1010 | RRID:AB_2307313 |
| mCherry monoclonal (16D7) | mCherry tag | Rat | 1:5000 | Thermo Fisher Scientific Cat# M11217 | RRID:AB_2536611 |
| ABE457 | Anti-cFos | N-terminus cFos | Rabbit | 1:2000 | Millipore Cat# ABE457 | RRID:AB_2631318 |
| Pro-opiomelanocortin Precursor POMC (27-52) antibody | Aminoacids 27–52 of porcine POMC peptide null | Rabbit | 1:10,000 | Phoenix Pharmaceuticals Cat# H-029-30, | RRID:AB_2307442 |
| Anti LHRH (GnRH) | Synthetic LHRH | Rabbit | 1:1000 | Immunostar Cat# 20075 | RRID:AB_572248 |
| Phospho-Stat-3 (tyr705) | Phospho-Stat-3 (tyr705) | Rabbit | 1:1000 | Cell Signaling Technology Cat# 9131 | RRID:AB_331586 |
| Goat anti-Chicken IgY, Alexa Fluor 488 | Chicken, IgY (H+L) | Goat | 1:500 | Thermo Fisher Scientific Cat# A-11039 | RRID:AB_2534096 |
| Donkey anti-Rat IgG, AlexaFluor 594 | Rat IgG (H+L) | Donkey | 1:500 | Thermo Fisher Scientific Cat# A-21209 | RRID:AB_2535795 |
| Donkey anti-Rabbit IgG, AlexaFluor 488 | Rabbit IgG (H+L) | Donkey | 1:500 | Thermo Fisher Scientific Cat# A-21206 | RRID:AB_2535792 |
| Biotin-SP-conjugated AffiniPure Donkey Anti-Rabbit IgG | Rabbit IgG (H+L) | Donkey | 1:1000 | Jackson ImmunoResearch Labs Cat# 711-065-152 | RRID:AB_2340593 |
Table 3
Quantitative PCR primers.
| Gene | Primer sequence | NCBI accession No. | Vendor |
|---|---|---|---|
| Actb | Fwd 5′-GGCTGTATTCCCCTCCATCG-3′ Rev 5′-CCAGTTGGTAACAATGCCATGT-3′ | NM_007393.5 | IDT |
| B2m | Fwd 5′-TCTCACTGACCGGCCTGTAT-3′ Rev 5′-GATCACATGTCTCGATCCCAGT-3′ | NM_009735.3 | IDT |
| Cga | Fwd 5′-CCTCAGATCGACAATCACCTG-3′ Rev 5′-AGCATGACCAGAATGACAGC-3′ | NM_009889.2 | IDT |
| Fshb | Fwd 5′-CTGGTGCTGGAGAGCAATCT-3′ Rev 5′- ACTTTCTGGGTATTGGGCCG-3′ | NM_008045.3 | IDT |
| Kiss1 | Fwd 5′-GGCAAAAGTGAAGCCTGGAT-3′ Rev 5′-GATTCCTTTTCCCAGGCATT-3′ | NM_178260.4 | MWG|operon |
| Kiss1r | Fwd 5′-TGGCTGGTTCCCCTGTTTTT-3′ Rev 5′-GCAGCCAGGTTAGCGATGTA-3′ | NM_053244.5 | IDT |
| Gnrhr | Fwd 5′-TCTTCATCATCCCCCTCCTC-3′ Rev 5′-GGAGTCCAGCAGACGACAAA-3′ | NM_010323.2 | IDT |
| Lhb | Fwd 5′-CCAGTCTGCATCACCTTCAC-3′ Rev 5′- CAGCTGAGGGCTACAGGAAAG-3′ | NM_008497.2 | IDT |
| Pdyn | Fwd 5′-CGTTGCTGTCAAGATCTGTTG-3′ Rev 5′-AGGCAGTCCGCCATAACATT-3′ | NM_001286502.1 | IDT |
| Tac2 | Fwd 5′-TCTGTGTGGGATGTAAAGGAGGG-3′ Rev 5′-GACAGCCGCAAACAGCATGG-3′ | NM_001199971.1 | IDT |
| Tac3r | Fwd 5′-TAAAAGTCATGCCAGGCCGT-3′ Rev 5′-AGGTGACACCCATGATGAGC-3′ | NM_021382.6 | IDT |
Additional files
Download links
A two-part list of links to download the article, or parts of the article, in various formats.
Downloads (link to download the article as PDF)
Open citations (links to open the citations from this article in various online reference manager services)
Cite this article (links to download the citations from this article in formats compatible with various reference manager tools)
Glutamate neurotransmission from leptin receptor cells is required for typical puberty and reproductive function in female mice
eLife 13:RP93204.
https://doi.org/10.7554/eLife.93204.3


