Revealing intact neuronal circuitry in centimeter-sized formalin-fixed paraffin-embedded brain
- Department of Biomedical Engineering and Environmental Sciences, National Tsing Hua University, Taiwan
- Brain Research Center, National Tsing Hua University, Taiwan
- Institute of Biomedical Sciences, Academia Sinica, Taiwan
- Department of Physics, National Taiwan University, Taiwan
- Institute of Photonics Technologies, National Tsing Hua University, Taiwan
- Department of Neurosurgery, National Taiwan University Hospital, Taiwan
- Department of Pathology, National Taiwan University Hospital, Taiwan
- Institute of Molecular Biology, Academia Sinica, Taiwan
- Research Center for Applied Sciences, Academia Sinica, Taiwan
Figures
Figure 1 with 5 supplements
Development of the HIF-Clear pipeline.
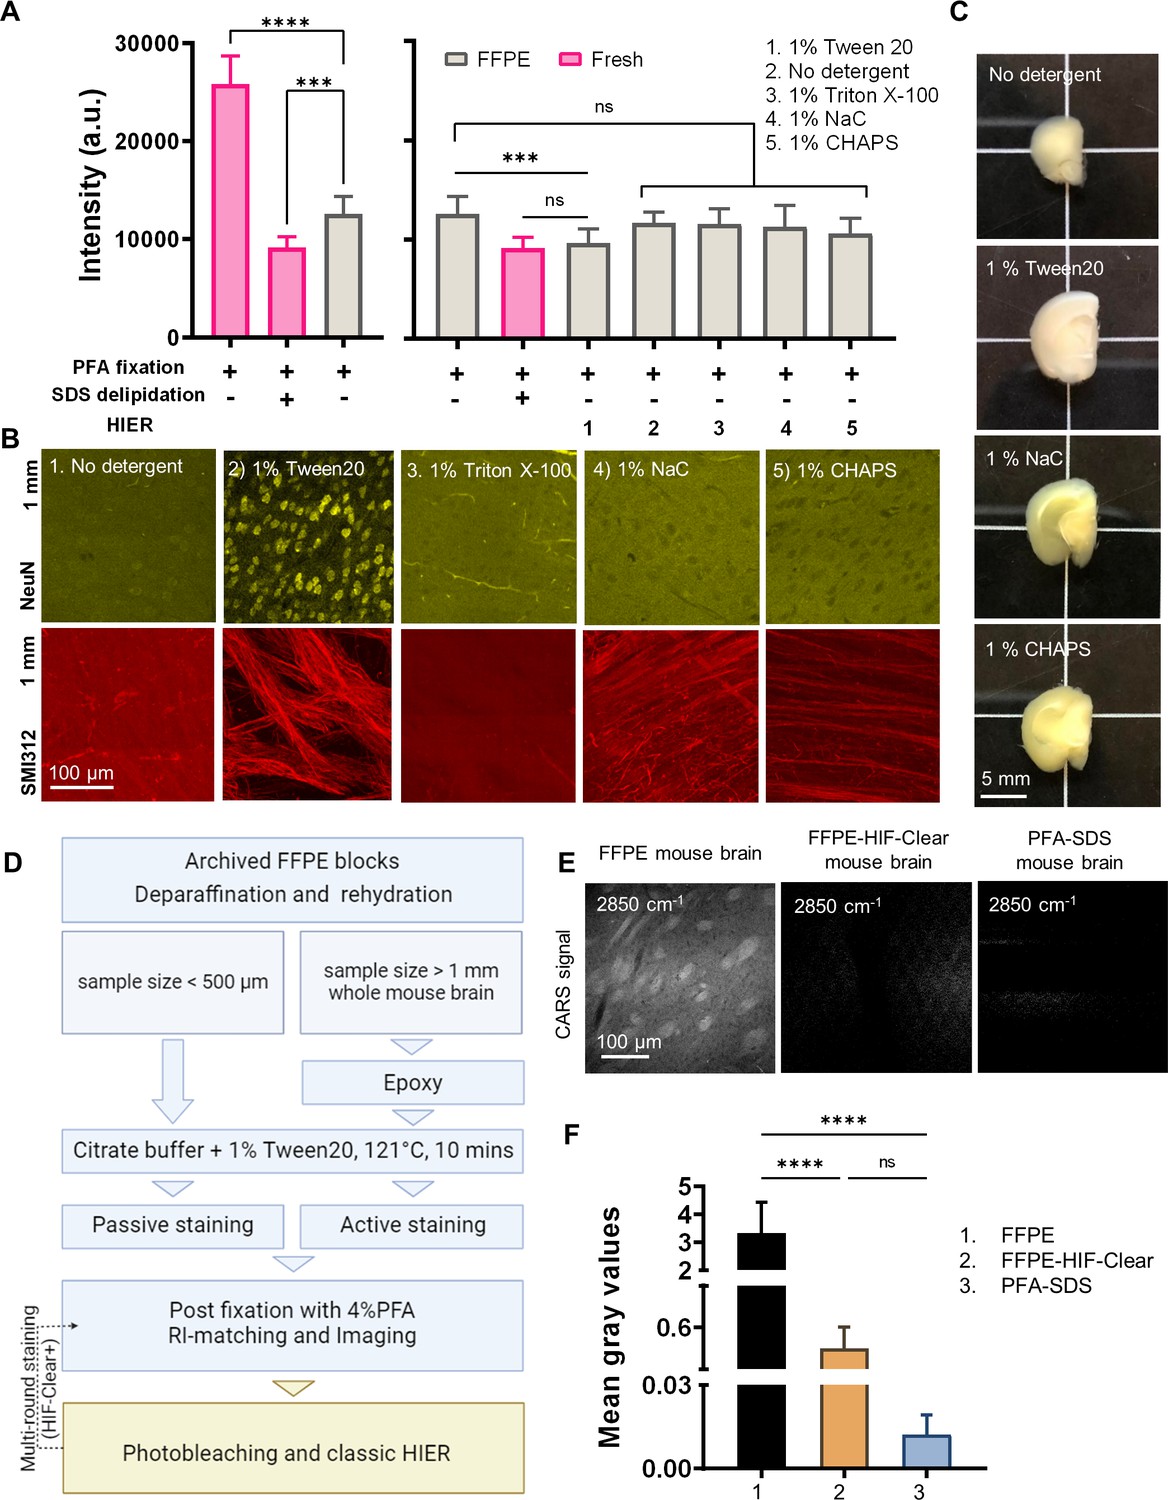
(A) Comparison of DiD signal intensity in 2-mm-thick slices of undelipidated formaldehyde-fixed mouse brain, PFA-SDS mouse brain, and formalin-fixed paraffin-embedded (FFPE) mouse brain treated under various detergent conditions. (B) Multi-point confocal fluorescence images of neuronal nuclei in the cortex (top row) and axons in the striatum (bottom row) from 2-mm-thick FFPE mouse brain slices that had been treated under various detergent conditions. Images of optical sections captured at a depth of 1 mm are shown. Detergent types and concentrations are indicated. NeuN, a neuronal nuclear marker; SMI312, a pan-axonal marker. (C) Gross views of 2-mm-thick slices of FFPE mouse brain treated under various detergent conditions. (D) Schematic of the HIF-Clear pipeline. (E) Images of coherent anti-Stokes Raman scattering (CARS) of dewaxed FFPE mouse brain, HIF-Clear-processed FFPE mouse brain, and PFA-SDS mouse brain. The images were taken at a Raman shift of 2850 cm–1 to address the CH2 vibration frequency. (F) Statistical analysis of the gray values for the three treatment groups in (E). Gray values for 18 z-continuous images of each group were analyzed. Statistical analysis: (A) n = 10; (E) n = 18. Mean ± SD, *p<0.05, **p<0.01, ***p<0.001, ****p<0.0001, one-way ANOVA with Tukey’s multiple comparison test.
Figure 1—figure supplement 1
Examination of the antigen retrieval effect of SDS on formalin-fixed paraffin-embedded (FFPE) specimens.
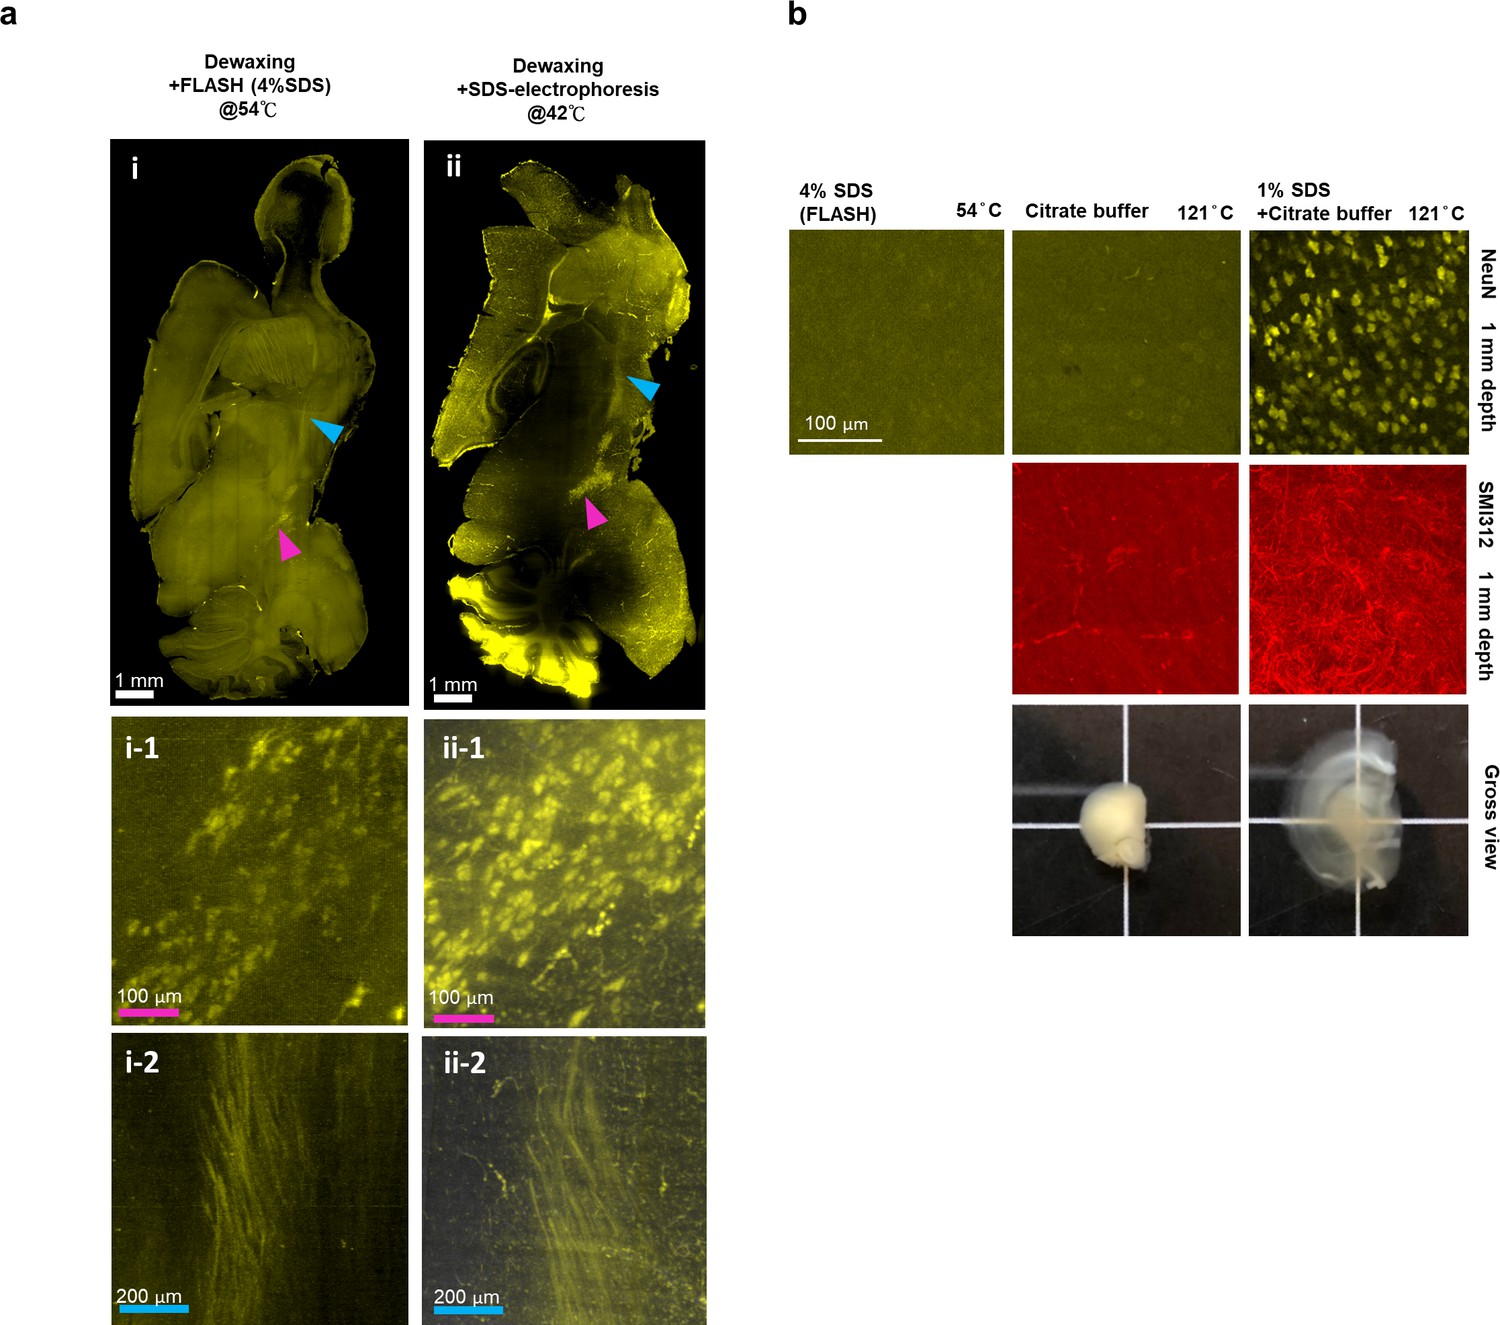
(a) Light-sheet images of FFPE mouse brain hemisphere stained with tyrosine hydroxylase (TH) antibodies. The SDS treatment conditions are described above the images. Magnifications of dopaminergic cells (magenta arrowheads) and nigrostriatal fiber tracts (cyan arrowheads) indicated in (i) and (ii) are shown in panels (i/ii-1) and (i/ii-2), respectively. (b) Multi-point confocal fluorescence images of neuronal nuclei in the cortex (top row) and axons in the striatum (middle row), and gross view (bottom row) of 2-mm-thick FFPE mouse brain slices treated under various SDS conditions. Images of the optical section at a depth of 1 mm are shown. NeuN, a neuronal nuclear marker; SMI312, a pan-axonal marker.
Figure 1—figure supplement 2
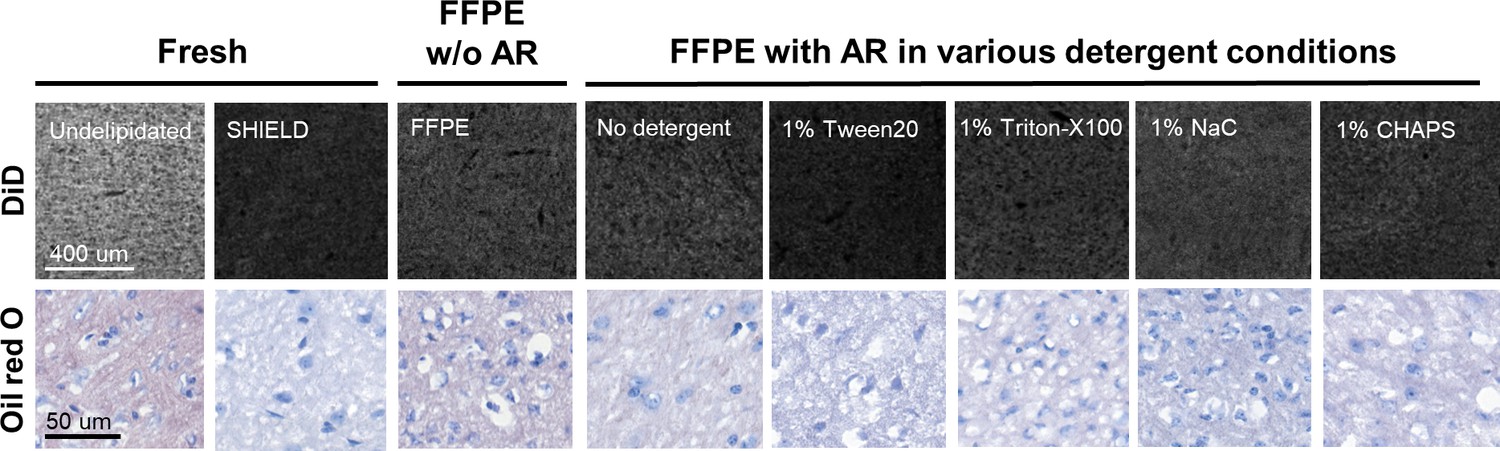
Representative images of the results of DiD and Oil red O staining.
The delipidation effects of various detergent conditions were visualized and evaluated by lipophilic dye staining. Representative images of DiD (top row) and Oil red O (bottom row) staining are shown. A Zeiss 780 confocal microscope was used for DiD staining, whereas a 3DHISTECH panoramic slide scanner was employed for Oil red O staining.
Figure 1—figure supplement 3
Repeated dewaxing test.
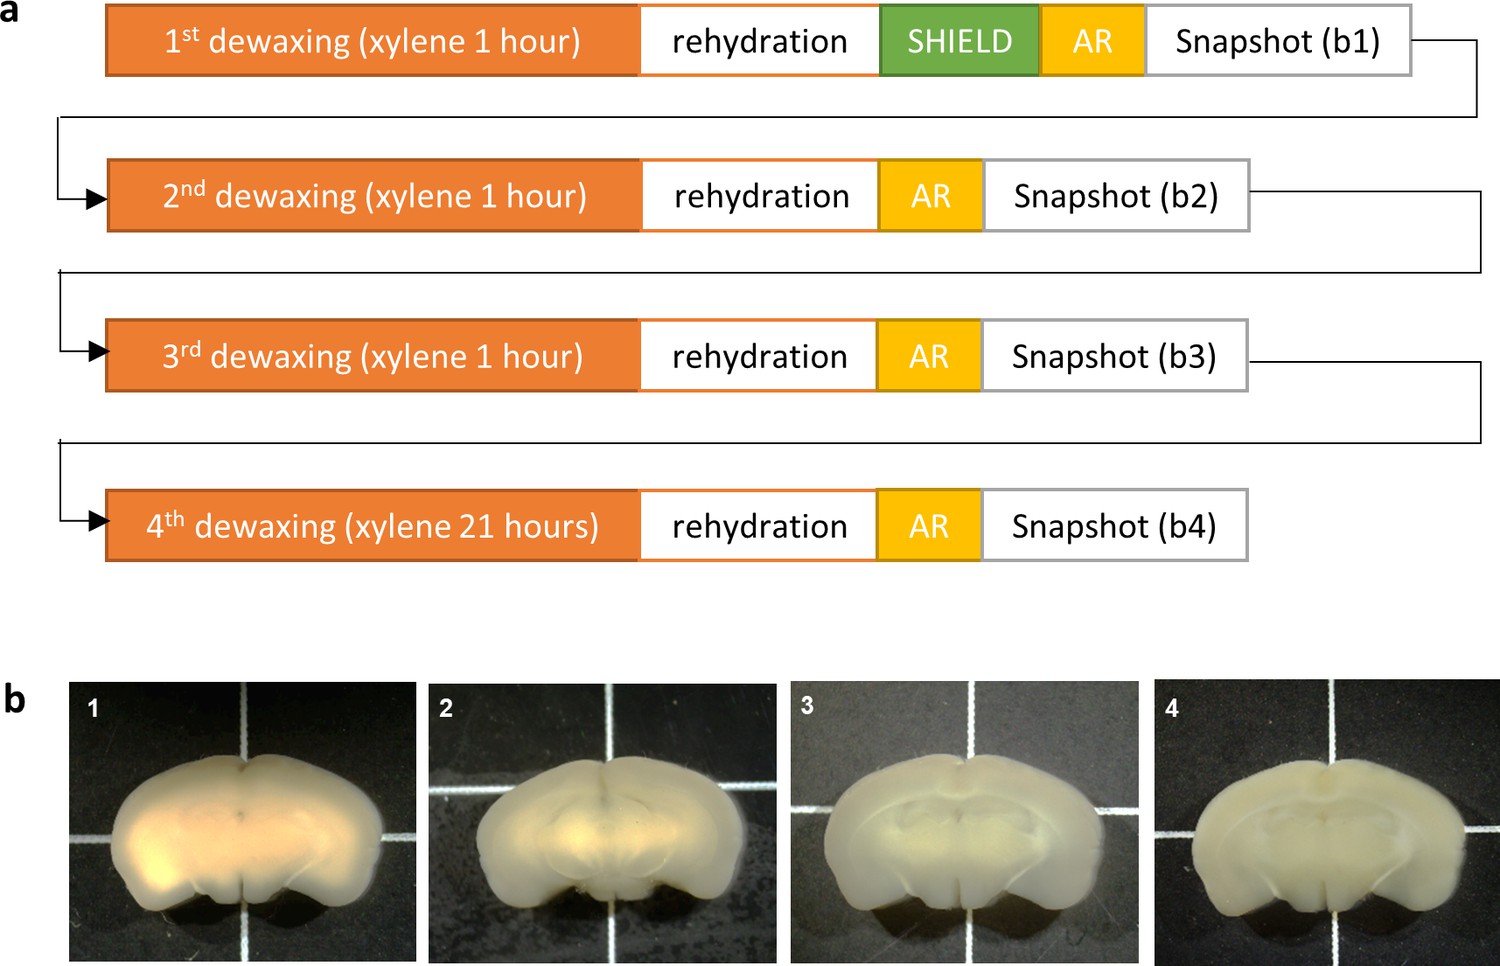
This test was designed to mimic experimental conditions where the sample is large and the optimal dewaxing time needs refinement. (a) Test procedure: a 2-mm-thick mouse brain block was fixed with 4% paraformaldehyde (PFA) for 24 hr and then embedded in paraffin wax. The formalin-fixed paraffin-embedded (FFPE) brain block was incubated at 65°C to melt the paraffin and then immersed in xylene for 1 hr (‘1st dewaxing’). The dewaxed brain block was rehydrated, SHIELD-processed, and subjected to antigen retrieval as described in the section ‘HIF-Clear pipeline. Consequently, a sufficiently dewaxed region turned translucent (b-1, the extremities of the brain), whereas any region with residual wax remained opaque (b-1, the central area of the brain). The insufficiently dewaxed brain block was then dehydrated and immersed in xylene for another hour (‘2nd dewaxing’). The now twice-dewaxed sample was rehydrated, again subjected to antigen retrieval, and photographed. This process was repeated and, at the end of each cycle, a gross view image was acquired. (b) Gross views of the brain block after each dewaxing step. Note that the extent of the translucent border area increases while that of the opaque central area decreases with repeated dewaxings.
Figure 1—figure supplement 4
Repeated dewaxing does not influence antigenicity.
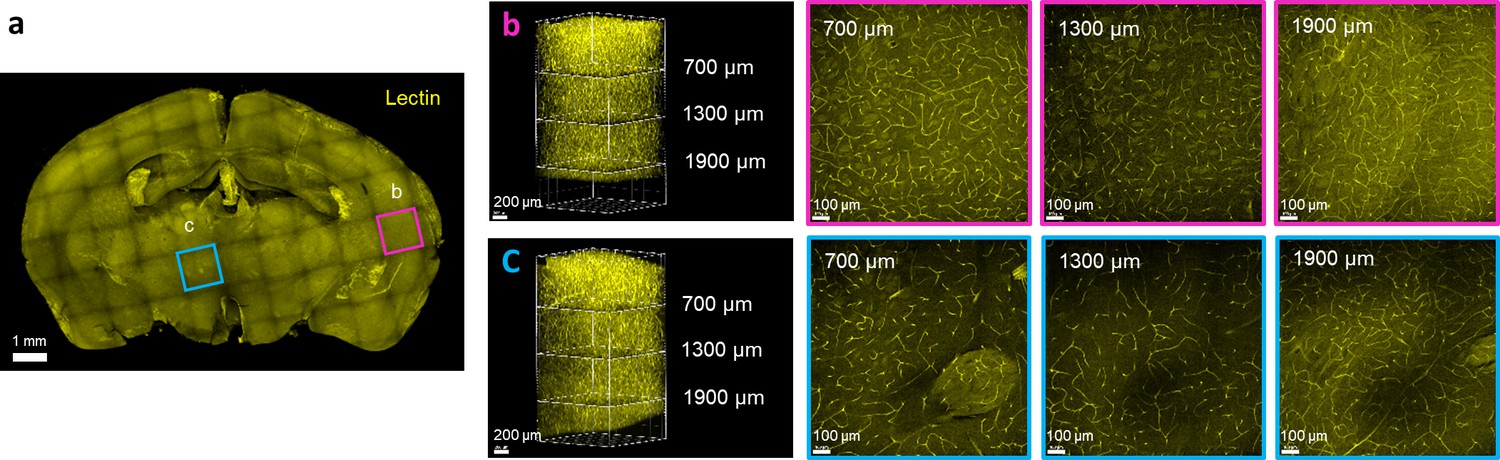
The brain block subjected to four rounds of dewaxing (as shown in Figure 1—figure supplement 3) was labeled with lectin to examine antigenicity. (a) Projection image of the entire block. (b) 3D image and optical sections of the magenta-framed box in (a). (c) 3D image and optical sections of the cyan-framed box in (a).
Figure 1—figure supplement 5
Gross view of the mouse brain at different stages of the HIF-Clear protocol.
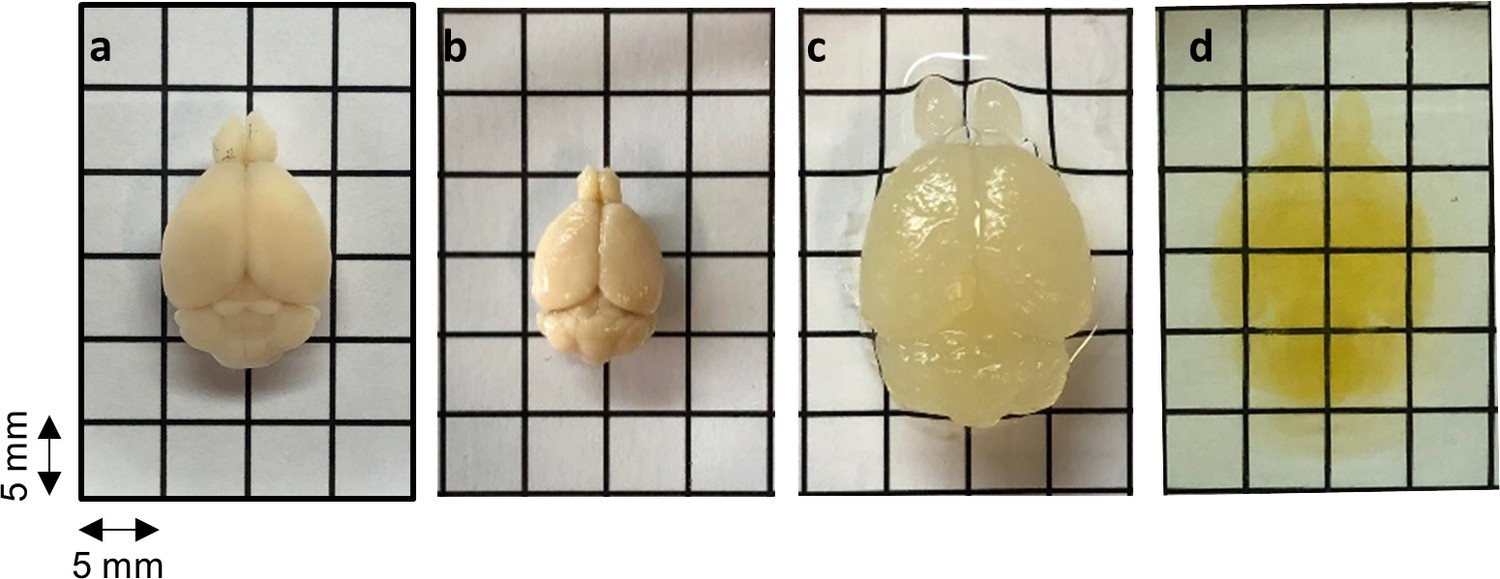
(a) 4% paraformaldehyde (PFA) fixation. (b) Formalin-fixed paraffin-embedded (FFPE) embedding. (c) Optimized antigen retrieval. (d) Refractive index (RI) matching. The FFPE mouse brain remain intact and turn transparent after processing with HIF-Clear.
Figure 2
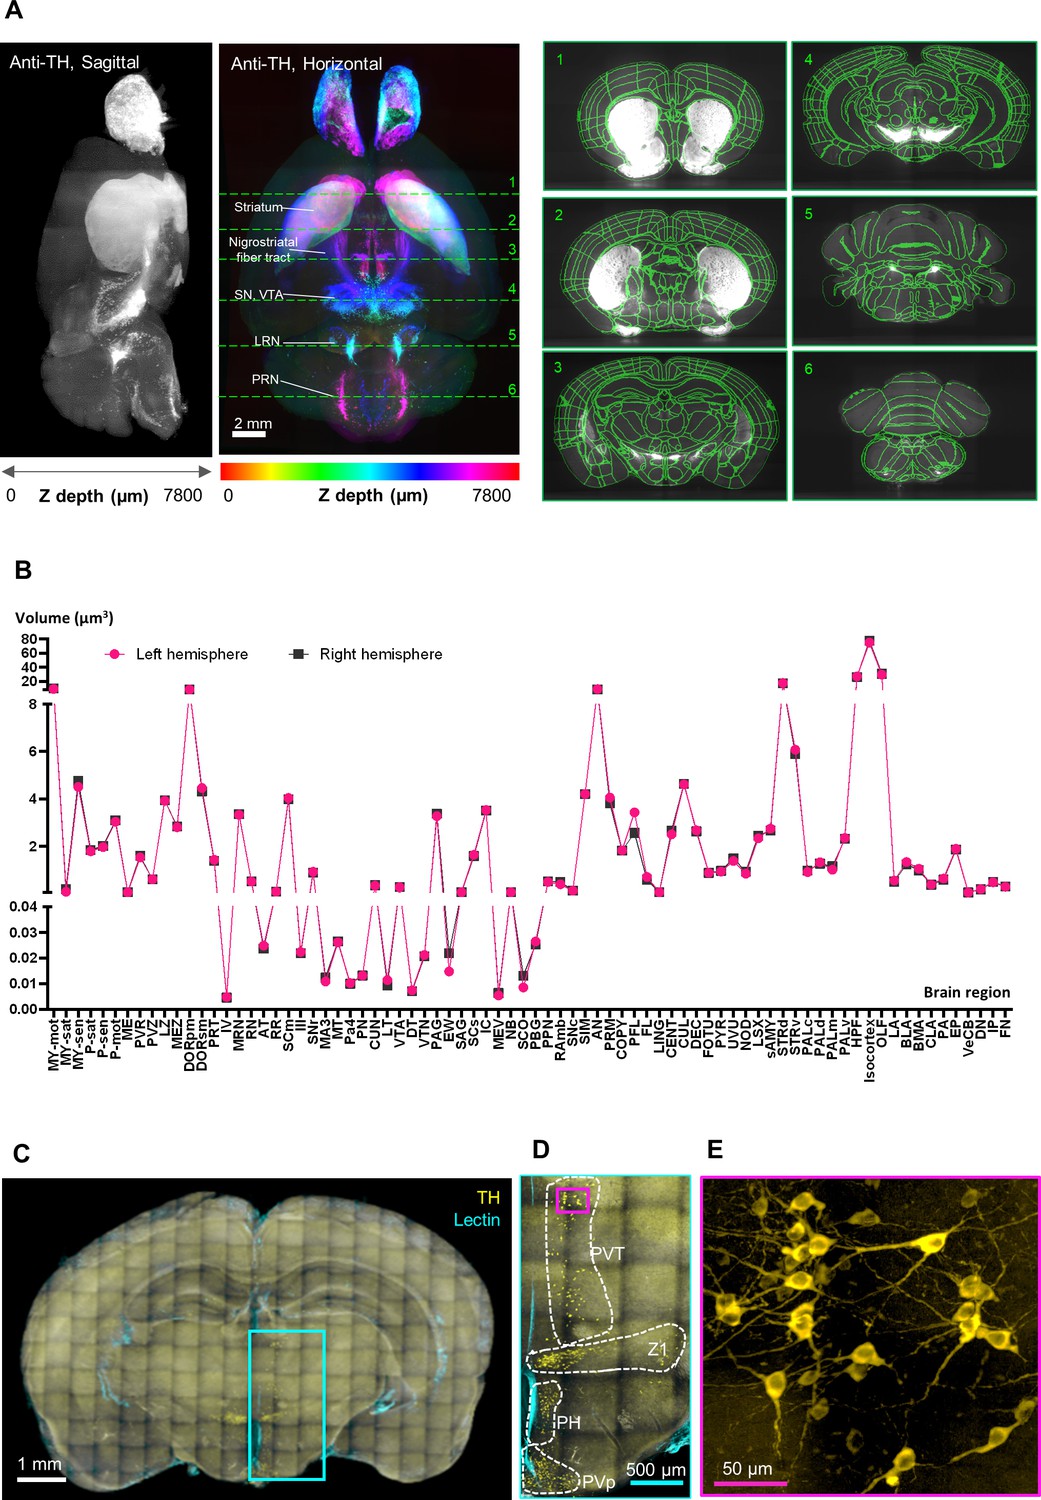
Validation of the HIF-Clear pipeline.
(A) Brain-wide tyrosine hydroxylase (TH) expression (left panel) and registration (right panel) in FFPE-HIF-Clear C57BL/6 mouse brains. Whole mouse brain images were acquired using light-sheet microscopy, and the 3D-rendered images of the horizontal (XY) and sagittal (YZ) views are shown. Major dopaminergic regions are indicated: SN (substantia nigra), VTA (ventral tegmental area), LRN (lateral reticular nucleus), and PRN (pontine reticular nucleus). The results of brain registration for these regions (marked with green dotted lines and numbered in the XY view) are displayed from the coronal (XZ) view in the right panel. (B) Comparison of brain region volumes between the left and right hemispheres of an FFPE-HIF-Clear mouse brain. All abbreviations are listed in Supplementary file 2. (C–E) Application of HIF-Clear to a 15-year-old FFPE block with TH immunolabeling and multi-point confocal imaging. Specimen thickness: 2 mm. (C) The projection image. (D) Magnification of the cyan-lined region in (C). Dopaminergic regions are indicated. PVT, paraventricular nucleus of thalamus; PH, posterior hypothalamic nucleus; PVp, periventricular hypothalamic nucleus. (E) Magnification of the magenta-lined region in (D). Scale bars are indicated in each panel. FFPE, formalin-fixed paraffin-embedded.
Figure 3 with 5 supplements
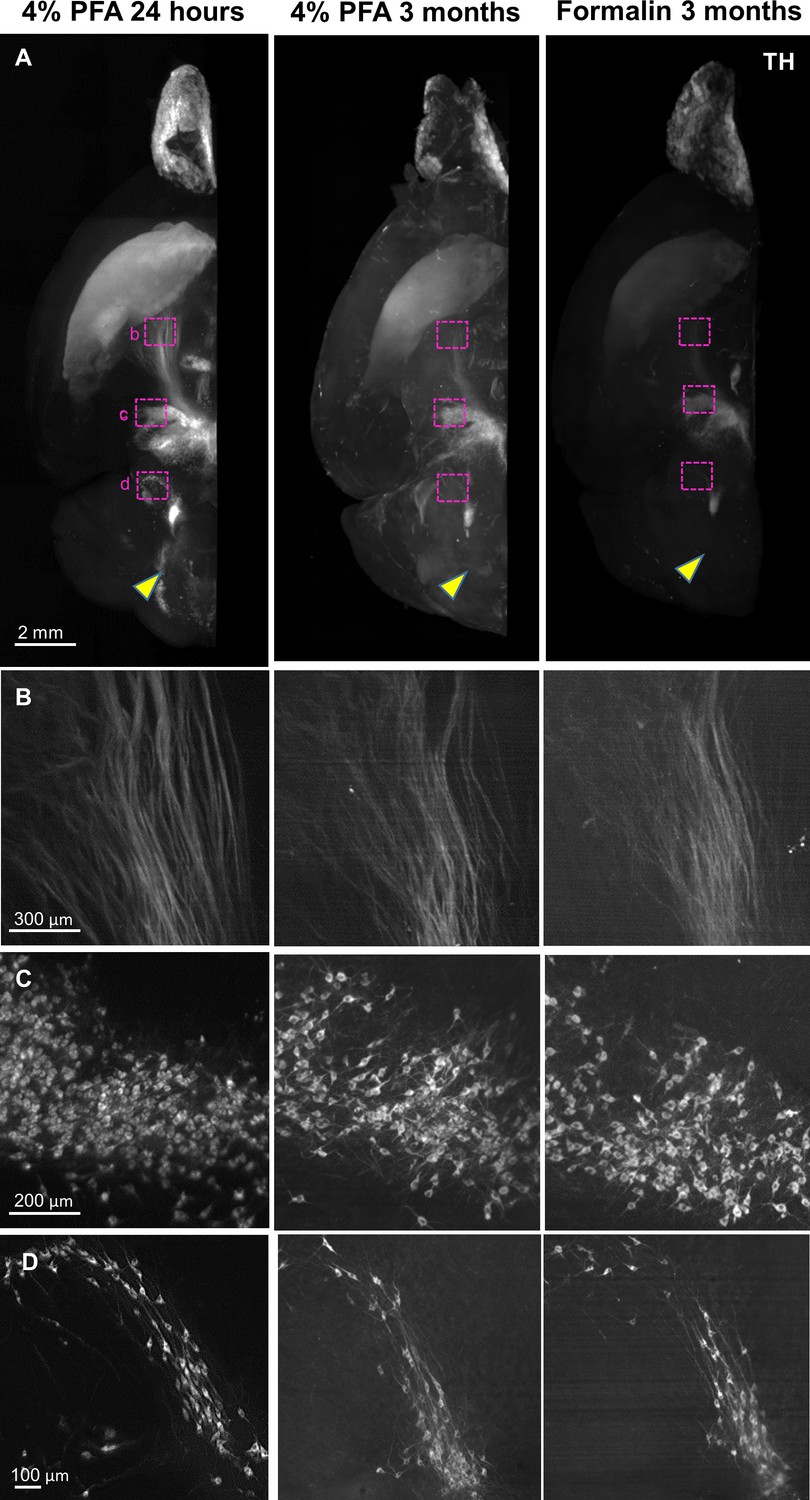
Application of HIF-Clear to long-term fixed mouse brain hemispheres.
Mouse brain hemispheres were fixed under various fixation conditions and then subjected to formalin-fixed paraffin-embedded (FFPE) processing and HIF-Clear. The specimens were stained with tyrosine hydroxylase (TH) antibodies and imaged with light-sheet microscopy. (A) Projection images of the horizontal (XY) view. The magenta-lined regions indicating nigrostriatal fiber tract, ventral tegmental area (VTA), and lateral reticular nucleus (LRN) are magnified in (B), (C), and (D), respectively. The yellow arrowheads indicate pontine reticular nucleus (PRN), which was clearly immunolabeled in the 4% paraformaldehyde (PFA) 24-hour-fixed specimen but not in the 3-month-fixed specimens.
Figure 3—figure supplement 1
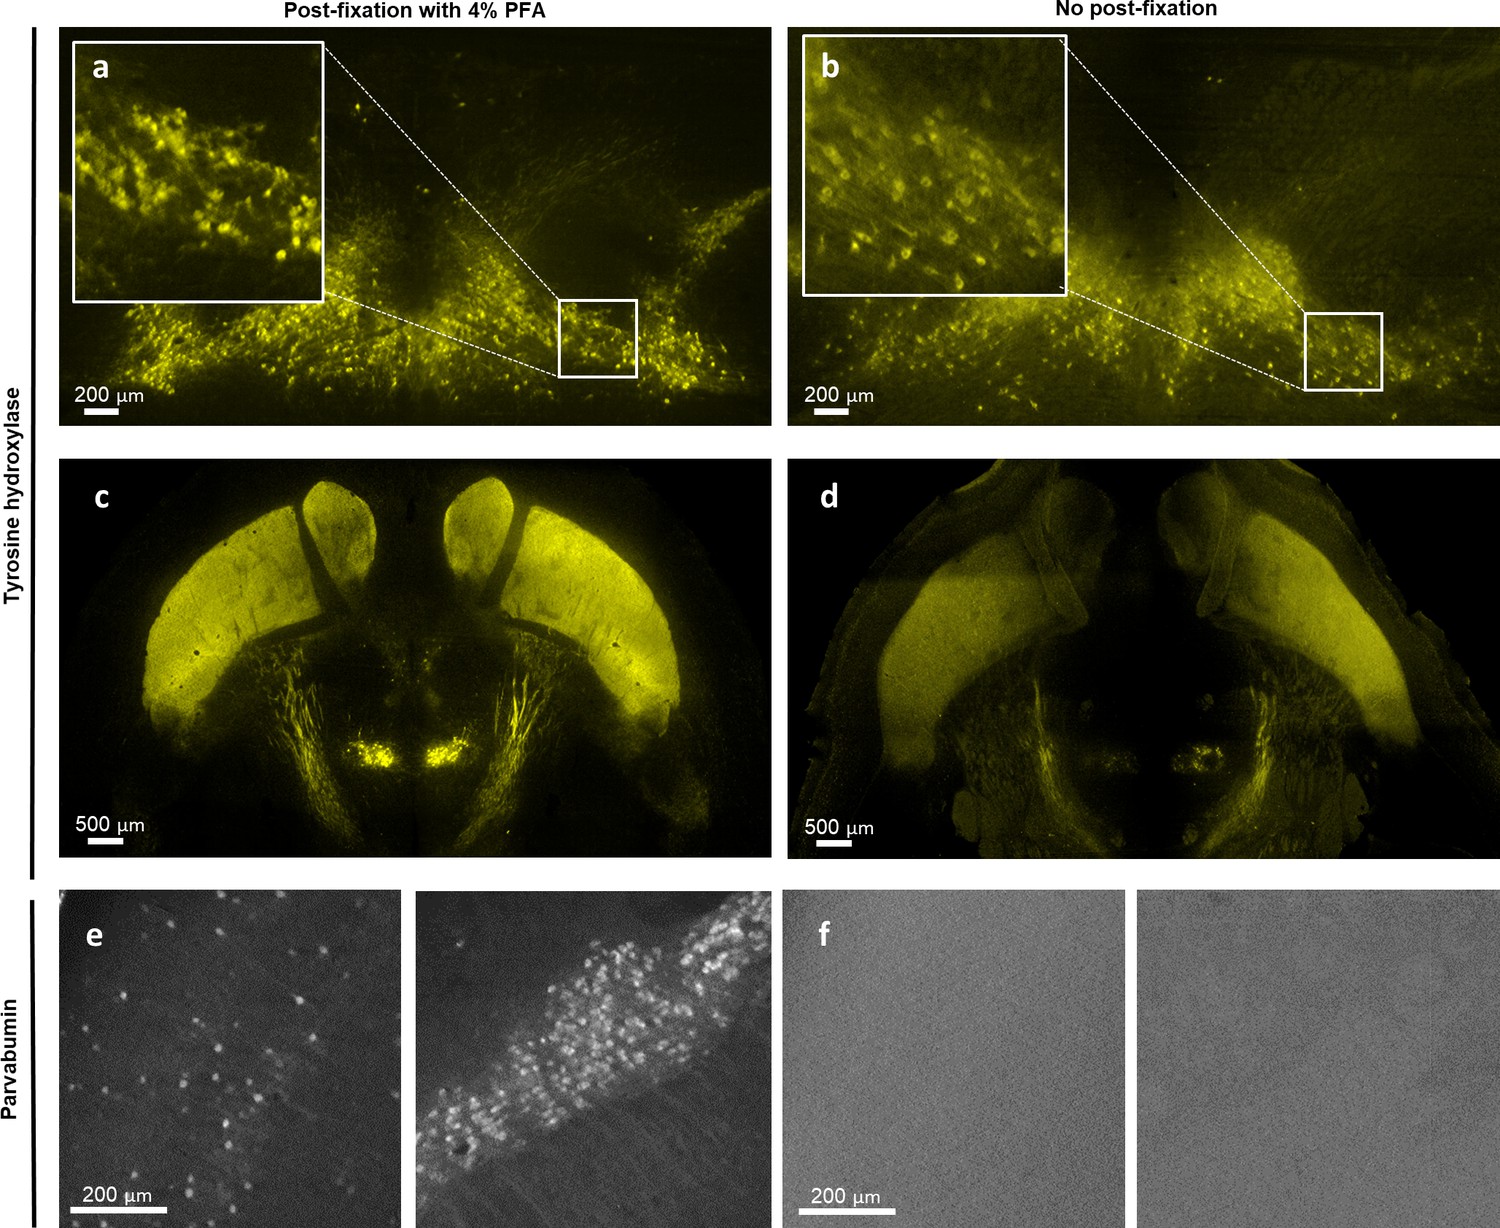
Immunolabeled whole mouse brain without post-fixation exhibits faint or negative staining.
Light-sheet images of a formalin-fixed paraffin-embedded (FFPE) mouse brain stained with tyrosine hydroxylase (TH) and parvalbumin (PV) with (a, c, e) or without (b, d, f) post-immunolabeling fixation. Without post-fixation, the TH signal is fainter (b, d), and PV signal is completely absent (f).
Figure 3—figure supplement 2
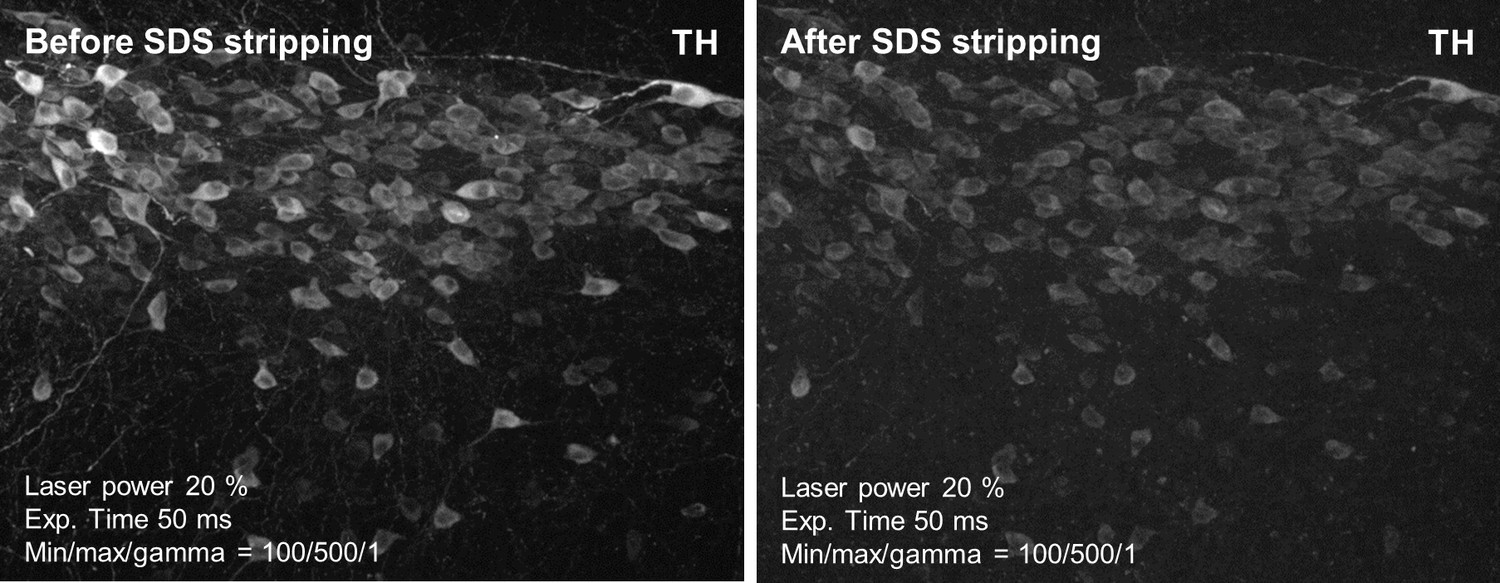
Post-immunolabeling-fixed tyrosine hydroxylase (TH) signal remains after SDS stripping.
A 2-mm-thick formalin-fixed paraffin-embedded (FFPE) mouse brain specimen was stained with TH and then underwent post-immunolabeling fixation with 4% paraformaldehyde (PFA). Multi-point confocal images were taken before and after SDS stripping. Laser power, exposure time, and display parameters are indicated.
Figure 3—figure supplement 3
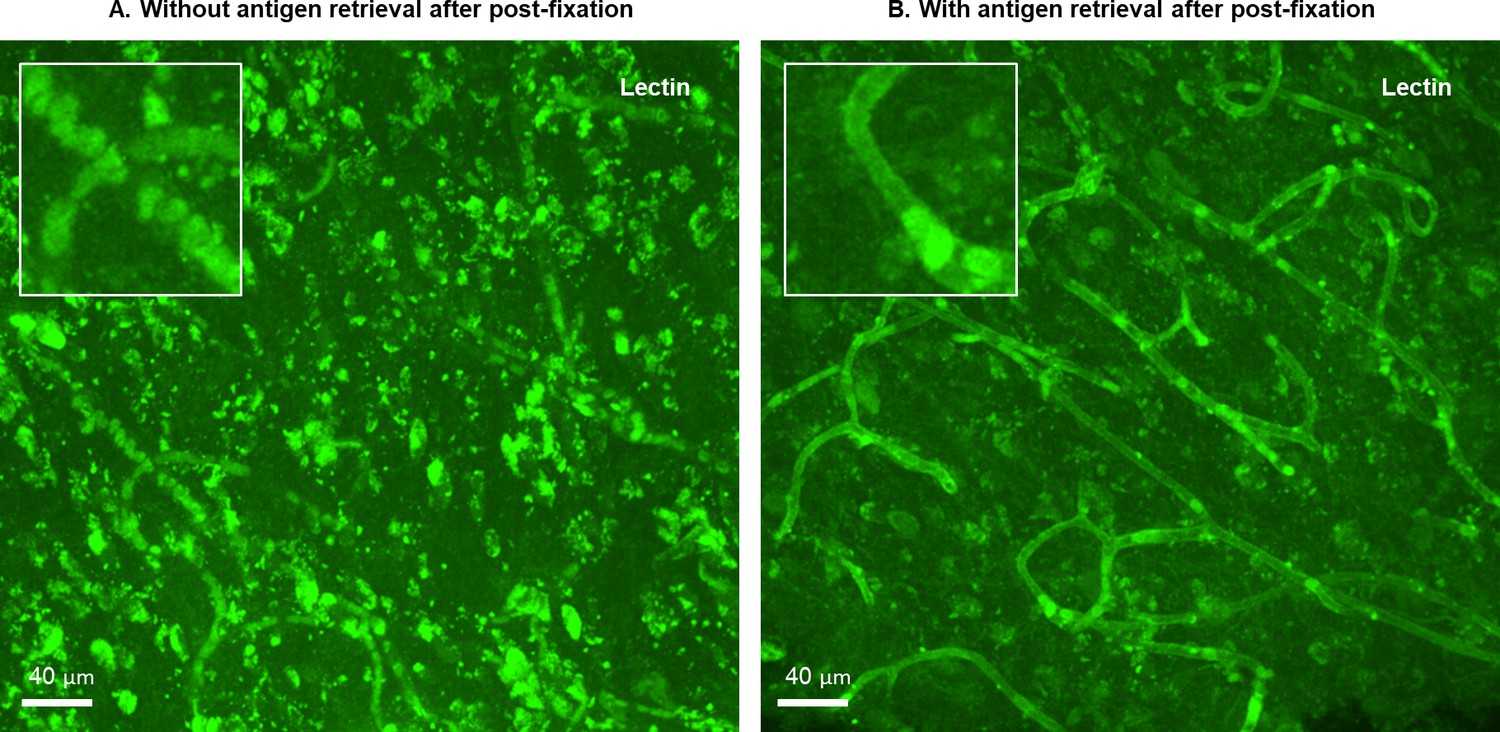
Classic heat-induced epitope retrieval (HIER) facilitates relabeling after post-immunolabeling fixation.
A second round of staining, using lectin to label blood vessels, was performed on human brain tissues that had undergone an initial immunolabeling and post-fixation process. For the sample without HIER before lectin staining (A), only autofluorescence of blood cells is observed. In contrast, for the sample with HIER before lectin staining (B), the endothelium of blood vessels is clearly labeled.
Figure 3—figure supplement 4
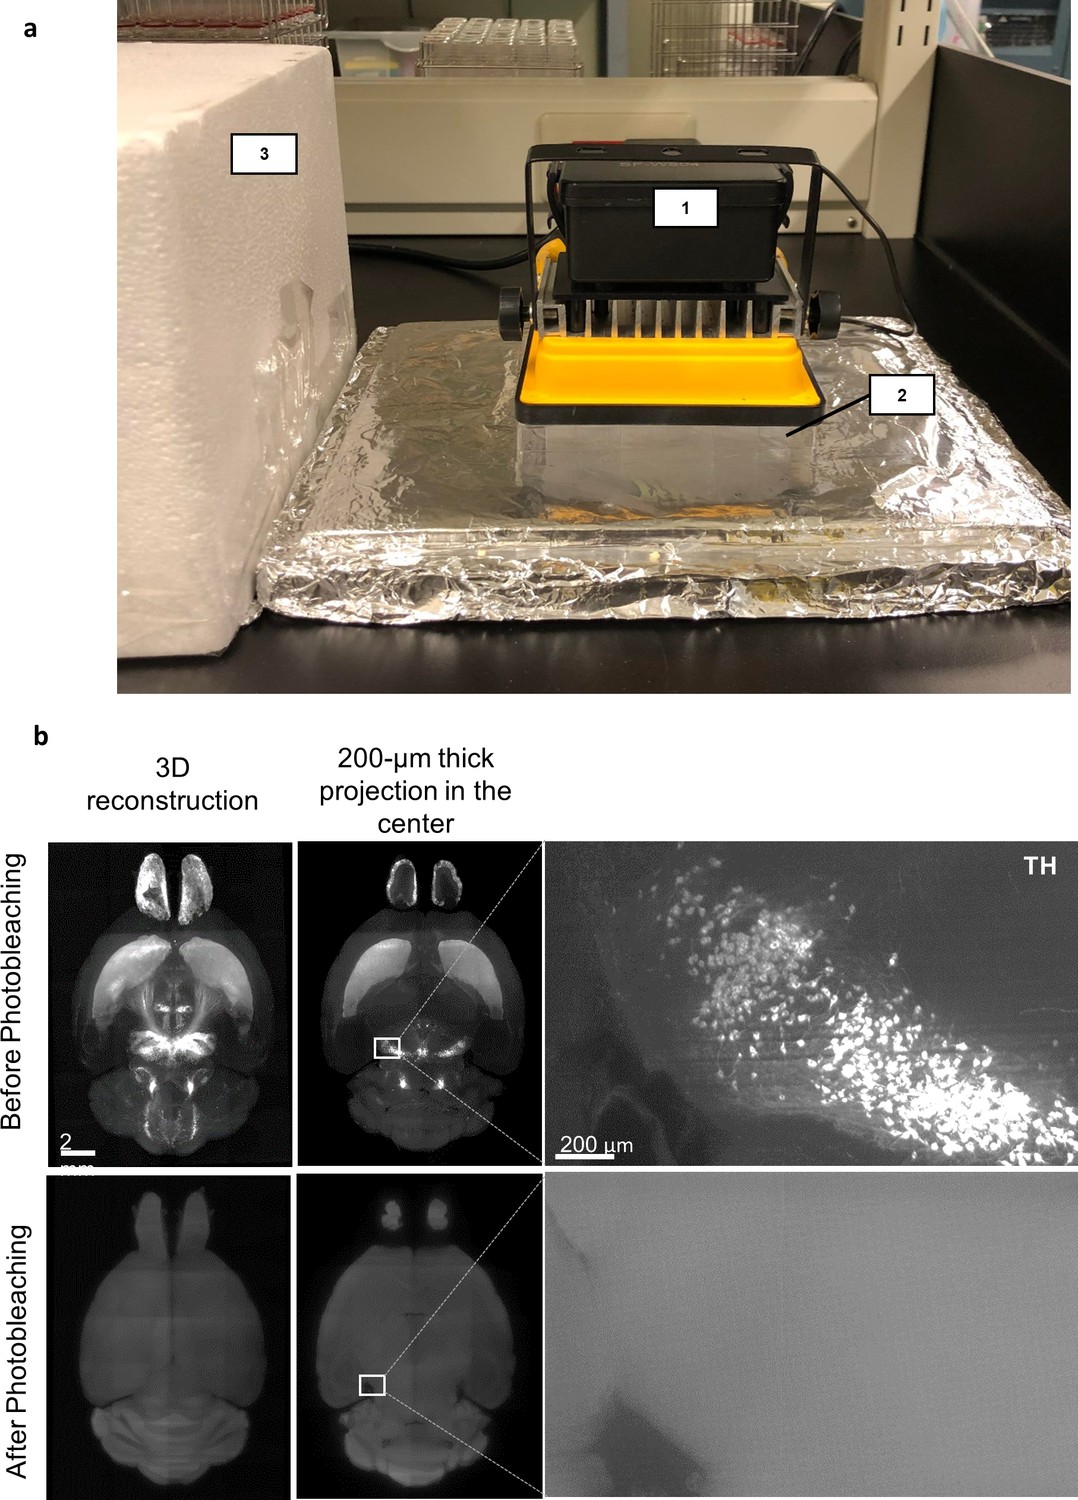
Photobleaching in HIF-Clear+.
(a) A representative photobleaching apparatus. The 100 W projection lamp with an LED array (1), the multi-well plate containing refractive index (RI) matching solution and the sample (2), and the cover for the apparatus when the lamp is turned on (3). (b) Light-sheet images of a formalin-fixed paraffin-embedded (FFPE) mouse brain stained with tyrosine hydroxylase (TH) before (upper row) or after (bottom row) white light LED photobleaching.
Figure 3—figure supplement 5
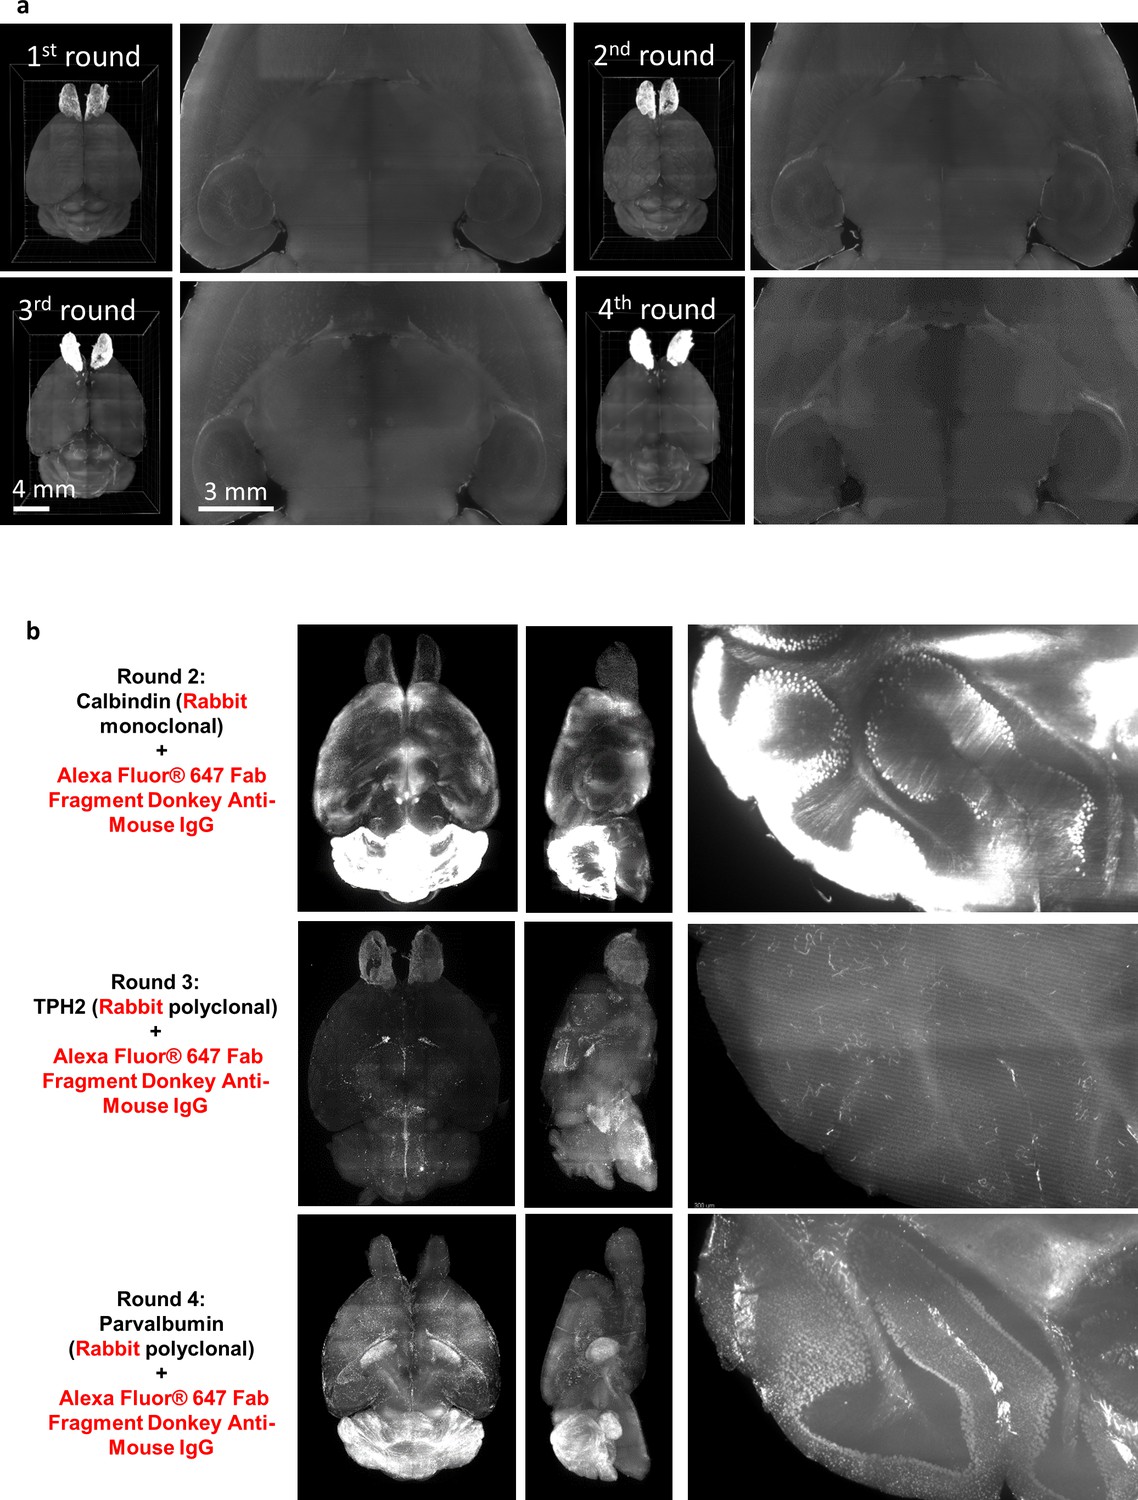
Examination of issue structural integrity and secondary antibody cross-reactivity of HIF-Clear+.
(a) Light-sheet images of a formalin-fixed paraffin-embedded (FFPE) mouse brain after each round of immunolabeling. 3D reconstruction images and magnification of the optical section in the center are shown. (b) The second to fourth rounds of multi-round staining shown in Figure 3. Antibodies used, projection images of the horizontal and sagittal views, and magnification of the cerebellar region are shown. In the three sequential rounds, rabbit primary antibodies and the same secondary antibodies were utilized. Our observations under a ×3.6 objective (NA = 0.2) did not reveal any colocalization with the staining from the previous round. The results suggest that cross-reactivity is not significant.
Figure 4 with 1 supplement
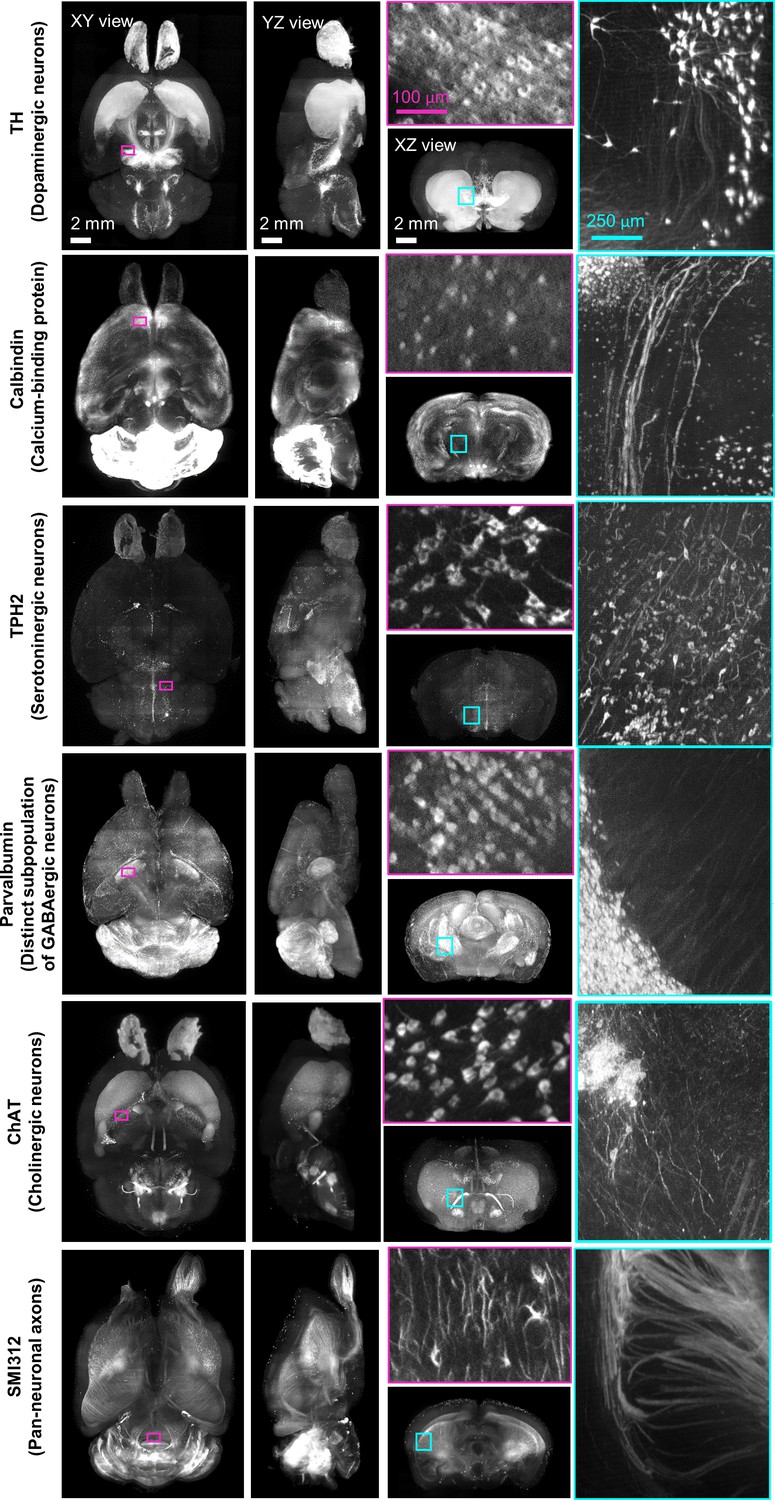
Multi-round immunostaining of FFPE-HIF-Clear whole mouse brain (HIF-Clear+).
Light-sheet microscopy imaging datasets of six-round immunolabeling performed on one whole FFPE mouse brain. Projection images of the horizontal (XY), sagittal (YZ), and transverse (XZ) views are shown. Projection images (200 μm thick) of magenta-lined and cyan-lined regions marked in the XY and XZ views are magnified and displayed within correspondingly colored frames. Scale bars are indicated in the first row. FFPE, formalin-fixed paraffin-embedded.
Figure 4—video 1
Spatial distribution of the six biological markers shown in Figure 4.
Figure 5
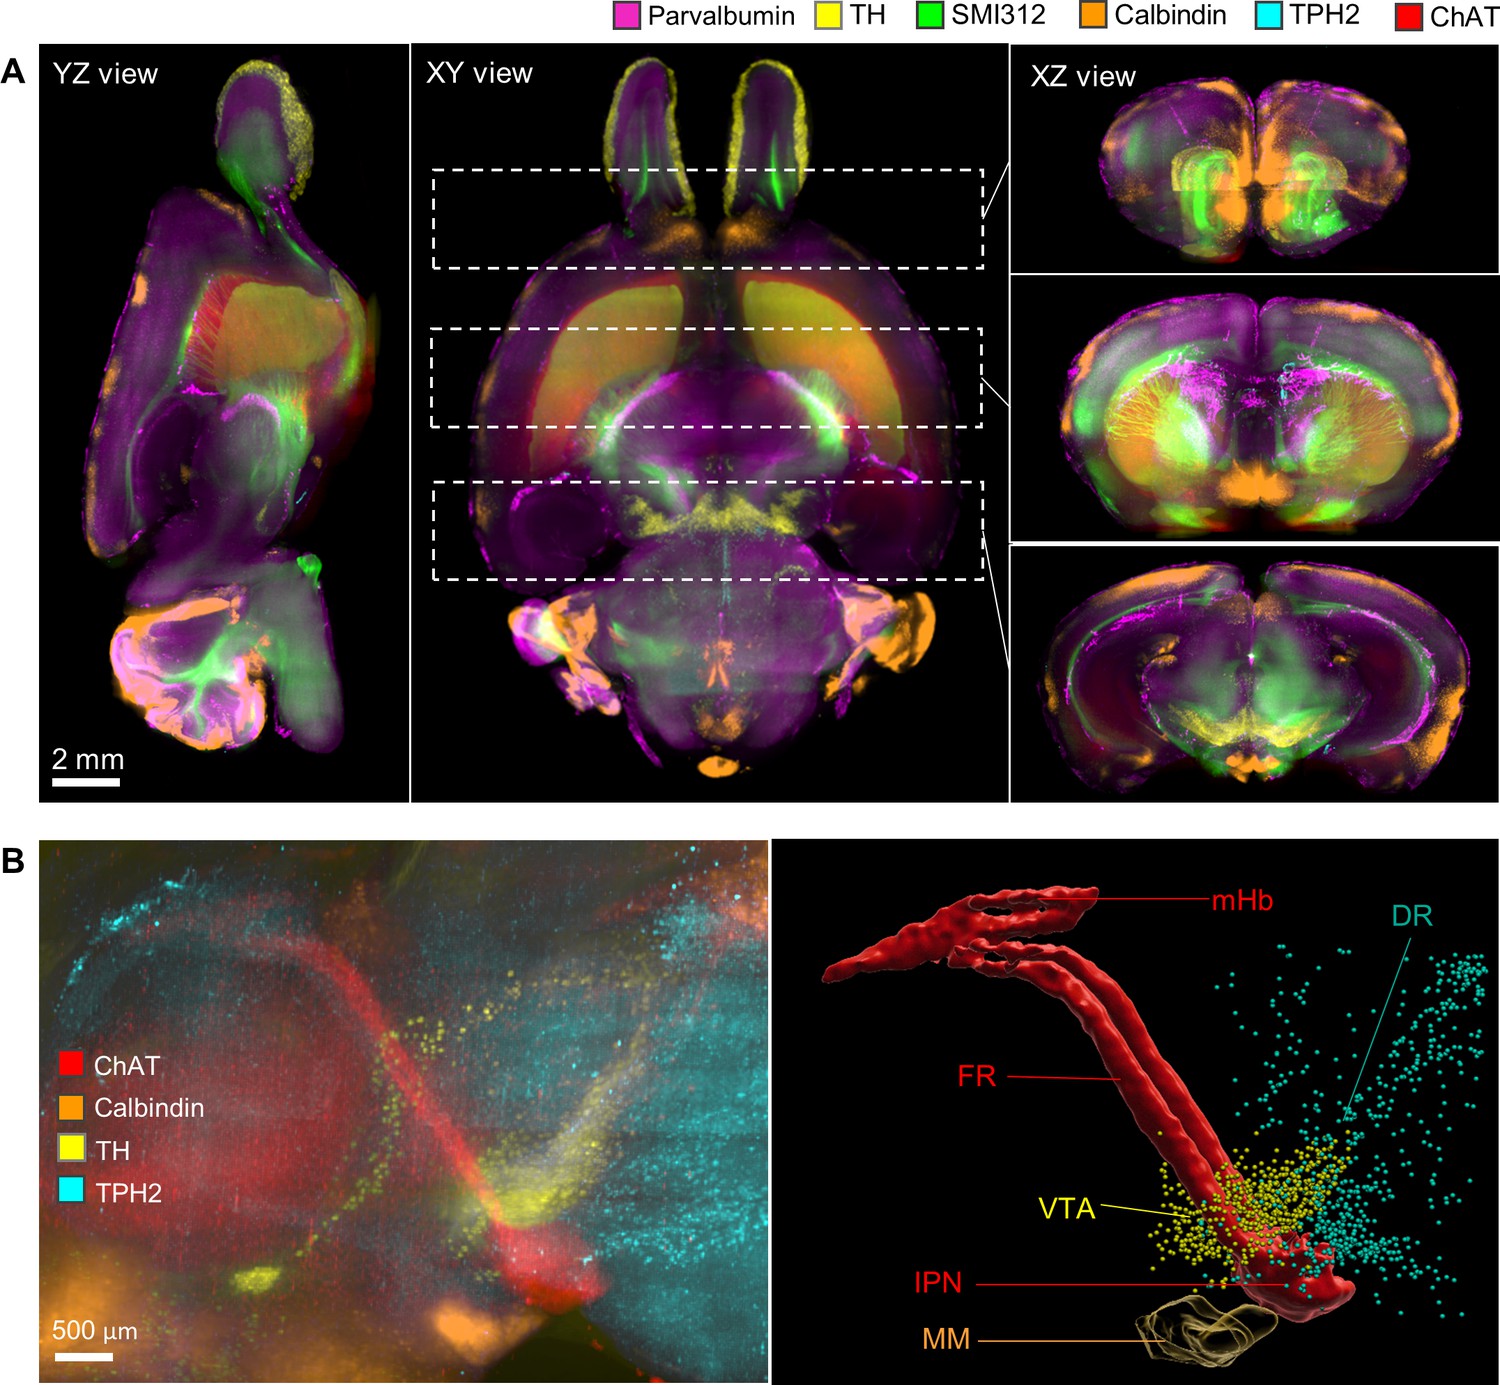
Merged multichannel neuron circuitry image generated by HIF-Clear+.
(A) Merged multichannel image generated using the datasets from Figure 3. Optical sections from the horizontal (XY) and sagittal (YZ) perspectives are presented. For the transverse (XZ) views, projection images of the regions encompassed by the dotted lines in the XY view are displayed. (B) The spatial relationship of the Hbn-IPN circuitry, dopaminergic (TH), serotoninergic (TPH2), and calbindin+GABAergic neurons. Fluorescence (right) and segmented (left) images are shown. mHb, medial habenula; FR, fasciculus retroflexus; IPN, interpeduncular nucleus; SuM, medial mammillary area of the hypothalamus; DR, dorsal raphe nuclei.
Figure 6 with 1 supplement
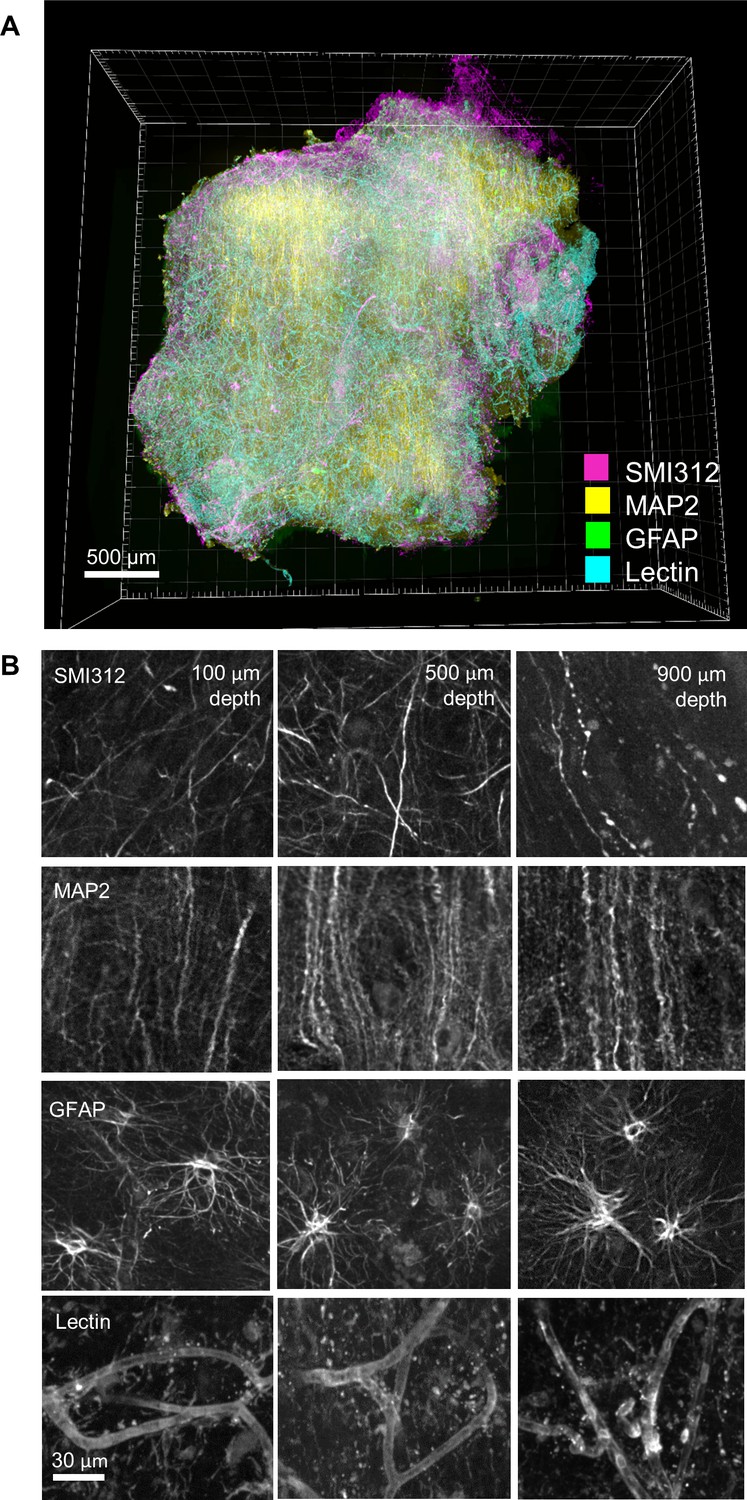
Multi-round immunostaining of an FFPE-HIF-Clear human brain specimen.
Three-round immunolabeling was performed on an FFPE human brain specimen collected from a patient with cerebral hemorrhage. Images were acquired using multi-point confocal microscopy. (A) 3D rendering of the entire specimen. (B) Images depicting merged and single channels of an optical section from the selected area (white frame) in (A) at depths of 100, 500, and 900 μm. GFAP, glial fibrillary acidic protein; SMI312, pan-axonal marker; MAP2, microtubule-associated protein 2 (a dendritic marker); FFPE, formalin-fixed paraffin-embedded.
Figure 6—figure supplement 1
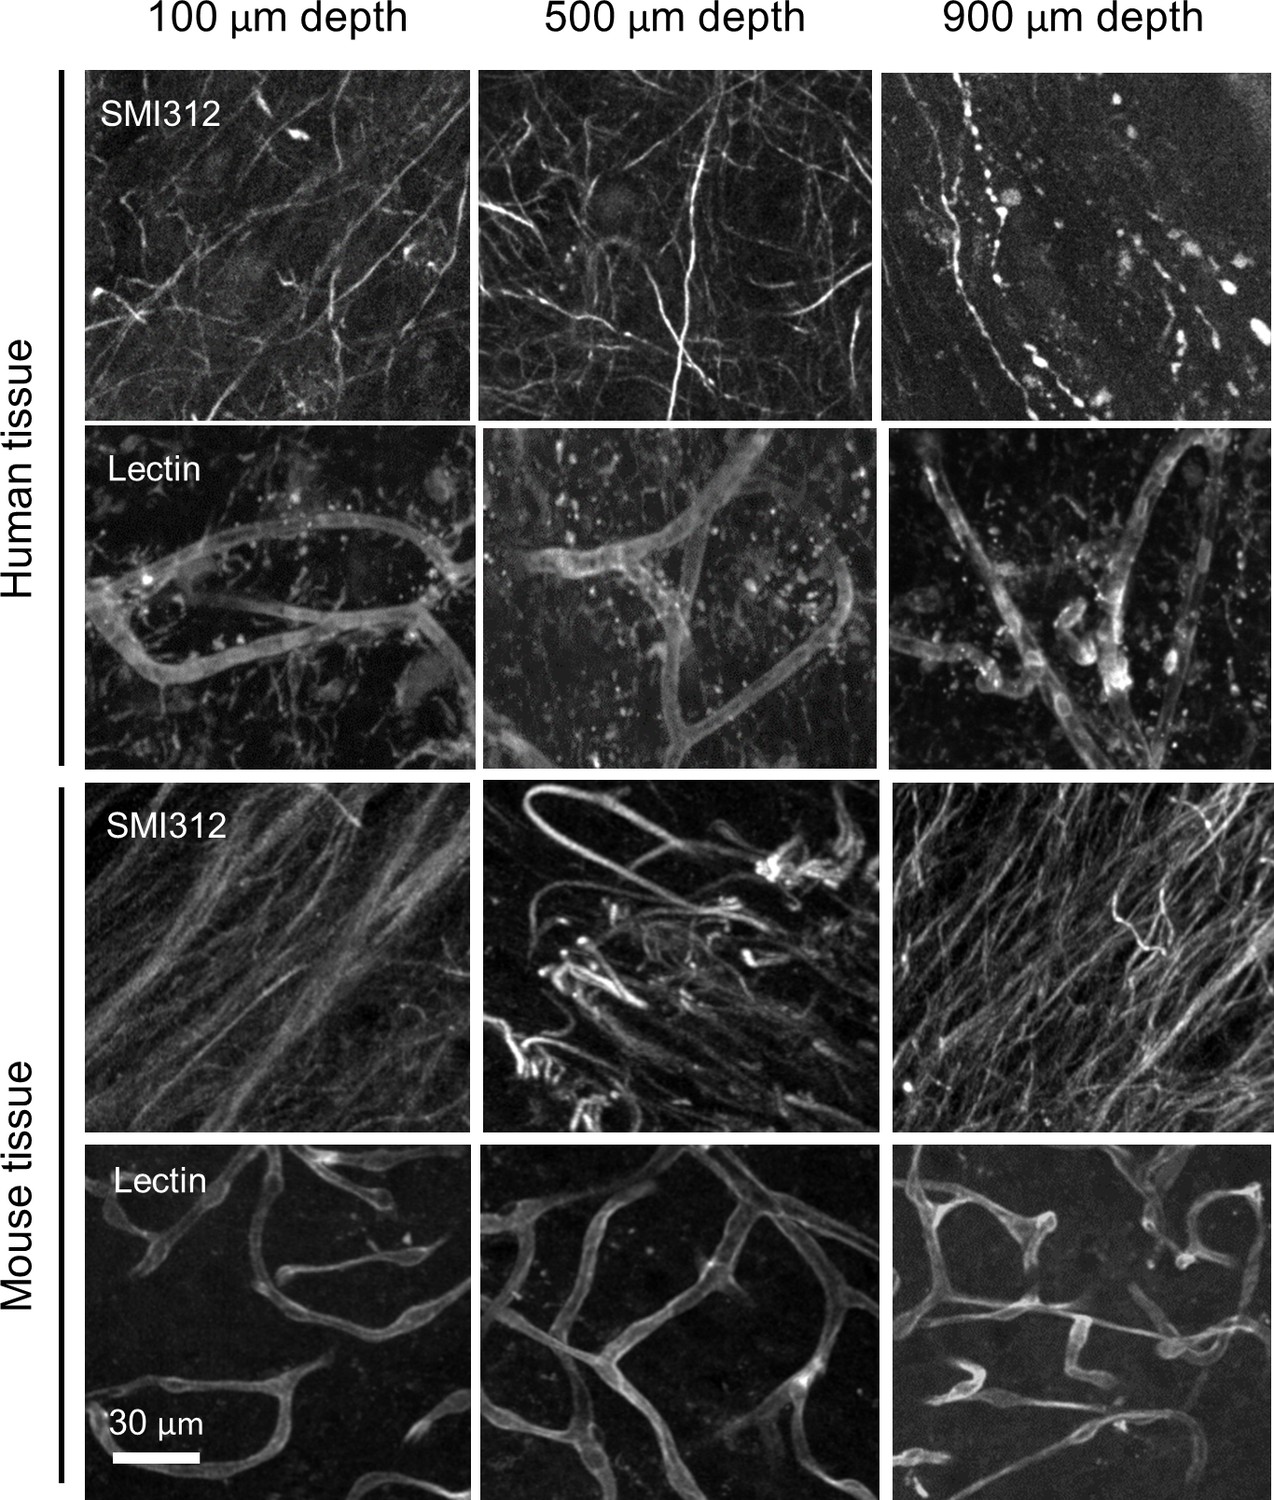
Comparison of staining qualities of human and mouse brain tissues.
Multi-point confocal images of tyrosine hydroxylase (TH)- and lectin labeling in 1-mm-thick human and mouse brain tissues at depths of 100, 500, and 900 μm are shown.
Figure 7 with 4 supplements
Applications of HIF-Clear in disease models.
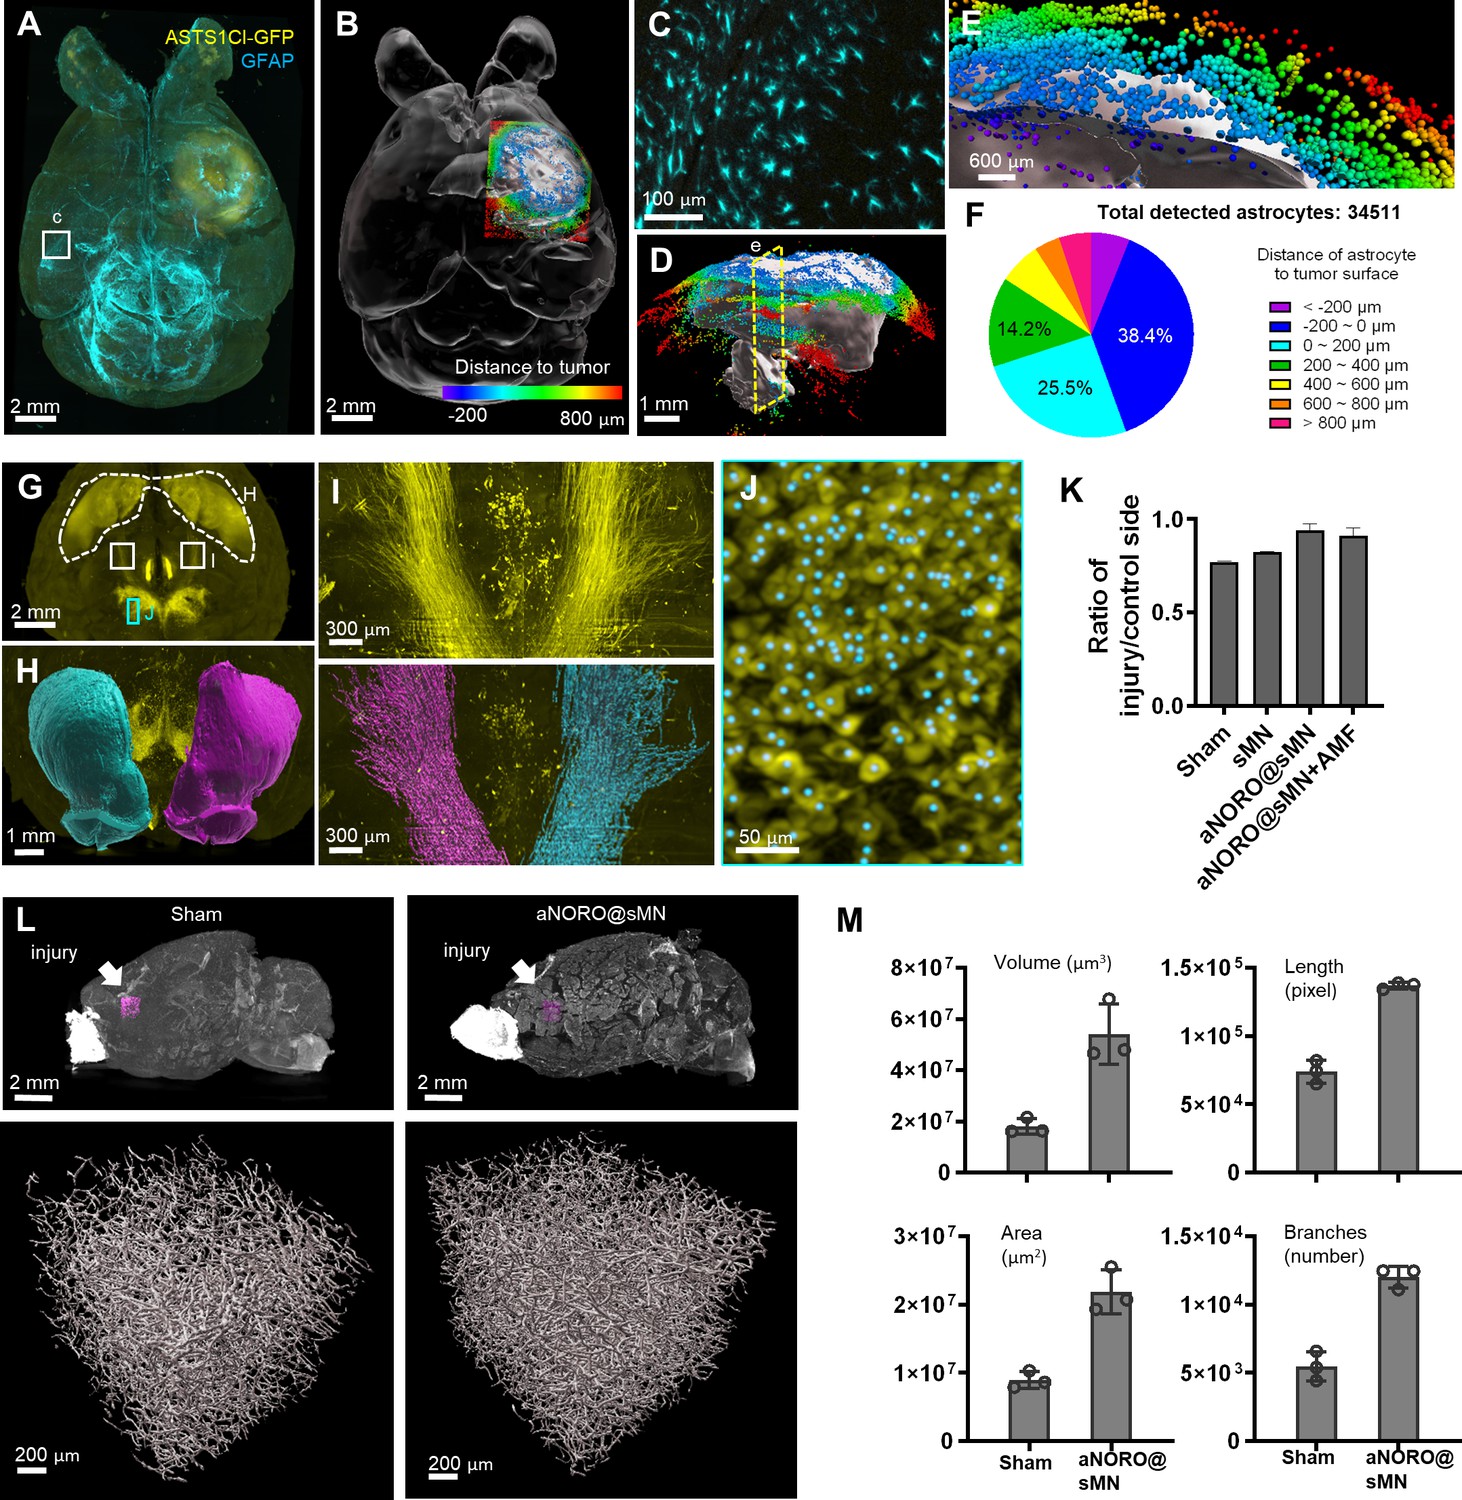
(A–F) HIF-Clear reveals cell–tumor relationships in an astrocytoma model. (A) Projection light-sheet image of an FFPE-HIF-Clear mouse brain with a GFP-expressing astrocytoma xenograft (ALTS1C1 cells, see ‘Materials and methods’) stained for GFP (yellow) and GFAP (cyan). (B) Segmented tumor (white) and surrounding astrocytes (colored). The astrocytes are colored according to the color-coded scale of cell-to-tumor distance. (C) Magnification of the region marked in (A), showing astrocyte morphology. (D) Sagittal view of the segmented tumor and color-coded astrocytes. (E) Magnification of the clipping plane marked in (D, yellow dashed line) showing astrocytes inside (dark blue, purple) and outside (red, orange, yellow, green, cyan, blue) the tumor. (F) Quantification of detected astrocytes and their classification according to distance to the tumor surface. (G–M) HIF-Clear reveals brain damage and the therapeutic effect of alternating magnetic field-responsive NO-release octahedrons (aNORO) administered using a paracetamol-coated silk-based microneedle (sMN) in a traumatic brain injury (TBI) mouse model. (G–J) Segmentation of dopaminergic regions in FFPE-HIF-Clear TBI mouse brains. (G) Whole-brain projection light-sheet image focusing on tyrosine hydroxylase (TH)-positive regions. (H) Frontal view of the segmented striatum (dashed white line in [G]). Magenta: the injured side; cyan: the contralateral side. (I) Horizontal views of the nigrostriatal fiber tract (paired white boxes in [G]); fluorescence (top) and segmented (bottom) images are shown. Magenta: the injured side; cyan: the contralateral side. (J) Detection of dopaminergic cells in the substantia nigra (SN). Magnification of the marked area in (G), including the TH fluorescence signal (yellow) and segmented cells (cyan dots). (K) Comparison of the therapeutic effects of different treatments. n = 3 (three indicators: striatum volume, nigrostriatal fiber tract volume, SN cell number), mean ± SD, *p<0.05, **p<0.01, ***p<0.001, ****p<0.0001, one-way ANOVA with Tukey’s multiple comparison test. (L) Reconstruction of blood vessels in TBI brains with or without treatments. The regions of interest (ROIs) selected to assess angiogenesis are indicated in the top row (magenta boxes, directly below the injury site). 3D reconstructions of blood vessels are shown in the bottom row. (M) Quantification of blood vessel volume, blood vessel surface area, number of blood vessel branches, and blood vessel length. n = 3, mean ± SD have been plotted. FFPE, formalin-fixed paraffin-embedded.
Figure 7—figure supplement 1
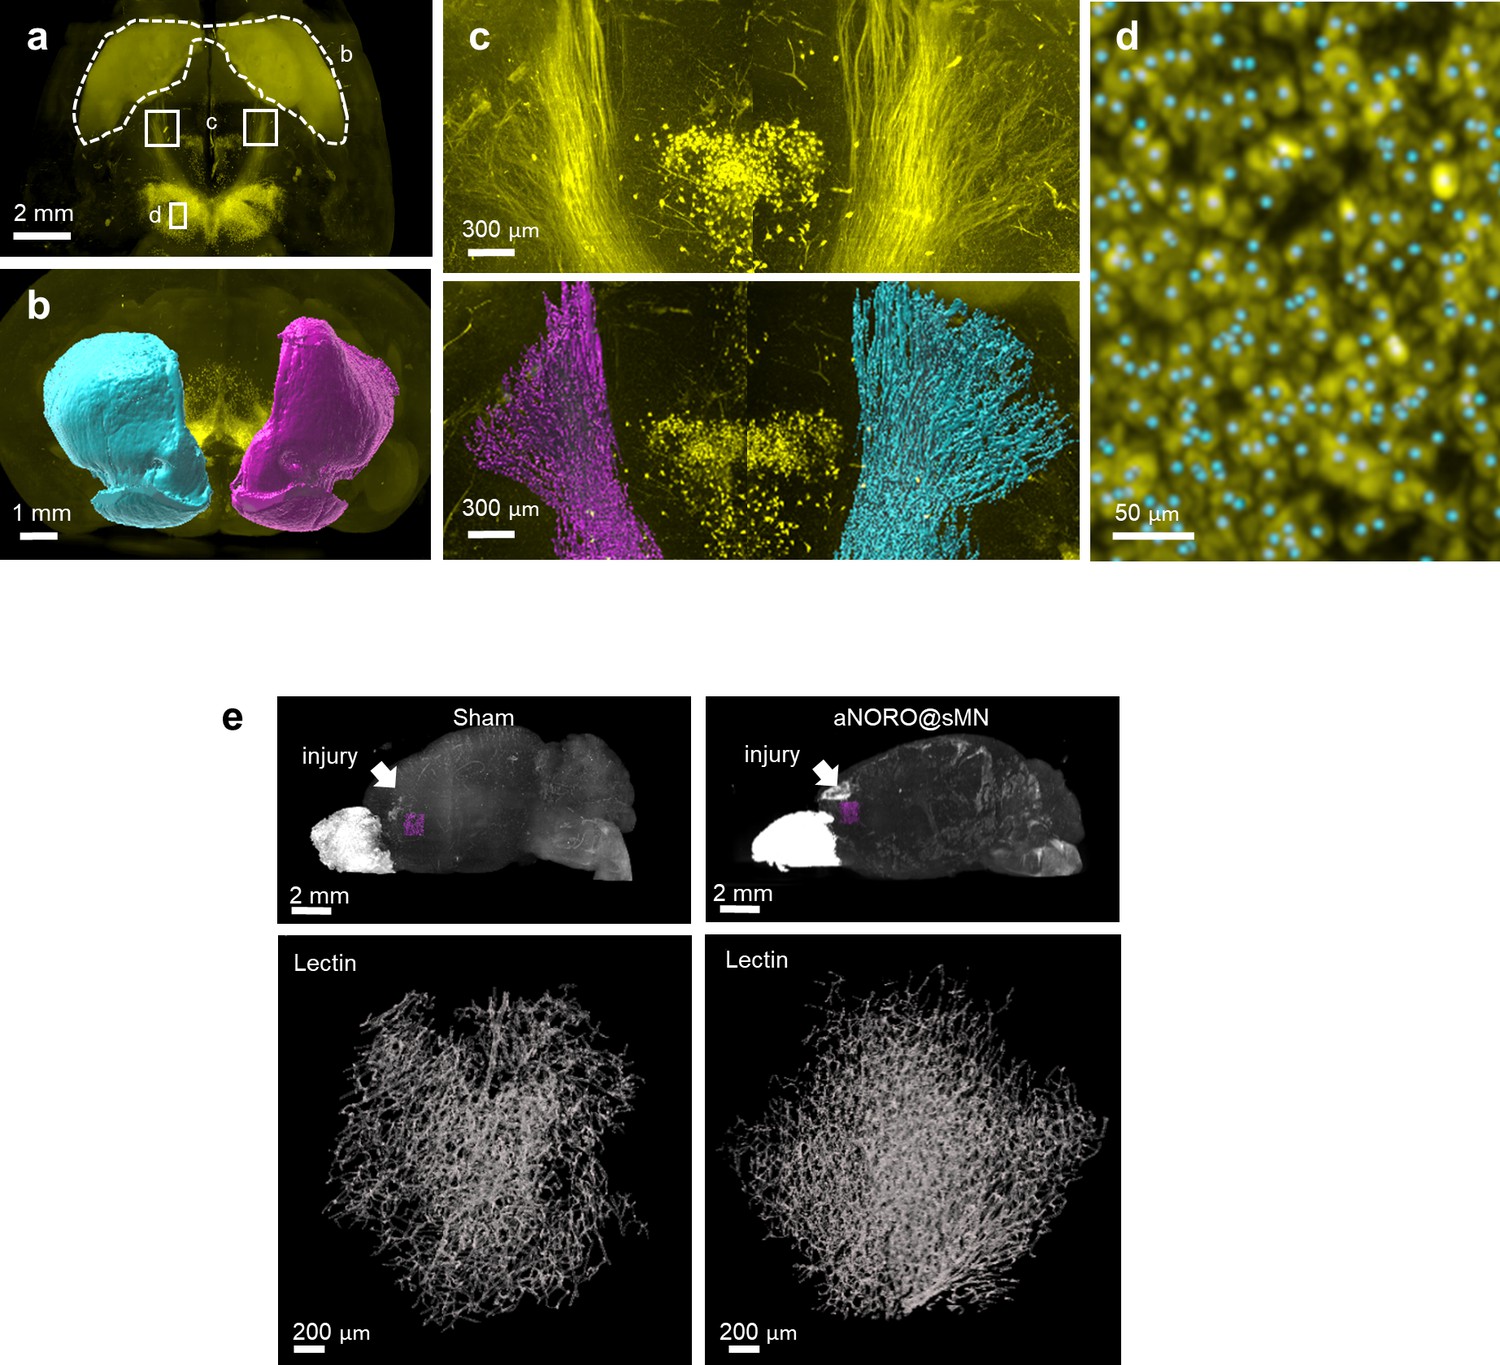
Segmentation of dopaminergic regions and blood vessels in PFA-SDS traumatic brain injury (TBI) mouse brains.
(a) Whole-brain projection light-sheet image focusing on tyrosine hydroxylase (TH)-positive regions. (b) Frontal view of segmented striatum (dashed outline in a). Magenta: the injured side; cyan: the contralateral side. (c) Horizontal views of the nigrostriatal fiber tract (paired white boxes in a); fluorescence (top) and segmented (bottom) images are shown. Magenta: the injured side; cyan: the contralateral side. (d) Detection of dopaminergic cells in the substantia nigra (SN). Magnification of the area marked area in (a) (white box), including the TH fluorescence signal (yellow) and segmented cell spots (cyan dots). (e) Reconstruction of blood vessels in PFA-SDS TBI brains with or without treatments. The regions of interest (ROIs) selected for assessment of angiogenesis are indicated in the top row (magenta boxes, directly below the injury site). 3D reconstructions of blood vessels are shown in the bottom row. PFA, paraformaldehyde.
Figure 7—figure supplement 2
Quantifications of FFPE-HIF-Clear and PFA-SDS samples result in identical statistical trends.
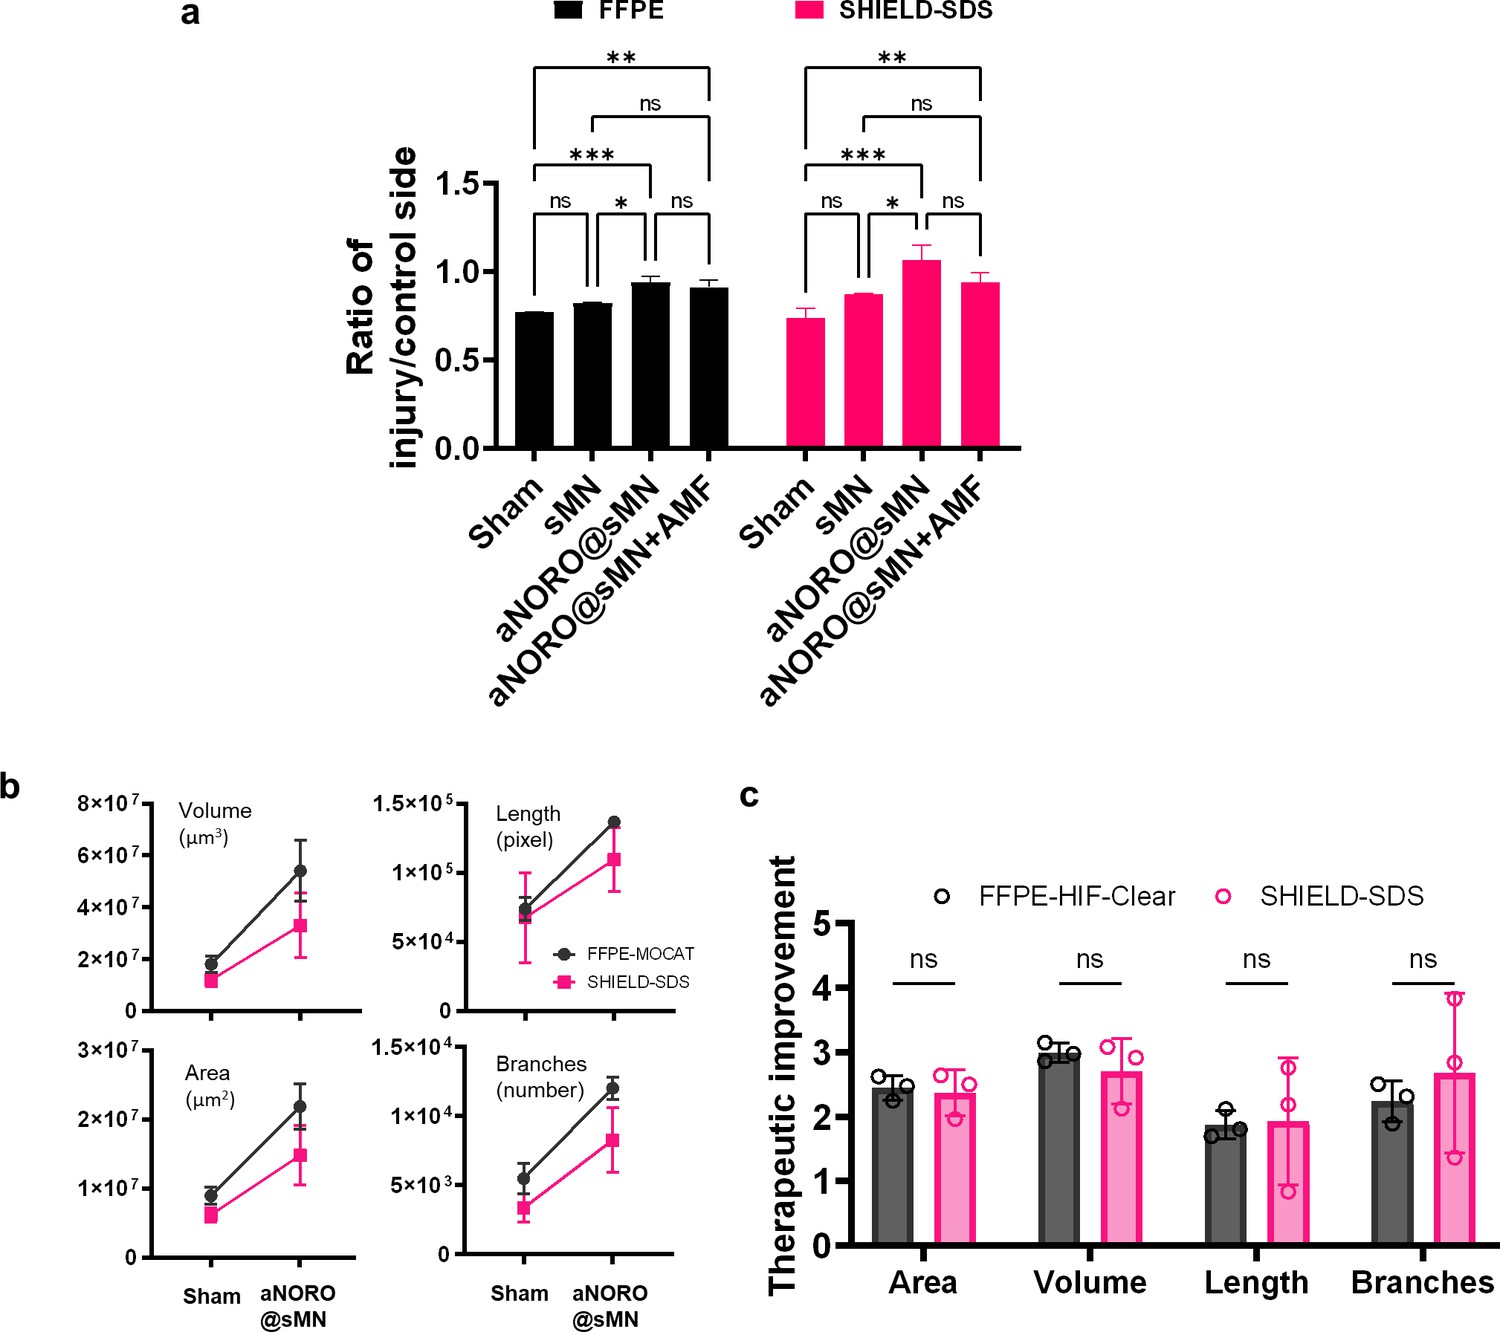
(a) Quantification of FFPE-HIF-Clear and PFA-SDS brains reveals identical inter-subgroup differences. n = 3 (three indicators: striatum volume, nigrostriatal fiber tract volume, substantia nigra [SN] cell number), mean ± SD, *p<0.05, ** p<0.01, ***p<0.001, ****p<0.0001, one-way ANOVA with Tukey’s multiple comparison test. (b) Quantification of blood vessel volume, blood vessel surface area, number of blood vessel branches, and blood vessel length. n = 3, mean ± SD. (c) Comparison between the quantification results for the FFPE-HIF-Clear and PFA-SDS mouse brain samples. Multiple independent t-tests were performed. n = 3, ns = not significant; p=0.93, 0.87, 0.93, and 0.92 from left to right, respectively. PFA, paraformaldehyde; FFPE, formalin-fixed paraffin-embedded.
Figure 7—video 1
Spatial relationships of the tumor and surrounding astrocytes in Figure 7A–E.
The segmented astrocytes are colored according to the cell-to-tumor distance code.
Figure 7—video 2
3D visualization of the segmented blood vessels shown in Figure 7L.
Figure 8 with 1 supplement
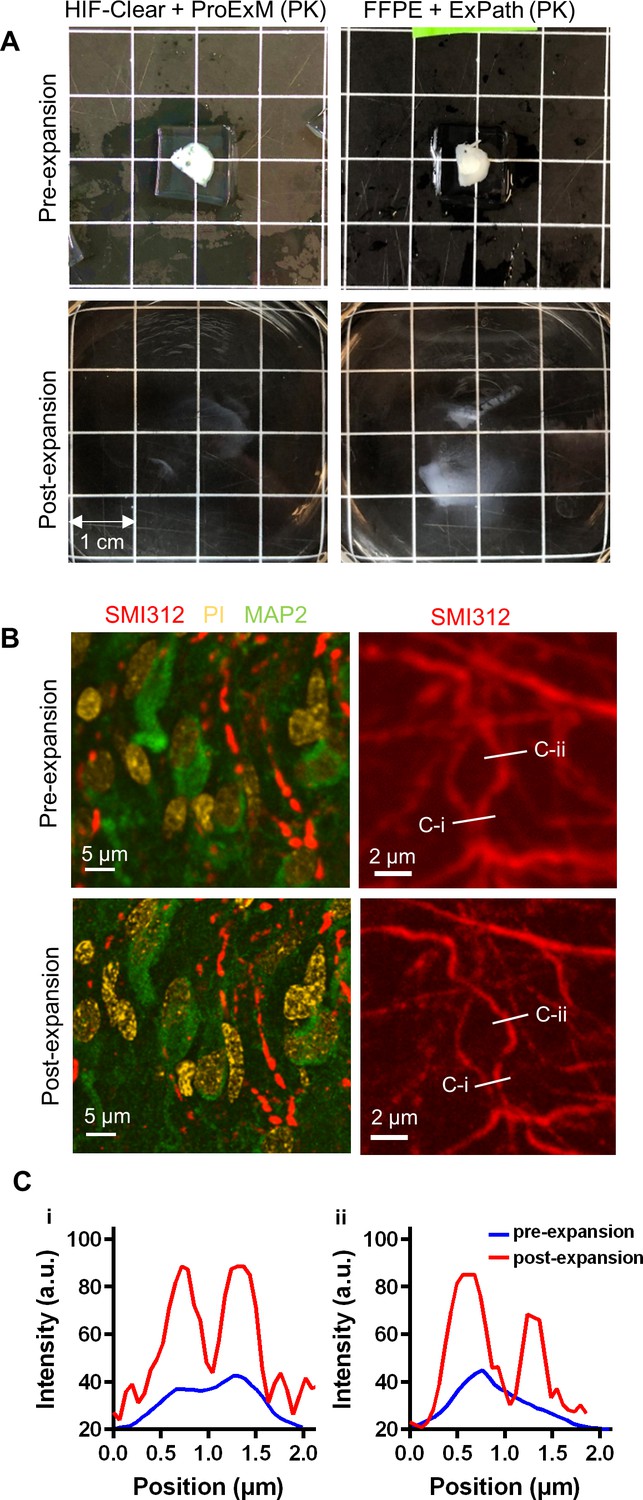
Expansion microscopy on an FFPE-HIF-Clear human brain specimen.
(A) Gross views of expansion of a 1 mm FFPE specimen. (B) Fluorescence images of an FFPE human brain pre- (top row) and post-expansion (bottom row). Left: merged images of multiplexed staining; right: fluorescence images of SMI312 staining. (C) Profiles of axon signal intensity taken along the white lines shown in the images of the right panel in (B). The scale bar has been divided by the expansion factor. FFPE, formalin-fixed paraffin-embedded .
Figure 8—figure supplement 1
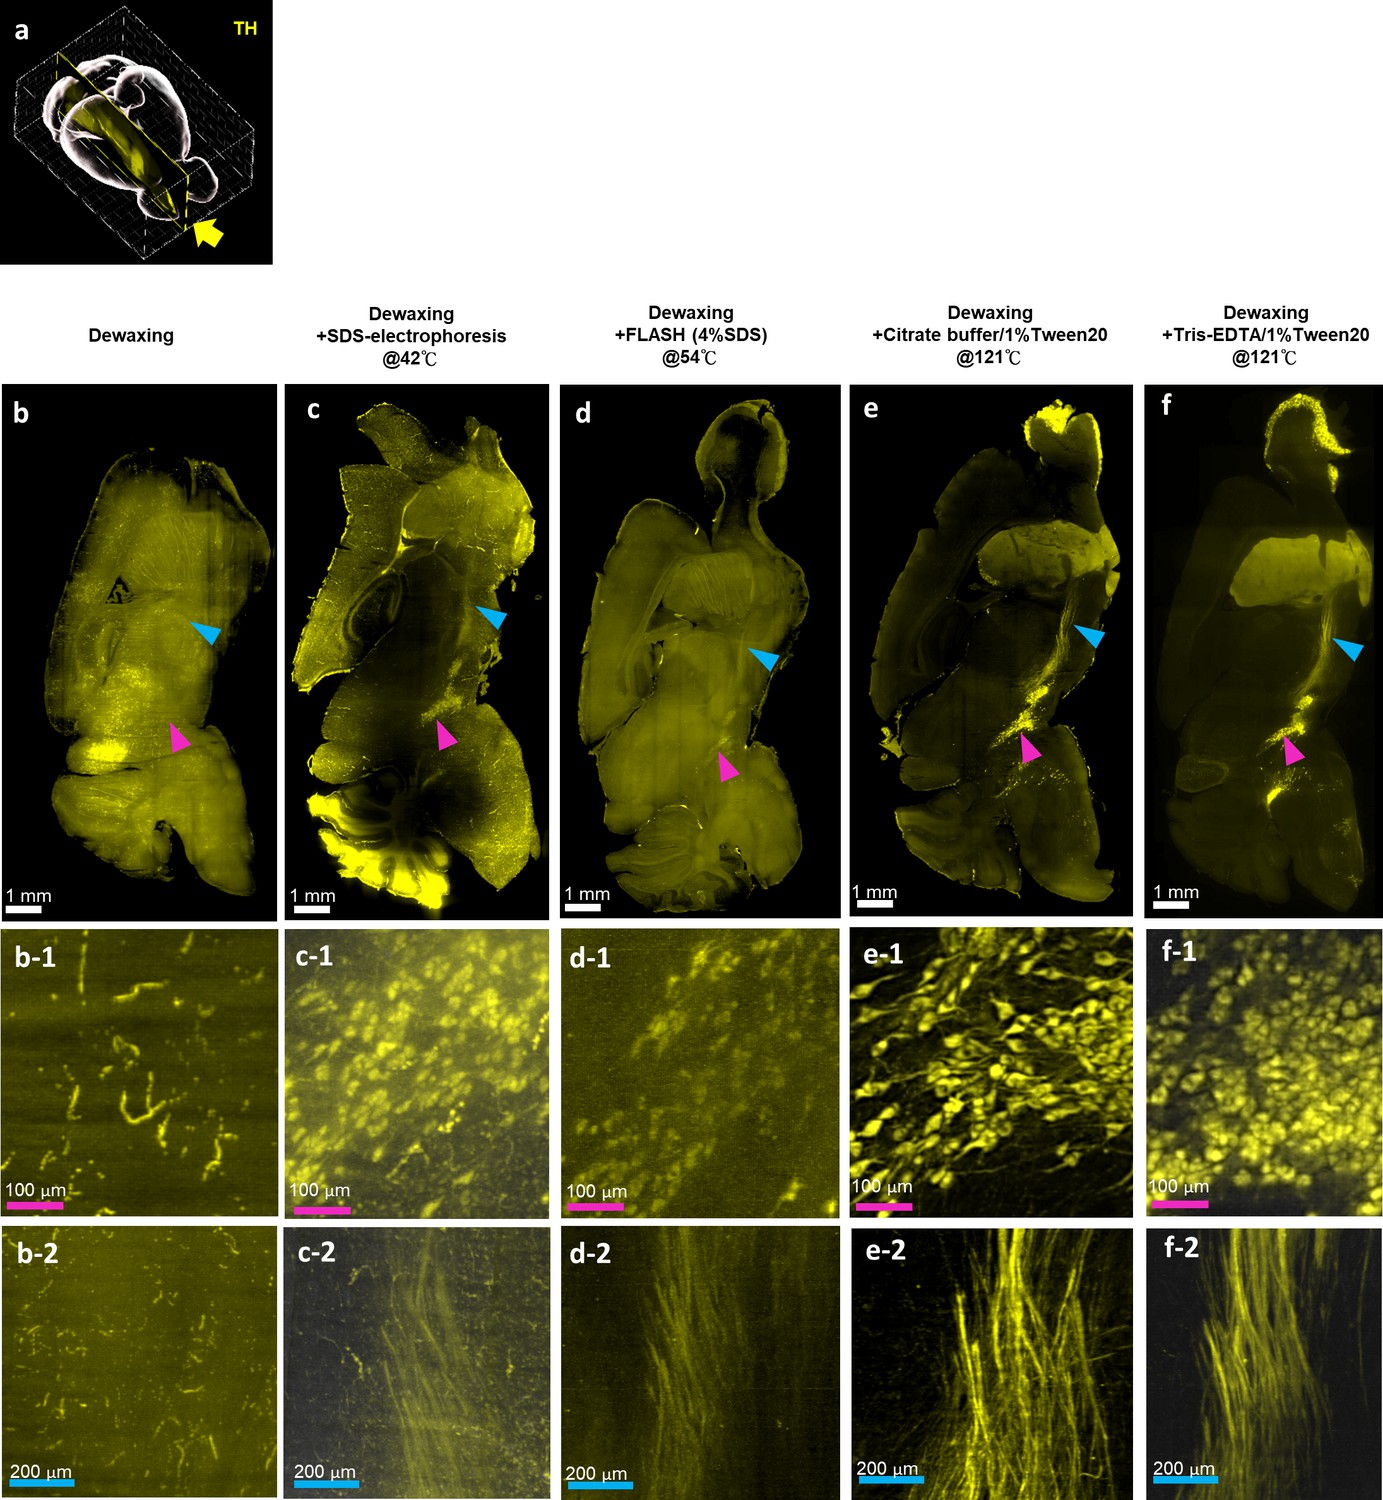
Effects of various antigen retrieval conditions on formalin-fixed paraffin-embedded (FFPE) mouse brains.
Light-sheet images of an FFPE mouse brain hemisphere stained with tyrosine hydroxylase (TH) antibodies to evaluate the effects of different antigen retrieval methods. (a) The position of the Y-Z plane (yellow arrow) shown in (b–e) is indicated. The substantia nigra (magenta arrowhead) and nigrostriatal fiber tract (cyan arrowhead) are indicated. In the mouse brain not subjected to antigen retrieval (b), TH signal is not detectable. The locations where TH signal should highlight the substantia nigra and nigrostriatal fiber tract are indicated by the colored arrowheads. (b-1), (c-1), (d-1), and (e-1) show magnifications of the substantia nigra indicated by the magenta arrowheads in (b), (c), (d), and (e). In (b-2), (c-2), (d-2), and (e-2), magnifications of the nigrostriatal fiber tract indicated by cyan arrowheads are shown.
Additional files
-
Supplementary file 1
The antibodies used in the study.
- https://cdn.elifesciences.org/articles/93212/elife-93212-supp1-v1.xlsx
-
Supplementary file 2
Abbreviations of brain regions mentioned in Figure 2B.
- https://cdn.elifesciences.org/articles/93212/elife-93212-supp2-v1.xlsx
-
Supplementary file 3
The antibody conditions in the multi-round immunolabeling shown in Figure 3.
- https://cdn.elifesciences.org/articles/93212/elife-93212-supp3-v1.xlsx
-
MDAR checklist
- https://cdn.elifesciences.org/articles/93212/elife-93212-mdarchecklist1-v1.docx
Download links
A two-part list of links to download the article, or parts of the article, in various formats.
Downloads (link to download the article as PDF)
Open citations (links to open the citations from this article in various online reference manager services)
Cite this article (links to download the citations from this article in formats compatible with various reference manager tools)
Revealing intact neuronal circuitry in centimeter-sized formalin-fixed paraffin-embedded brain
eLife 13:RP93212.
https://doi.org/10.7554/eLife.93212.4


