Figures
Figure 1
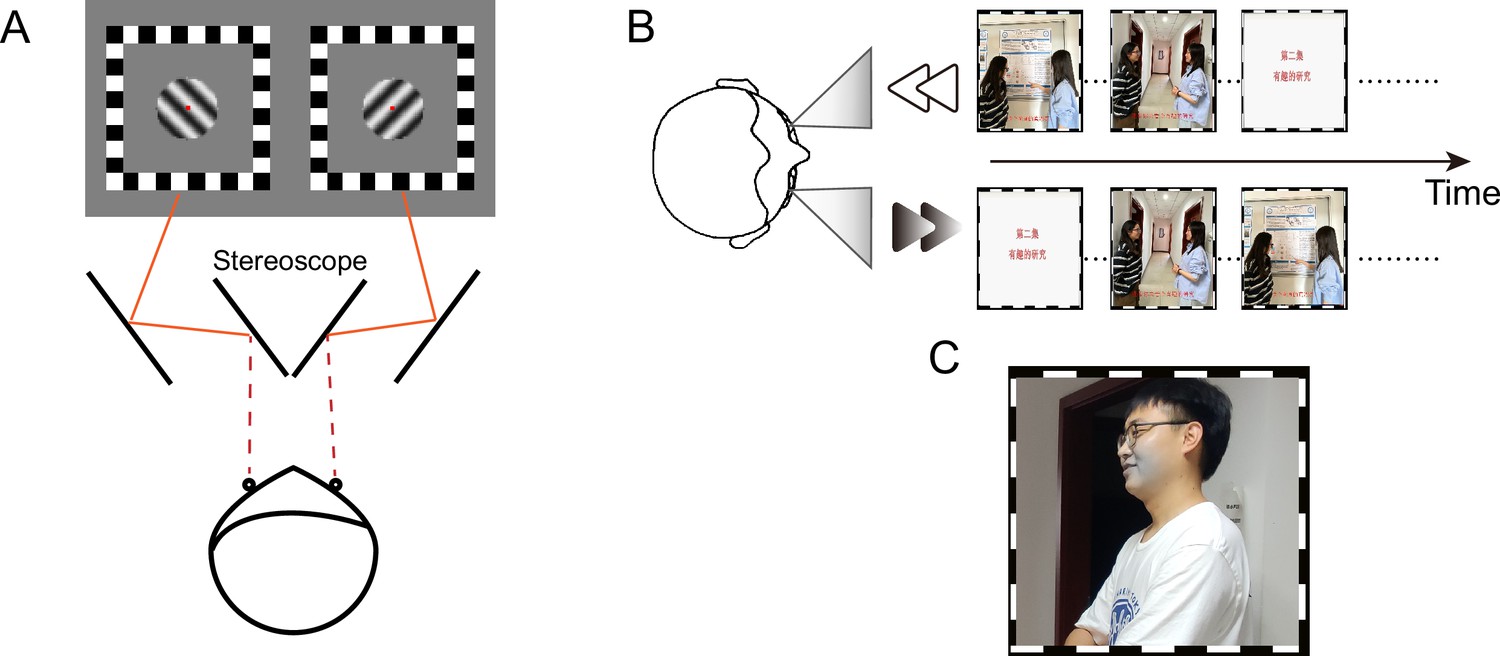
Schematic diagram of the (A) binocular rivalry task, (B) 'dichoptic-backward-movie’ paradigm, and (C) blob target stimulus (see the gray region around the mouth in this example).
This figure presents identifiable images of human faces solely for the purpose of demonstration, which were captured from the authors (F. Song, J. Wang, and J. Zhao) of this article. The movie images used in the experiment are not displayed in this figure due to potential copyright issues.
Figure 2
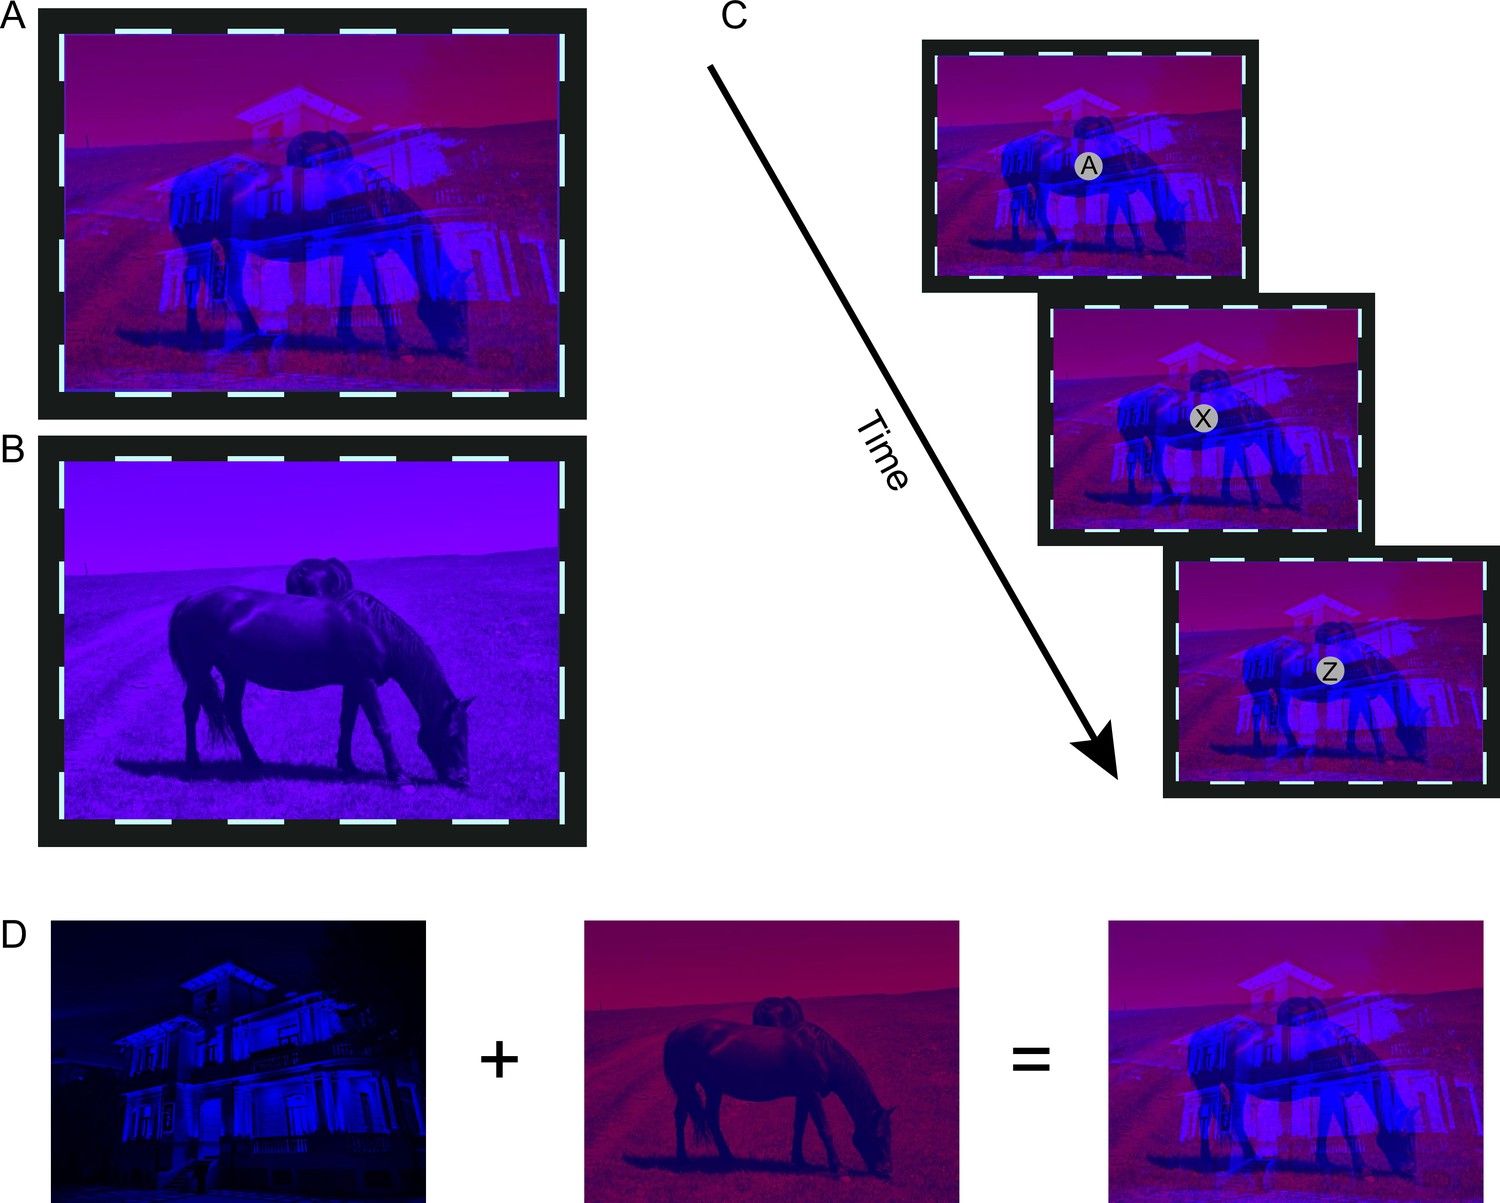
The schematic of stimuli in (A) dichoptic condition or (B) the binocular condition in the experimental runs.
(C) The schematic of rapid serial visual presentation (RSVP) task in the control runs. For demonstration purposes, the letters and fixation points are enlarged. (D) Schematic illustration of the generation process for red-blue movie images employed in the dichoptic condition.
Figure 3
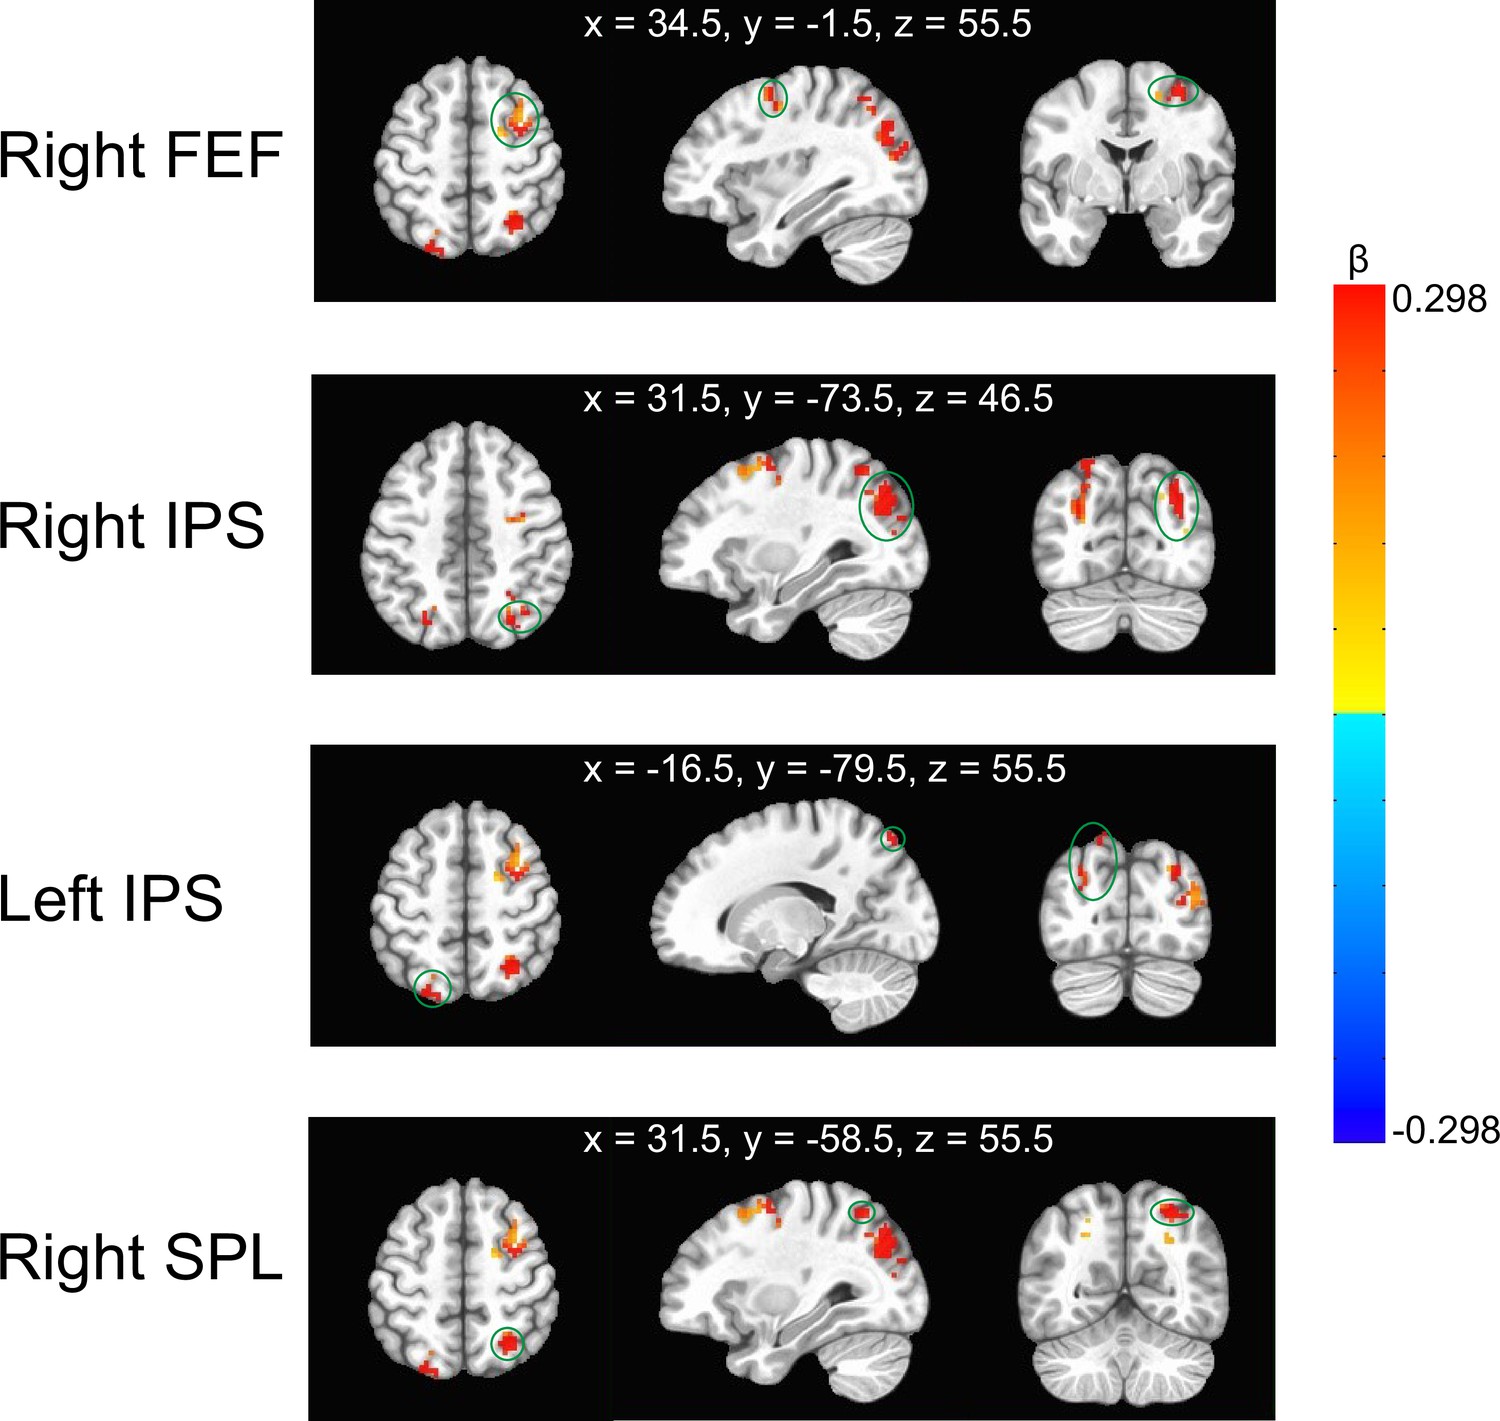
Illustration of the clusters with stronger ‘dichoptic-binocular’ contrast in the experimental runs than in the control runs.
They were located in the right frontal eye field (FEF), bilateral intraparietal sulcus (IPS), and the right superior parietal lobule (SPL). The green circles indicate the corresponding cluster. The MNI coordinates represent the locations of peak voxels of each cluster. The color bar denotes the difference of ‘dichoptic-binocular’ contrast (β values) between the experimental and control runs.
Figure 4
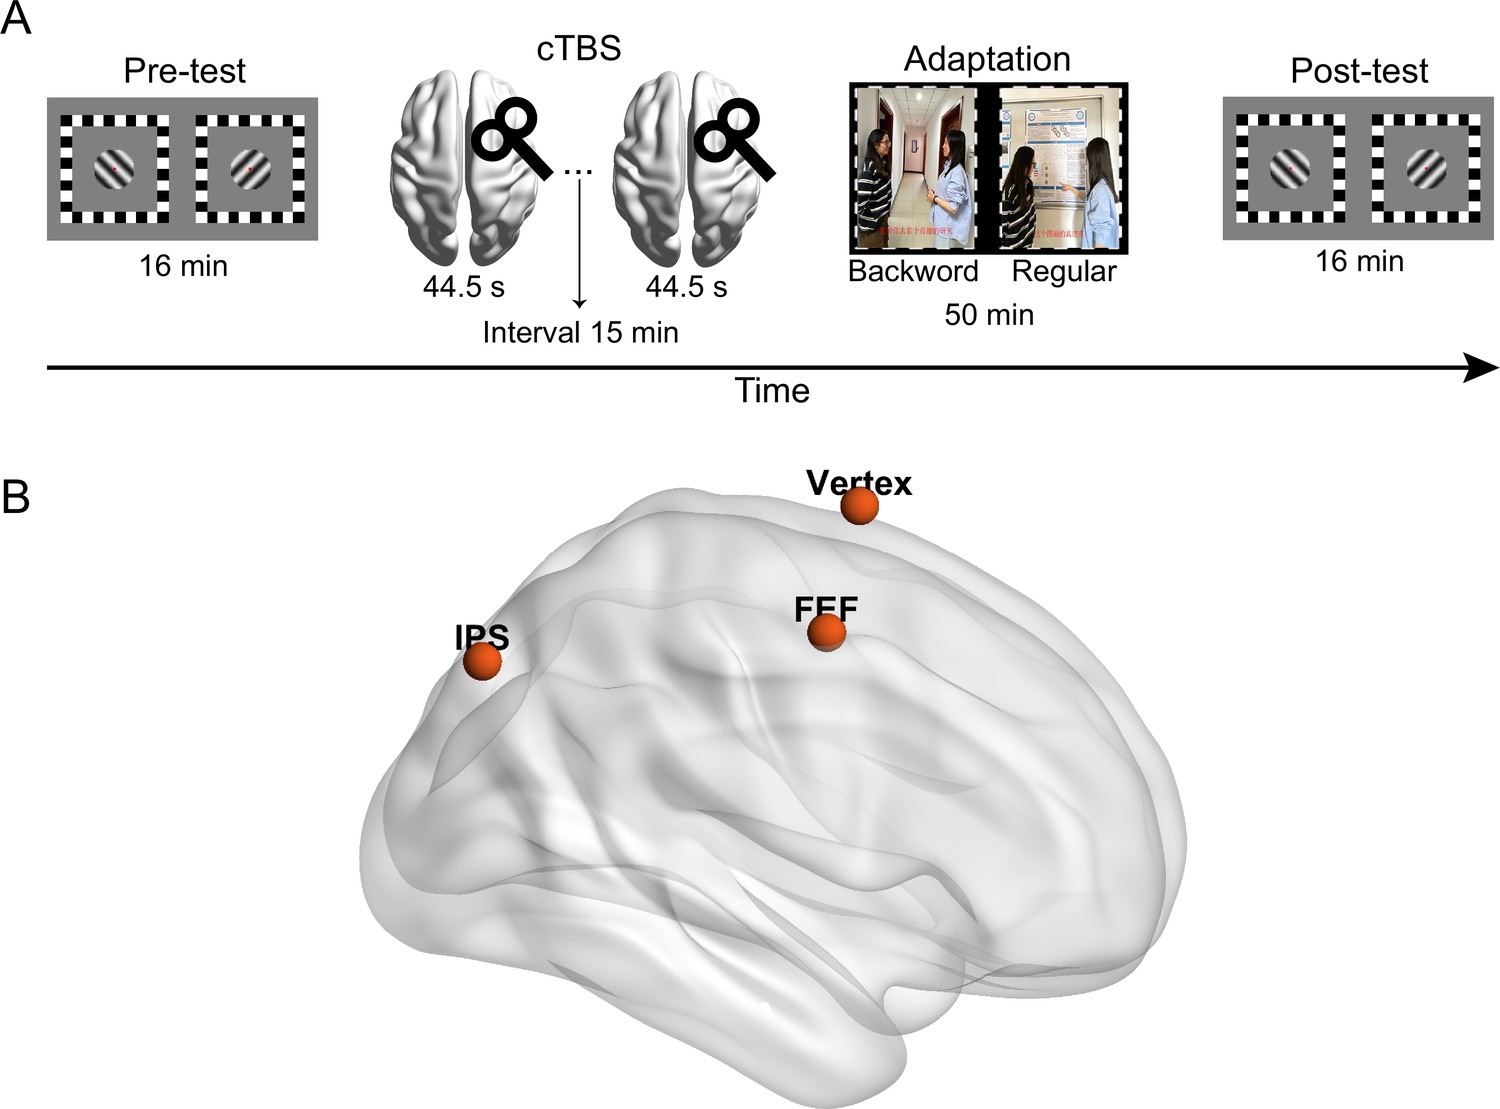
Illustration of (A) the process in Experiment 2 and (B) the stimulation sites of continuous theta burst stimulation (cTBS).
Figure 5
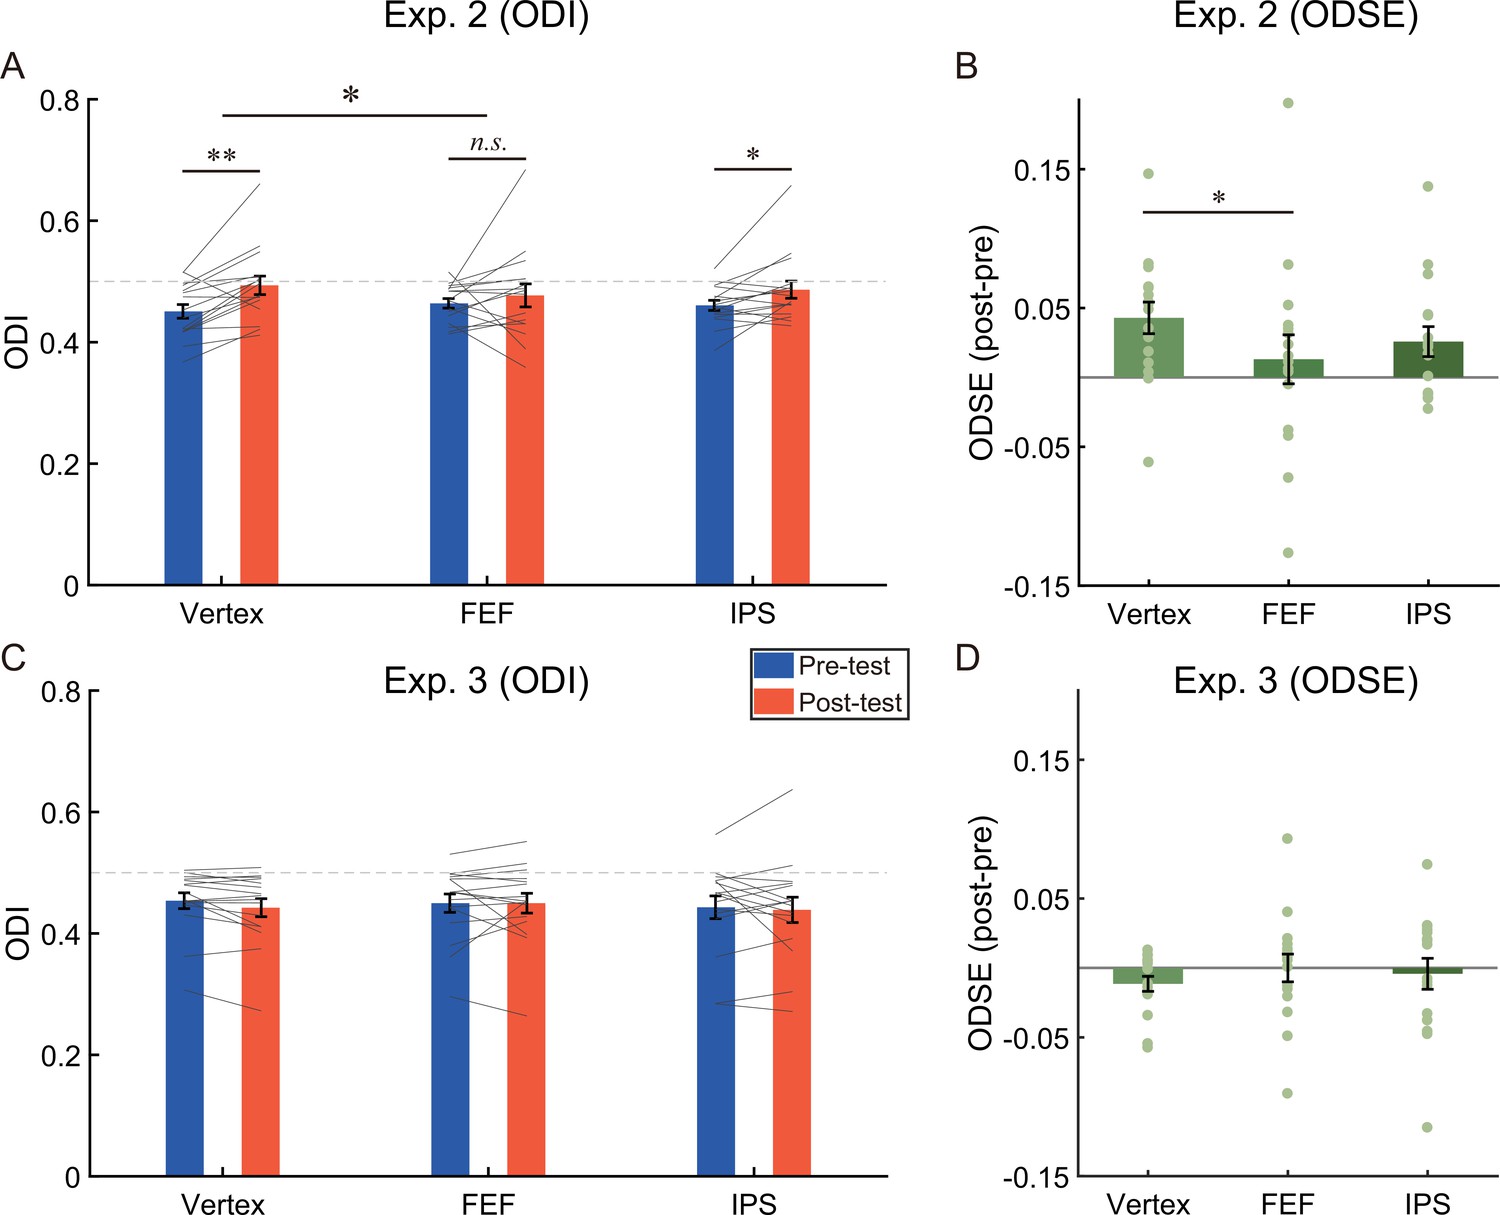
The results of (A) the ocular dominance index (ODI), (B) the ocular dominance shift effects (ODSE) in Experiment 2 (N = 16), (C) the ODI, and (D) the ODSE in Experiment 3 (N = 16).
The bars show the grand average data for each condition. The individual data are plotted with gray lines or dots. The dashed gray line represents the absolute balance point for the two eyes (ODI=0.5). Error bars indicate standard errors of means. A repeated measures ANOVA was used to investigate the change of ocular dominance. Post-hoc tests were conducted using paired t-tests (2-tailed significance level at α = 0.05), and the resulting p-values were corrected for multiple comparisons using the false discovery rate (FDR) method. *p<0.05; **p<0.01; n.s. p>0.05.
Figure 6
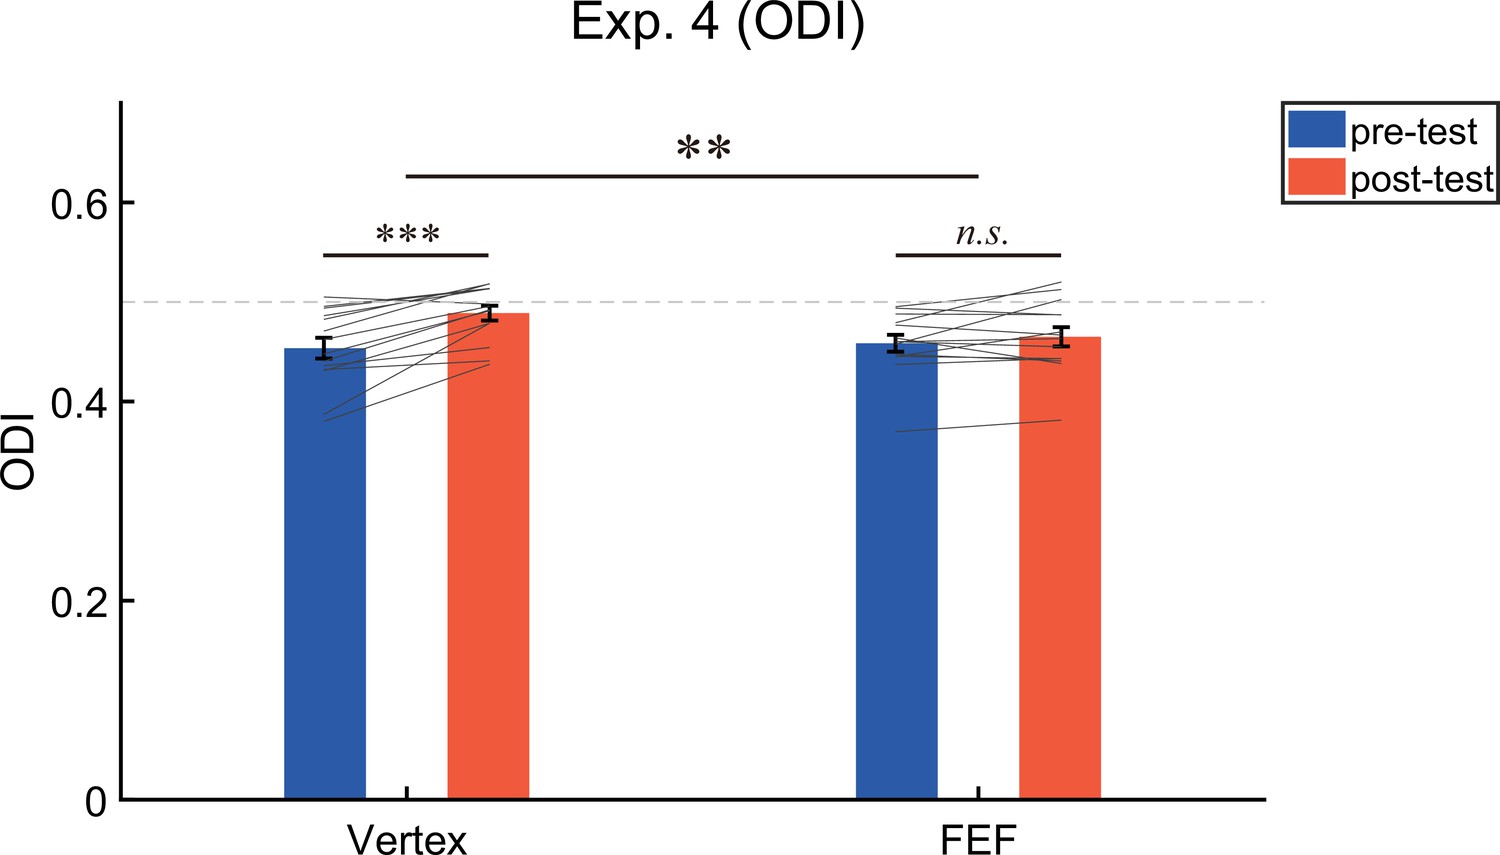
The results of the ocular dominance index (ODI) in Experiment 4 (N = 14).
The bars show the grand average data for each condition. The individual data are plotted with gray lines. The dashed gray line represents the absolute balance point for the two eyes (ODI=0.5). Error bars indicate standard errors of means. A repeated measures ANOVA was used to investigate the change of ocular dominance. Post-hoc tests were conducted using paired t-tests (2-tailed significance level at α = 0.05), and the resulting p-values were corrected for multiple comparisons using the FDR method. **p<0.01; ***p<0.001; n.s. p>0.05.
Figure 7
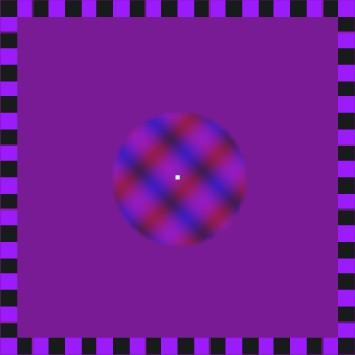
Illustration of binocular rivalry stimuli in the screening process.
Author response image 1

The results of (A) the ocular dominance index (ODI), (B) the ocular dominance shift effects (ODSE) in Experiment 2, (C) the ODI and (D) the ODSE in Experiment 3.
The bars show the grand average data for each condition. The individual data are plotted with gray lines or dots. The dashed gray line represents the absolute balance point for the two eyes (ODI = 0.5). Error bars indicate standard errors of means. * p < .05; ** p < .01; n.s. p > .05.
Additional files
Download links
A two-part list of links to download the article, or parts of the article, in various formats.
Downloads (link to download the article as PDF)
Open citations (links to open the citations from this article in various online reference manager services)
Cite this article (links to download the citations from this article in formats compatible with various reference manager tools)
Causal role of the frontal eye field in attention-induced ocular dominance plasticity
eLife 12:RP93213.
https://doi.org/10.7554/eLife.93213.3


