Rifampicin tolerance and growth fitness among isoniazid-resistant clinical Mycobacterium tuberculosis isolates from a longitudinal study
- Oxford University Clinical Research Unit, Viet Nam
- Centre for Tropical Medicine and Global Health, Nuffield Department of Medicine, University of Oxford, United Kingdom
- Theoretical Microbial Ecology, Institute of Microbiology, Faculty of Biological Sciences, Friedrich Schiller University, Germany
- Cluster of Excellence Balance of the Microverse, Friedrich Schiller University Jena, Germany
- Pham Ngoc Thach Hospital, Viet Nam
- Department of Clinical Sciences, Liverpool School of Tropical Medicine, United Kingdom
- Division of Experimental Medicine, University of California, San Francisco, United States
Figures
Figure 1
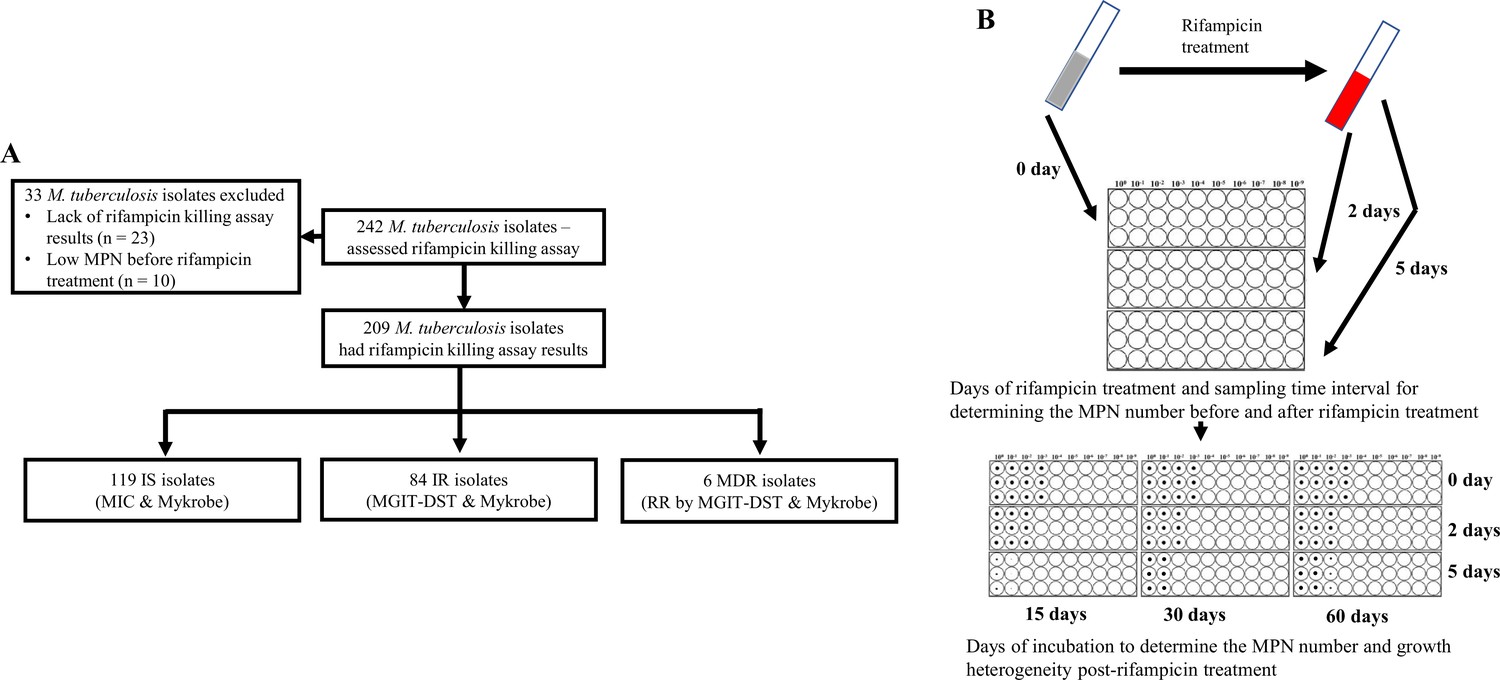
Study design.
(A) Study design. IS – Isoniazid susceptible, IR – Isoniazid-resistant, RR – Rifampicin-resistant. (B) Most-probable number-based rifampicin killing assay and survival fraction determination.
Figure 2 with 3 supplements
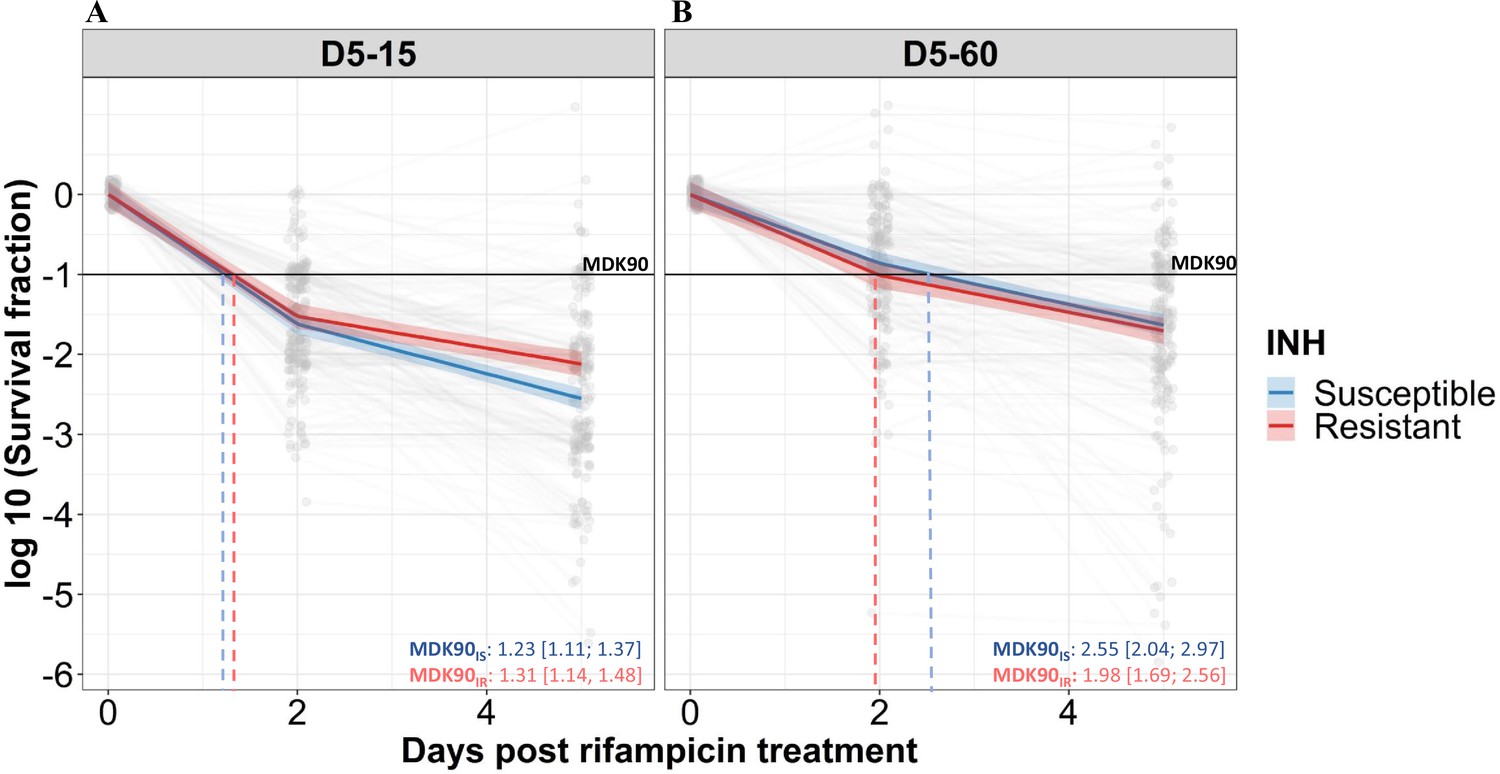
Rifampicin survival curve in isoniazid susceptible and resistant clinical M. tuberculosis isolates.
(A, B) The bacterial kill curve as measured by log10 survival fraction from data collected at 0, 2, and 5 days of rifampicin treatment followed by incubation for 15 and 60 days, respectively. Data from individual isolates are shown as gray dots connected by lines. Estimated mean with 95% credible interval (bold coloed line and color shaded area, respectively) of isoniazid susceptible (IS, Isoniazid susceptible – blue, n=119, 117 for 15 and 60 days of incubation, respectively) and resistant (IR, Isoniazid-resistant – red, n=84, 80 for 15 and 60 days of incubation, respectively) clinical M. tuberculosis isolates based on linear mixed effect model implemented in a Bayesian framework. One log10 fold or 90% reduction in survival fraction is indicated (MDK90, black horizontal line) and the mean time duration required for 90% reduction in survival (MDK90, minimum duration of killing time) at 15 and 60 days of incubation is indicated by vertical dashed lines with respective colors for IS and IR isolates.
Figure 2—figure supplement 1
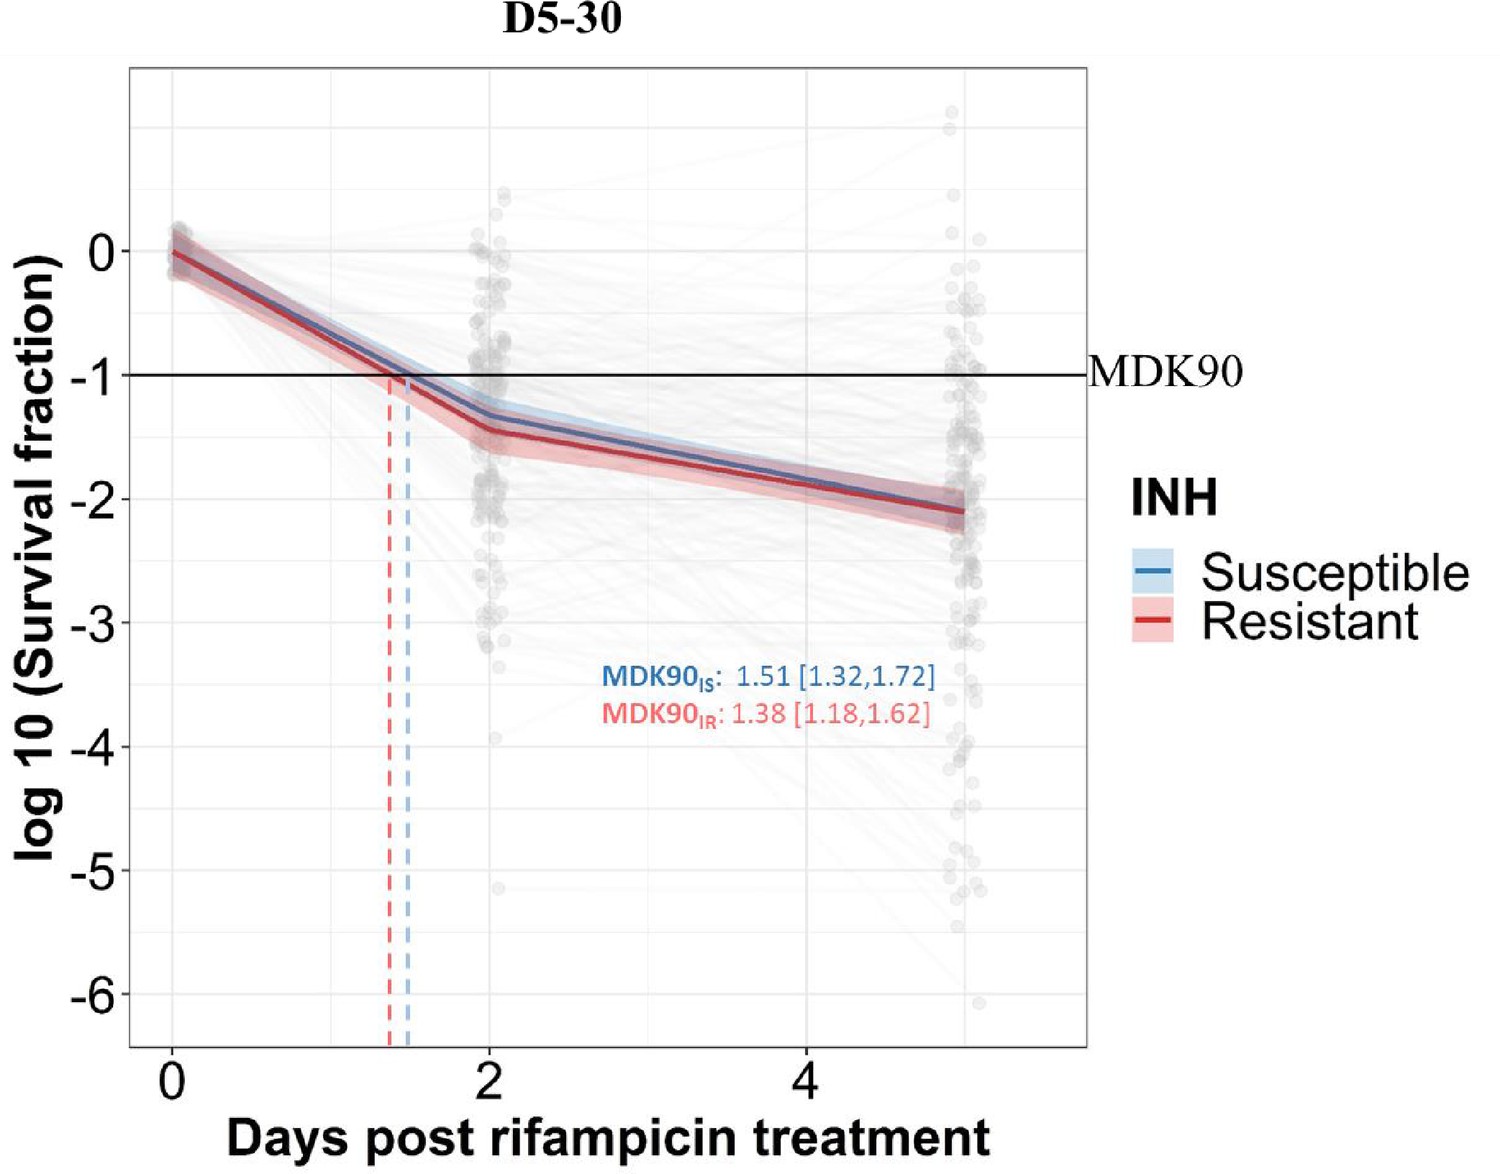
Rifampicin survival curve in isoniazid susceptible and resistant clinical M. tuberculosis isolates.
The bacterial kill curve as measured by log10 survival fraction from data collected at 0, 2, and 5 days of rifampicin treatment followed by incubation for 30 days. Data from individual isolates are shown as gray dots connected by lines. Estimated mean with 95% credible interval (bold colored line and color shaded area, respectively) of isoniazid susceptible (IS, Isoniazid susceptible – blue) and resistant (IR, Isoniazid-resistant – red) clinical M. tuberculosis isolates based on linear mixed effect model implemented in a Bayesian framework is given. One log10 fold or 90% reduction in survival fraction is indicated (MDK90, black horizontal line) and the mean time duration required for 90% reduction in survival (MDK90, minimum duration of killing time) is indicated by vertical dashed lines with respective colors for IS and IR isolates.
Figure 2—figure supplement 2
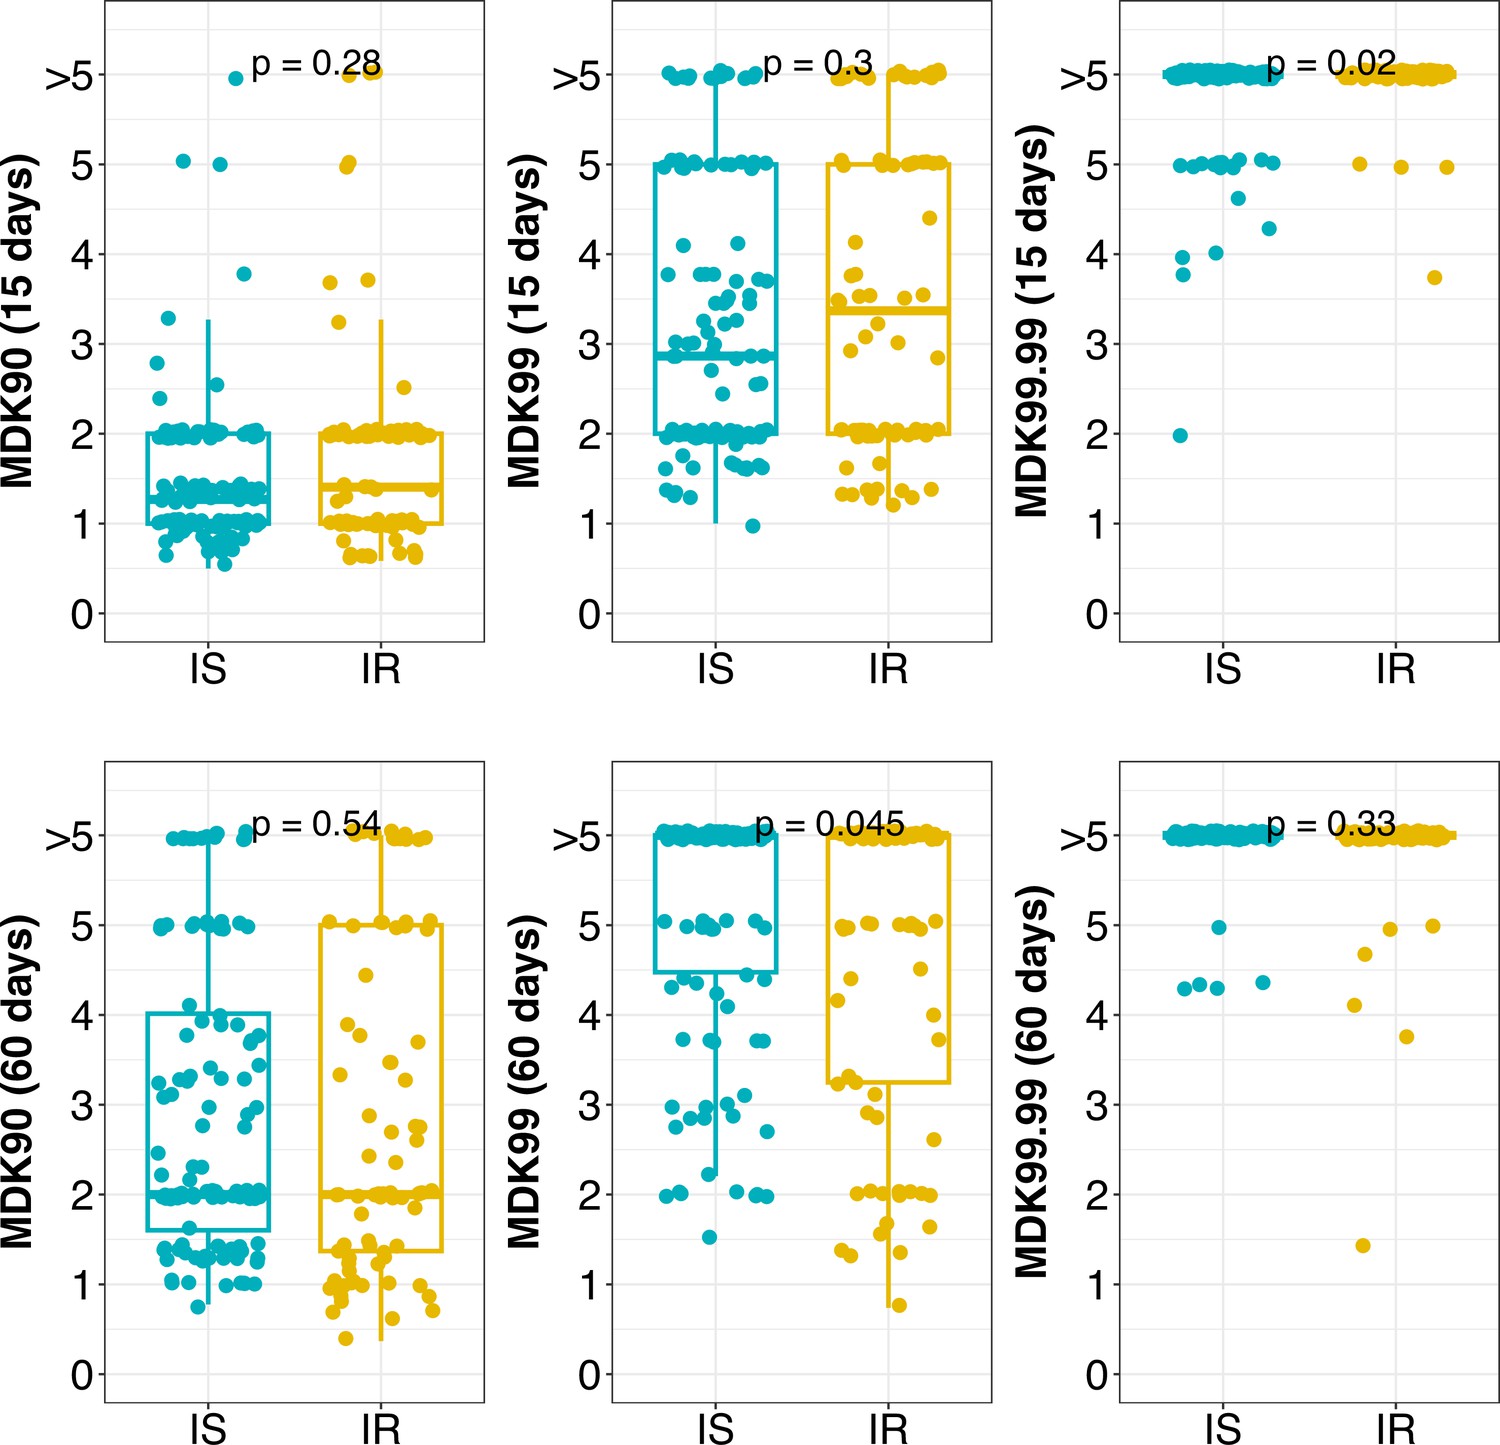
Distribution of MDK90, 99, and 99.99 time (in days) for isoniazid susceptible (IS) and resistant (IR) isolates at 15 and 60 days incubation.
Statistical comparisons between IS and IR were made by using the Wilcoxon rank-sum test. >5 indicate minimum duration of killing (MDK) time above the assay limit.
Figure 2—figure supplement 3
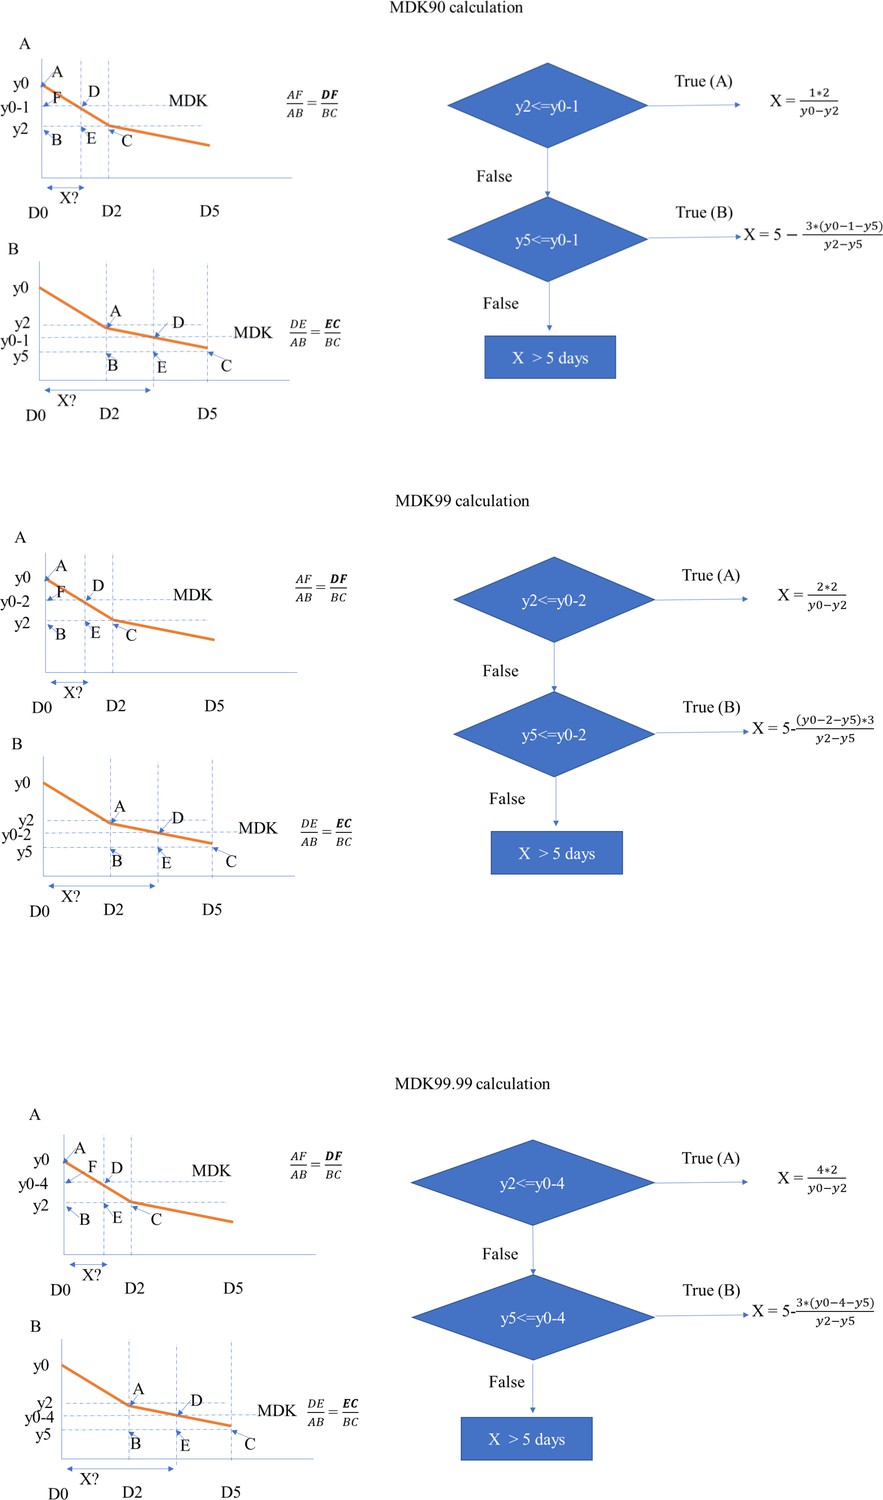
Flowchart for calculating MDK 90, 99, and 99.99 time for clinical M. tuberculosis isolates.
Figure 3 with 1 supplement
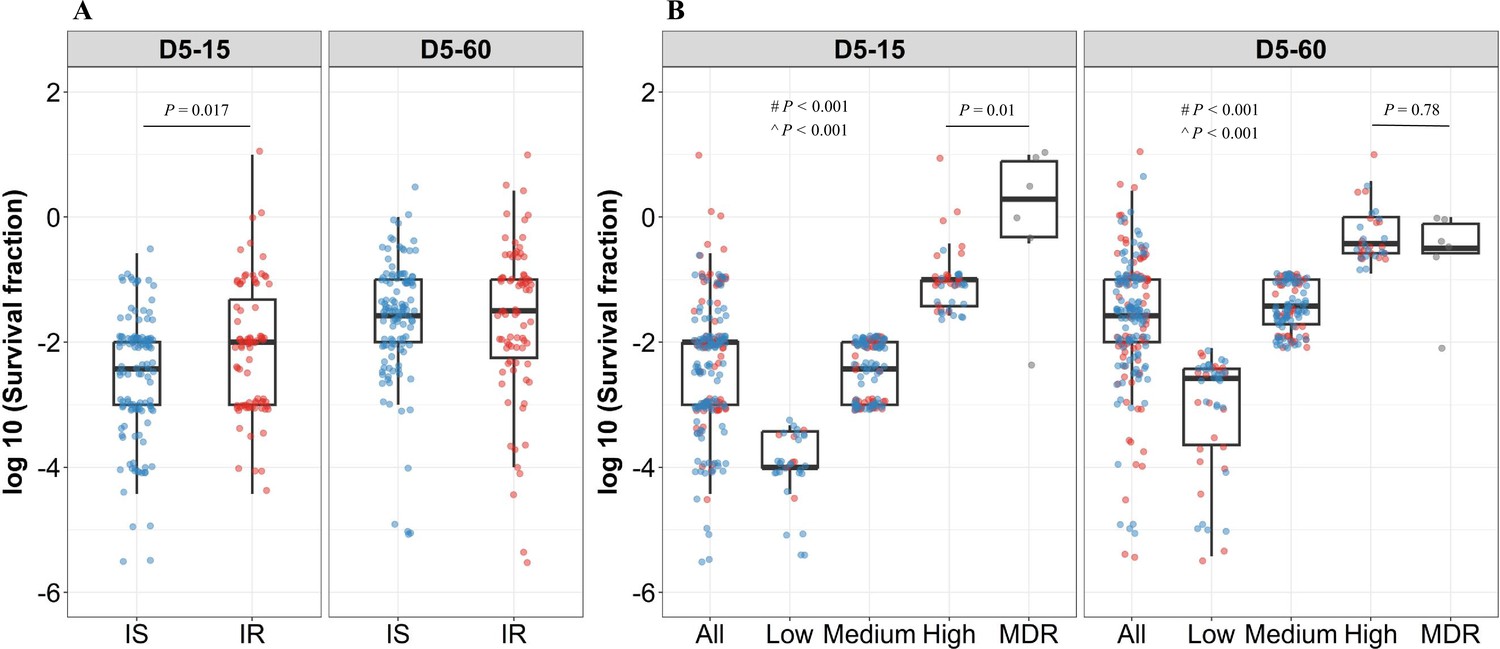
Rifampicin survival fraction distribution in isoniazid susceptible and resistant clinical M. tuberculosis isolates.
(A) Log10 rifampicin survival fraction distribution, with median and IQR (interquartile range), of individual isoniazid susceptible (IS, blue dots, n=119, 117 for D5-15, and D5-60, respectively), and resistant (IR, red dots, n=84, 80 for D5-15, D5-60, respectively) isolates for 5 days of rifampicin treatment as determined at 15 and 60 days of incubation (D5-15, D5-60, respectively). (B) Rifampicin tolerance distribution in both IS (blue dots) and IR (red dots) isolates combined together (All) was used to group them as low (<25 th percentile, n=33, 47 for D5-15, and D5-60, respectively), medium (from 25th to 75th percentile, n=124, 115 for D5-15, and D5-60, respectively) and high (above 75th percentile, n=46, 35 for D5-15, and D5-60, respectively) level of rifampicin tolerance and compare it with rifampicin tolerance of multi-drug resistant (MDR) clinical M. tuberculosis isolates (gray dots, n=6), after 5 days of rifampicin treatment and determined at 15 and 60 days of incubation (D5-15, D5-60, respectively). Statistical comparisons between Low, Medium, and High or MDR were made by using the Wilcoxon rank-sum test. # p-value for comparing the Low and High tolerance groups, ^ p-value for comparing the medium and High tolerance groups.
Figure 3—figure supplement 1
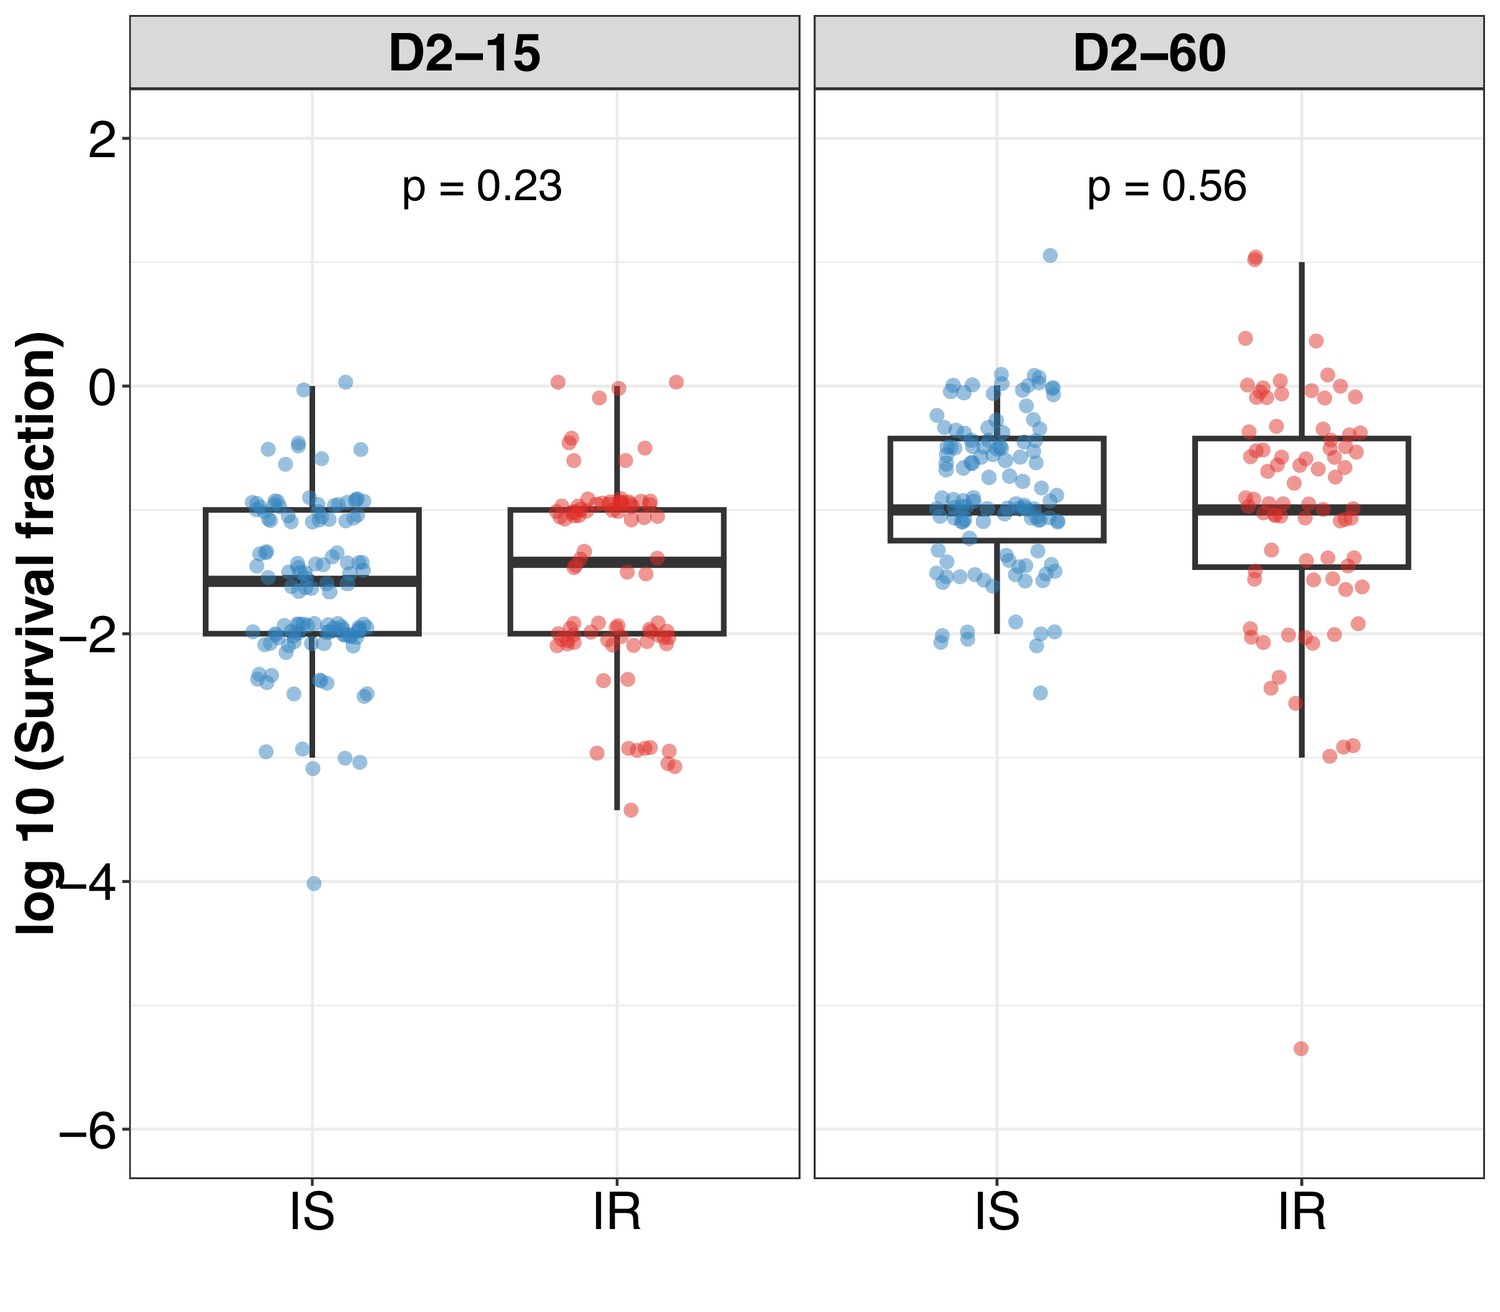
Log10 survival fraction distribution in isoniazid susceptible (IS) and resistant (IR) clinical M. tuberculosis isolates post 2 days of rifampicin treatment at 15 (D2-15) and 60 (D2-60) days of incubation.
Statistical comparisons between IS and IR were made by using the Wilcoxon rank-sum test.
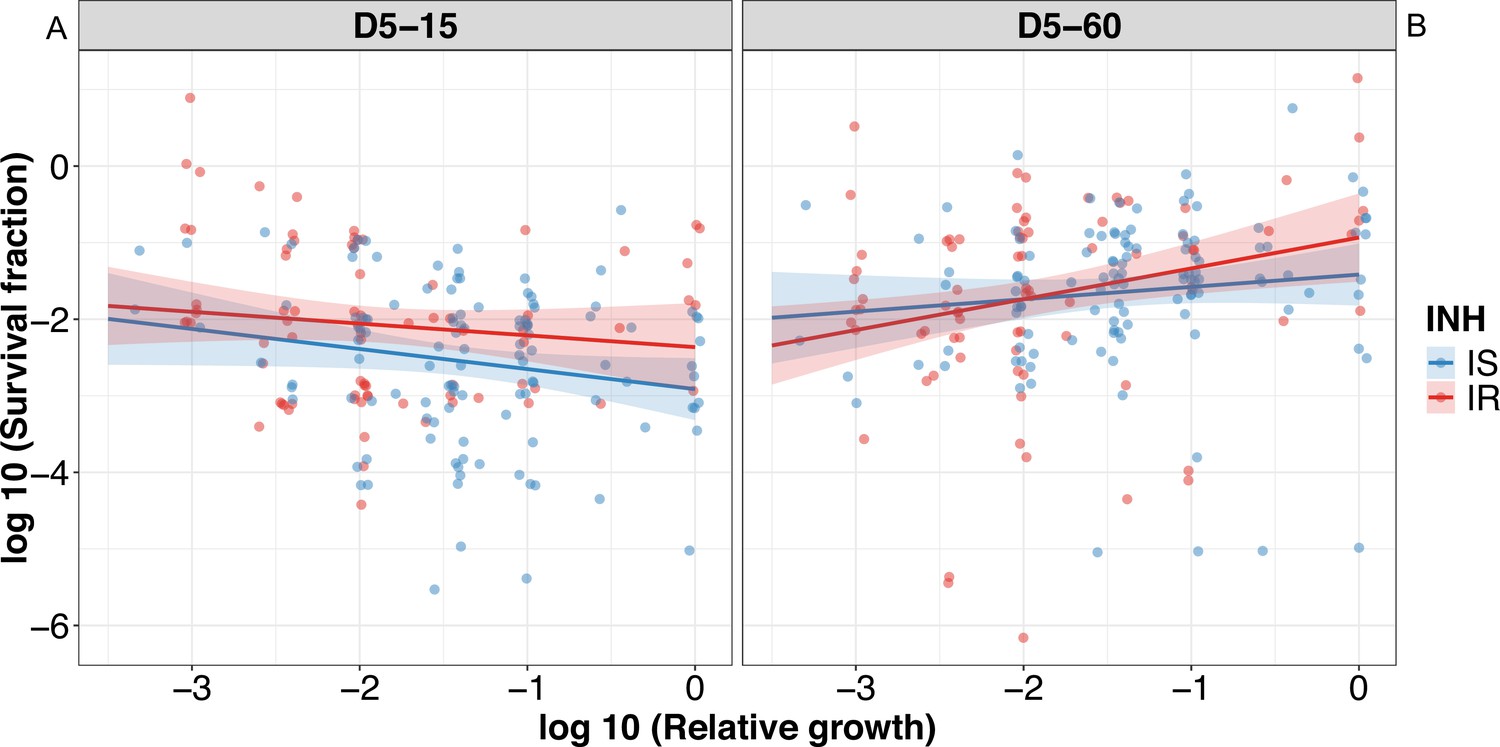
Figure 4 with 4 supplements
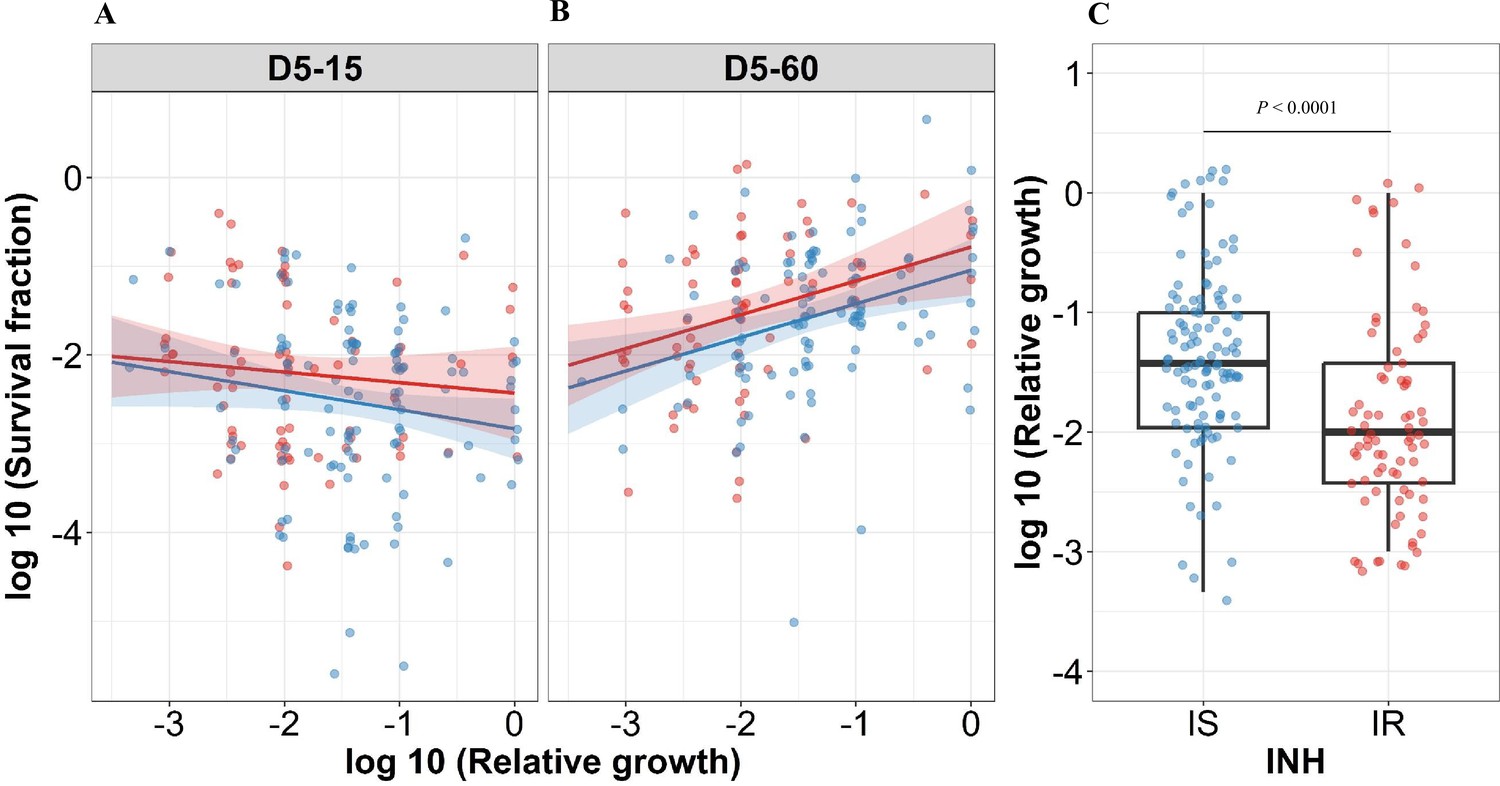
Correlating rifampicin survival fraction with before treatment relative growth of clinical M. tuberculosis isolates.
Log10 survival fraction at 5 days of rifampicin treatment as determined at 15 days (A) and 60 days of incubation (B), for isoniazid susceptible (IS, blue dots) and resistant (IR, red dots) isolates, respectively, correlated with the log10 relative growth determined before rifampicin treatment for clinical M. tuberculosis isolates. Coefficients of linear regression for (A) IS = −0.21 [-0.44, 0.007], p=0.058; IR = −0.12 [-0.38, 0.14], p=0.37, and (B) IS = 0.38 [0.15, 0.61], p=0.0014; IR = 0.38 [0.12, 0.64], p=0.0041. (C) Log10 distribution of relative growth with median and interquartile range (IQR) for IS and IR clinical M. tuberculosis isolates before rifampicin treatment. Statistical comparisons between IS and IR were made by using the Wilcoxon rank-sum test.
Figure 4—figure supplement 1
Correlating rifampicin survival fraction with before treatment relative growth of clinical M. tuberculosis isolates with outliers included.
Log10 survival fraction at 5 days of rifampicin treatment as determined at 15 days incubation (A) and for isoniazid susceptible (IS, blue dots) and resistant (IR, red dots) isolates, respectively, and at 60 days of incubation (B), and for IS (blue dots) and IR (red dots) isolates, respectively, correlated with the log10 relative growth determined before rifampicin treatment for clinical M. tuberculosis isolates. Coefficients of linear regression for (A) IS = −0.26 [-0.52,–0.0017], p = 0.051; IR = –0.15 [–0.43, 0.13], p=0.28, and (B) IS = 0.16 [-0.10, 0.42], p=0.23; IR = 0.40 [0.12, 0.68], p=0.005.
Figure 4—figure supplement 2
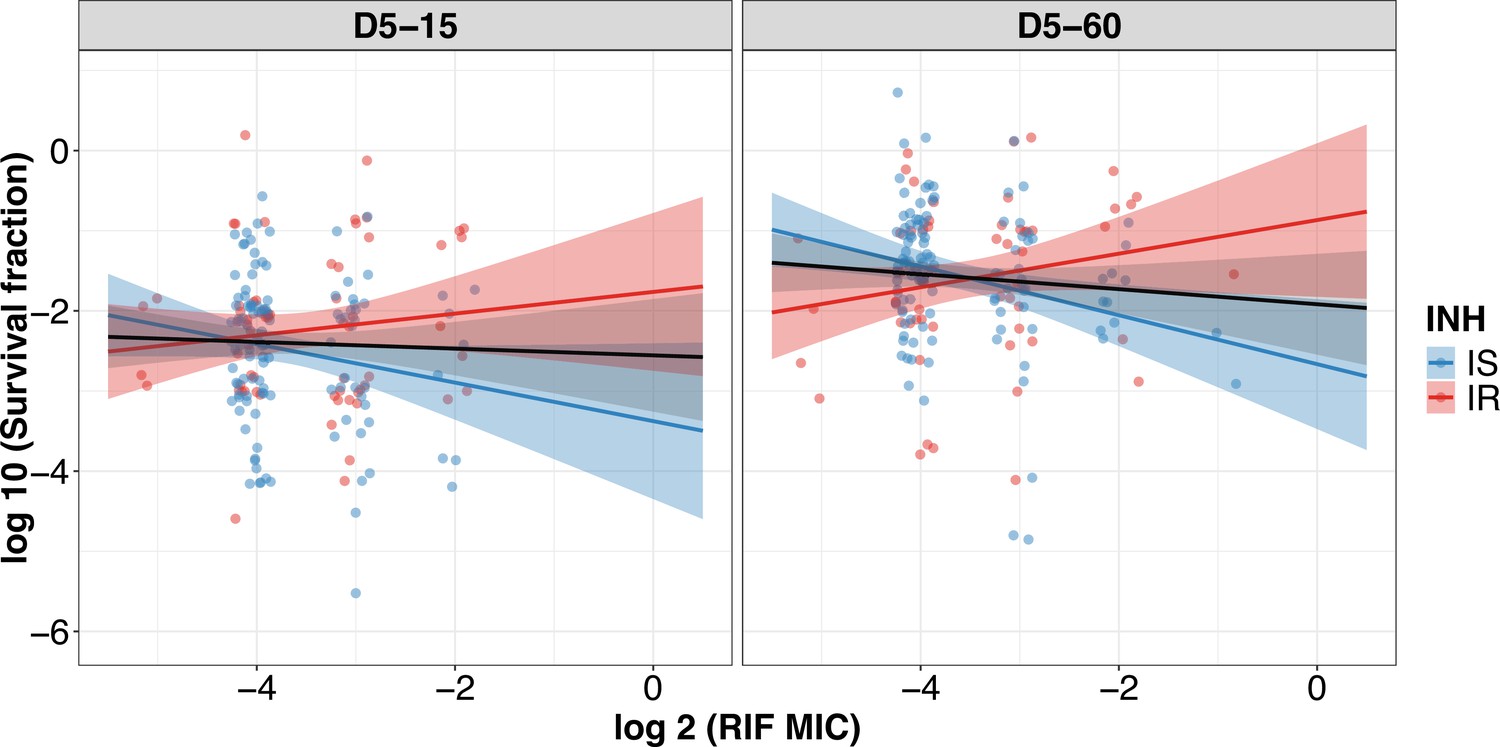
Correlating rifampicin survival fraction with rifampicin minimum inhibitory concentration (MIC) of clinical M. tuberculosis isolates.
Log10 survival fraction at 5 days of rifampicin treatment as determined at 15 days (D5-15) and 60 days of incubation (D5-60) for isoniazid susceptible (IS, blue dots) and resistant (IR, red dots) isolates, respectively, correlated with the rifampicin MIC of clinical M. tuberculosis isolates (MIC range 0.03, 0.06, 0.12, 0.25, 0.5 µg/mL converted to log 2). Coefficients of linear regression for (D5-15) IS = −0.24 [-0.50, 0.022], p=0.073; IR = 0.14 [-0.14, 0.41], p=0.33, and (D5-60) IS = −0.31 [–0.53, –0.083], p = 0.007; IR = 0.21 [–0.057, 0.48], p=0.12. Black line indicates an overall trend of MIC distribution for all isolates.
Figure 4—figure supplement 3
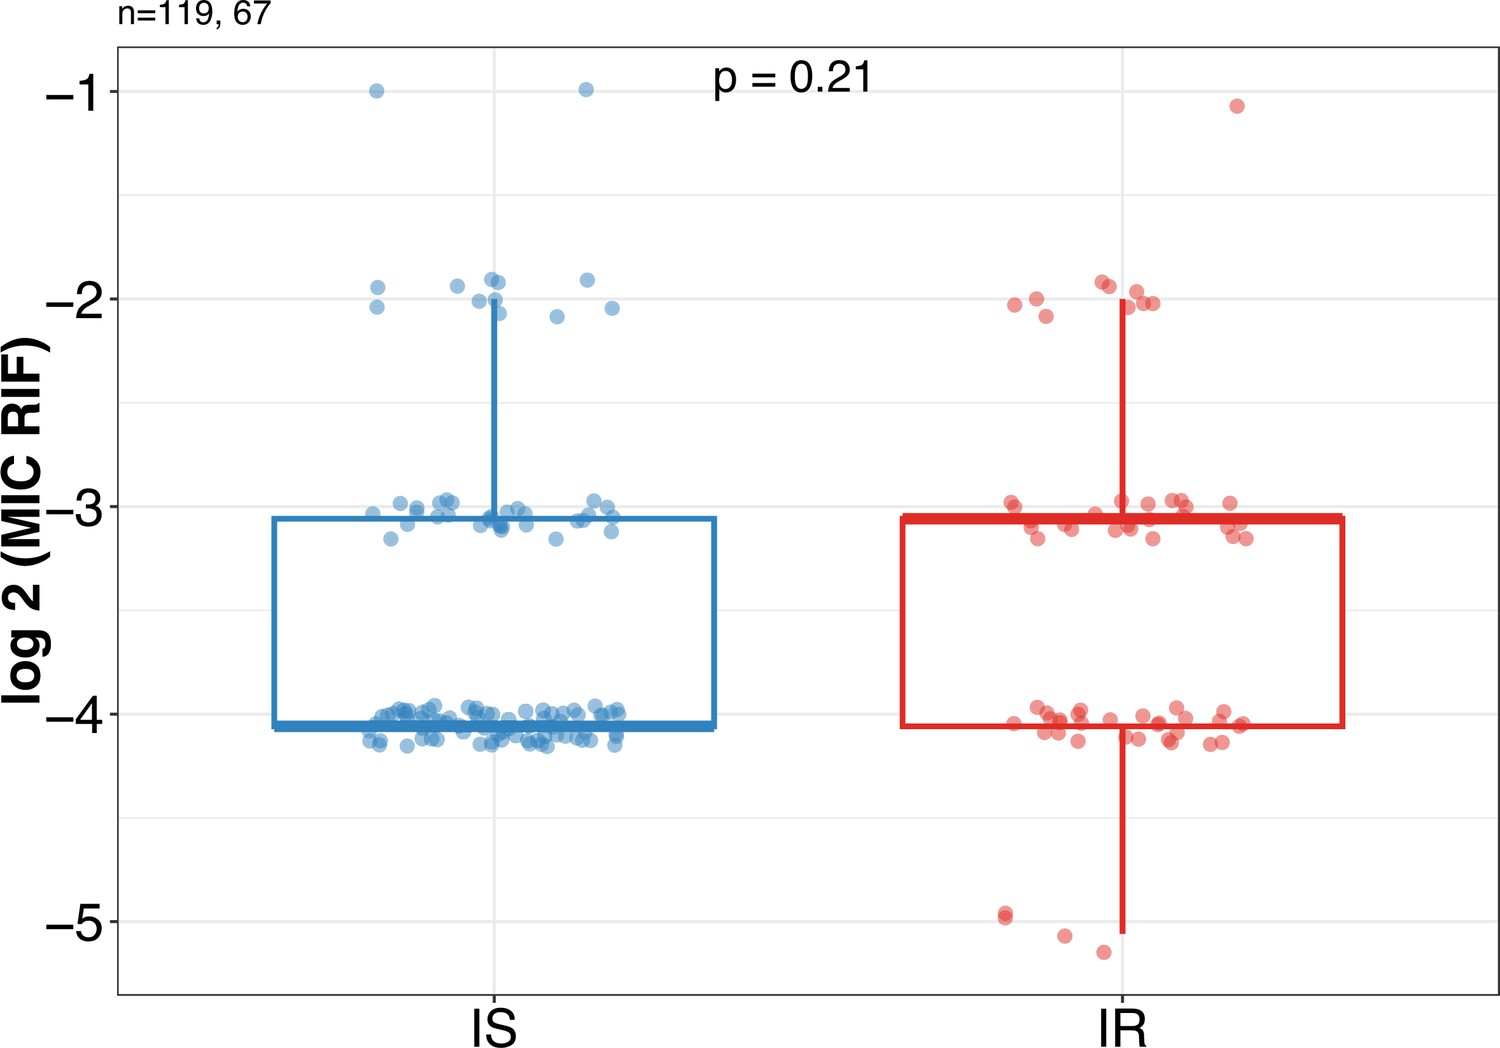
Rifampicin minimum inhibitory concentration (MIC) distribution between Isoniazid susceptible (IS) (n=119) and Isoniazid-resistant (IR) (n=67) clinical M. tuberculosis isolates.
Statistical comparisons between IS and IR were made by using the Wilcoxon rank-sum test.
Figure 4—figure supplement 4
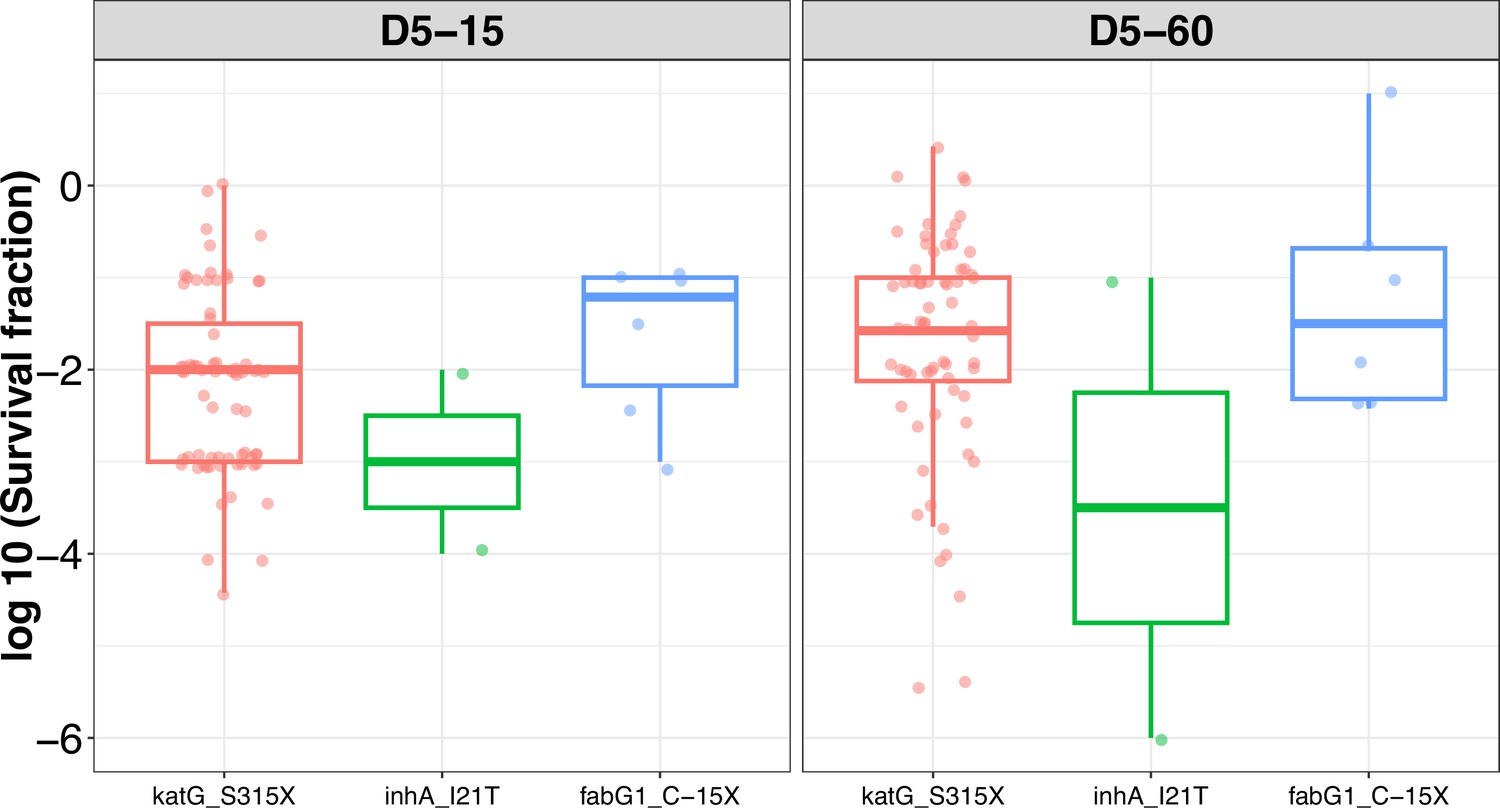
Rifampicin tolerance distribution grouped based on isoniazid-resistant mutations (katG_S315X, inhA_I21T, and fabG1_C-15X) in M. tuberculosis isolates.
Figure 5
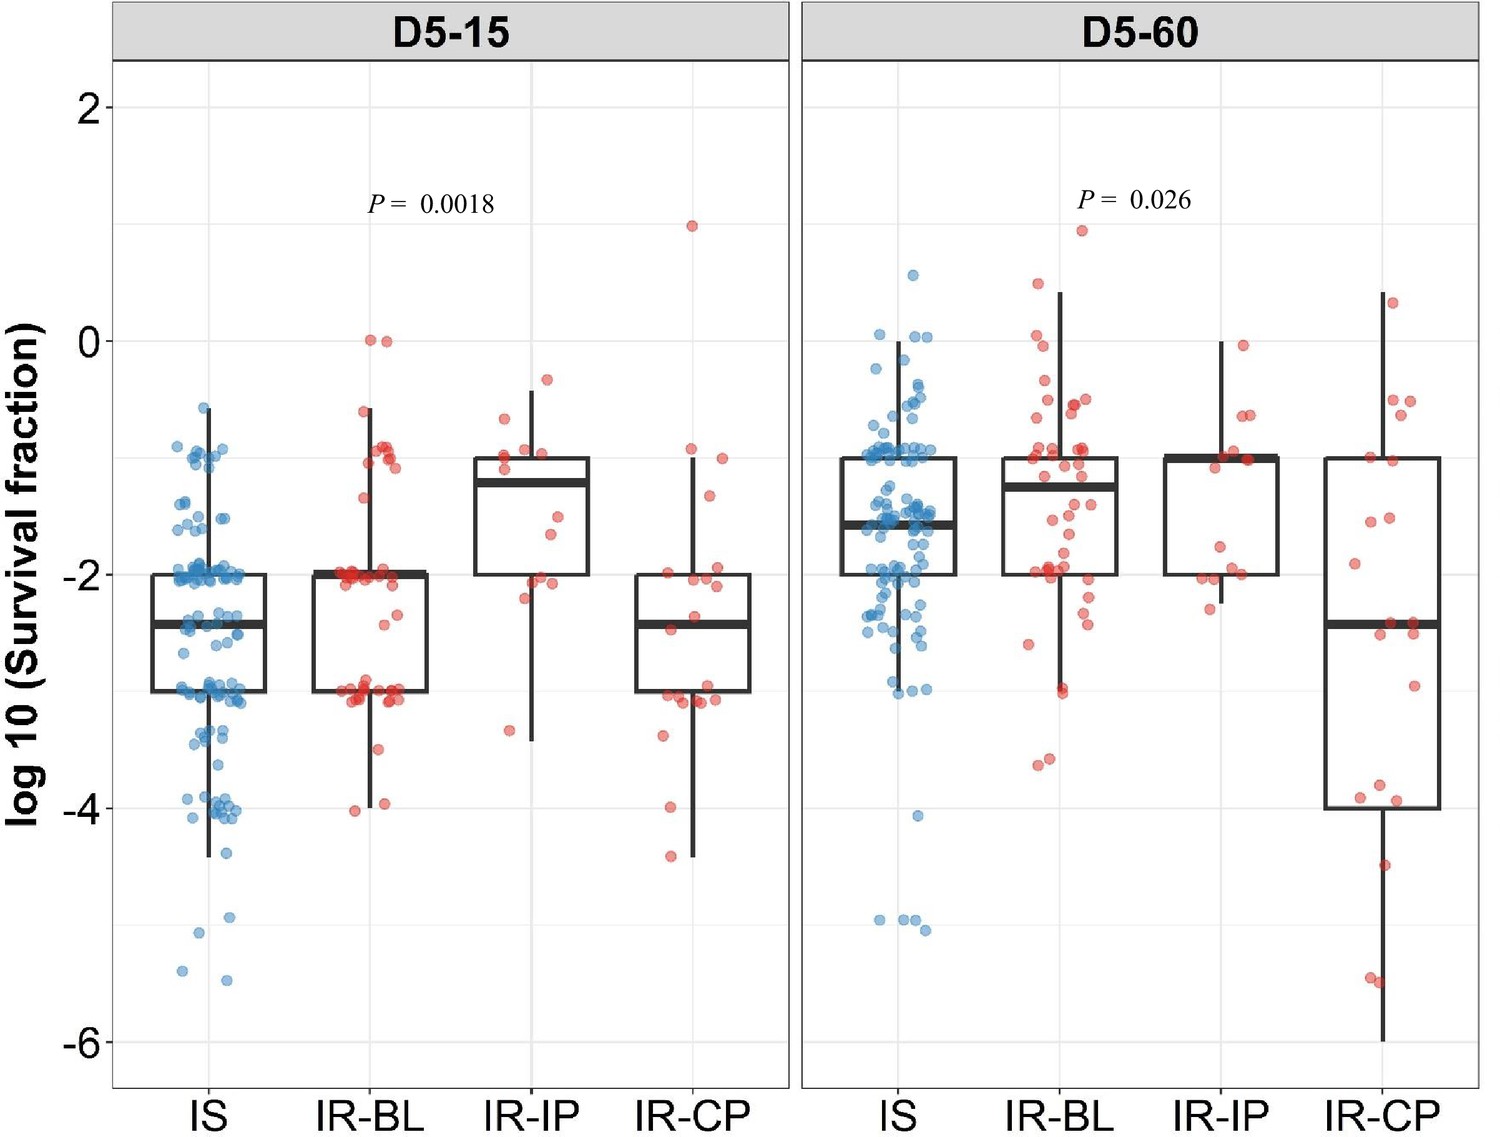
Rifampicin survival fraction distribution in isoniazid susceptible and longitudinal isoniazid-resistant clinical M. tuberculosis isolates.
Log10 rifampicin survival fraction distribution, with median and IQR (interquartile range), of individual isoniazid susceptible (Isoniazid susceptible, IS, blue dots, n=119, 117 for D5-15, and D5-60, respectively), and longitudinal isoniazid-resistant (Isoniazid-resistant, IR, red dots, n=84, 80 for D5-15, D5-60, respectively) isolates for 5 days of rifampicin treatment as determined at 15 and 60 days of incubation (D5-15, D5-60, respectively) grouped based on collection time as baseline (IR-BL, n=49), intensive phase (IR-IP, n=14), and continuous phase and relapse (IR-CP, n=21). Statistical comparisons between groups were made by using Krusal-Walis test.
Figure 6
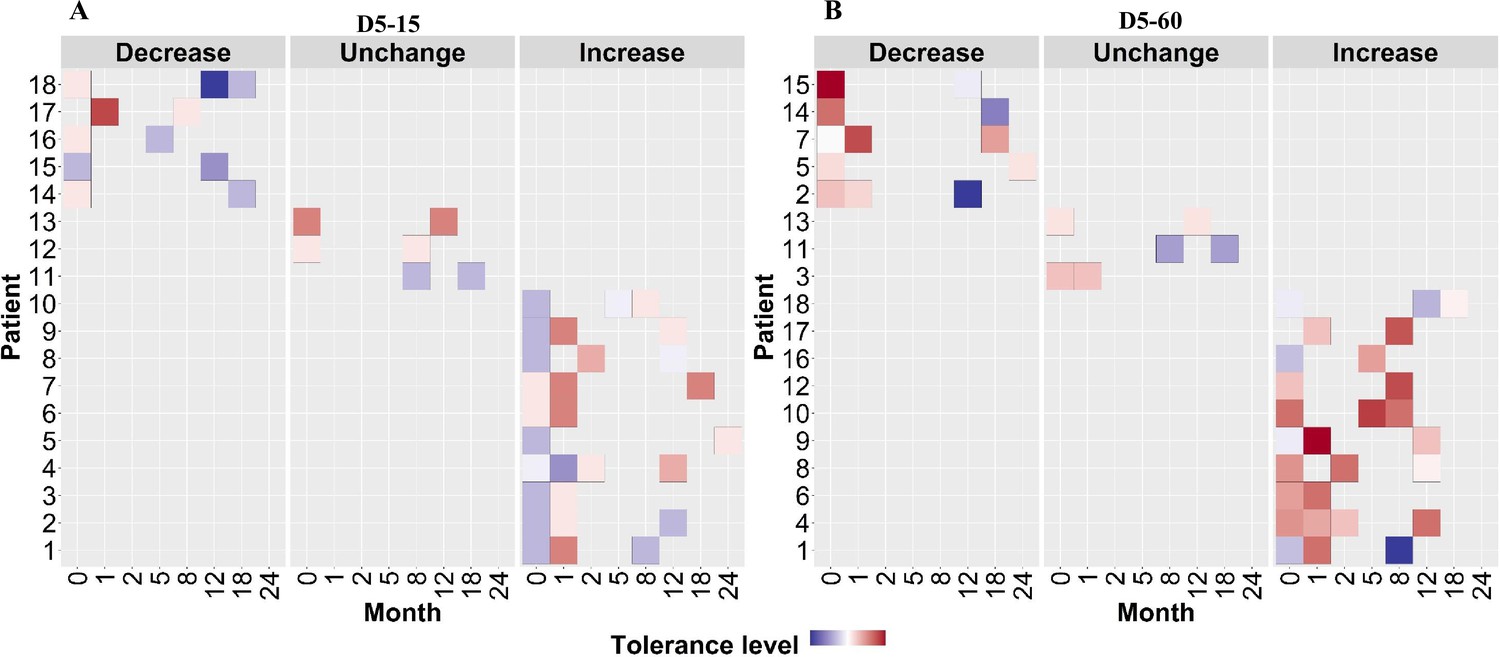
Rifampicin tolerance of longitudinal isoniazid-resistant clinical M. tuberculosis isolates from individual patients.
(A, B) Rifampicin tolerance heat map after 5 days of rifampicin treatment as determined at 15 and 60 days of incubation (D5-15, D5-60, respectively), of longitudinal isoniazid-resistant clinical M. tuberculosis isolates collected from individual patients during different months of treatment and follow-up. Longitudinal isoniazid-resistant clinical M. tuberculosis isolates from individual patients are grouped based on changes in rifampicin tolerance compared between initial and subsequent months of collection as decrease, un change, and increase. Months (0–24) represent the different months the isolates were collected from patients during 8 months treatment and 24 months of follow-up.
Figure 7
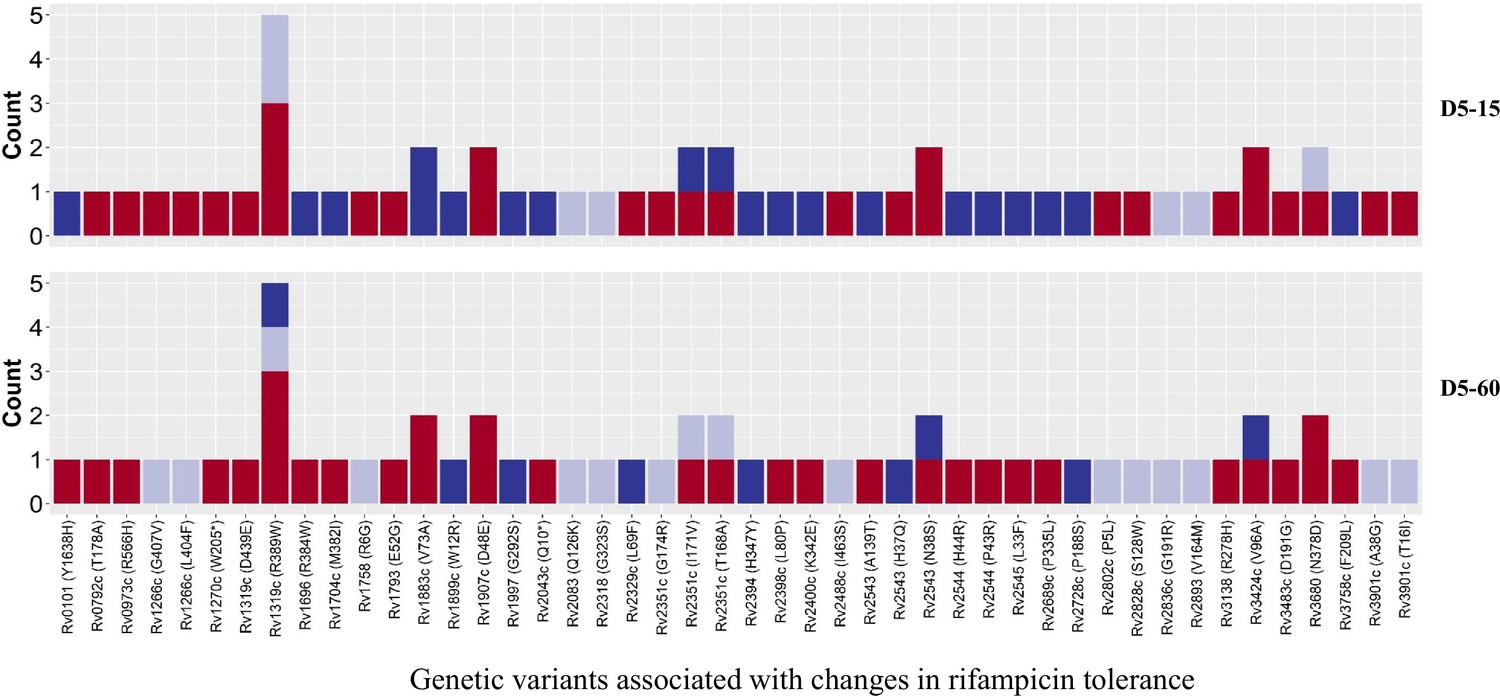
Genetic variants associated with changes in rifampicin tolerance.
Non-synonymous single nucleotide polymorphism emerging in pair-wise comparison of longitudinally collected isoniazid-resistant M. tuberculosis isolates from same patient associated with increase (red), decrease (dark blue), and no change (light violet) in rifampicin tolerance phenotype at 15 and 60 days of incubation (D5-15 and D5-60, respectively). Each count represents a single independent single nucleotide polymorphism (SNP) emergence event.
Tables
Table 1
Association of rifampicin tolerance level with isoniazid susceptibility.
| Incubation time | Rifampicin tolerance level | Isoniazid susceptible (n=119) | Isoniazidresistant(n=84) | p | OR(95% CI) | p-trend | |
|---|---|---|---|---|---|---|---|
| D5-15 | Low tolerance (n, %) | 26 (79, 26/33) | 7 (21, 7/33) | 0·0038 | |||
| Medium tolerance (n, %) | 72 (58, 72/124) | 52 (42, 52/124) | 0·029 | 2·68 (1·08–6·65) | |||
| High tolerance (n, %) | 21 (46, 21/46) | 25 (54, 25/46) | 0·003 | 4·42 (1·60–12·22) | |||
| D5-60 | Low tolerance (n, %) | 26 (55, 26/47) | 21 (45, 21/47) | 0·67 | |||
| Medium tolerance (n, %) | 74 (64, 74/115) | 41 (36, 41/115) | 0·28 | 0·69 (0·34–1·37) | |||
| High tolerance (n, %) | 17 (49, 17/35) | 18 (51, 18/35) | 0·55 | 1·31 (0·55–3·15) | |||
-
n = number of isolates. (% as percentage), N/total number (IS + IR). p = p-value determined using Chi-square test. p trend = p-value determined using Cochran-Armitage test. p trend = p-value determined using the Cochran-Armitage test. OR = odds ratio. 95%CI = 95% confidence interval.
Additional files
-
MDAR checklist
- https://cdn.elifesciences.org/articles/93243/elife-93243-mdarchecklist1-v1.pdf
-
Supplementary file 1
Supplementary material for rifampicin MIC and genetic variant analysis.
- https://cdn.elifesciences.org/articles/93243/elife-93243-supp1-v1.docx
-
Supplementary file 2
Raw data used for figures.
- https://cdn.elifesciences.org/articles/93243/elife-93243-supp2-v1.xlsx
-
Supplementary file 3
Details regarding whole genome sequence data accession number.
- https://cdn.elifesciences.org/articles/93243/elife-93243-supp3-v1.xlsx
Download links
A two-part list of links to download the article, or parts of the article, in various formats.
Downloads (link to download the article as PDF)
Open citations (links to open the citations from this article in various online reference manager services)
Cite this article (links to download the citations from this article in formats compatible with various reference manager tools)
Rifampicin tolerance and growth fitness among isoniazid-resistant clinical Mycobacterium tuberculosis isolates from a longitudinal study
eLife 13:RP93243.
https://doi.org/10.7554/eLife.93243.3


