Quantitative mapping of proteasome interactomes and substrates using ProteasomeID
- Leibniz Institute on Aging - Fritz Lipmann Institute, Germany
Figures
Figure 1 with 3 supplements
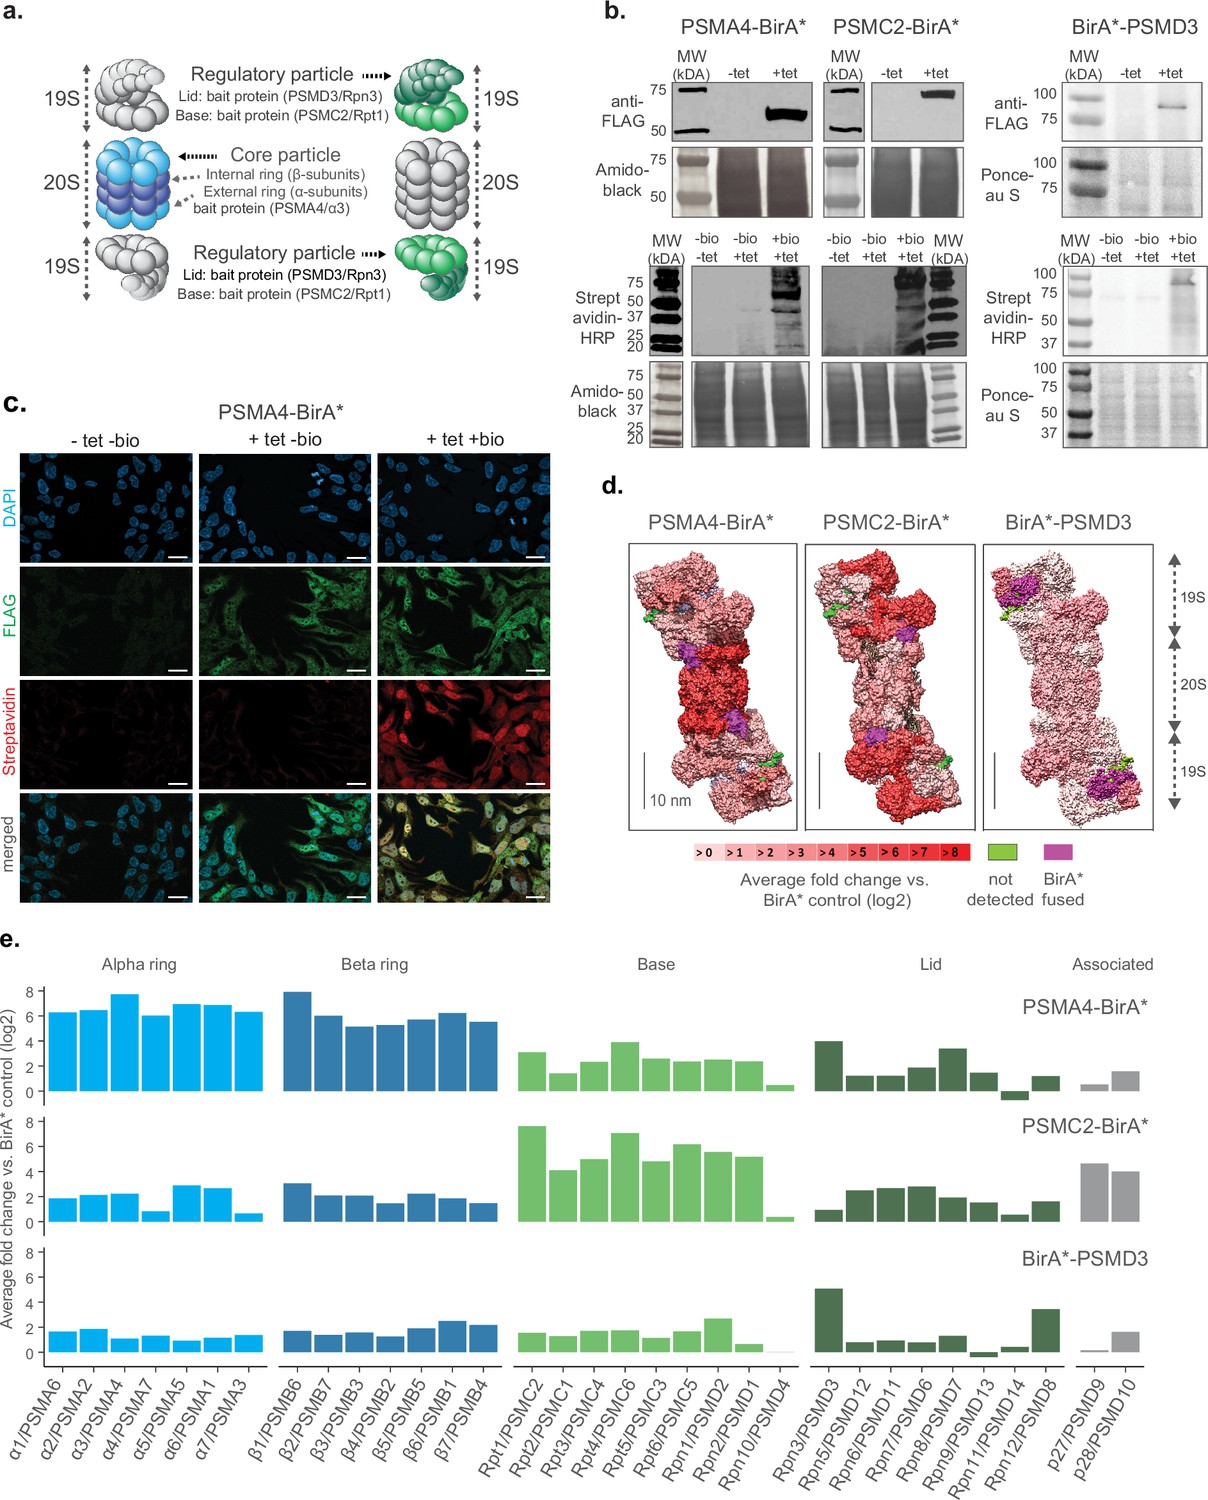
Establishment of a cell culture model system for proximity labeling of proteasomes.
(a) Schematic representation of proteasome with the substructures containing subunits fused to biotin ligase highlighted in color (shown in 2 shades of blue and green for 20 S and 19 S proteasome, respectively). (b) Upper panel, immunoblot of BirA* fusion proteins performed on lysates from HEK293T cells stably transfected with PSMA4-BirA*-FLAG, PSMC2-BirA*-FLAG or BirA*-FLAG-PSMD3 following 24 hr incubation with (+tet) or without (−tet) tetracycline. Lower panel, streptavidin-HRP blot following induction of BirA* fusion proteins with tetracycline and supplementation of biotin for 24 hr. Amido Black or Ponceau stainings were used as loading control. HRP: horseradish peroxidase. (c) Immunofluorescence analysis of PSMA4-BirA*-FLAG cell line 4 days after seeding without addition of any substance (-tet -bio), with addition of only tetracycline for 4 days (+tet bio) or with addition of both tetracycline for 4 days and biotin for 1 day (+tet + bio). Scale bar = 20 µm. (d) Level of enrichment of proteasome components measured by ProteasomeID in the context of the proteasome structure. Enriched proteins are depicted in different shades of red according to the log2 fold enrichment vs. BirA* control. Scale bar = 10 nm. The proteasome structure depicted was obtained from the PDB:5T0C model of the human 26 S proteasome Chen et al., 2016 and rendered using Chimera (Pettersen et al., 2004). (e) Enrichment level comparison for proteasome components achieved in 3 different cell lines of ProteasomeID. Enriched proteins are depicted in the same color code as in panel a. and according to the log2 fold enrichment vs. BirA* control. n=4 biological replicates.
-
Figure 1—source data 1
Raw unedited gels for Figure 1.
- https://cdn.elifesciences.org/articles/93256/elife-93256-fig1-data1-v1.zip
-
Figure 1—source data 2
Uncropped and labeled gels for Figure 1.
- https://cdn.elifesciences.org/articles/93256/elife-93256-fig1-data2-v1.zip
Figure 1—figure supplement 1
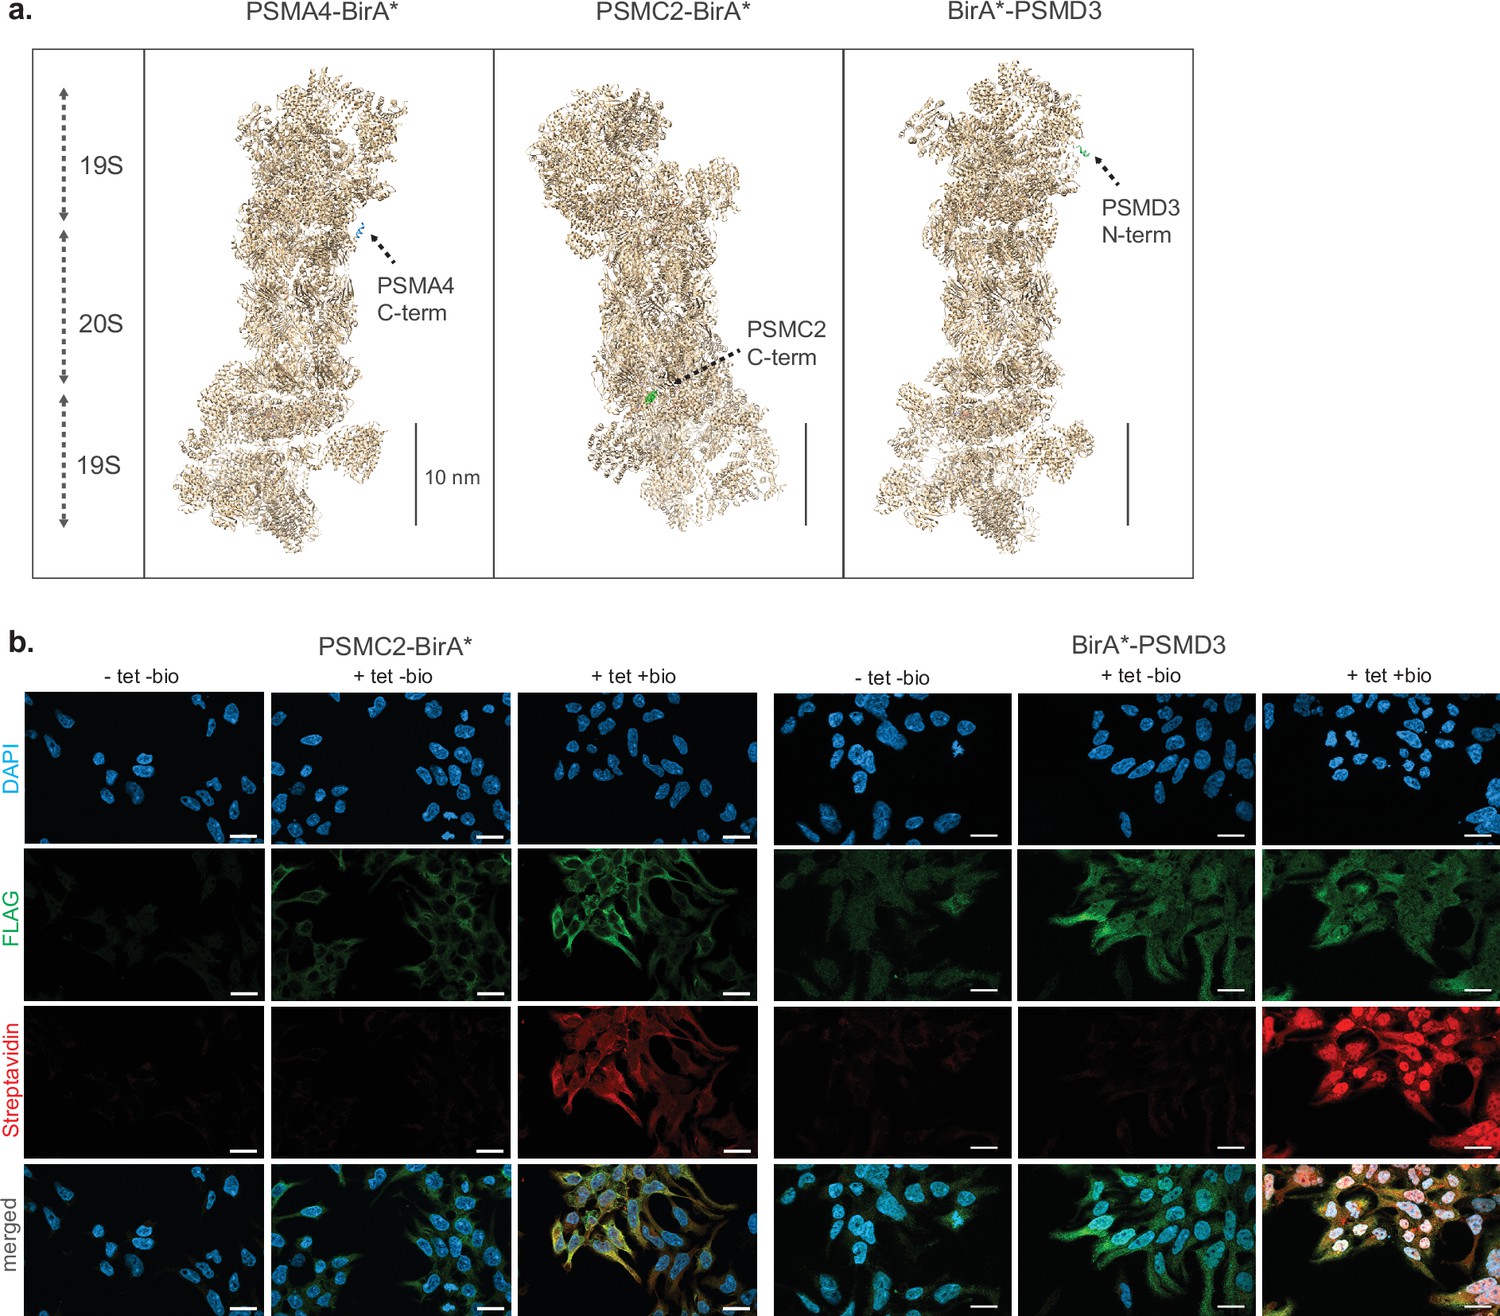
Further characterization of PSMC2-BirA*,BirA*-PSMD3 expressing cell lines.
(a) Schematic representation of proteasome structure with the biotin ligase-fused to N- or C-termini of the respective bait proteins highlighted in color. Scale bar = 10 nm. The proteasome structure depicted was obtained from the PDB:5T0C model of the human 26 S proteasome Chen et al., 2016 and rendered using Chimera (Pettersen et al., 2004). (b) Immunofluorescence analysis of PSMC2-BirA*-FLAG and BirA*-FLAG-PSMD3 HEK293T cell lines 4 days after seeding without addition of any substance (-tet -bio), with addition of only tetracycline for 4 days (+tet bio) or with addition of both tetracycline for 4 days and biotin for 1 day (+tet + bio). Scale bar = 20 µm.
Figure 1—figure supplement 2
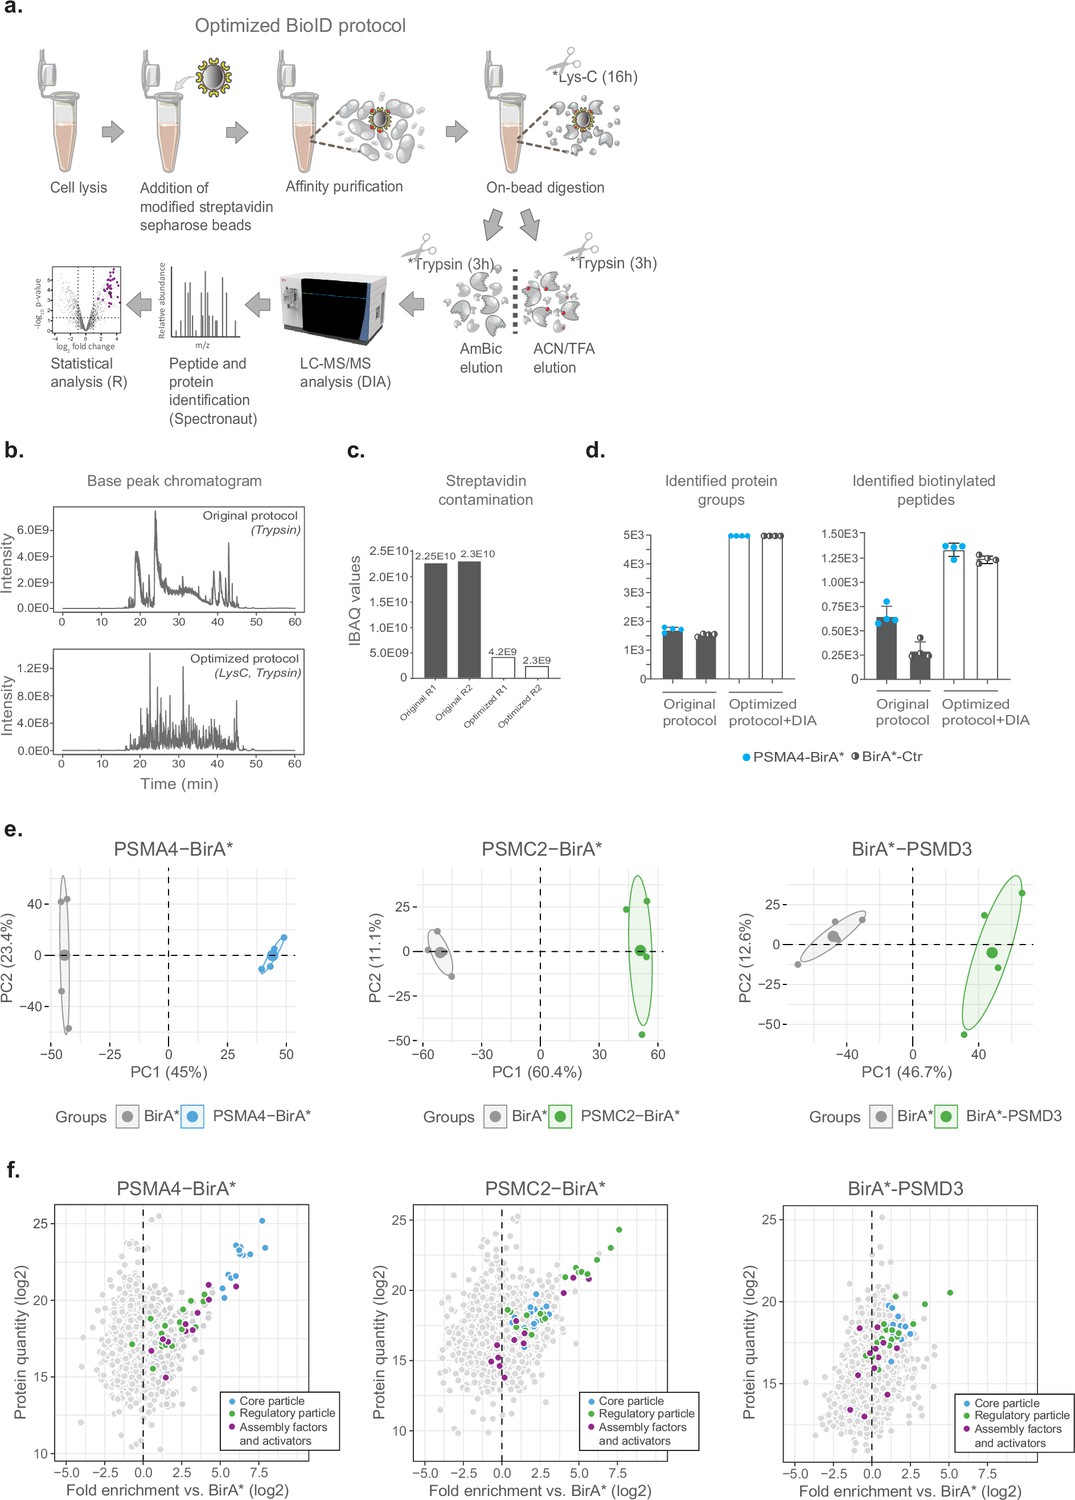
Optimization of BioID workflow and ProteasomeID cell lines evaluation.
(a) Scheme of optimized BioID protocol. The original protocol by Mackmull et al., 2017 was optimized by (i) acetylation of lysines on streptavidin prior to pull-down; (ii) replacement of trypsin by LysC for on-bead digestion. Following on-bead digestion, two sequential elutions with ammonium bicarbonate (AmBic) and acetonitrile (ACN) / trifluoroacetic acid (TFA) are performed and eluates are further digested off-beads with trypsin. (iii) Peptides from AmBic and ACN/TFA eluates are then analyzed by Data Independent Acquisition (DIA) mass spectrometry. (b) Representative base peak chromatograms of AmBic elutions obtained from the original (upper panel,) and modified (lower panel) BioID protocol. The replacement of trypsin with LysC together with the acetylation of streptavidin drastically reduces the contamination by streptavidin-derived peptides. (c) Quantification of streptavidin in AmBic elutions obtained from the original (T: trypsin) and modified (LT: LysC followed by trypsin) BioID protocol. Streptavidin quantification was based on iBAQ values (Cox and Mann, 2008) obtained label free mass spectrometry analysis. Two representative replicates (R1, R2) are shown for each condition. (d) Bar plots of the number of identified protein groups and biotinylated peptides obtained using the original vs. optimized BioID protocols. Data were obtained from cell lines expressing PSMA4-BirA* (light blue dots) or BirA* (black/white dots). The number of identified protein groups was obtained from AmBic samples, while the number of biotinylated peptides was derived from ACN/TFA samples. n=4 biological replicates, error bars indicate standard deviation of the mean. (e) Principal component analysis (PCA) of ProteasomeID cell lines samples based on the abundance of all proteins identified by label-free mass spectrometry. The smaller dots represent individual samples and the larger dots the centroids of each age-matched group. Ellipses represent 95% confidence intervals. The percentage of variance explained by the first two PC axes is reported in the axis titles. (f) MA plots of proteins enriched by streptavidin pull-down and analyzed by DIA mass spectrometry from different cell lines. Highlighted in color are proteasome members or assembly factors and activators. Data were obtained from n=4 biological replicates.
Figure 1—figure supplement 3
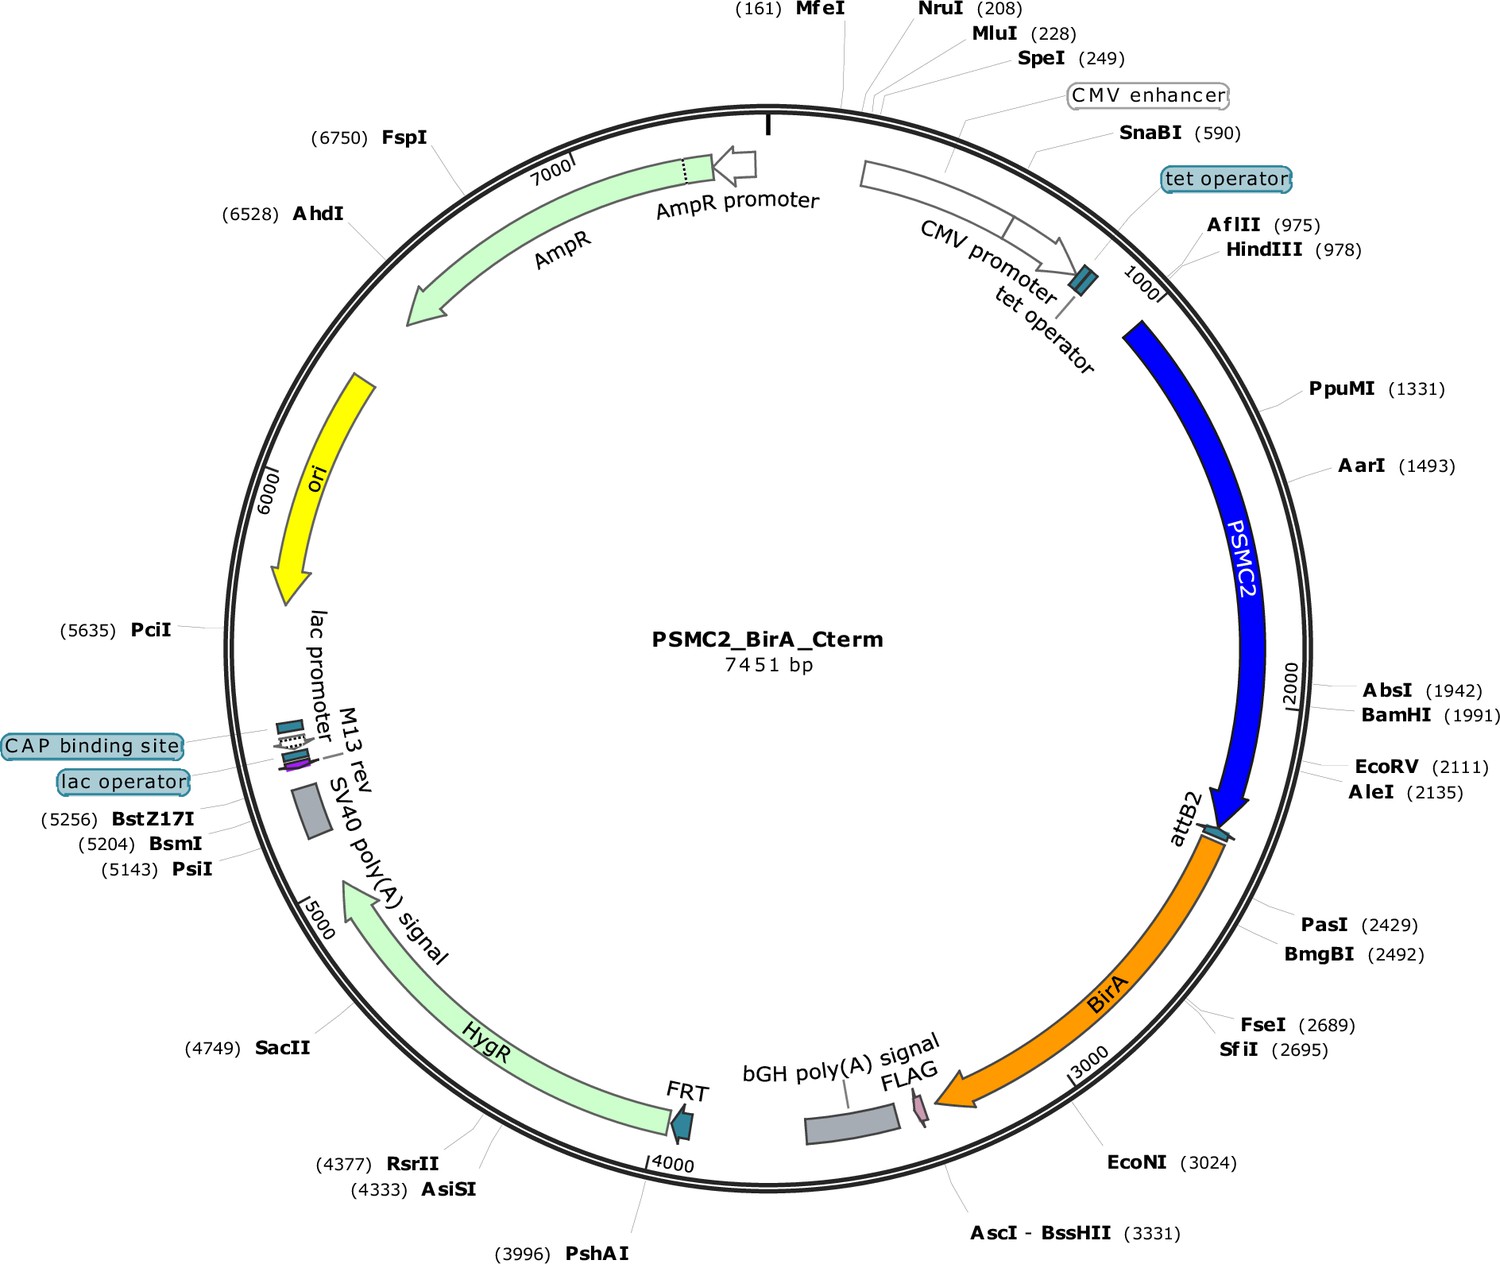
Plasmid map for construct PSMC2-BirA*.
Figure 2 with 1 supplement
Validation of ProteasomeID.
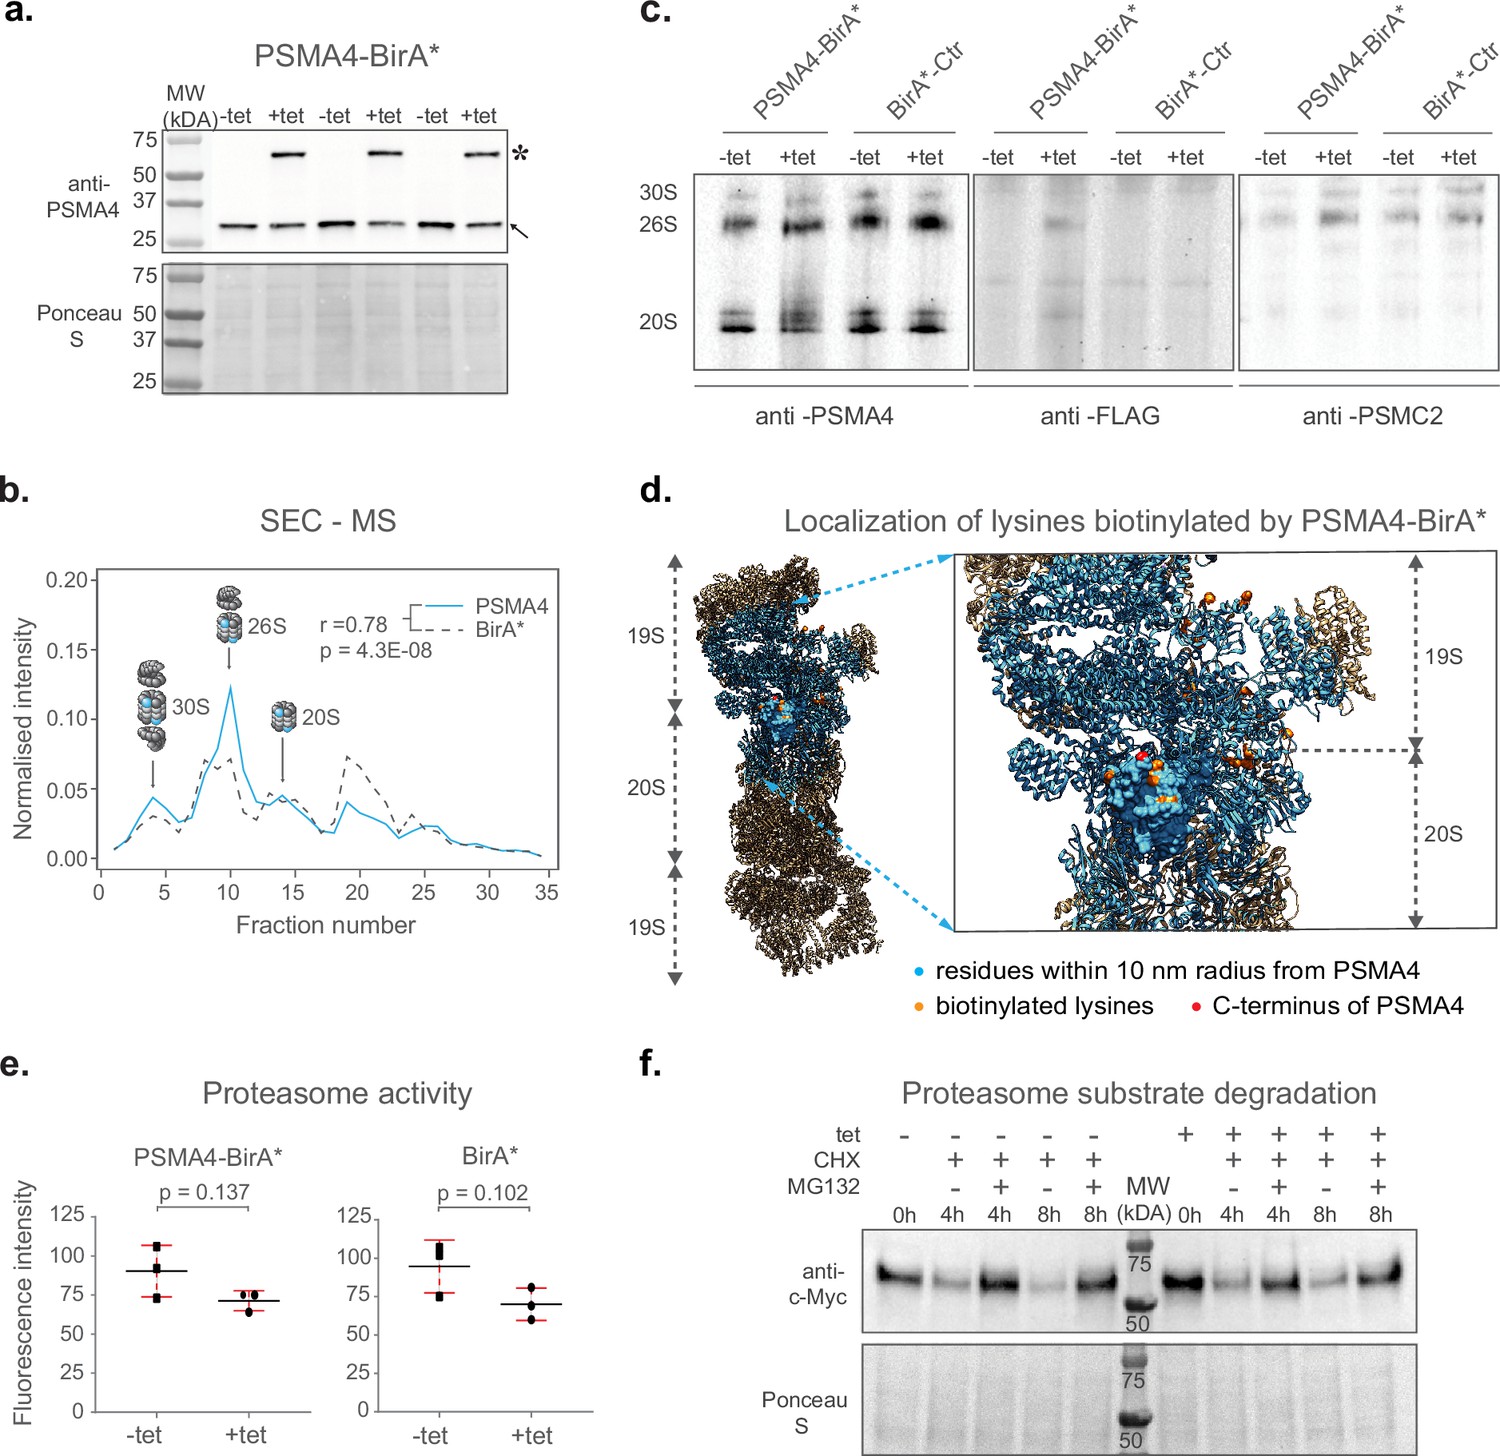
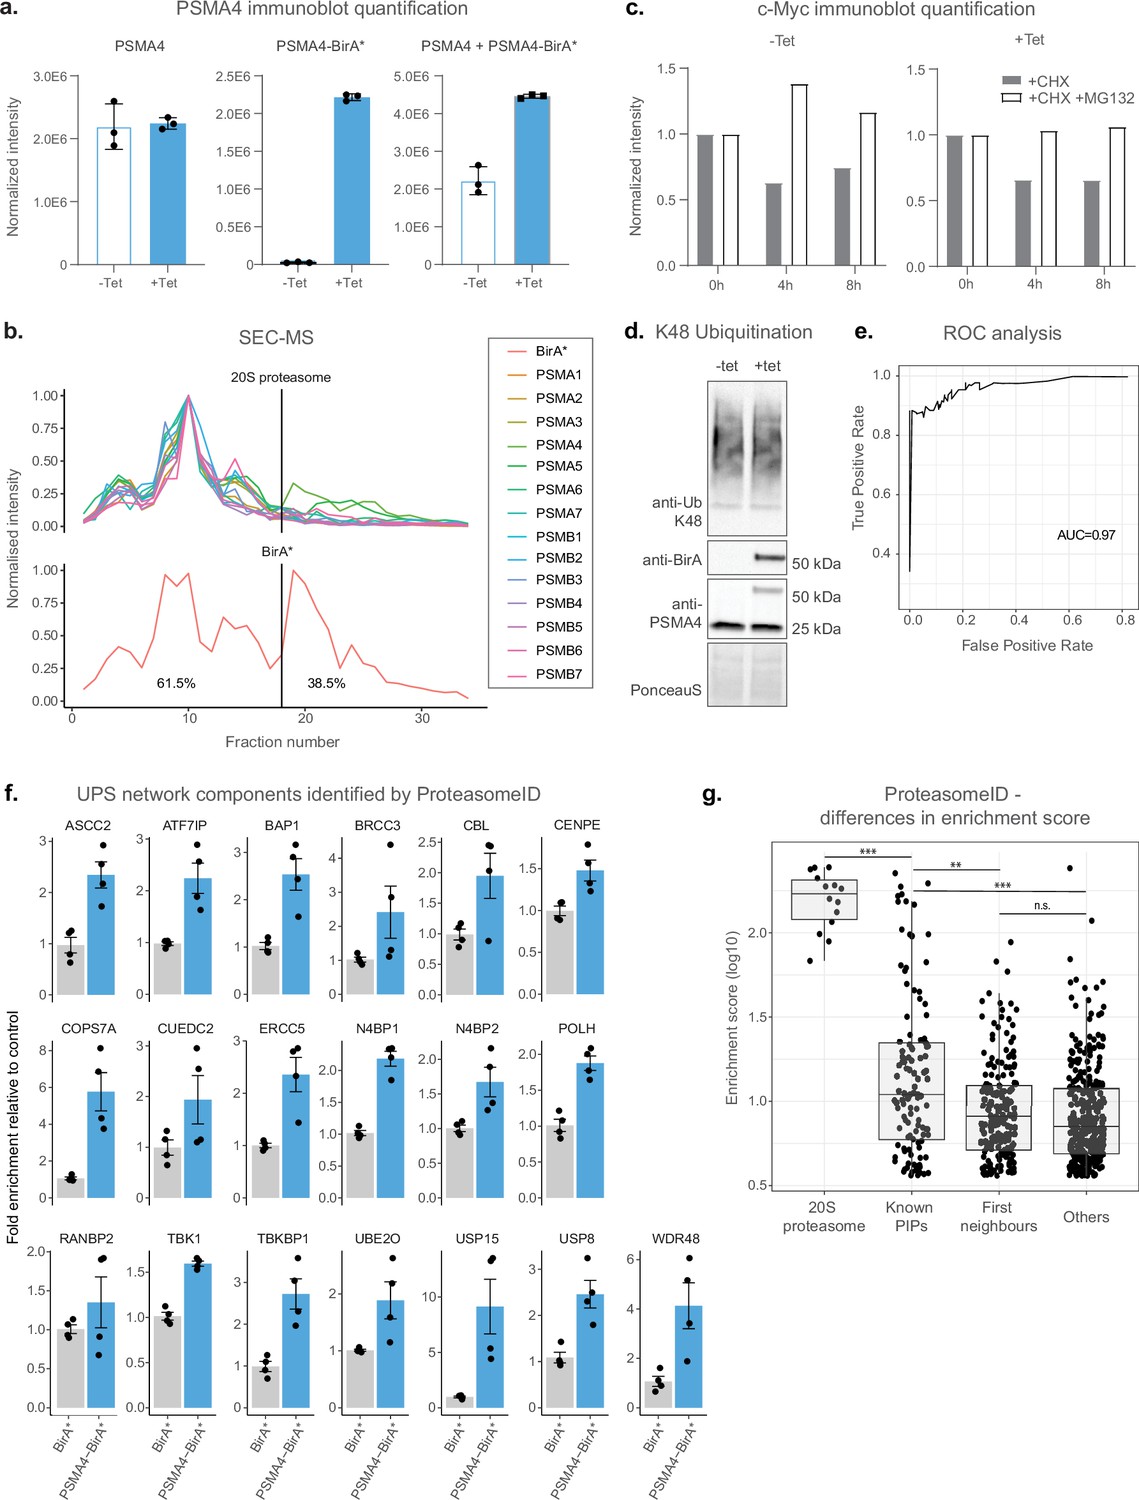
(a) Comparison of expression levels of PSMA4-BirA* (lanes marked by star) and its endogenous counterpart (lanes marked by arrowhead), following 24 hrincubation with (+tet) or without (−tet) tetracycline. Ponceau S staining was used as loading control. (b) Size exclusion chromatography (SEC) analysis of lysates from HEK293T cells stably expressing PSMA4-BirA* following 24 hr incubation with tetracycline. SEC fractions were analyzed by DIA mass spectrometry and elution profiles were built for each protein using protein quantity values normalized to the sum of quantities across all fractions. Depicted are elution profiles of PSMA4 (proteasome subunit, blue) and BirA* (biotinylating enzyme, dashed line). The peaks corresponding to different proteasome assemblies were assigned based on the elution profiles of other proteasome components. (c) Immunoblot for proteasome subunits PSMA4 (left panel), PSMC2 (right panel), and FLAG tag (middle panel) of cell lysates separated by native PAGE from PSMA4-BirA* and BirA*-Ctr cell lines with and without tetracycline addition. Tet = tetracycline, 30S=indicates position of proteasome structures containing one core and 2 regulatory particles, 26S=indicates position of proteasome structures containing one core and 1 regulatory particle, 20S=indicates position of proteasome structures consisting of only single core particle. (d) Biotinylated lysines identified by ProteasomeID. All the residues within a 10 nm radius of the PSMA4 C-terminus are highlighted in cyan. Red color indicates the C-terminus of PSMA4 where BirA* is fused (not present in the structure), and the identified biotinylated lysines are depicted in orange. Only the structure of the modified subunit is depicted with a surface model and all the other subunits are depicted as helix-loop structures. Biotinylated residues were obtained from the ACN fraction of PSMA4-BirA*. The proteasome structure depicted was obtained from the PDB:5T0C model of the human 26 S proteasome (Chen et al., 2016) and rendered using Chimera (Pettersen et al., 2004). (e) Proteasome activity assay performed on lysates from cell lines expressing different BirA* fusion proteins, following 24 hr incubation with (+tet) or without (−tet) tetracycline. Equal amounts of protein extracts were incubated with proteasome substrate LLVY-7-Amino-4-methylcoumarin (AMC) and substrate cleavage assessed by fluorimetry. n=3 biological replicates, error bars indicate standard deviation of the mean, paired t-test. (f) Cycloheximide-chase experiment on c-Myc stability. PSMA4-BirA*cells were incubated with 50 μg/ml cycloheximide (CHX) for the indicated times in the presence or absence of MG132 (20 μM) and tetracycline (1 µg/µl). Cells lysates were then prepared for western blot analysis of steady-state levels of c-Myc.Tet=tetracycline, CHX = cycloheximide.
-
Figure 2—source data 1
Raw unedited gels for Figure 2.
- https://cdn.elifesciences.org/articles/93256/elife-93256-fig2-data1-v1.zip
-
Figure 2—source data 2
Uncropped and labeled gels for Figure 2.
- https://cdn.elifesciences.org/articles/93256/elife-93256-fig2-data2-v1.zip
Figure 2—figure supplement 1
ProteasomeID cell line validation.
(a) Densitometric quantification of immunoblot depicted in Figure 2a. Ponceau staining was used as loading control for normalization. n=3 biological replicates, error bars indicate standard deviation of the mean. (b) Size exclusion chromatography (SEC) analysis of lysates from HEK293T cells stably expressing PSMA4-BirA* following 24 hr incubation with tetracycline. SEC fractions were analyzed by DIA mass spectrometry and elution profiles were built for each protein using protein quantity values normalized to the sum of quantities across all fractions. Depicted in the upper panel are the elution profiles of 20 S proteasome components. The lower panel depicts the elution profile of BirA*. The perpendicular dashed line depicts a cut off for fully assembled proteasome complexes. (c) Densitometric quantification of immunoblot depicted in Figure 2f. Ponceau staining was used as loading control followed by band intensity normalization to zero hour, untreated samples (which were set to 1). Tet = tetracycline, CHX = cycloheximide. (d) Immunoblot comparing the levels of K48 ubiquitylated proteins from PSMA4-BirA* cells treated with (+tet) or without (-tet) tetracycline. Afterwards, expression of PSMA4-BirA* was verified by blotting against BirA* and PSMA4. Ponceau staining was used as loading control. (e) ROC curve of the classifier used to define ProteasomeID enriched proteins. (f) Bar plots comparing the levels of enrichment obtained in ProteasomeID experiment for members of the UPS network not identified in previous interaction studies. Enrichment levels were normalized to the levels detected in BirA* control cell line which was set to 1. Protein quantities were derived from DIA mass spectrometry data. Data are shown as mean ± standard error from n=4 biological replicates. (g) Differences in enrichment score (compared to BirA* control) between proteins of the 20 S proteasome, known PIPs, first neighbors of known PIPs and other enriched proteins. The enrichment scores were obtained from DIA mass spectrometry data from n=4 biological replicates. p-values were derived from Wilcoxon rank sum test: *** p<0.001, ** p<0.01, n.s. p>0.05.
-
Figure 2—figure supplement 1—source data 1
Raw unedited gels for Figure 2—figure supplement 1.
- https://cdn.elifesciences.org/articles/93256/elife-93256-fig2-figsupp1-data1-v1.zip
-
Figure 2—figure supplement 1—source data 2
Uncropped and labeled gels for Figure 2—figure supplement 1.
- https://cdn.elifesciences.org/articles/93256/elife-93256-fig2-figsupp1-data2-v1.zip
Figure 3
ProteasomeID identifies known proteasome interactors.
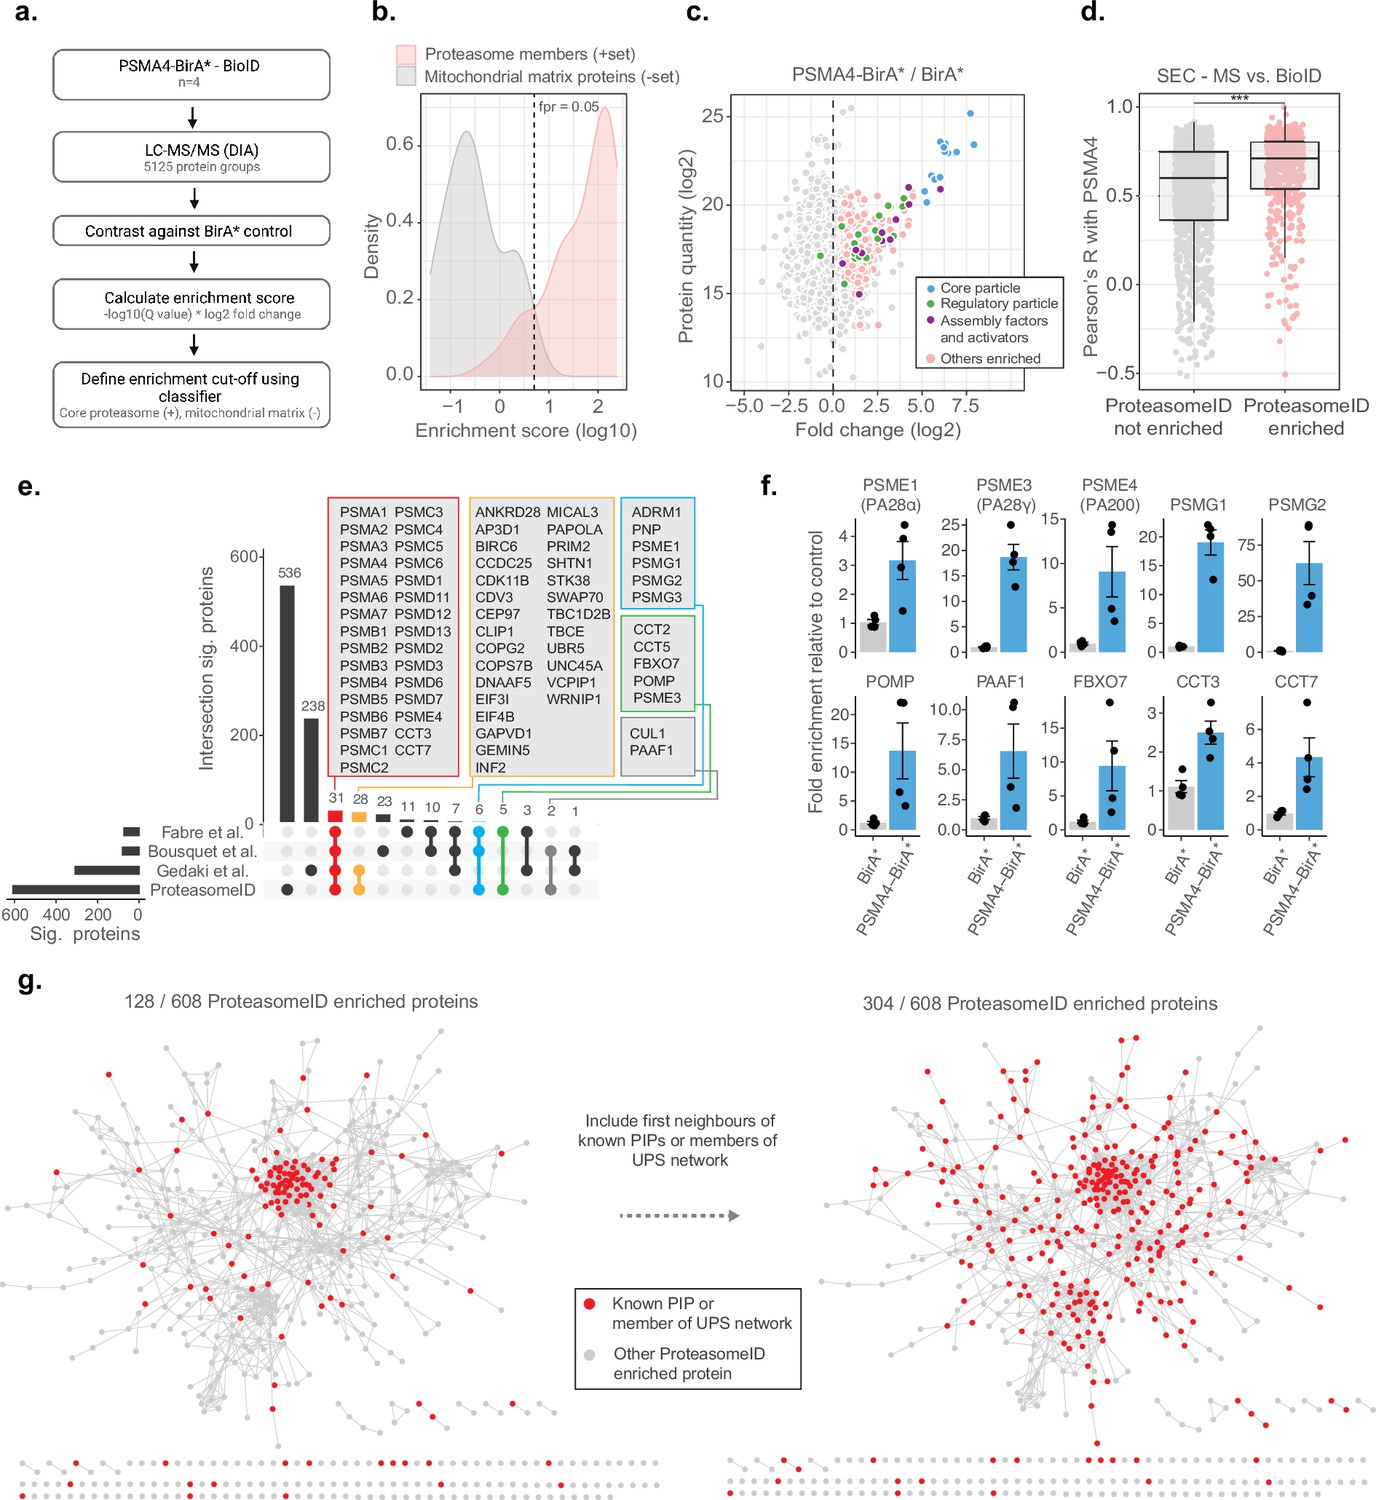
(a) Schematic depiction of the classifier algorithm used to unbiasedly define proteins enriched by ProteasomeID. The classifier is based on an ‘Enrichment score’ obtained by combining the average log2 ratio and the negative logarithm of the q value from differential protein abundance analysis performed vs. BirA* control line. (b) Distribution of enrichment scores calculated by the classifier algorithm for proteasome subunits (set of true positives) and mitochondrial matrix proteins (set of true negatives). The dashed vertical line indicates the enrichment score cut-off to define ProteasomeID enriched proteins at FPR <0.05. (c) MA plot of proteins enriched by streptavidin pull-down and analyzed by DIA mass spectrometry. Highlighted in color are proteasome members, assembly factors and activators, and other proteins significantly enriched in ProteasomeID (FPR <0.05). n=4 biological replicates.(d) Comparison of co-elution profiles obtained by SEC-MS and proteins enriched in ProteasomeID. Pearson correlation values were calculated between PSMA4 and all the other proteins quantified in SEC-MS (n=4680). Correlation values were compared between proteins significantly enriched in PSMA4-BirA* vs. BirA* and all the other proteins quantified in the ProteasomeID experiment. *** p<0.001 Wilcoxon Rank Sum test with continuity correction. (e) Upset plot showing overlap between ProteasomeID enriched proteins and previous studies that investigated proteasome interacting proteins (PIPs). Different subsets of overlapping proteins are highlighted in color framed boxes. (f) Bar plots comparing the levels of enrichment obtained in ProteasomeID experiment for proteasome activators, assembly factors and known PIPs. Enrichment levels were normalized to the levels detected in BirA* control cell line which was set to 1. Protein quantities were derived from DIA mass spectrometry data. Data are shown as mean ± standard error from n=4 biological replicates.(g) Network analysis of 608 interactors of PSMA4-BirA* obtained by ProteasomeID. Identified proteins were filtered for significance by a cutoff of log2 fold change >1 and Q value <0.05 in relation to BirA* control. Nodes representing identified proteins that are known PIPs or members of ubiquitin proteasome system (UPS) (left network) or identified protein and their first interacting neighbor are known PIPs or members of UPS (right network) are highlighted in red color. Edges represent high confidence (>0.7) protein-protein interactions derived from the STRING database (Snel et al., 2000).
Figure 4 with 1 supplement
ProteasomeID identifies known and novel endogenous proteasome substrates.
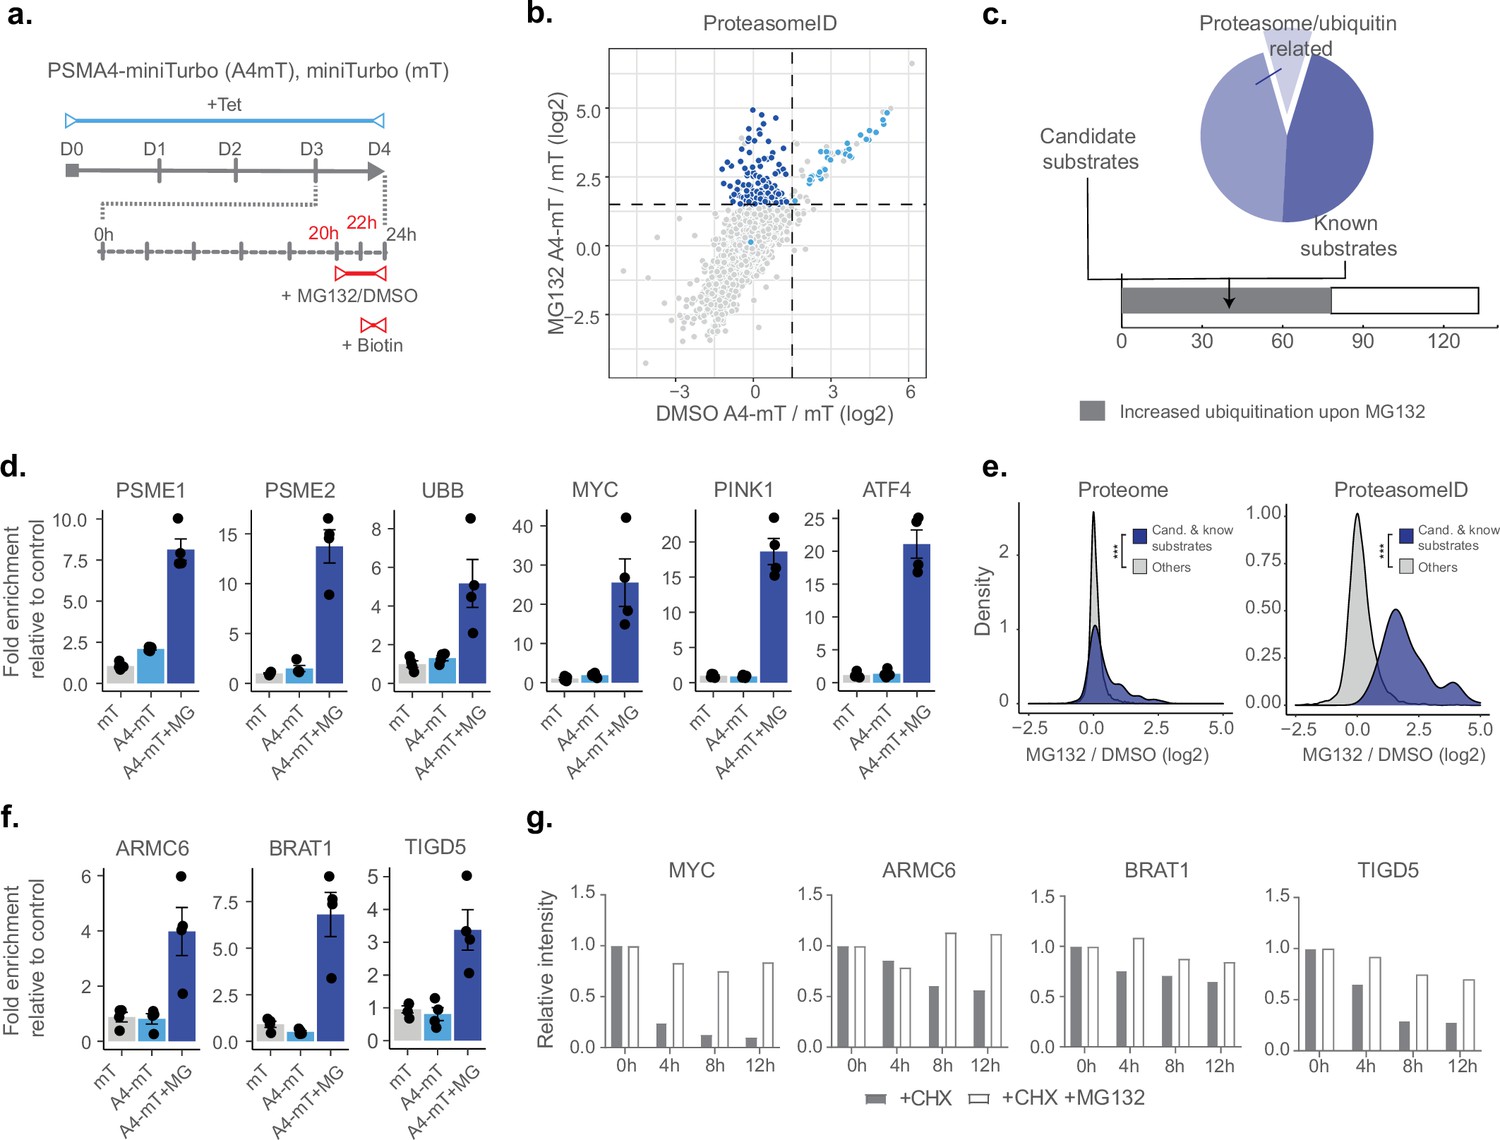
(a) Scheme of ProteasomeID workflow in HEK293T cells including proteasome inhibition by MG132. PSMA4-miniTurbo expression and incorporation into proteasomes is achieved by 4-day induction with tetracycline. Proteasome inhibition is achieved by addition of 20 µM MG132 4 hr before cell harvesting. Biotin substrate for miniTurbo is supplied 2 hr before cell harvesting. D: day; hr: hour; Tet: tetracycline; Bio: biotin. (b) Enriched proteins from ProteasomeID cells treated with proteasome inhibitor MG132 compared to vehicle control. The subset of proteins enriched exclusively upon MG132 treatment are highlighted in dark blue. Data were obtained from n=4 biological replicates. (c) Profile of proteins exclusively enriched upon MG132 treatment of ProteasomeID cells (pie chart). Identified proteins are represented by proteasome/ubiquitin related proteins, known proteasome substrates and potential previously unidentified substrates. The number of proteins identified by this approach for which previous studies showed increased ubiquitylation upon proteasome inhibition is shown in the lower bar plot. (d) Bar plots comparing the levels of proteasome activators and ubiquitin, and known proteasome substrates following streptavidin enrichment from different cell lines and following proteasome inhibition by MG132. Protein quantities were derived from DIA mass spectrometry data. mT: miniTurbo control cell line; A4-mT: PSMA4-miniTurbo cell line; I: proteasome inhibition by MG132. Data are shown as mean ± standard error from n=4 biological replicates. (e) Distribution of log2 fold changes following MG132 treatment for candidate and known proteasome substrates identified by ProteasomeID. The fold changes are compared to the other identified proteins using total proteome (left) or ProteasomeID data (right). *** p<0.001 Wilcoxon Rank Sum test with continuity correction. (f) Bar plots comparing the levels of three potential novel proteasome substrate proteins following streptavidin enrichment from different cell lines and following proteasome inhibition by MG132. Protein quantities were derived from DIA mass spectrometry data. mT: miniTurbo control cell line; A4-mT: PSMA4-miniTurbo cell line; I: proteasome inhibition by MG132. Data are shown as mean ± standard error from n=4 biological replicates. (g) Cycloheximide-chase experiment on stability of 3 potential novel proteasome substrate proteins. HEK293T cells were incubated with 50 μg/ml cycloheximide (CHX) for the indicated times in the presence or absence of MG132 (20 μM). Cell lysates were then prepared for western blot analysis of steady-state levels of c-Myc, ARMC6, BRAT1, and TIGD5. c-Myc was used as a positive control as it is a well known proteasome substrate. Densitometric quantification of the bands from the assay are shown in bar plots. For quantification, bands were first normalized to GAPDH as a loading control and subsequently normalized to zero hour, untreated samples (set to 1). CHX = cycloheximide.
Figure 4—figure supplement 1
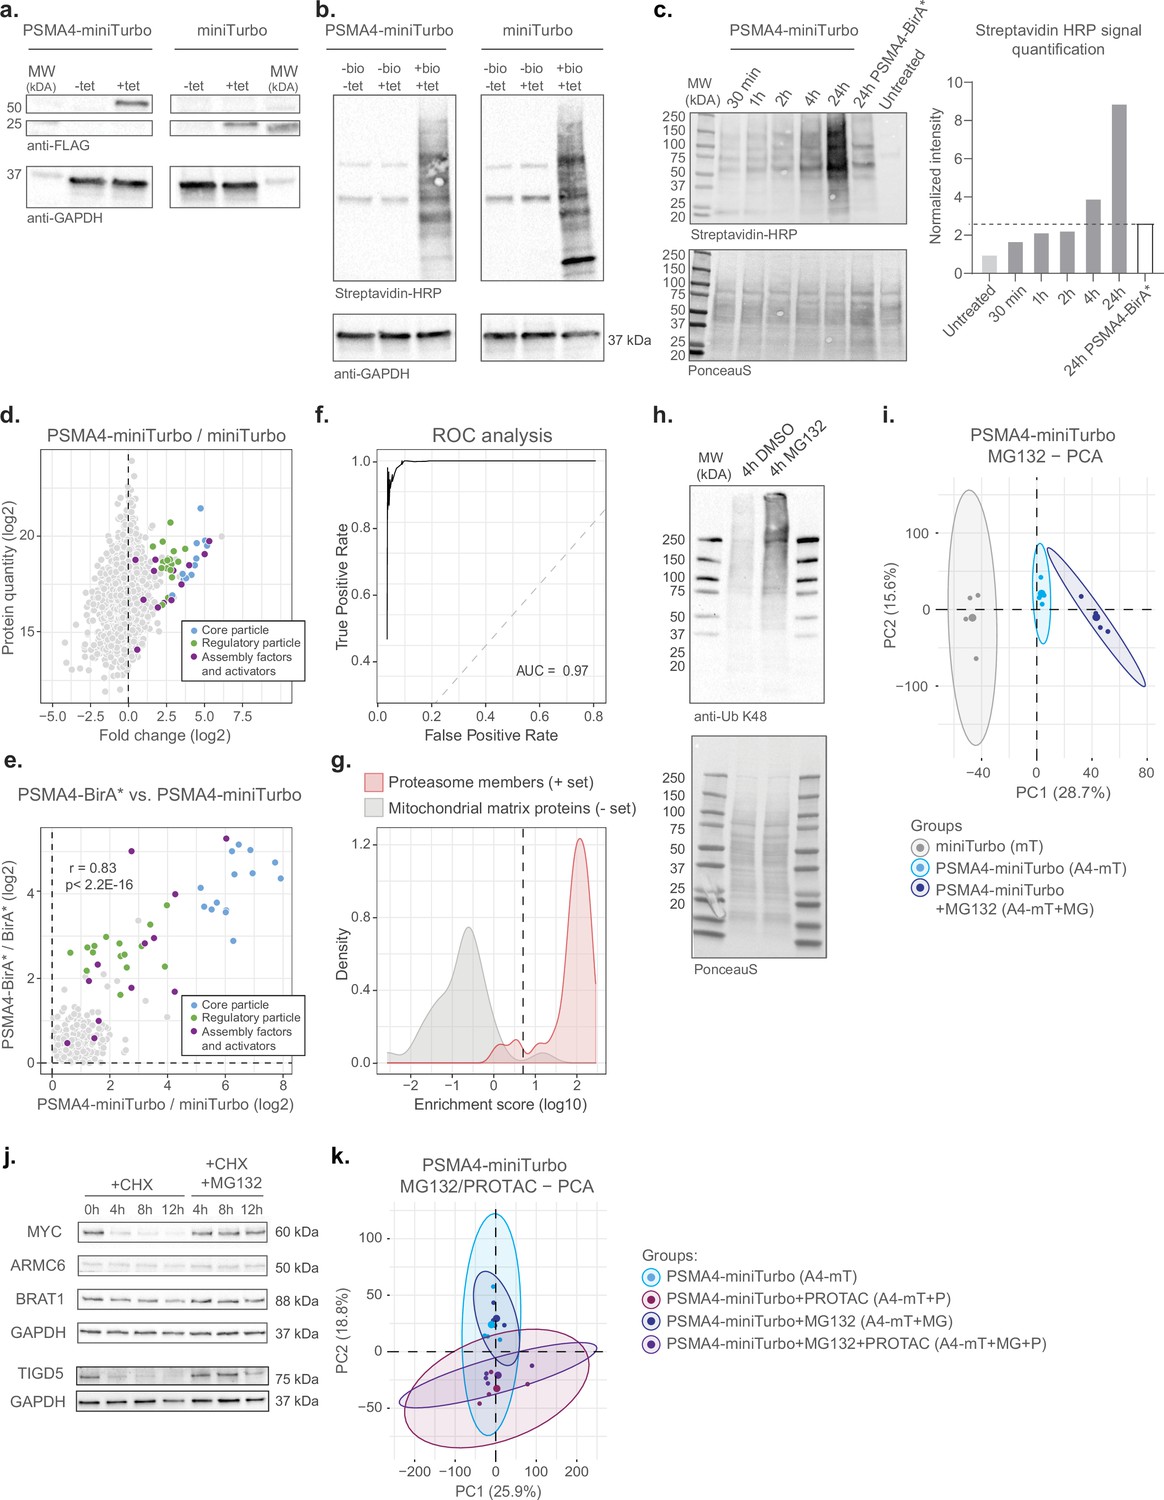
Validation of PSMA4-miniTurbo cell line and application of ProteasomeID for detecting endogenous and PROTAC-induced proteasome substrates.
(a) Immunoblot of miniTurbo fusion proteins performed on lysates collected from HEK293T cells stably transfected with PSMA4-miniTurbo-FLAG or miniTurbo-FLAG following 4 days of incubation with (+tet) or without (−tet) tetracycline. Immunoblot against GAPDH was used as loading control. (b) Streptavidin-HRP immunoblot following induction of miniTurbo fusion proteins with tetracycline and supplementation of biotin for 2 hr. Immunoblot against GAPDH was used as loading control. (c) Streptavidin-HRP immunoblot following induction of miniTurbo fusion proteins with tetracycline and supplementation of biotin for indicated times. For the sample used as negative control biotin supplementation was omitted (-biotin). Ponceau staining was used as loading control. Bar plots on the left depict densitometric quantification of the immunoblot. Samples were normalized to the band intensity of PSMA4-BirA* sample not supplemented with biotin (untreated sample). (d) MA plot of proteins enriched by streptavidin pull-down and analyzed by DIA mass spectrometry from PSMA4-miniTurbo and miniTurbo control cell lines. Data were obtained from n=4 biological replicates. (e) Comparison of log2 fold changes for streptavidin-enriched proteins from PSMA4-BirA* and PSMA4-miniTurbo compared to their respective controls. Proteins significant (Q value <0.05) and displaying a log2 fold change >0 in both comparisons were considered for the analysis. (f) ROC analysis of the classifier used to define ProteasomeID (PSMA4-miniTurbo) enriched proteins. (g) Distribution of enrichment scores for PSMA4-miniTurbo enriched proteins. Calculated by the classifier algorithm for proteasome subunits (set of true positives) and mitochondrial matrix proteins (set of true negatives). The dashed vertical line indicates the enrichment score cut-off to define ProteasomeID enriched proteins at FPR <0.05. (h) Immunoblot for K48 ubiquitylated proteins from PSMA4-miniTurbo cells treated with 20 µM MG132 for 4 h. As a negative control the same cell line was treated in the same way with DMSO only. Ponceau staining was used as loading control. (i) Principal component analysis (PCA) of ProteasomeID data obtained from cell lines expressing PSMA4-miniTurbo and control (miniTurbo), and PSMA4-miniTurbo following exposure to proteasome inhibitor MG132. The smaller dots represent individual samples and the larger dots the centroids of each group. Ellipses represent 95% confidence intervals. The percentage of variance explained by the first two principal components (PC) axes is reported in the axis titles. n=4, biological replicates. (j) Cycloheximide-chase experiment on stability of 3 potential novel proteasome substrate proteins. PSMA4-BirA*cells were incubated with 50 μg/ml cycloheximide (CHX) for the indicated times in the presence or absence of MG132 (20 μM) and tetracycline (1 µg/µl). Cell lysates were then prepared for western blot analysis of steady-state levels of c-Myc, ARMC6, and BRAT1 and TIGD5. c-Myc was used as a positive control as it is a well known proteasome substrate. Tet = tetracycline, CHX = cycloheximide. (k) Principal component analysis (PCA) of ProteasomeID data obtained from cells expressing PSMA4-miniTurbo exposed to the proteasome inhibitor MG132 and/or the PROTAC KB02-JQ1. The smaller dots represent individual samples and the larger dots the centroids of each group. Ellipses represent 95% confidence intervals. The percentage of variance explained by the first two principal components (PC) axes is reported in the axis titles. n=4, biological replicates.
-
Figure 4—figure supplement 1—source data 1
Raw unedited gels for Figure 4—figure supplement 1.
- https://cdn.elifesciences.org/articles/93256/elife-93256-fig4-figsupp1-data1-v1.zip
-
Figure 4—figure supplement 1—source data 2
Uncropped and labeled gels for Figure 4—figure supplement 1.
- https://cdn.elifesciences.org/articles/93256/elife-93256-fig4-figsupp1-data2-v1.zip
Figure 5
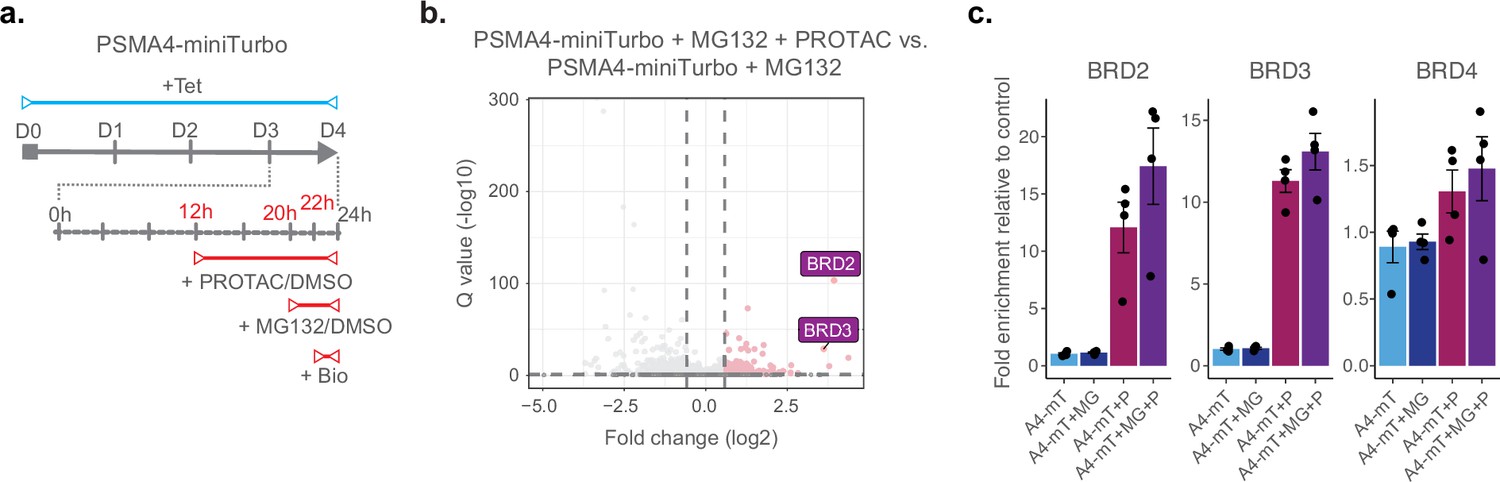
ProteasomeID identifies PROTAC-induced proteasome substrates.
(a) Scheme of ProteasomeID workflow in HEK293T cells including proteasome inhibition by MG132 and treatment with PROTAC KB02-JQ1. The experimental design is analogous to the one depicted in (Figure 4A) with the additional PROTAC treatment achieved by addition of 10 µM KB02-JQ1 12 hr before cell harvesting. D: day; h: hour; Tet: tetracycline; Bio: biotin. (b) Volcano plot of proteins enriched by streptavidin pull-down and analyzed by DIA mass spectrometry from PSMA4-miniTurbo cells treated with KB02-JQ1 PROTAC molecule (P) and PSMA4-miniTurbo cells treated with both PROTAC molecule (P) and MG132 proteasome inhibitor (I). Cut offs for enriched proteins: log2 fold change >1 and Q value <0.05. n=4, biological replicates. Enrichment of BRD containing proteins is highlighted in violet boxes. (c) Bar plots comparing the levels of BRD-containing proteins following streptavidin enrichment from PSMA4-miniTurbo expressing cells exposed to the proteasome inhibitor MG132 and/or the PROTAC KB02-JQ1. mT: miniTurbo control cell line; A4-mT: PSMA4-miniTurbo cell line; I: proteasome inhibition by MG132; P: PROTAC (KB02-JQ1). Data are shown as mean ± standard error from n=4 biological replicates.
Figure 6 with 1 supplement
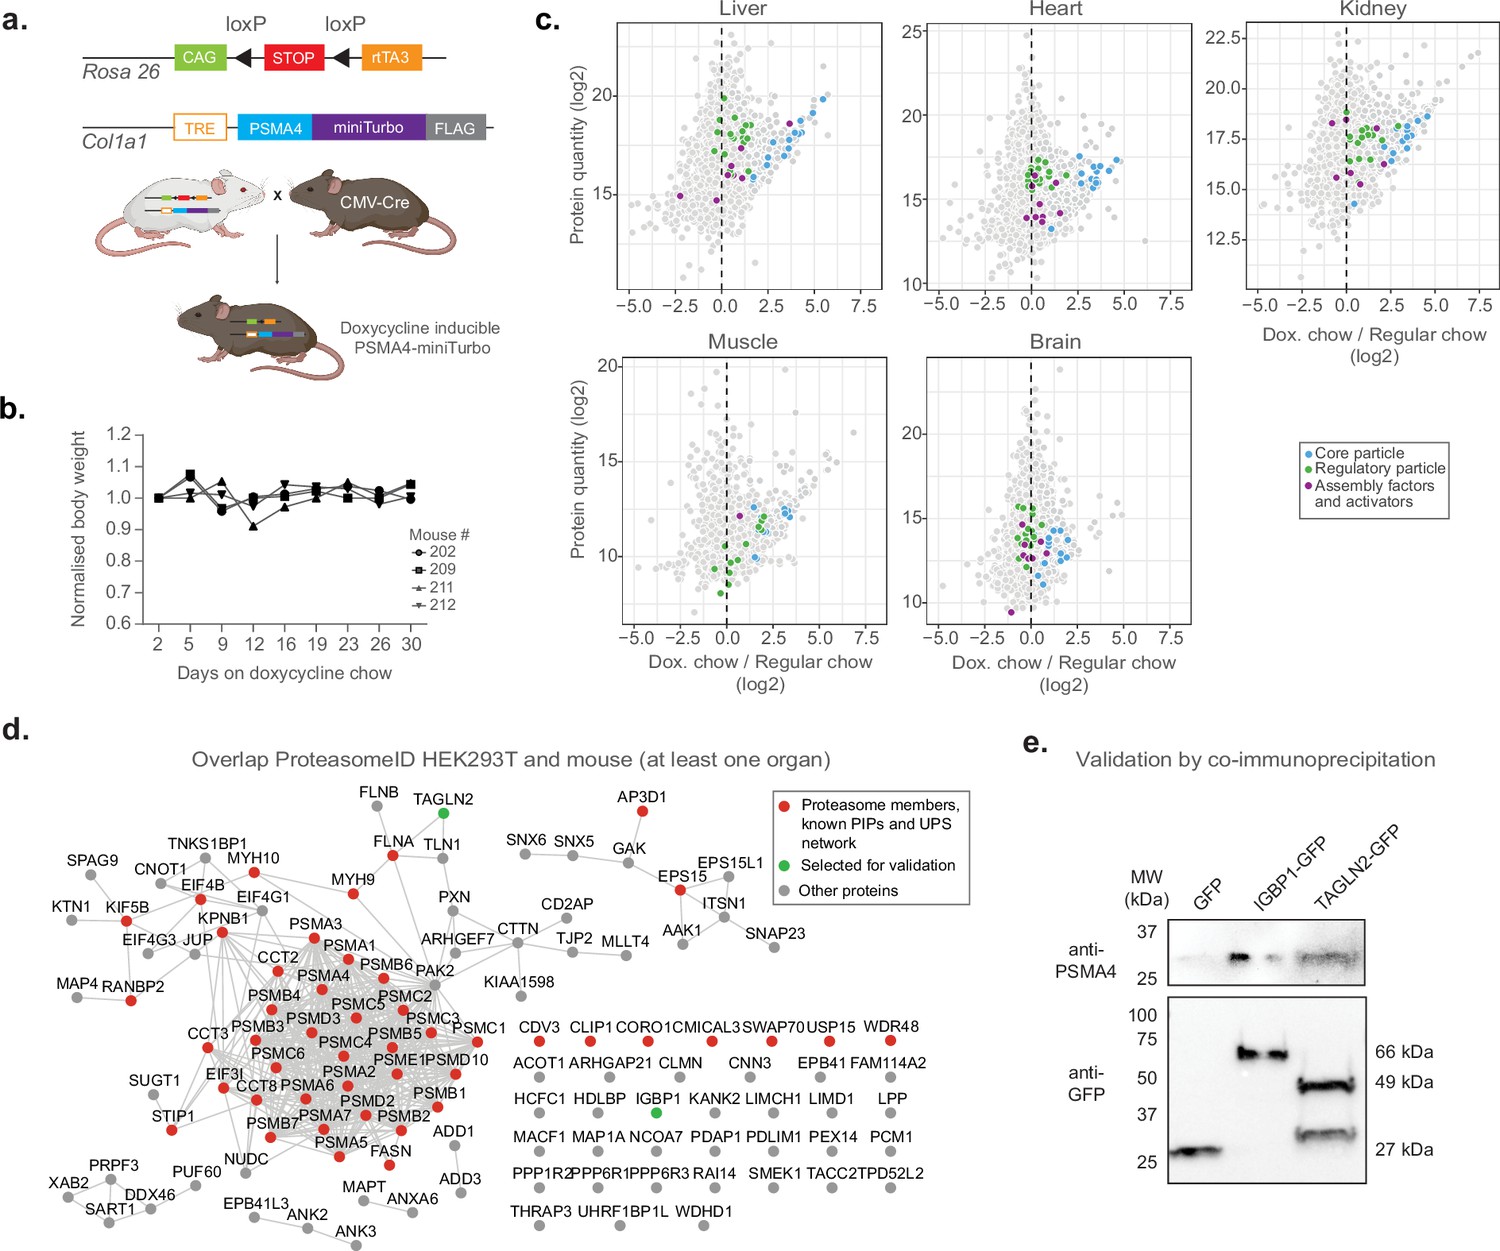
Establishment of a mouse model for in vivo ProteasomeID.
(a) Design of a mouse model for ProteasomeID. The lox-STOP-lox cassette was excised from the Rosa26 locus by crossing with a mouse line expressing the Cre recombinase under the control of an ubiquitous CMV promoter (Nagy, 2000). CAG: CAG promoter (Miyazaki et al., 1989), TRE: tetracycline-regulated element; rtTA3: reverse tetracycline-dependent transactivator A3 (Dow et al., 2014). Panel created with BioRender.com, and published using a CC BY-NC-ND license with permission. (b) Bodyweight curves of the experimental animals. The body weight for each mouse was normalized to its value at day 1 of the experiment (set to 1). (c) MA plots of proteins enriched by streptavidin pull-down and analyzed by DIA mass spectrometry from different mouse organs. Highlighted in color are proteasome members, assembly factors and activators, and other proteins significantly enriched in ProteasomeID (FPR <0.05). n=4 mice per experimental group. (d) Network analysis of overlap of significantly enriched proteins in ProteasomeID from HEK293T cells expressing PSMA4-BirA* and mouse organs (significant in at least one organ). Nodes colored in red indicate proteasome members, PIPs or proteins belonging to the UPS networks. The proteins selected for validation by co-immunoprecipitation are highlighted in green. Edges represent high confidence (>0.7) protein-protein interactions derived from the STRING database (Snel et al., 2000). (e) Cells expressing either GFP, IGBP1-GFP or TAGLN2-GFP were used for co-immunoprecipitation using GFP-trap. The elutions from GFP-trap were analyzed by immunoblot using antibodies against PSMA4 or GFP.
© 2024, BioRender Inc. Figure 6A was created using BioRender, and is published under a CC BY-NC-ND license. Further reproductions must adhere to the terms of this license.
-
Figure 6—source data 1
Raw unedited gels for Figure 6.
- https://cdn.elifesciences.org/articles/93256/elife-93256-fig6-data1-v1.zip
-
Figure 6—source data 2
Uncropped and labeled gels for Figure 6.
- https://cdn.elifesciences.org/articles/93256/elife-93256-fig6-data2-v1.zip
Figure 6—figure supplement 1
ProteasomeID mouse model validation and optimization.
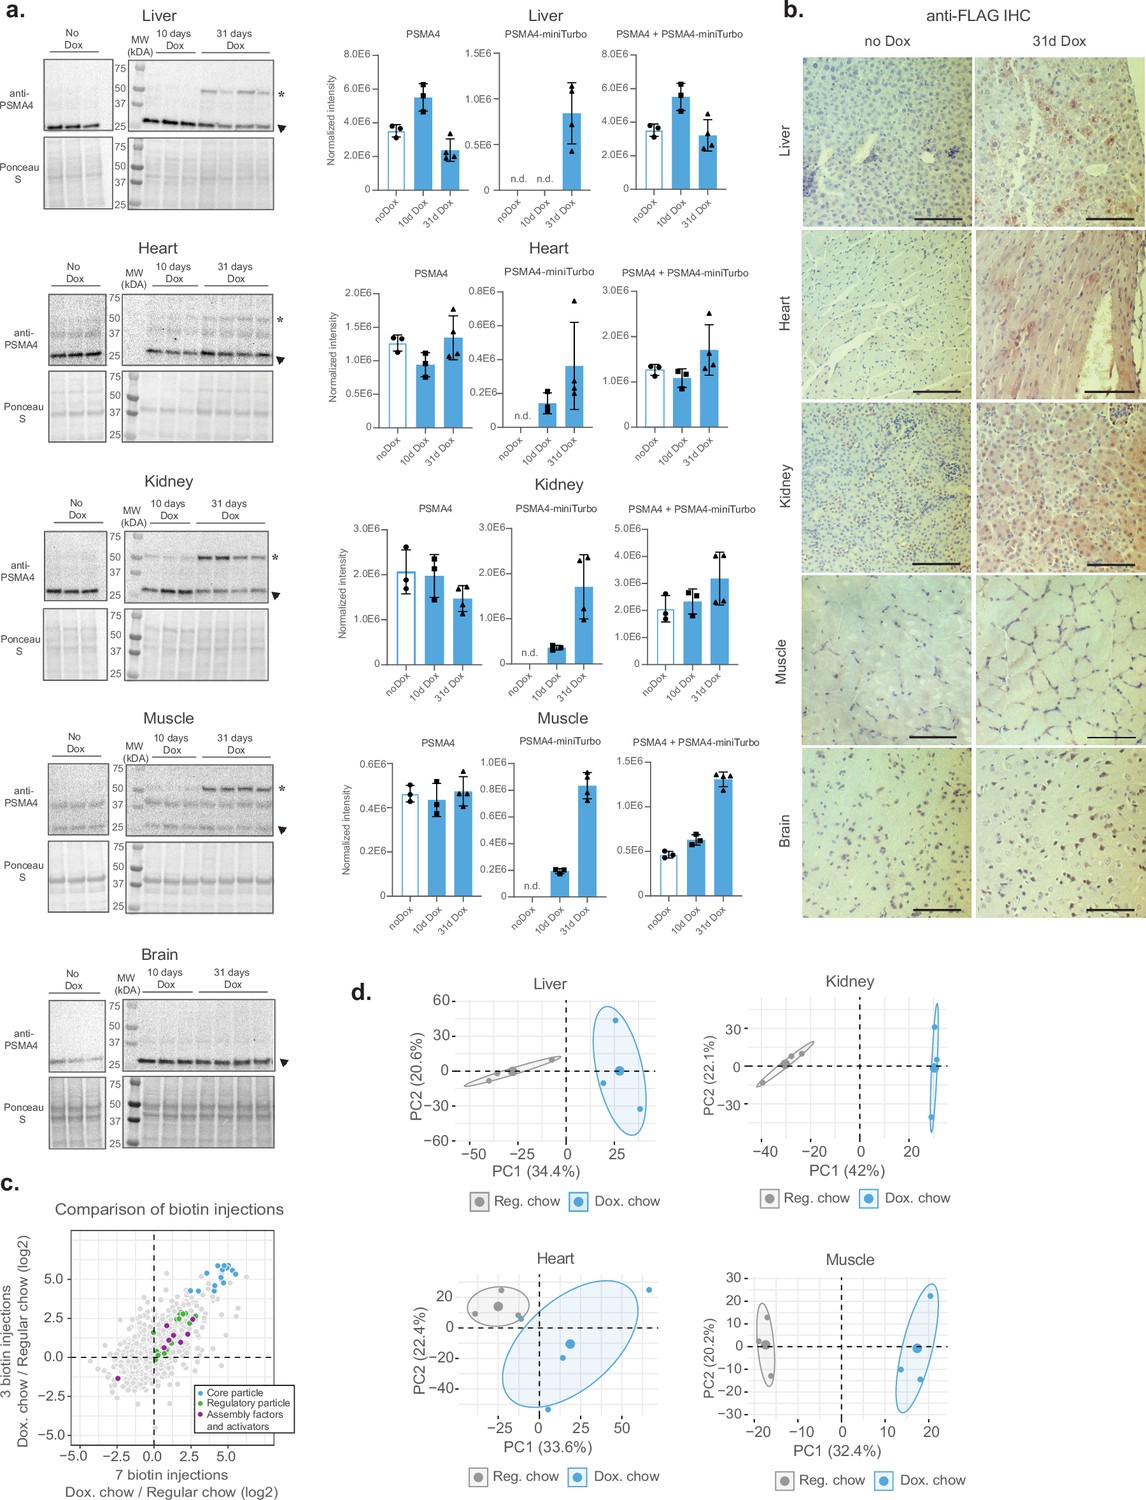
(a) Immunoblots of PSMA4 protein performed on tissue lysates collected from ProteasomeID mice fed with regular chow or doxycycline containing food for 10 and 31 days and submitted to 3 daily biotin injections. Ponceau staining was used as loading control and for normalization of densitometric quantification of corresponding immunoblots. No Dox = mice fed with regular chow, 10d Dox = mice fed with doxycycline containing food for 10 days, 31d Dox = mice fed with doxycycline containing food for 31 days. Error bars indicate standard deviation from n=3-4 mice per condition. (b) Anti-FLAG immunohistochemistry analysis of tissues from ProteasomeID mice fed with regular chow (left) or doxycycline containing food (right) 31 days and submitted to 3 daily biotin injections. Scale bar indicates 20 µm. Dox = mice fed with doxycycline containing food; no Dox = mice fed with regular chow. (c) Plot showing comparison of enrichment levels (in log2 fold change) of proteasome subunits and strong PIPs achieved in ProteasomeID mice fed with regular chow or doxycycline containing food for 10 and 14 days and submitted to 3 or 7 daily biotin injections respectively. (d) Principal component analysis (PCA) of the tissue samples from ProteasomeID mice, based on the abundance of all proteins identified by label-free mass spectrometry. The smaller dots represent individual samples and the larger dots the centroids of each age-matched group. Ellipses represent 95% confidence intervals. The percentage of variance explained by the first two PC axes is reported in the axis titles.
-
Figure 6—figure supplement 1—source data 1
Raw unedited gels for Figure 6—figure supplement 1.
- https://cdn.elifesciences.org/articles/93256/elife-93256-fig6-figsupp1-data1-v1.zip
-
Figure 6—figure supplement 1—source data 2
Uncropped and labeled gels for Figure 6—figure supplement 1.
- https://cdn.elifesciences.org/articles/93256/elife-93256-fig6-figsupp1-data2-v1.zip
Author response image 1

Proteins identified in the NUP158 BioID or pulldown experiments are filled in red or light red for significance intervals A or B, respectively.
The bait protein NUP158 is filled in yellow. Proteins enriched in the pulldown falling outside the SigA/B cutoff are filled in gray. NPC, nuclear pore complex. SigA, significant class A; SigB, significant class B. Reproduced from Figure 6 of Moreira CMDN et al., 2023 (PMID: 36410438).
Author response image 2
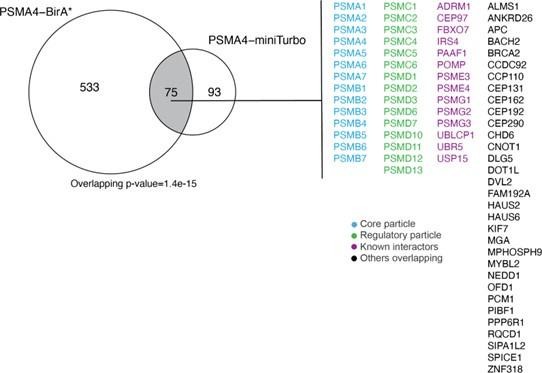
Overlap between ProteasomeID enriched proteins (fpr<0.05) between PSMA4-BirA* and PSMA4-miniTurbo.
Author response image 3

Upset plot showing overlap between ProteasomeID enriched proteins in different mouse organs.
Author response image 4

Streptavidin-HRP immunoblot following induction of BirA* fusion proteins with tetracycline (+tet) and supplementation of biotin (+bio).
For the sample used as expression control tetracycline was omitted (-tet). To test background biotinylation, biotin supplementation was omitted (-bio). Immunoblot against BirA* and PSMA was used to verify induction of fusion proteins, while GAPDH was used as loading control.
Tables
Appendix 1—key resources table
| Reagent type (species) or resource | Designation | Source or reference | Identifiers | Additional information |
|---|---|---|---|---|
| gene (Homo sapiens) | psma4 | Uniprot | P25789 | |
| gene (H. sapiens) | psma4 | Uniprot | Q9R1P0 | |
| Strain (Mus musculus) | Rosa26-CAGs-RIK mice | Nagy, 2000 | ||
| Strain (M. musculus) | CMV-Cre line | Nagy, 2000 | ||
| Strain (M. musculus) | Rosa26 mice (B6.Cg-Col1a1tm1(tetO-cDNA:Psma4)Mirim/J; B6.Cg-Gt(ROSA)26Sortm2 (CAG-rtTA3,-mKate2)Slowe/J) | Dow et al., 2014, Mirimus Inc (NY, USA) | ||
| Cell line (H. sapiens) | Flp-In T-REx 293 cells | Invitrogen | R78007 | |
| Transfected construct (H. sapiens) | PSMA4_BirA_Cterm | Addgene ID: 221513 | ||
| Transfected construct (H. sapiens) | PSMD3_BirA_Nterm | Addgene ID: 221526 | ||
| Transfected construct (H. sapiens) | Igbp1-GFP | Addgene ID: 221529 | ||
| Transfected construct (H. sapiens) | Tagln2-GFP | Addgene ID: 221530 | ||
| Transfected construct (H. sapiens) | PSMC2_BirA_Cterm | This paper (Figure 1—figure supplement 3) | ||
| Transfected construct (H. sapiens) | PSMA4_miniTurbo_Cterm | Addgene ID: 222600 | ||
| Antibody | anti-FLAG M2 (mouse monoclonal) | Sigma Aldrich | F3165 | 1:1000 |
| Antibody | anti-FLAG M2 (mouse monoclonal) | Sigma Aldrich | F1804 | 1:500 |
| Antibody | anti-PSMA4 (rabbit polyclonal) | NOVUS biologicals | NBP2-38754 | 1:250 |
| Antibody | anti-β-actin (mouse monoclonal) | Sigma Aldrich | A5441 | 1:5000 |
| Antibody | anti-PSMC2 (rabbit polyclonal) | Proteintech | 14905–1-AP | 1:1000 |
| Antibody | anti-c-Myc (rabbit monoclonal) | Abcam | ab32072 | 1:1000 |
| Antibody | anti-Ubi-K48 (rabbit monoclonal) | Millipore | 05–1307 | 1:1000 |
| Antibody | anti-ARMC6 (rabbit polyclonal) | Sigma Aldrich | HPA041420 | 1:2000 |
| Antibody | anti-BRAT1 (rabbit monoclonal) | Abcam | ab181855 | 1:10000 |
| Antibody | anti-GAPDH (mouse monoclonal) | Santa Cruz | sc-365062 | 1:200 |
| Antibody | anti-rabbit HRP-conjugated (goat polyclonal) | Dako | P0448 | 1:2000 |
| Antibody | anti-mouse HRP-conjugated (goat polyclonal) | Dako | P0447 | 1:1500 |
| Antibody | anti-FLAG (rabbit polyclonal) | Sigma Aldrich | F7425 | 1:100 |
| Antibody | anti-mouse-Cyanine5 (goat polyclonal) | Thermo Fisher Scientific | A10524 | 1:400 |
| Antibody | anti-mouse Alexa Fluor 488 (goat polyclonal) | Invitrogen | A21121 | 1:1000 |
| Antibody | anti-Proteasome 20 S alpha 1+2 + 3+5 + 6+7 (mouse monoclonal) | Abcam | ab22674 | 1:200 |
| Antibody | anti-GFP (mouse monoclonal) | Santa Cruz | sc-9996 | 1:1000 |
| Antibody | anti-BirA (mouse monoclonal) | Novus biologicals | NBP2-59939 | 1:500 |
| Antibody | anti-TIGD5 (rabbit polyclonal) | Proteintech | 13644–1-AP | 1:1000 |
| Peptide, recombinant protein | Streptavidin HRP | Abcam | ab7403 | 1:40000 |
| Peptide, recombinant protein | Streptavidin Alexa Fluor 568 | Invitrogen | S11226 | 1:2000 |
| Peptide, recombinant protein | Aprotinin | Carl Roth | A162.3 | |
| Peptide, recombinant protein | Leupeptin | Carl Roth | CN33.2 | |
| Peptide, recombinant protein | Trypsin | Promega | V511 | |
| Peptide, recombinant protein | Trypsin-EDTA | Thermo Fisher Scientific | 25300–062 | |
| Peptide, recombinant protein | LysC | Wako | 125–05061 | |
| Peptide, recombinant protein | Phusion High-Fidelity DNA Polymerase | NEB | M0530S | |
| Peptide, recombinant protein | Turbonuclease | MoBiTec GmbH | GE-NUC10700-01 | |
| Peptide, recombinant protein | KB02-JQ1 | MedChemExpress | HY-129917 | |
| Peptide, recombinant protein | Bovine serum albumin | Carl Roth | 3737.3 | |
| Commercial assay or kit | EZQ Protein Quantitation Kit | Invitrogen | R33200 | |
| Commercial assay or kit | Pierce ECL Western Blotting Substrate | Thermo Fisher Scientific | 32106 | |
| Commercial assay or kit | 20 S proteasome activity assay kit | Millipore | APT280 | |
| Commercial assay or kit | NativePAGE Running Buffer Kit | Invitrogen | BN2007 | |
| Commercial assay or kit | Precellys lysing kit | Bertin Instruments | 431–0170 | Keramik-kit 1.4/2.8 mm, 2 ml |
| Commercial assay or kit | VECTASTAIN Elite ABC HRP Kit | VectorLabs | PK-6100 | |
| Commercial assay or kit | Duolink In Situ PLA Probe Anti-Mouse MINUS | Sigma Aldrich | DUO92004 | |
| Commercial assay or kit | Duolink In Situ PLA Probe Anti-Rabbit PLUS | Sigma Aldrich | DUO92002 | |
| Commercial assay or kit | Duolink In Situ Detection Reagents Red | Sigma Aldrich | DUO92008 | |
| Commercial assay or kit | Duolink In Situ Wash Buffers, Fluorescence | Sigma Aldrich | DUO82049 | |
| Commercial assay or kit | iRT kit | Biognosys | Ki-3002–1 | |
| Chemical compound, drug | Biotin | Sigma Aldrich | B4501 | |
| Chemical compound, drug | D(+)-biotin | Sigma Aldrich | 3822.1 | |
| Chemical compound, drug | Duolink In Situ Mounting Medium with DAPI | Sigma Aldrich | DUO82040 | |
| Chemical compound, drug | L-Glutamine | Sigma Aldrich | G7513 | |
| Chemical compound, drug | complete Mini EDTA-free Protease Inhibitor | Sigma Aldrich | 04693132001 | |
| Chemical compound, drug | Tetracycline | Sigma Aldrich | 87128 | |
| Chemical compound, drug | HEPES | Sigma Aldrich | H3375 | |
| Chemical compound, drug | Sodium dodecyl sulfate | Sigma Aldrich | 75746 | |
| Chemical compound, drug | PonceauS | Sigma Aldrich | P7170 | |
| Chemical compound, drug | Sodium deoxycholate | Sigma Aldrich | 30970 | |
| Chemical compound, drug | Naphtol blue black | Sigma Aldrich | N3393 | |
| Chemical compound, drug | Adenosine triphosphate | Sigma Aldrich | A2383 | |
| Chemical compound, drug | MG132 | Sigma Aldrich | M7449, 474787 | |
| Chemical compound, drug | NP-40 | Sigma Aldrich | I8896 | |
| Chemical compound, drug | KCl | Sigma Aldrich | I1149 | |
| Chemical compound, drug | Iodoacetamide | Sigma Aldrich | I8896 | |
| Chemical compound, drug | Dimethyl sulfoxide | Sigma Aldrich | D2438 | |
| Chemical compound, drug | Cycloheximide | Sigma Aldrich | C7698 | |
| Chemical compound, drug | Hygromycin B | Thermo Fisher Scientific | 10687010 | |
| Chemical compound, drug | Zeocin | Thermo Fisher Scientific | R25001 | |
| Chemical compound, drug | Sulfo-NHS-Acetate | Thermo Fisher Scientific | 20217 | |
| Chemical compound, drug | DAPI (4',6-Diamidino-2-Phenylindole, Dihydrochloride) | Thermo Fisher Scientific | D1306 | |
| Chemical compound, drug | Permafluor mounting medium | Thermo Fisher Scientific | TA-006-FM | |
| Chemical compound, drug | Poly-D-Lysine | Thermo Fisher Scientific | A3890401 | |
| Chemical compound, drug | Blasticidin | Thermo Fisher Scientific | R21001 | |
| Chemical compound, drug | EDTA | Carl Roth | 8043.2 | |
| Chemical compound, drug | EGTA | Carl Roth | 3054.1 | |
| Chemical compound, drug | NaCl | Carl Roth | 3957.1 | |
| Chemical compound, drug | Triton X-100 | Carl Roth | 3051.3 | |
| Chemical compound, drug | Tris | Carl Roth | 4855.2 | |
| Chemical compound, drug | Glycerin | Carl Roth | 7533.1 | |
| Chemical compound, drug | β-mercaptoethanol | Carl Roth | 4227.3 | |
| Chemical compound, drug | Tween-20 | Carl Roth | 9127.1 | |
| Chemical compound, drug | Acetic acid | Carl Roth | 6755.1 | |
| Chemical compound, drug | Ammonium bicarbonate | Carl Roth | T871.2 | |
| Chemical compound, drug | Formic acid | Carl Roth | 4724.3 | |
| Chemical compound, drug | Formaldehyde | Carl Roth | CP10.1 | |
| Chemical compound, drug | Methanol | Biosolve | 0013684102BS | |
| Chemical compound, drug | Acetone | Biosolve | 0001037801BS | |
| Chemical compound, drug | Formic acid | Biosolve | 0006914143B5 | |
| Chemical compound, drug | Trifluoroacetic acid | Biosolve | 0020234131BS | |
| Chemical compound, drug | Acetonitrile | Biosolve | 0001204102BS | |
| Chemical compound, drug | 2-propanol | Biosolve | 0016264101BS | |
| Chemical compound, drug | X‐tremeGENE 9 DNA Transfection Reagent | Roche | 06365779001 | |
| Chemical compound, drug | Phosphatase inhibitors | Roche | 04906837001 | |
| Chemical compound, drug | protease inhibitors | Roche | 04693159001 | |
| Chemical compound, drug | MgCl2 | Merck | 8.14733.0100 | |
| Chemical compound, drug | Glycine | VWR | 1042011000 | |
| Chemical compound, drug | Urea | Bio Rad | 161–0730 | |
| Chemical compound, drug | standard chow | ssniff | V1524-786 | |
| Chemical compound, drug | chow with doxycycline | ssniff | A153D00624 | |
| Chemical compound, drug | xylene | VWR | 28973.363 | |
| Chemical compound, drug | ethanol | VWR | 85830.360 | |
| Software, algorithm | Spectronaut | Biognosys | ||
| Other | Dulbecco’s modified Eagle’s medium (DMEM) high glucose 4.5 g/l | Sigma Aldrich | D6429 | Cell culture media |
| Other | PBS | Sigma Aldrich | D8537 | Buffer |
| Other | Fetal bovine serum | Thermo Fisher Scientific | 10270–106 | Supplement for cell culture media |
| Other | Goat serum | Thermo Fisher Scientific | 31872 | Blocking reagent for immunofluorescence |
Additional files
-
Supplementary file 1
BioID data from cell lines expressing different biotin ligase fusion proteins.
- https://cdn.elifesciences.org/articles/93256/elife-93256-supp1-v1.xlsx
-
Supplementary file 2
SEC-MS data and biotinylation sites identified by ProteasomeID.
(Tab1) SEC-MS data from HEK293T cells expressing PSMA4-BirA*. (Tab2) Biotinylation sites on proteasome subunits identified by 1015 PSMA4-BirA*.
- https://cdn.elifesciences.org/articles/93256/elife-93256-supp2-v1.xlsx
-
Supplementary file 3
Lists of known Proteasome Interacting Proteins (PIPs) and proteins enriched by ProteasomeID.
(Tab1) List of PIPs from Bousquet et al., Fabre et al., Gedaki et al. (Tab2) List of PIPs from other studies. (Tab3) Protein groups enriched by ProteasomeID for PSMA4-BirA* dataset by the classifier algorithm and overlap with previous studies. (Tab4) GO enrichment candidate novel proteasome interactors.
- https://cdn.elifesciences.org/articles/93256/elife-93256-supp3-v1.xlsx
-
Supplementary file 4
ProteasomeID data following MG132 and KB02-JQ1 treatment.
(Tab1) ProteasomeID data following treatment with MG132. (Tab2) Overlap between protein groups enriched only upon MG132 inhibition and the ones whose level of ubiquitination is shown to increase upon MG132 inhibition in a previous study. (Tab3) ProteasomeID data following treatment with PROTAC KB02-JQ1.
- https://cdn.elifesciences.org/articles/93256/elife-93256-supp4-v1.xlsx
-
Supplementary file 5
ProteasomeID data from mouse organs.
(Tab1-5) Protein groups enriched by ProteasomeID for mouse dataset. (Tab6) Overlap of ProteasomeID enriched proteins between HEK293T and mouse organs.
- https://cdn.elifesciences.org/articles/93256/elife-93256-supp5-v1.xlsx
-
MDAR checklist
- https://cdn.elifesciences.org/articles/93256/elife-93256-mdarchecklist1-v1.docx
Download links
A two-part list of links to download the article, or parts of the article, in various formats.
Downloads (link to download the article as PDF)
Open citations (links to open the citations from this article in various online reference manager services)
Cite this article (links to download the citations from this article in formats compatible with various reference manager tools)
Quantitative mapping of proteasome interactomes and substrates using ProteasomeID
eLife 13:RP93256.
https://doi.org/10.7554/eLife.93256.3


