Daptomycin forms a stable complex with phosphatidylglycerol for selective uptake to bacterial membrane
- Shenzhen Research Institute and Department of Chemistry, The Hong Kong University of Science and Technology, China
Figures
Figure 1
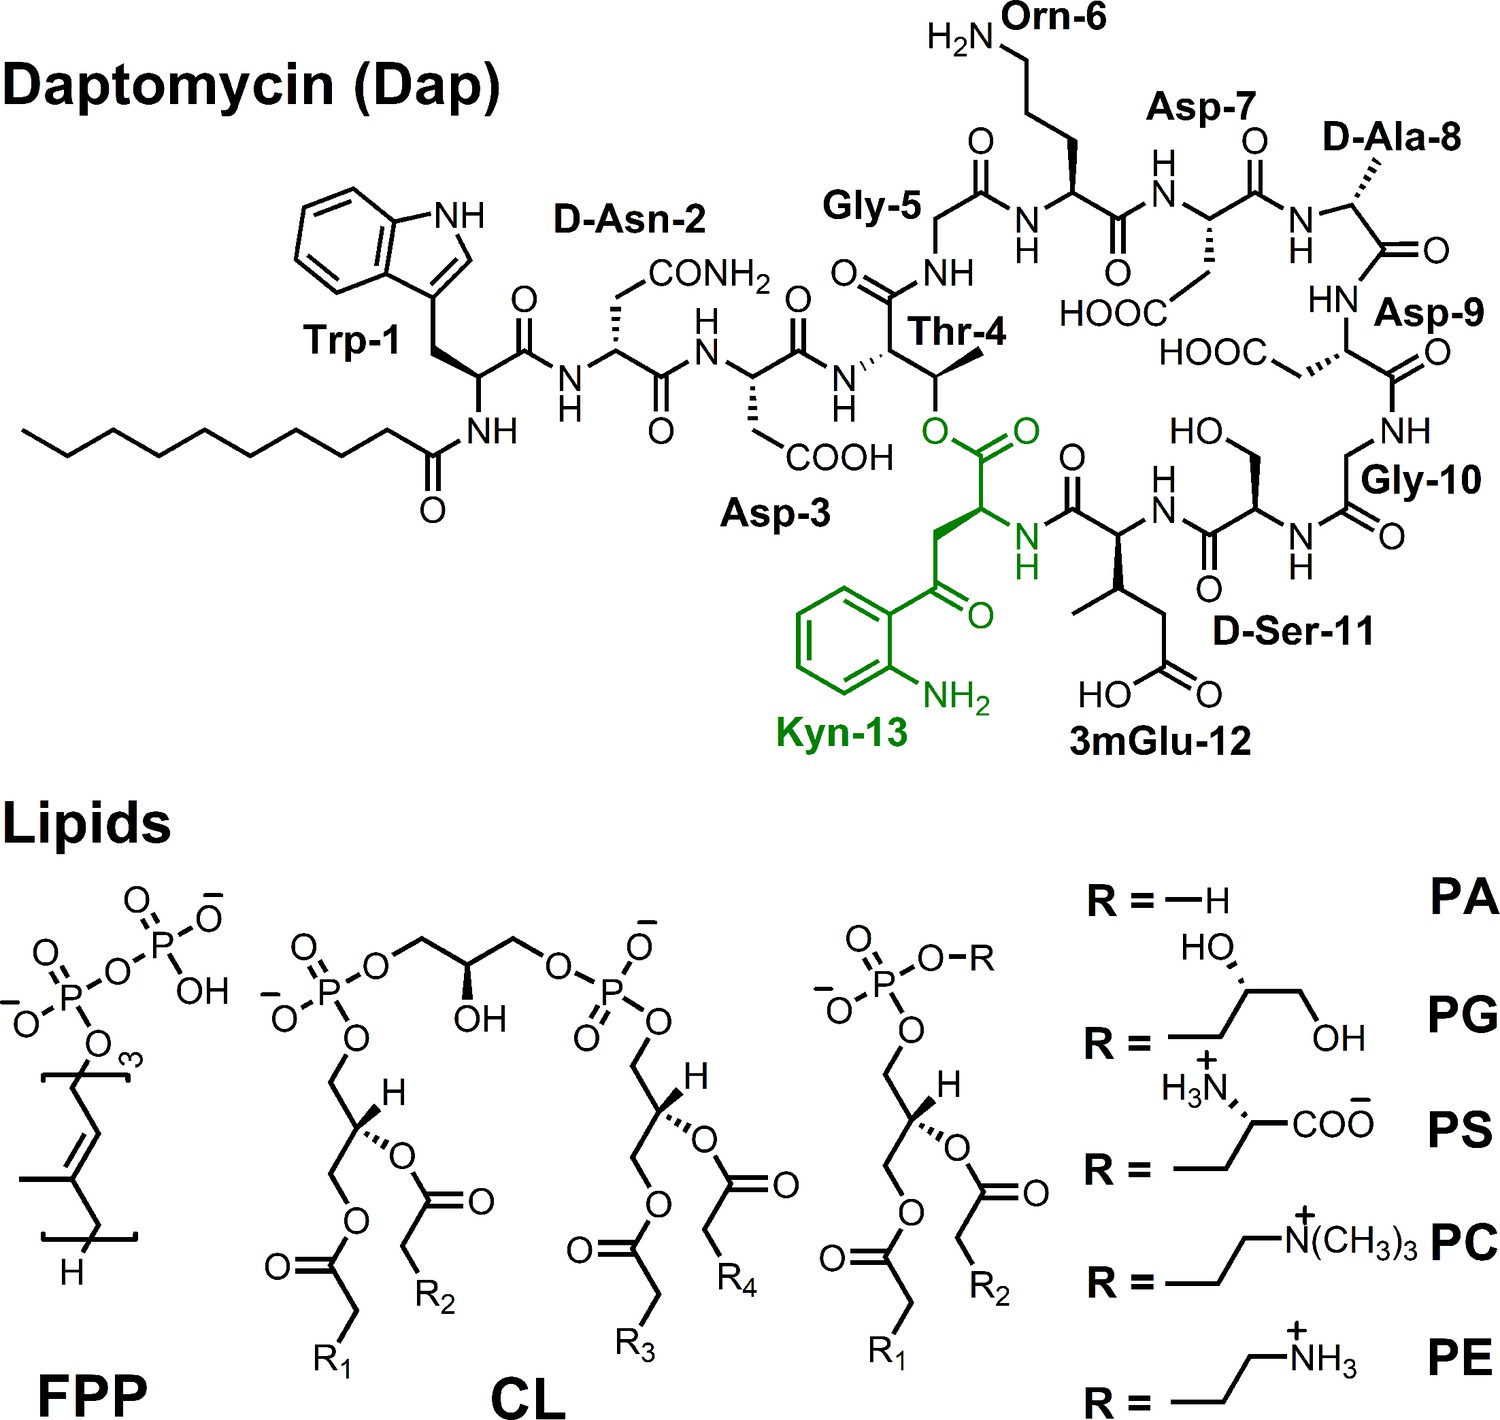
Structure of daptomycin and lipids.
Figure 2 with 3 supplements
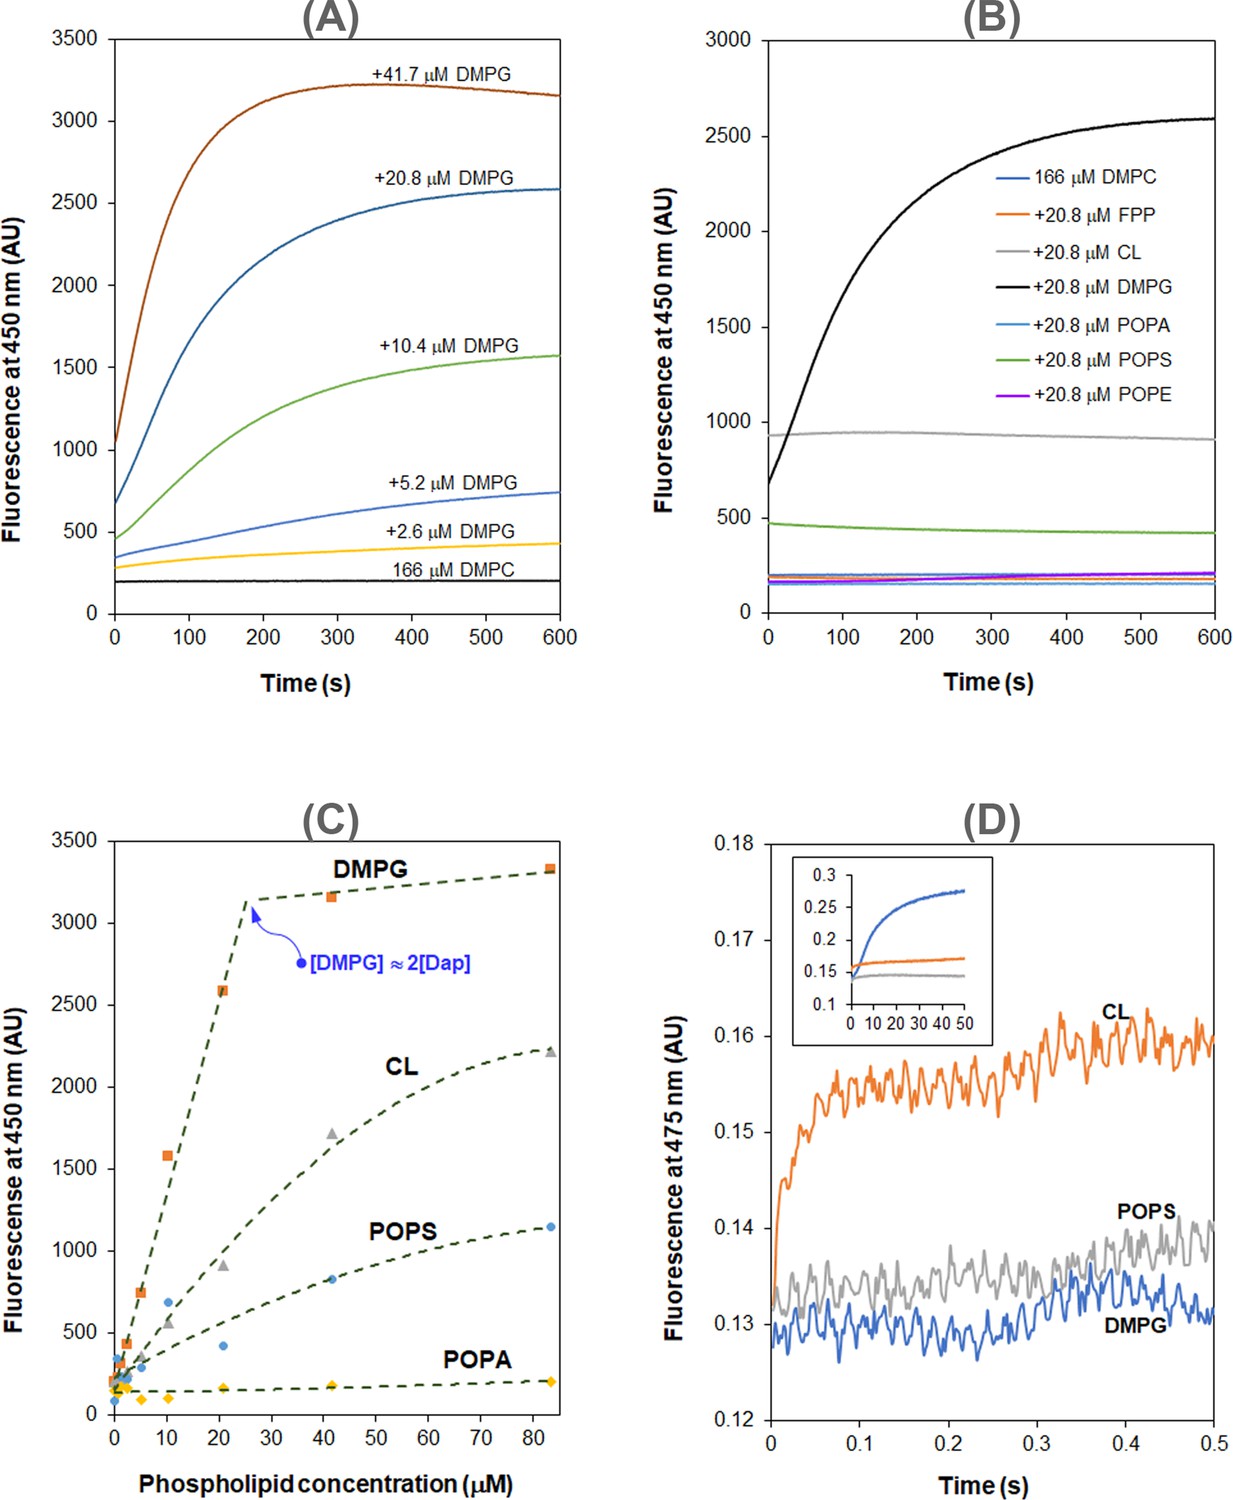
Daptomycin (Dap) depends on phosphatidylglycerol (PG) in the interaction with membrane.
(A) 1,2-Dimyristoyl-sn-glycero-3-phosphorylglycerol (DMPG)-dependent accumulation of Dap in phospholipid micelles. (B) Kinetics of the fluorescence of Dap in interaction with micelles containing different phospholipids. Micelles contained 20.8 μM various phospholipids (11.5%) and 167 μM 1,2-dimyristoyl-sn-glycero-3-phosphocholine (DMPC). (C) Plot of the steady-state Kyn fluorescence vs. the content of different negative phospholipids in the micelles. (D) A fast Kyn fluorescence increase within 100 ms in the interaction of Dap with cardiolipin (CL)-containing micelles. The inset shows the Kyn fluorescence change over 50 s; micelles contained DMPG, 1-palmitoyl-2-oleoyl-sn-glycero-3-phospho-L-serine (POPS), or CL at 20.8 μM. All the experiments in (A–D) were carried out in 20 mM HEPES (pH 7.57) containing 1.67 mM CaCl2; Dap was always added at last at 15 μM. The micelles were prepared from DMPC at 167 μM alone or together with another lipid at a concentration or content indicated in the plots.
-
Figure 2—source data 1
Kyn fluorescence change with time in the interaction of Dap with DMPC micelles containing a varied amount of DMPG.
- https://cdn.elifesciences.org/articles/93267/elife-93267-fig2-data1-v1.xlsx
-
Figure 2—source data 2
Kyn fluorescence change with time in the interaction of Dap with DMPC micelles containing a fixed amount of a phospholipid other than POPC or FPP.
- https://cdn.elifesciences.org/articles/93267/elife-93267-fig2-data2-v1.xlsx
-
Figure 2—source data 3
Kyn fluorescence change with time in the interaction of Dap with DMPC micelles containing a varied amount of CL.
- https://cdn.elifesciences.org/articles/93267/elife-93267-fig2-data3-v1.xlsx
-
Figure 2—source data 4
Kyn fluorescence change with time in the interaction of Dap with DMPC micelles containing a varied amount of POPS.
- https://cdn.elifesciences.org/articles/93267/elife-93267-fig2-data4-v1.xlsx
-
Figure 2—source data 5
Stopped-flow kinetics of Kyn fluorescence change in the interaction of Dap with DMPC micelles containing the same amount of DMPG, CL, or POPS.
- https://cdn.elifesciences.org/articles/93267/elife-93267-fig2-data5-v1.xlsx
Figure 2—figure supplement 1
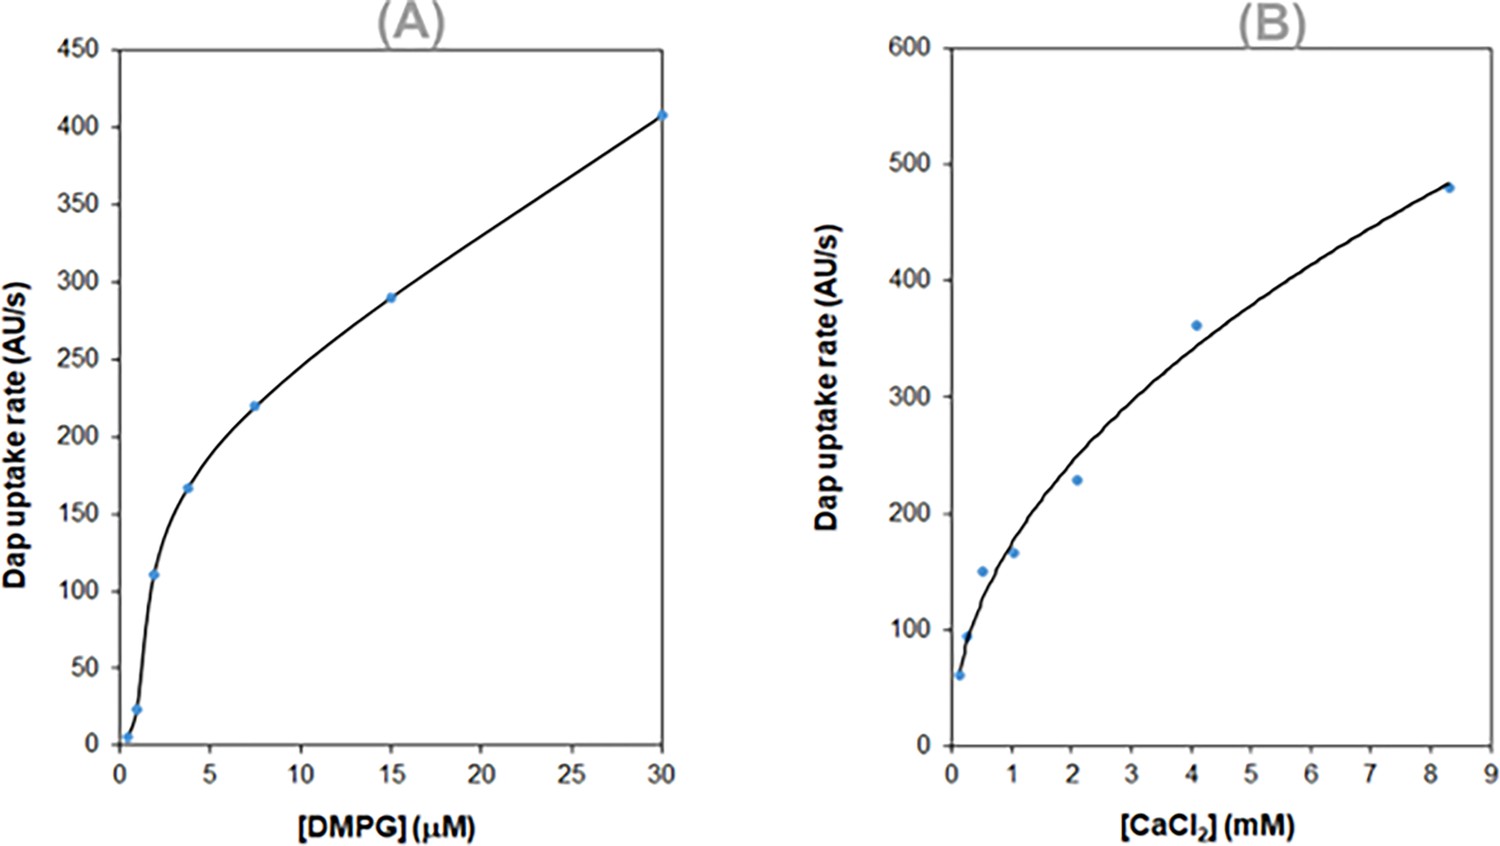
Dependence of the daptomycin (Dap) uptake on both 1,2-dimyristoyl-sn-glycero-3-phosphorylglycerol (DMPG) and calcium.
(A) Plot of the initial uptake rate vs. the DMPG content. Micelles contained 83.3 μM 1,2-dimyristoyl-sn-glycero-3-phosphocholine (DMPC) and DMPG at an increasing concentration; calcium concentration was 1.67 mM. (B) Plot of the initial Dap uptake rate vs. the calcium concentration. Micelles contained DMPC at 83.3 μM and DMPG at 10.8 μM. In both (A) and (B), Dap was added at 15 μM right before kinetic measurement.
-
Figure 2—figure supplement 1—source data 1
The initial rate of Kyn fluorescence change increases with the DMPG content in DMPC micelles interacting with Dap.
- https://cdn.elifesciences.org/articles/93267/elife-93267-fig2-figsupp1-data1-v1.xlsx
-
Figure 2—figure supplement 1—source data 2
The initial rate of Kyn fluorescence change increases with the calcium concentration in Dap interaction with DMPG-containing DMPC micelles.
- https://cdn.elifesciences.org/articles/93267/elife-93267-fig2-figsupp1-data2-v1.xlsx
Figure 2—figure supplement 2
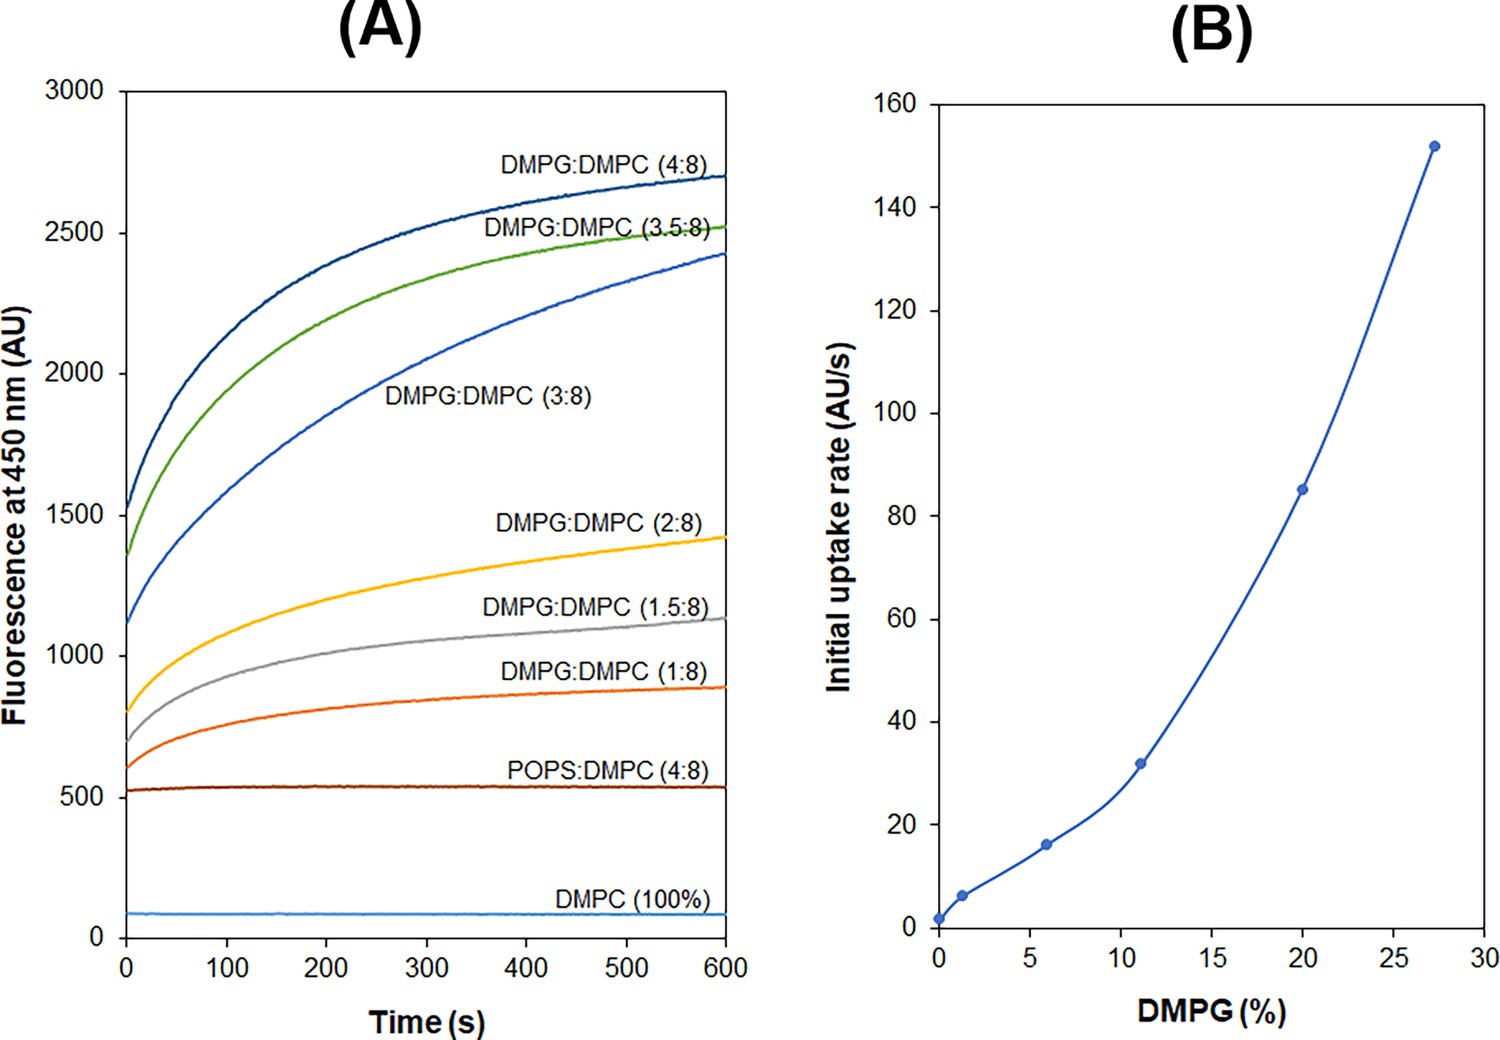
Enhancing effect of phosphatidyl glycerol (PG) on the daptomycin (Dap) uptake to vesicles.
(A) Dose-dependent enhancement of the Dap uptake by 1,2-dimyristoyl-sn-glycero-3-phosphorylglycerol (DMPG). (B) Increase of the initial rate of Dap uptake with the membrane content of DMPG. See the Experimental section for the preparation of vesicles. The uptake was measured kinetically in 20 mM HEPES (pH 7.57) using 15 μM Dap and 1.67 mM CaCl2.
-
Figure 2—figure supplement 2—source data 1
Kyn fluorescence change with time in Dap interaction with DMPC vesicles containing a varied amount of DMPG.
- https://cdn.elifesciences.org/articles/93267/elife-93267-fig2-figsupp2-data1-v1.xlsx
-
Figure 2—figure supplement 2—source data 2
The initial rate of Kyn fluorescence change increases with the DMPG content in Dap interaction with DMPC vesicles.
- https://cdn.elifesciences.org/articles/93267/elife-93267-fig2-figsupp2-data2-v1.xlsx
Figure 2—figure supplement 3
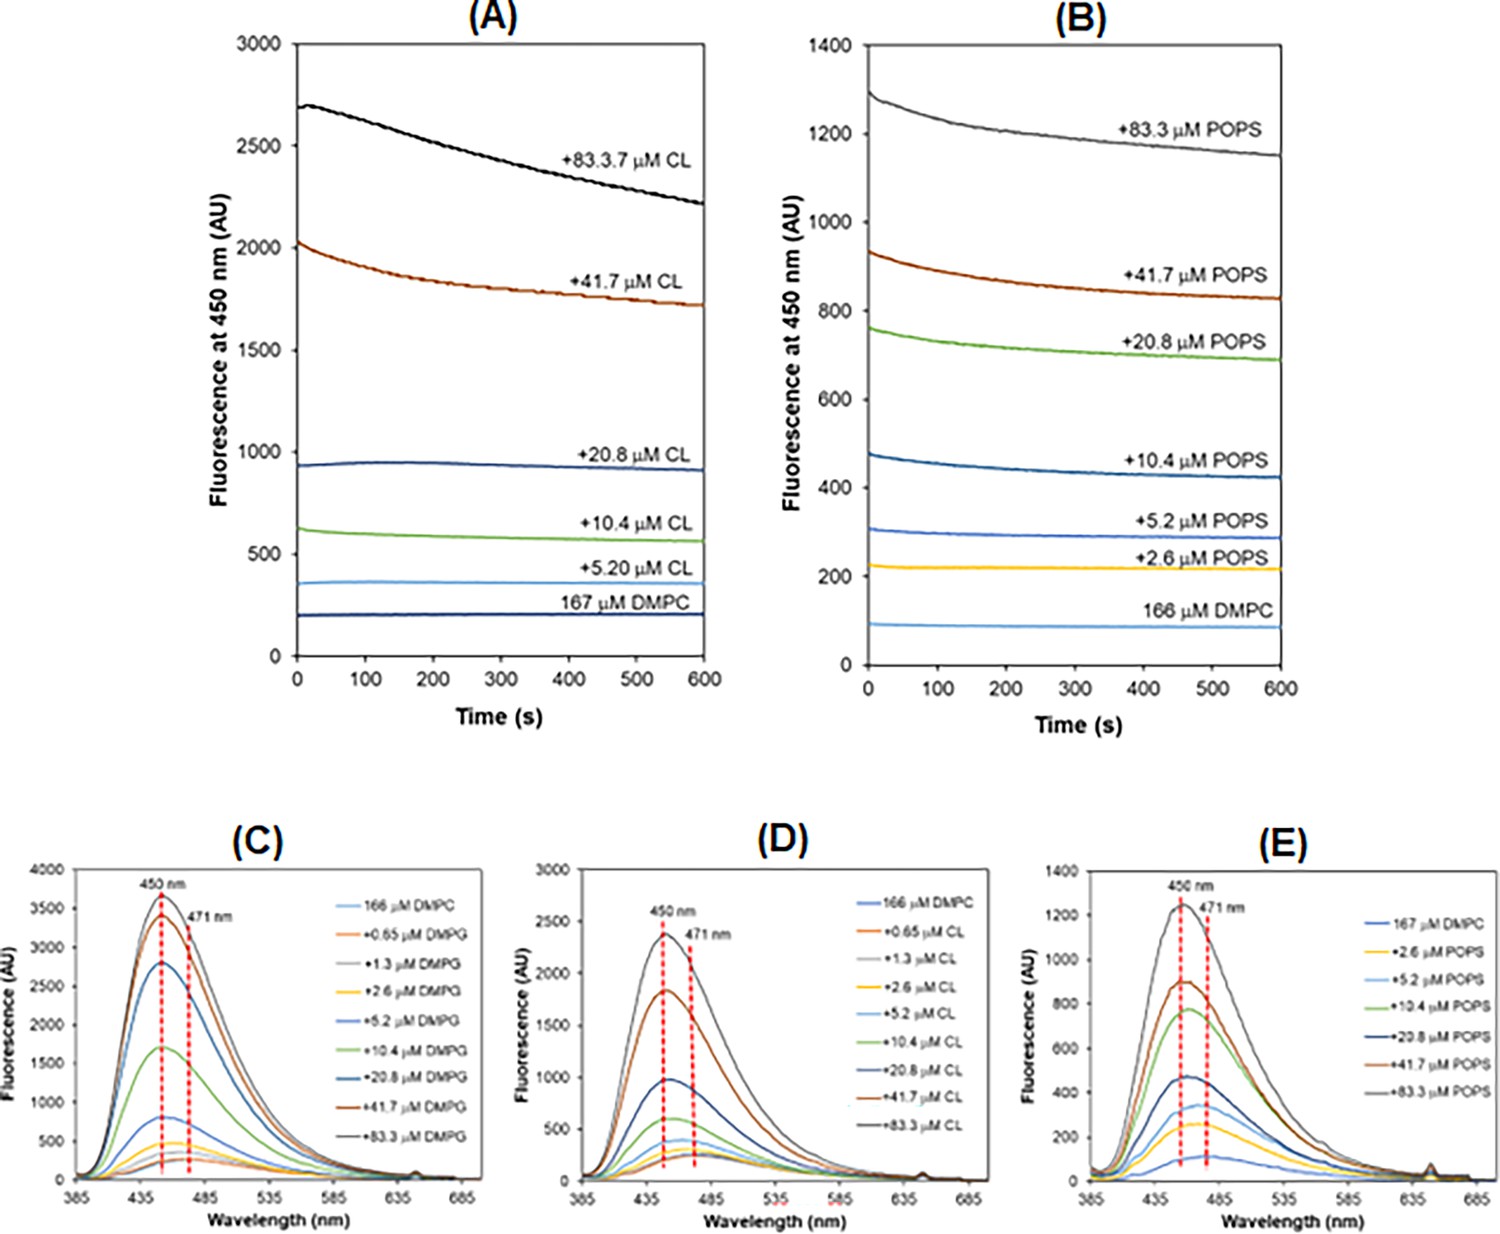
Fluorescence enhancement and blueshift caused by negative cardiolipin (CL) and phosphatidyserine (PS).
(A) Increased background fluorescence but no uptake of daptomycin (Dap) in micelles containing increasing content of CL. (B) Increased background fluorescence but no uptake of Dap in micelles containing increasing content of 1-palmitoyl-2-oleoyl-sn-glycero-3-phospho-L-serine (POPS). (C) Blueshift of the Dap fluorescence after uptake into the 1,2-dimyristoyl-sn-glycero-3-phosphorylglycerol (DMPG)-containing micelles. (D) Blueshift of the Dap fluorescence after mixing with CL-containing micelles. (E) Blueshift of Dap fluorescence after mixing with POPS-containing micelles. All the experiments were initiated by adding Dap (final concentration = 15 μM) to 20 mM HEPES (pH 7.57) containing 166 μM 1,2-dimyristoyl-sn-glycero-3-phosphocholine (DMPC), 1.67 mM CaCl2, and the negative phospholipids at a varied concentration. The emission spectra in (C, D, and E) were recorded after completing the kinetic monitoring at 450 nm.
-
Figure 2—figure supplement 3—source data 1
Kyn fluorescence change with time in Dap interaction with DMPC micelles containg a varied amount of CL.
- https://cdn.elifesciences.org/articles/93267/elife-93267-fig2-figsupp3-data1-v1.xlsx
-
Figure 2—figure supplement 3—source data 2
Kyn fluorescence change with time in Dap interaction with DMPC micelles containg a varied amount of POPS.
- https://cdn.elifesciences.org/articles/93267/elife-93267-fig2-figsupp3-data2-v1.xlsx
-
Figure 2—figure supplement 3—source data 3
Emission spectra of Kyn in the interaction of Dap with DMPC micelles containg a varied amount of DMPG.
- https://cdn.elifesciences.org/articles/93267/elife-93267-fig2-figsupp3-data3-v1.xlsx
-
Figure 2—figure supplement 3—source data 4
Emission spectra of Kyn in the interaction of Dap with DMPC micelles containg a varied amount of CL.
- https://cdn.elifesciences.org/articles/93267/elife-93267-fig2-figsupp3-data4-v1.xlsx
-
Figure 2—figure supplement 3—source data 5
Emission spectra of Kyn in the interaction of Dap with DMPC micelles containg a varied amount of POPS.
- https://cdn.elifesciences.org/articles/93267/elife-93267-fig2-figsupp3-data5-v1.xlsx
Figure 3 with 2 supplements
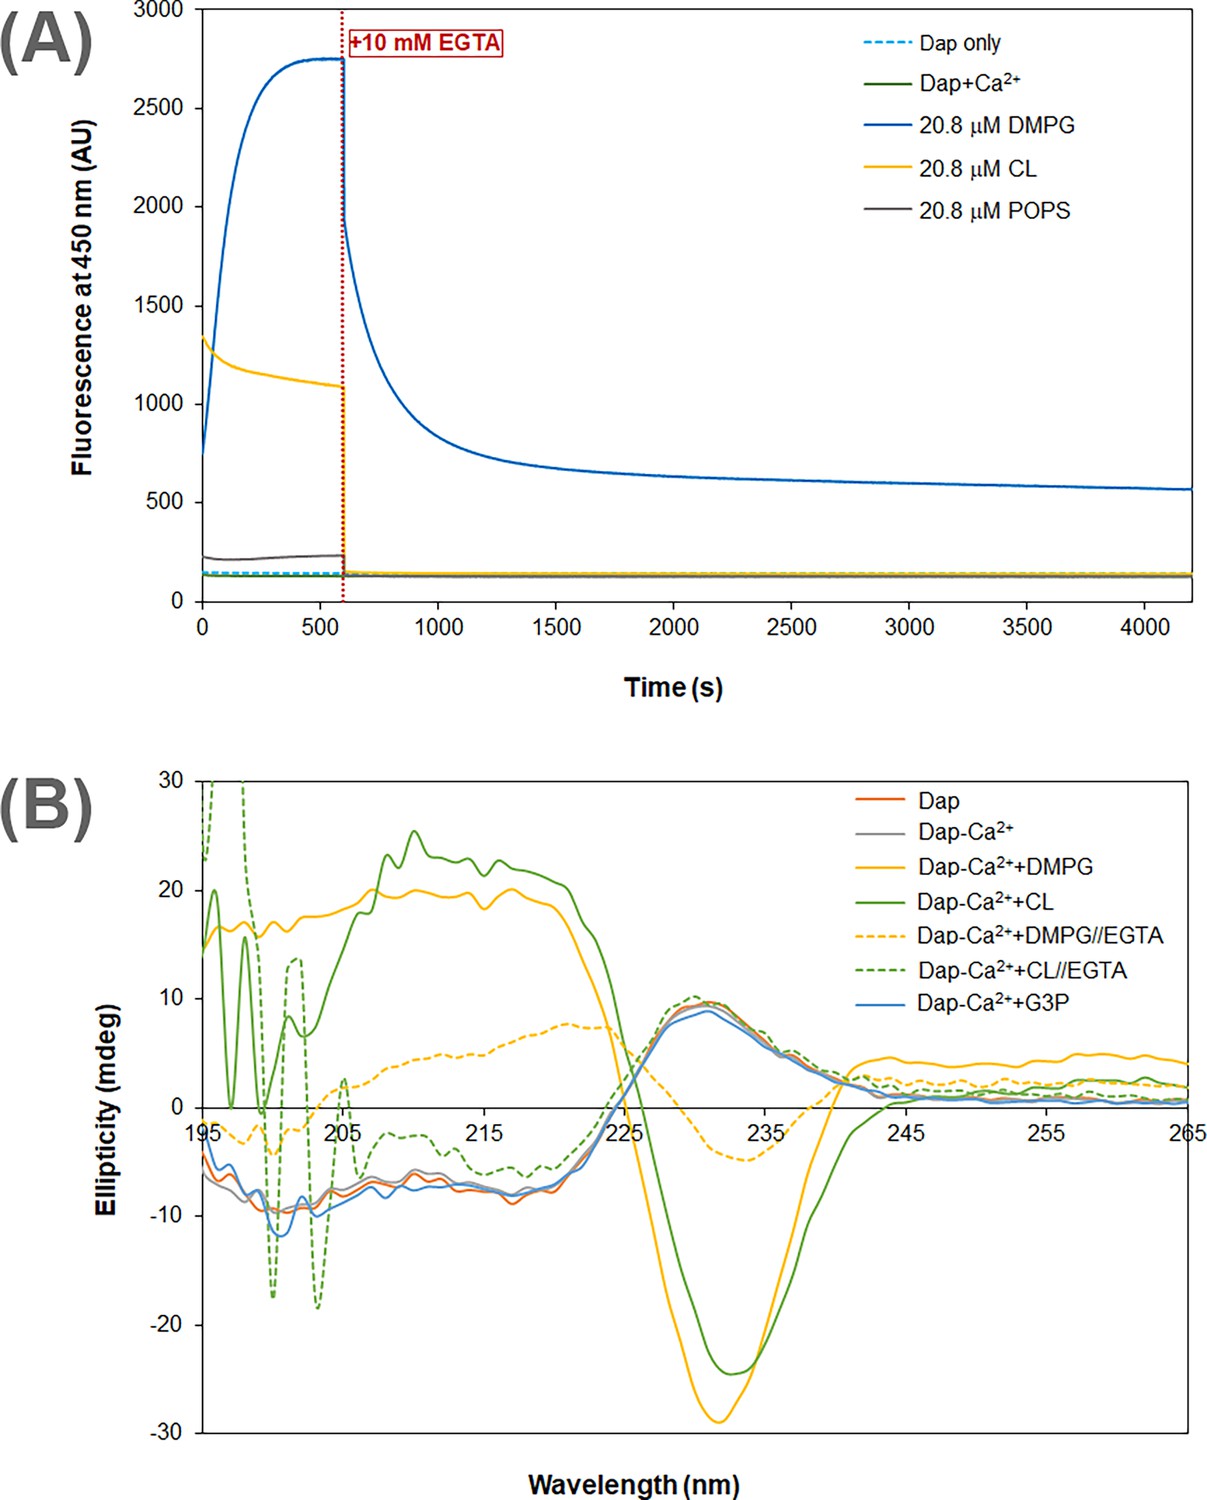
Calcium dependence of the daptomycin (Dap) structure and fluorescence in membrane.
(A) Calcium sequestration decreases the Dap fluorescence in a way dependent on the phospholipid composition. The kinetic fluorescence measurement was performed under the same conditions as in Figure 1B. The red dotted line denoted the time point when 10 mM EGTA was added. The controls contained Dap at 15 μM Dap in the same buffer with or without calcium. (B) Circular dichroism spectra of Dap in different membrane environments. The buffer was 20 mM Tris·HCl, pH 7.57; Dap was 180 μM and Ca(CH3COO)2 was 1.0 mM; spectra were recorded 30 min after mixing with micelles contained pure 1,2-dimyristoyl-sn-glycero-3-phosphorylglycerol (DMPG) or cardiolipin (CL) at 720 μM to maximize the amount of bound Dap; in Ca2+ sequestration experiments, spectra were recorded 30 min after adding 10.0 mM EGTA. The putative phosphatidylglycerol (PG) headgroup, sn-glycerol 3-phosphate (G3P), was 20 mM in an attempt to detect its potential interaction with Dap.
-
Figure 3—source data 1
Kyn fluorescence change with time before and after adding 10 mM EGTA to the system for the interaction of Dap with DMPC micelles containing the same amount of DMPG, CL, or POPS.
- https://cdn.elifesciences.org/articles/93267/elife-93267-fig3-data1-v1.xlsx
-
Figure 3—source data 2
Circular dichroism spectra of Dap in the interaction with DMPC micelles under various conditions.
- https://cdn.elifesciences.org/articles/93267/elife-93267-fig3-data2-v1.xlsx
Figure 3—figure supplement 1
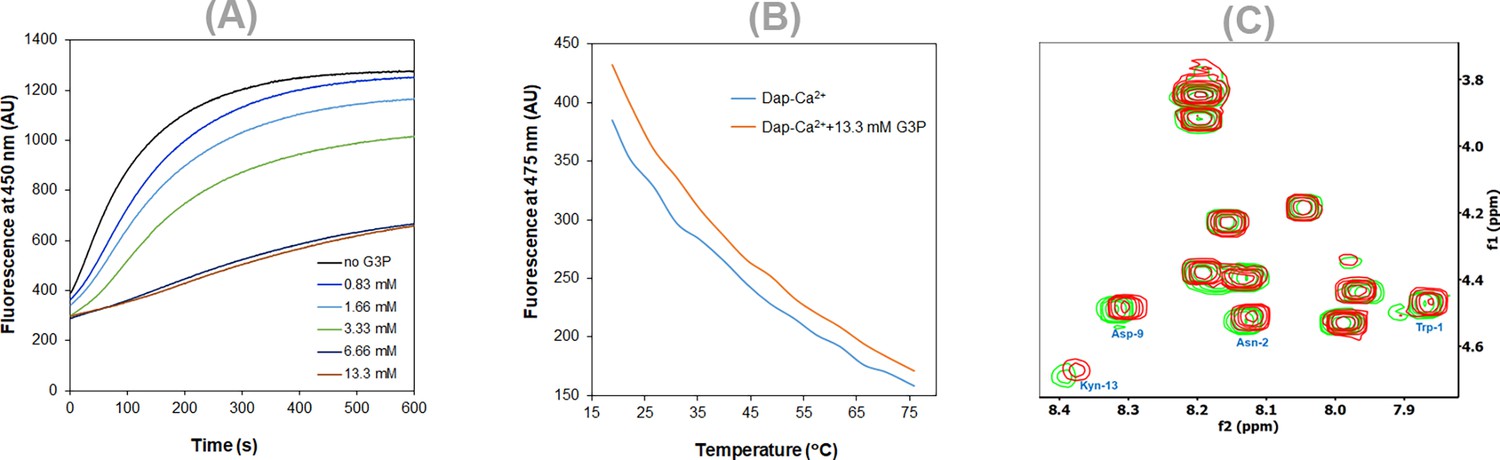
Interaction of daptomycin (Dap)-Ca2+ with glycerol-3-phosphate (G3P).
(A) G3P inhibition of the Dap uptake to 1,2-dimyristoyl-sn-glycero-3-phosphorylglycerol (DMPG)-containing micelles. Dap was 15 μM, and the micelles contained 167 μM 1,2-dimyristoyl-sn-glycero-3-phosphocholine (DMPC), 20.8 μM DMPG in 20 mM HEPES buffer (pH 7.57) supplemented with 1.67 CaCl2, and G3P at a varied concentration. (B) Thermal shift of the Dap fluorescence caused by G3P. The Dap (15 μM) solution contained 1.67 CaCl2 with or without G3P (13.3 mM) in 20 mM HEPES (pH 7.57). (C) Slight changes of the Dap cross-peaks in the fingerprint region caused by G3P. The COSY spectra were recorded for 1 mM Dap in 20 mM HEPES buffer (pH/D 5.40) containing 10% D2O, 1.67 CaCl2 with (red) or without (green) 20 mM G3P.
-
Figure 3—figure supplement 1—source data 1
Kyn fluorescence change with time in the interaction of Dap with DMPG-containing micelles in the presence of sn-glycerol-3-phosphate (G3P) at a varied concentration.
- https://cdn.elifesciences.org/articles/93267/elife-93267-fig3-figsupp1-data1-v1.xlsx
-
Figure 3—figure supplement 1—source data 2
Kyn fluorescence change with temperature in the interaction of Dap with DMPG-containing micelles in the presence and absence of sn-glycerol-3-phosphate (G3P).
- https://cdn.elifesciences.org/articles/93267/elife-93267-fig3-figsupp1-data2-v1.xlsx
Figure 3—figure supplement 2
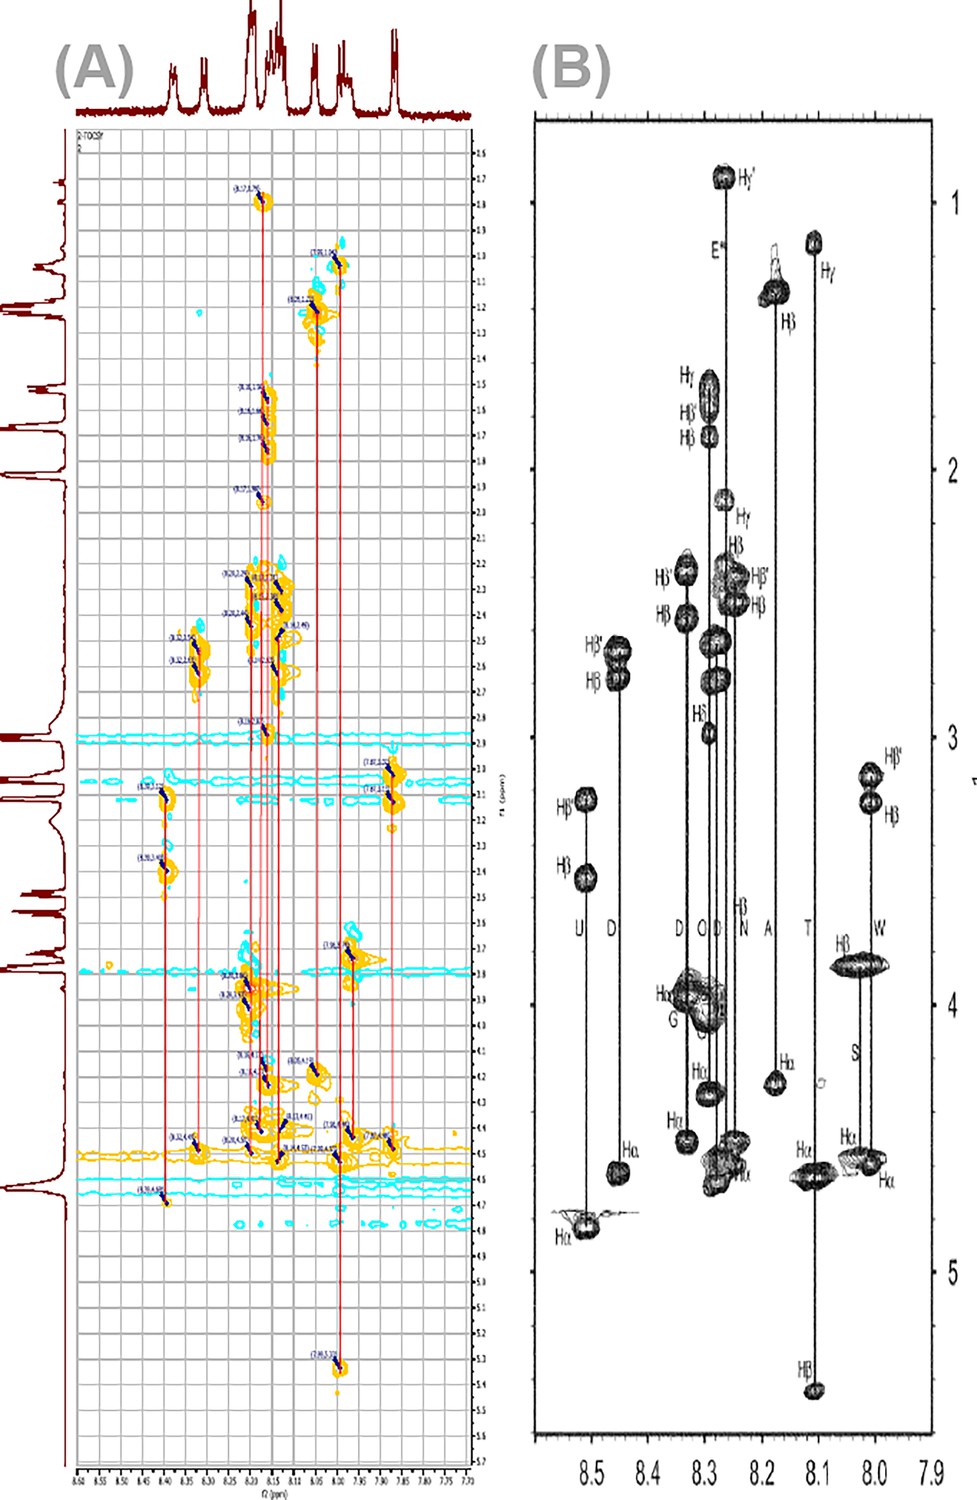
Highly similar NαH-Hα-Hβ-Hγ spin systems in daptomycin (Dap) at pH 5.0 and pH 5.40.
(A) The NαH-Hα-Hβ-Hγ cross-peaks in the TOCSY for Dap-Ca2+ taken in the current work at pH 5.4. (B) The corresponding NαH-Hα-Hβ-Hγ cross-peaks in TOCSY of Dap-Ca2+ taken previously at pH 5.0 (Zhang et al., 2013). This high level of similarity allows the assignment of the NαH-Hα cross-peaks in the fingerprint regions, as shown in Supplementary file 1, using the assignments of the previous work.
Figure 4 with 2 supplements
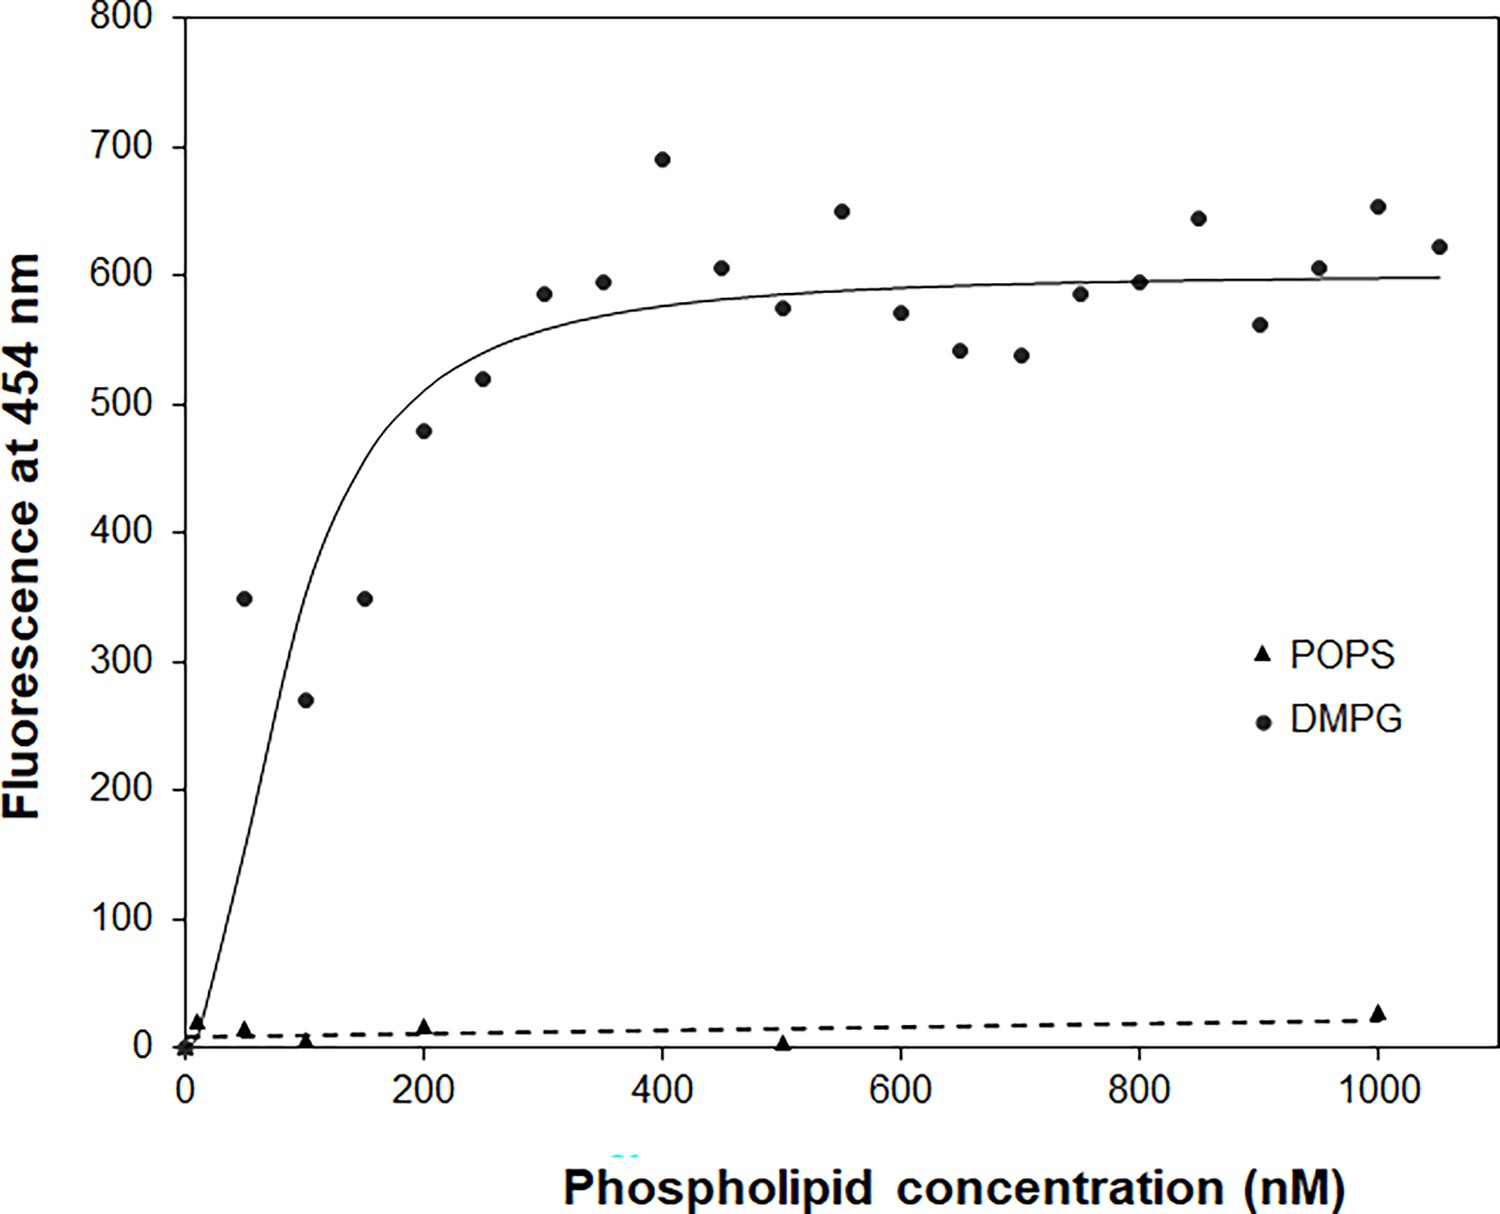
The binding affinity of daptomycin (Dap) for 1,2-dimyristoyl-sn-glycero-3-phosphorylglycerol (DMPG) by titration.
The titration with DMPG was performed in 20 mM HEPES buffer (pH 7.57) containing 15 nM Dap and 1.67 mM CaCl2. The solid line is the fitting curve using the equation F=Fmax × [DMPG]2/(KD + [DMPG]2), where F=fluorescence at 454 nm, which is derived from a binding model in which a fluorescent {Dap⋅2DMPG} complex is dissociated into nonfluorescent Dap and two DMPG molecules under the condition [DMPG] >> [Dap]. The dashed line is the linear trend line for the control titration of 1.5 μM Dap with 1-palmitoyl-2-oleoyl-sn-glycero-3-phospho-L-serine (POPS) in the same buffer containing 1.67 mM CaCl2.
-
Figure 4—source data 1
Kyn fluorescence change in titration with sub-micromolar DMPG.
- https://cdn.elifesciences.org/articles/93267/elife-93267-fig4-data1-v1.xlsx
Figure 4—figure supplement 1
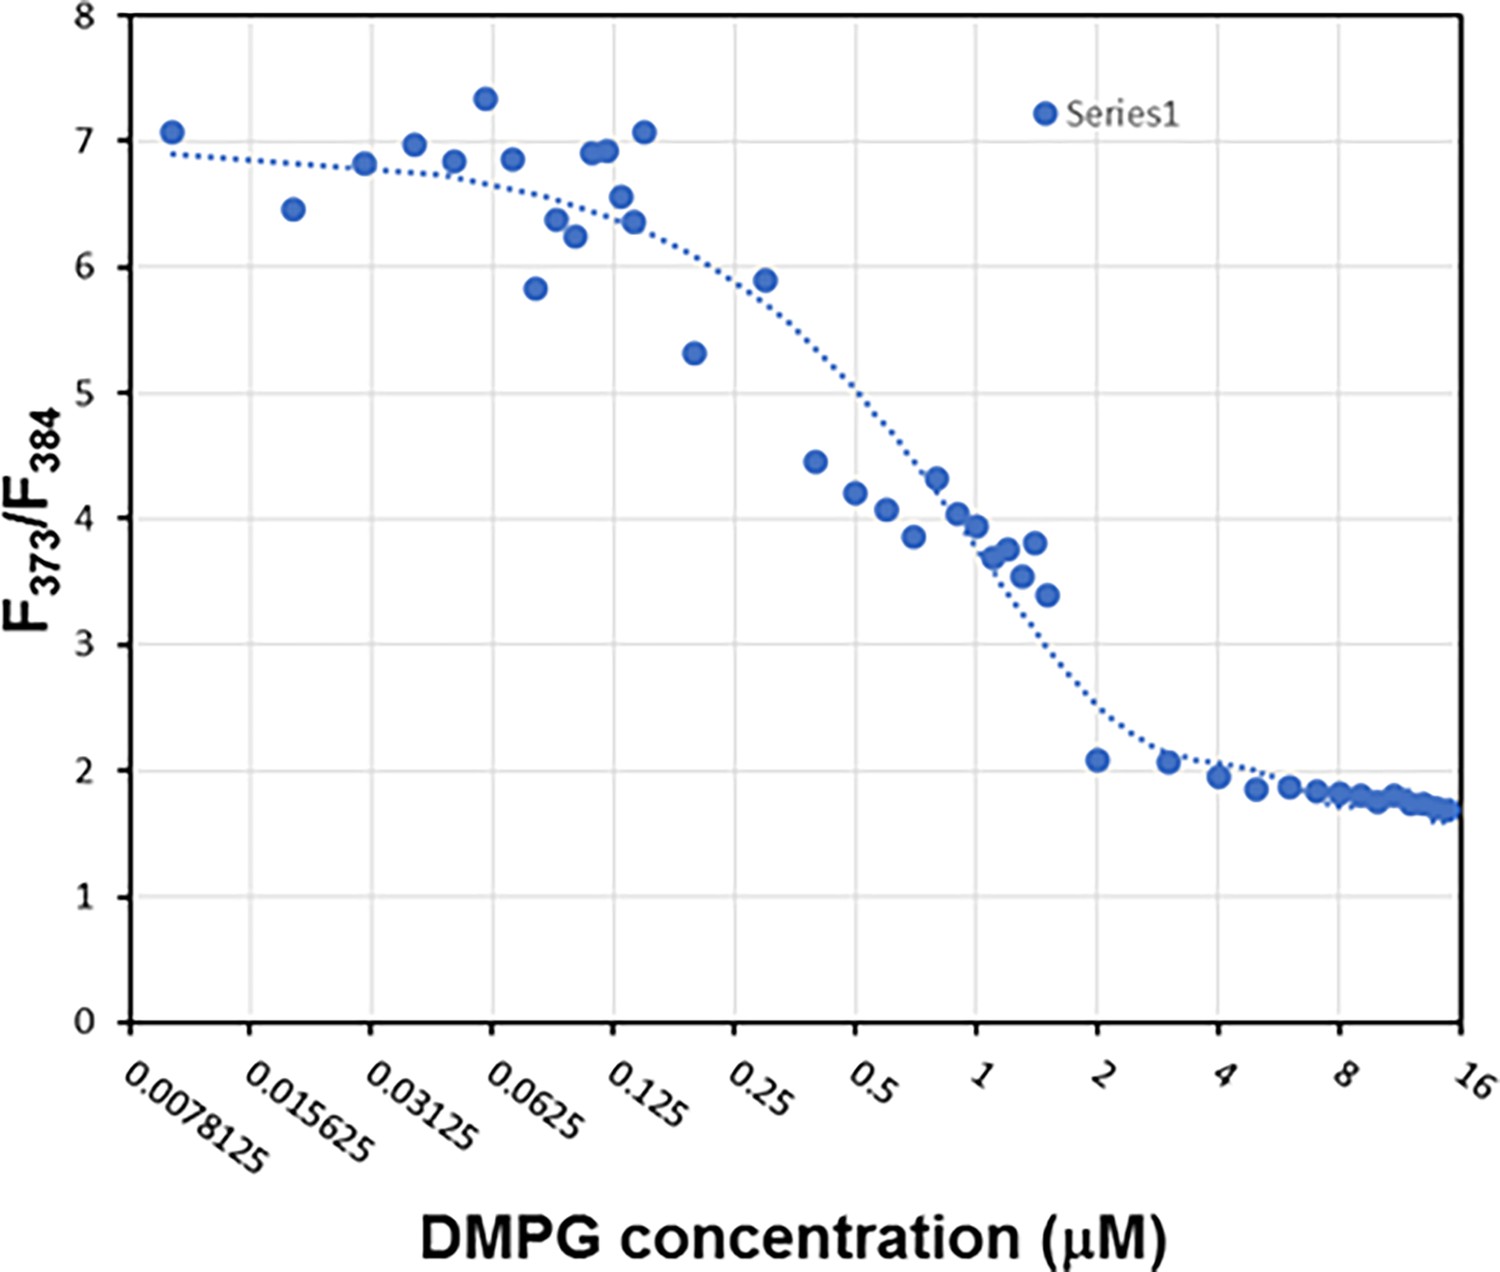
Determination of the critical micelle concentration (CMC) of 1,2-dimyristoyl-sn-glycero-3-phosphorylglycerol (DMPG).
The CMC is determined to be ~2.0 μM according to the relative pyrene fluorescence intensity at 373 and 384 nm using a reported method (Davlieva et al., 2013). The DMPG solution is thus a homogeneous solution in the concentration range from 0 to 1.0 μM.
-
Figure 4—figure supplement 1—source data 1
The change of relative pyrene fluorescence intensity at 373 and 384 nm in the solution of DMPG at an increasing concentration from 7.8 nanomolar to 16 micromolar.
- https://cdn.elifesciences.org/articles/93267/elife-93267-fig4-figsupp1-data1-v1.xlsx
Figure 4—figure supplement 2
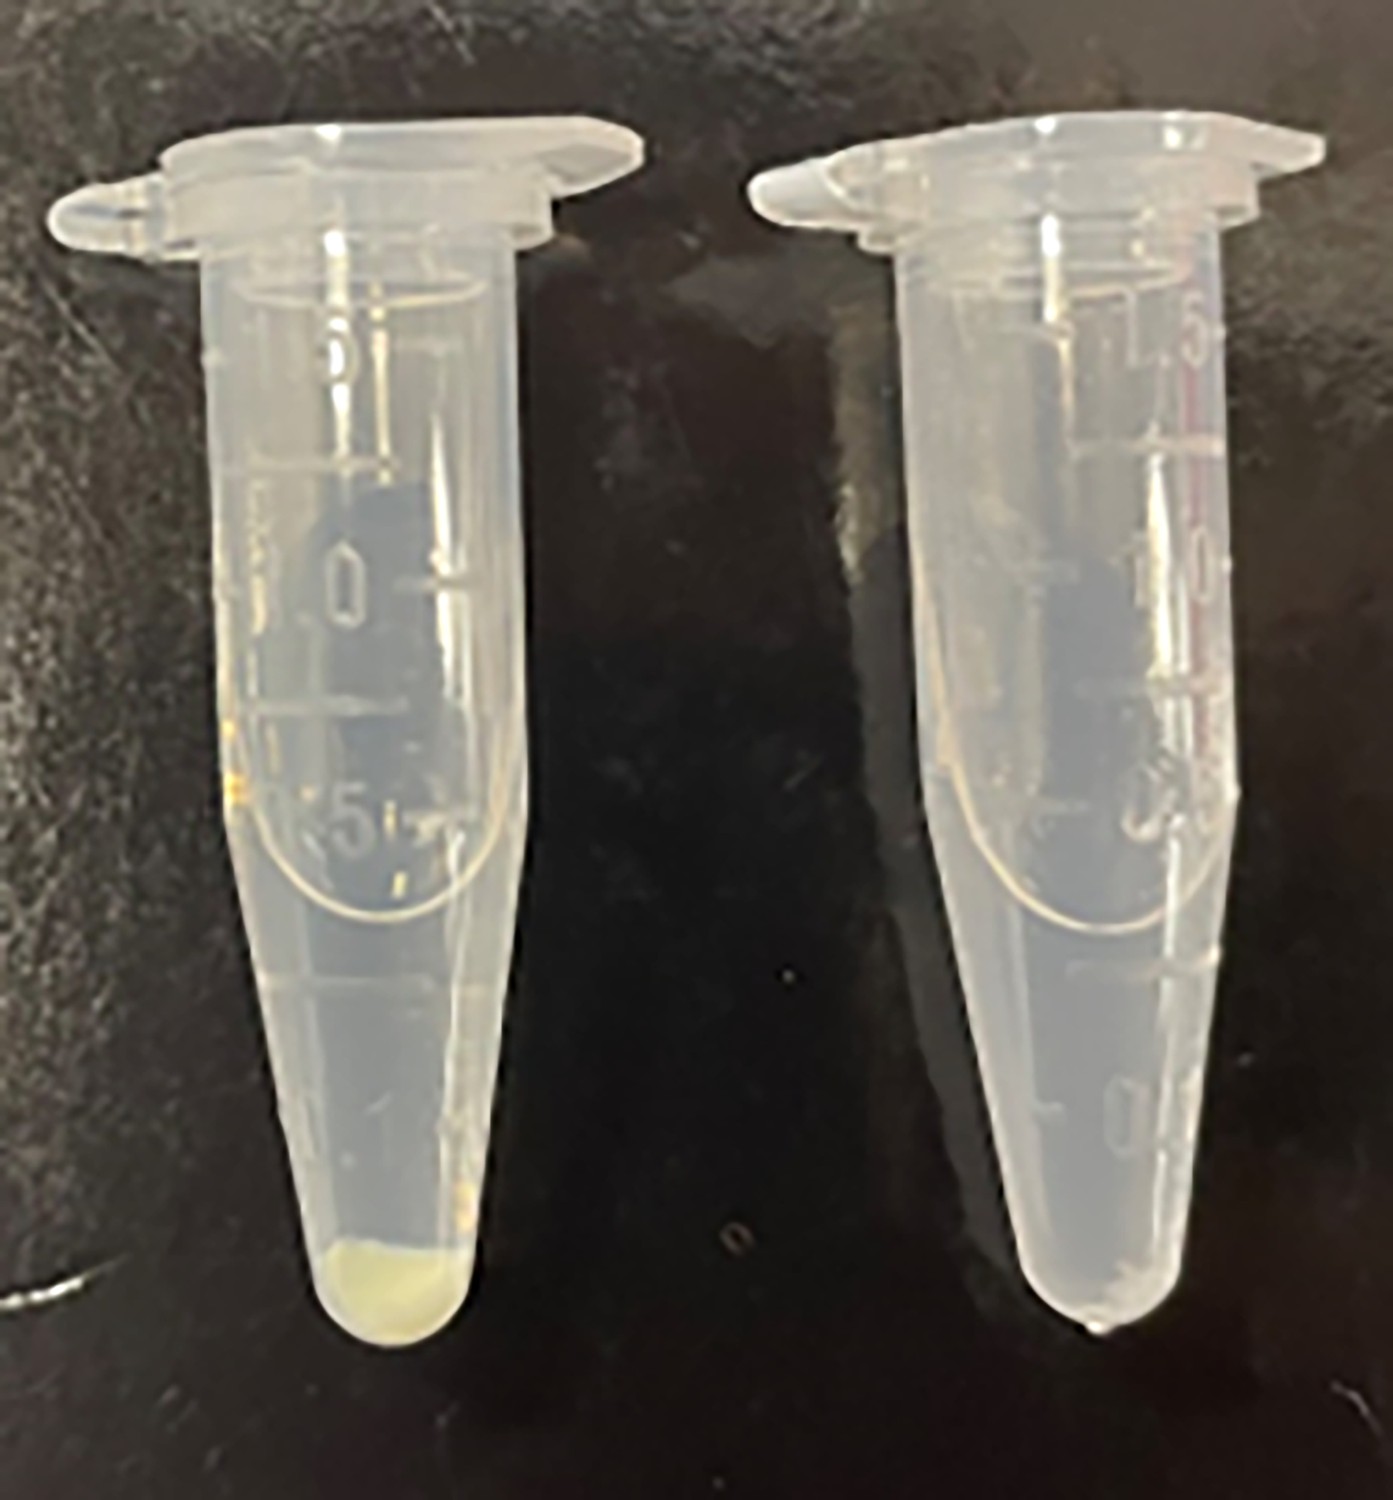
Formation of the daptomycin (Dap)-2PG-Ca2+ complex.
Left tube: mixing 1 mM Dap, 2 mM 1,2-dimyristoyl-sn-glycero-3-phosphorylglycerol (DMPG), and 1 mM Ca2+ to form the precipitate after centrifugation; right tube: control sample by mixing 2 mM DMPG and 1 mM Ca2+.
Figure 5
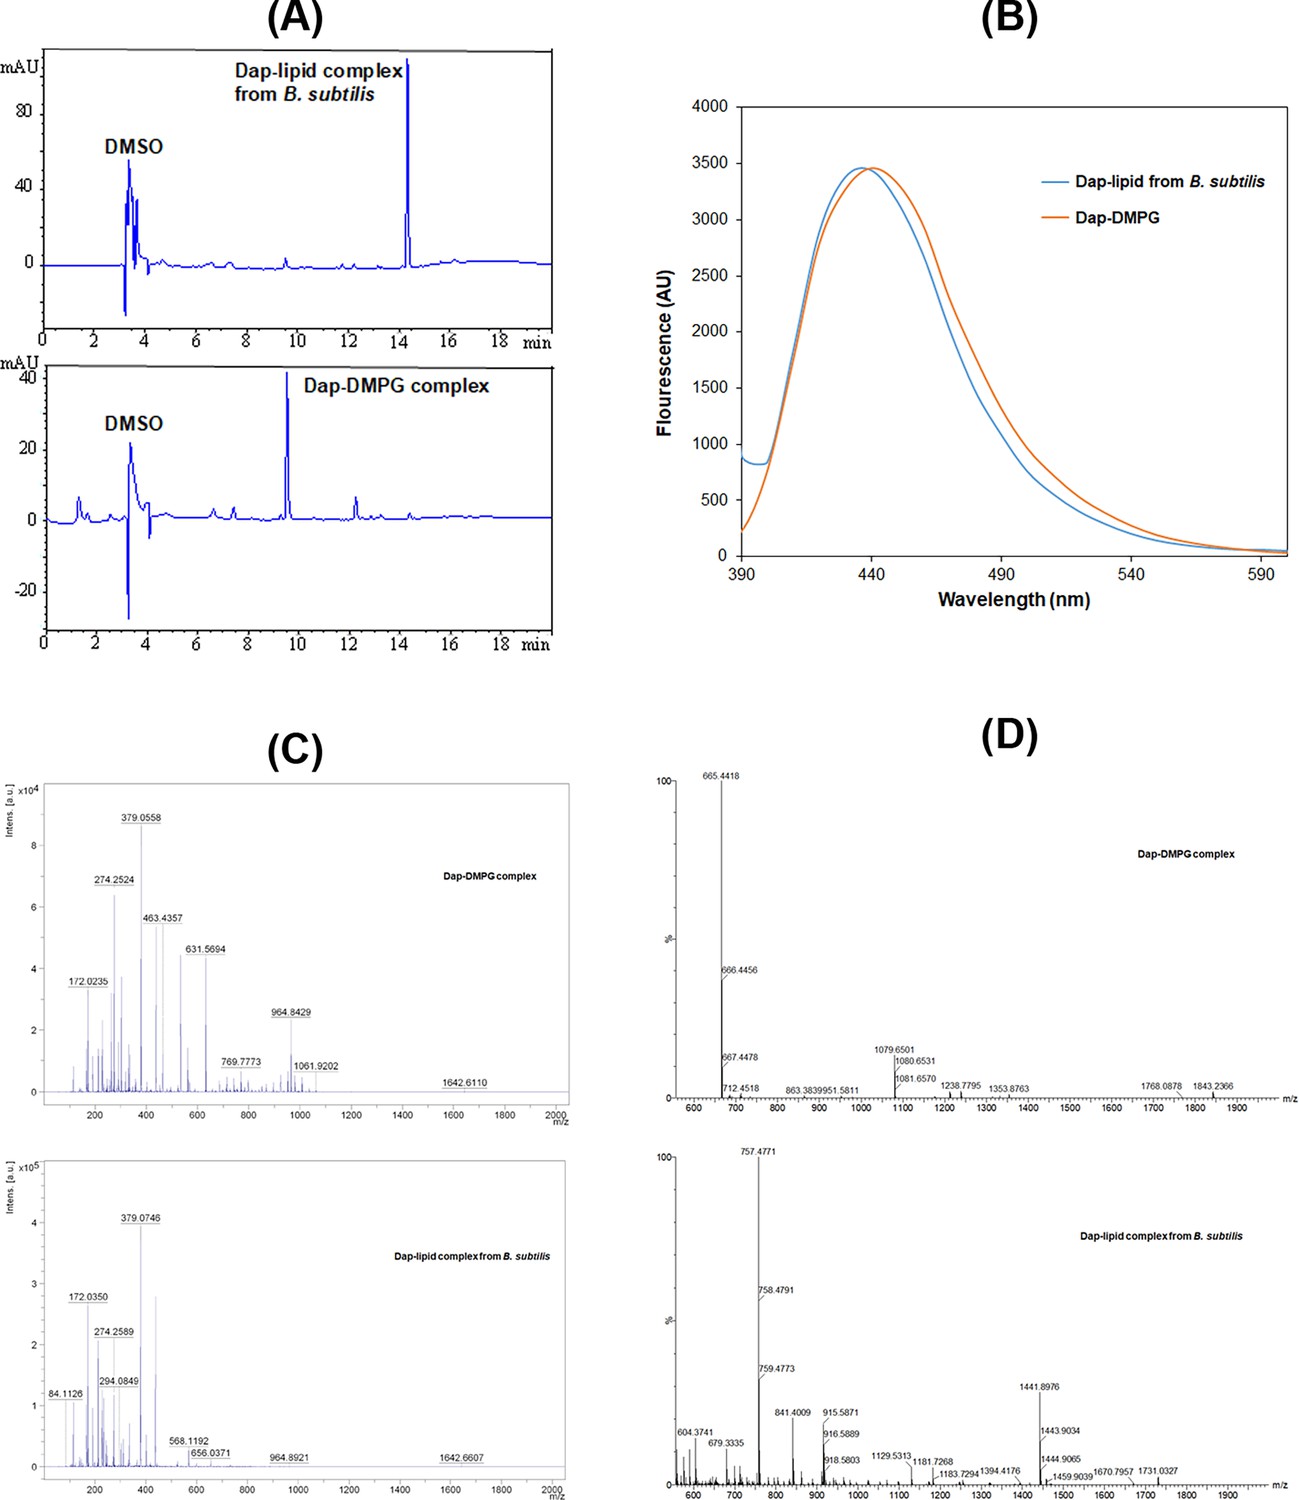
Stable daptomycin (Dap)-phosphatidylglycerol (PG) complexes formed in vitro and in B. subtilis.
(A) Reverse-phase high-performance liquid chromatography (HPLC) chromatogram of the complexes. Samples were dissolved in 10% dimethyl sulfoxide (DMSO) and 90% water and filtered before injection into a Phenomenex Luna 5 μm C18 column (150×4.6 mm2). The complexes were eluted by water containing 0.1% trifluoroacetic acid and a linear gradient of acetonitrile from 5% to 95% over 20 min and detected by ultraviolet absorbance at 254 nm. (B) Fluorescence spectra of the two complexes with excitation at 365 nm. The complexes were dissolved in DMSO, and the fluorescence of the Dap-1,2-dimyristoyl-sn-glycero-3-phosphorylglycerol (DMPG) complex was scaled for easy comparison. (C) Comparative positive-ion MALDI-ToF mass spectrometry of the two complexes. All the peaks with m/z<500 were from the matrix after comparison with a control. (D) Comparative negative-ion high-resolution electron spray ionization mass spectrometry (ESIMS) analysis of the two complexes.
-
Figure 5—source data 1
The emission spectra of Dap in its lipid complex prepared in vitro or isolated from Bacillus subtilis.
- https://cdn.elifesciences.org/articles/93267/elife-93267-fig5-data1-v1.xlsx
Figure 6
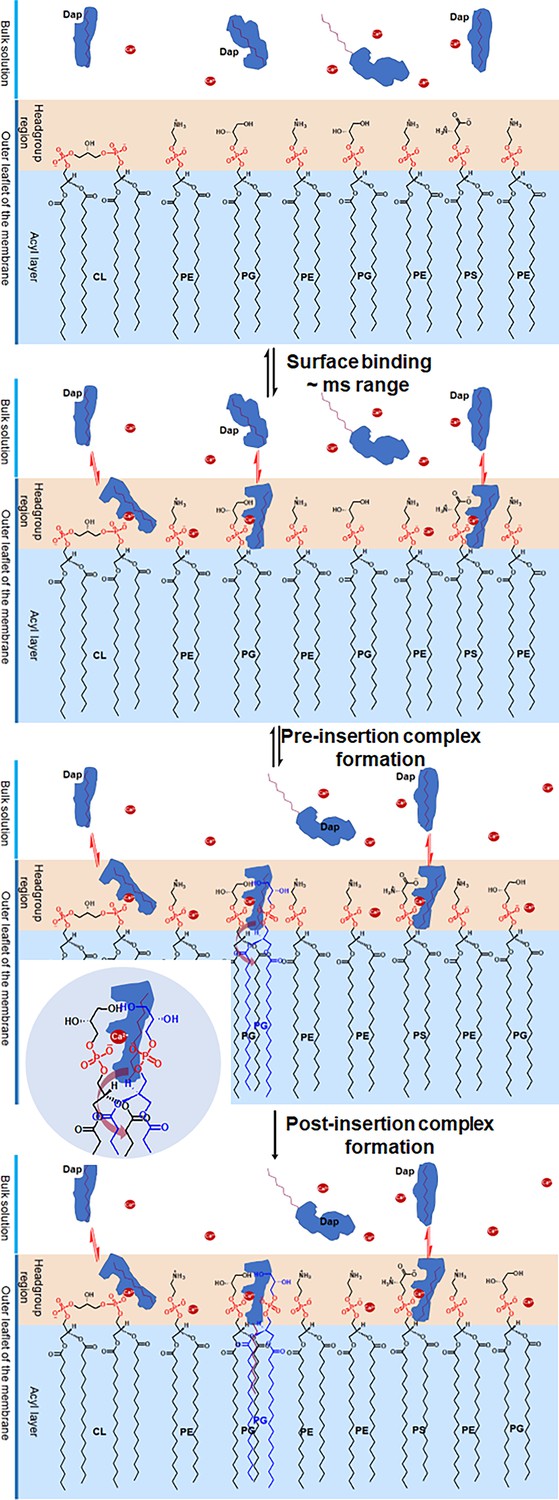
Proposed mechanism for the two-phased uptake of daptomycin (Dap) into bacterial membrane.
In the first phase, Dap reversibly binds to negative phospholipids with a hidden tail in the headgroup region, where it combines with two phosphatidylglycerol (PG) molecules to form a pre-insertion complex. In the second phase, the hidden tail unfolds and irreversibly inserts into the membrane. The inset shows the headgroup of the pre-insertion complex with the broad arrow, showing the direction for the unfolding of the hidden tail. The red dots denote Ca2+.
Additional files
-
Supplementary file 1
Assignment of the COSY signals of daptomycin (Dap) in the fingerprint region.
- https://cdn.elifesciences.org/articles/93267/elife-93267-supp1-v1.docx
-
MDAR checklist
- https://cdn.elifesciences.org/articles/93267/elife-93267-mdarchecklist1-v1.pdf
Download links
A two-part list of links to download the article, or parts of the article, in various formats.
Downloads (link to download the article as PDF)
Open citations (links to open the citations from this article in various online reference manager services)
Cite this article (links to download the citations from this article in formats compatible with various reference manager tools)
Daptomycin forms a stable complex with phosphatidylglycerol for selective uptake to bacterial membrane
eLife 13:RP93267.
https://doi.org/10.7554/eLife.93267.3


