Integrative study of skeletal muscle mitochondrial dysfunction in a murine pancreatic cancer-induced cachexia model
- Aix Marseille Univ, CNRS, INSERM, Institut Paoli-Calmettes, CRCM, France
- Nutrition And Cancer Research Network (NACRe Network), France
- Aix Marseille Univ, CNRS, IBDM, France
- Aix Marseille Univ, CNRS, CRMBM, France
Figures
Figure 1
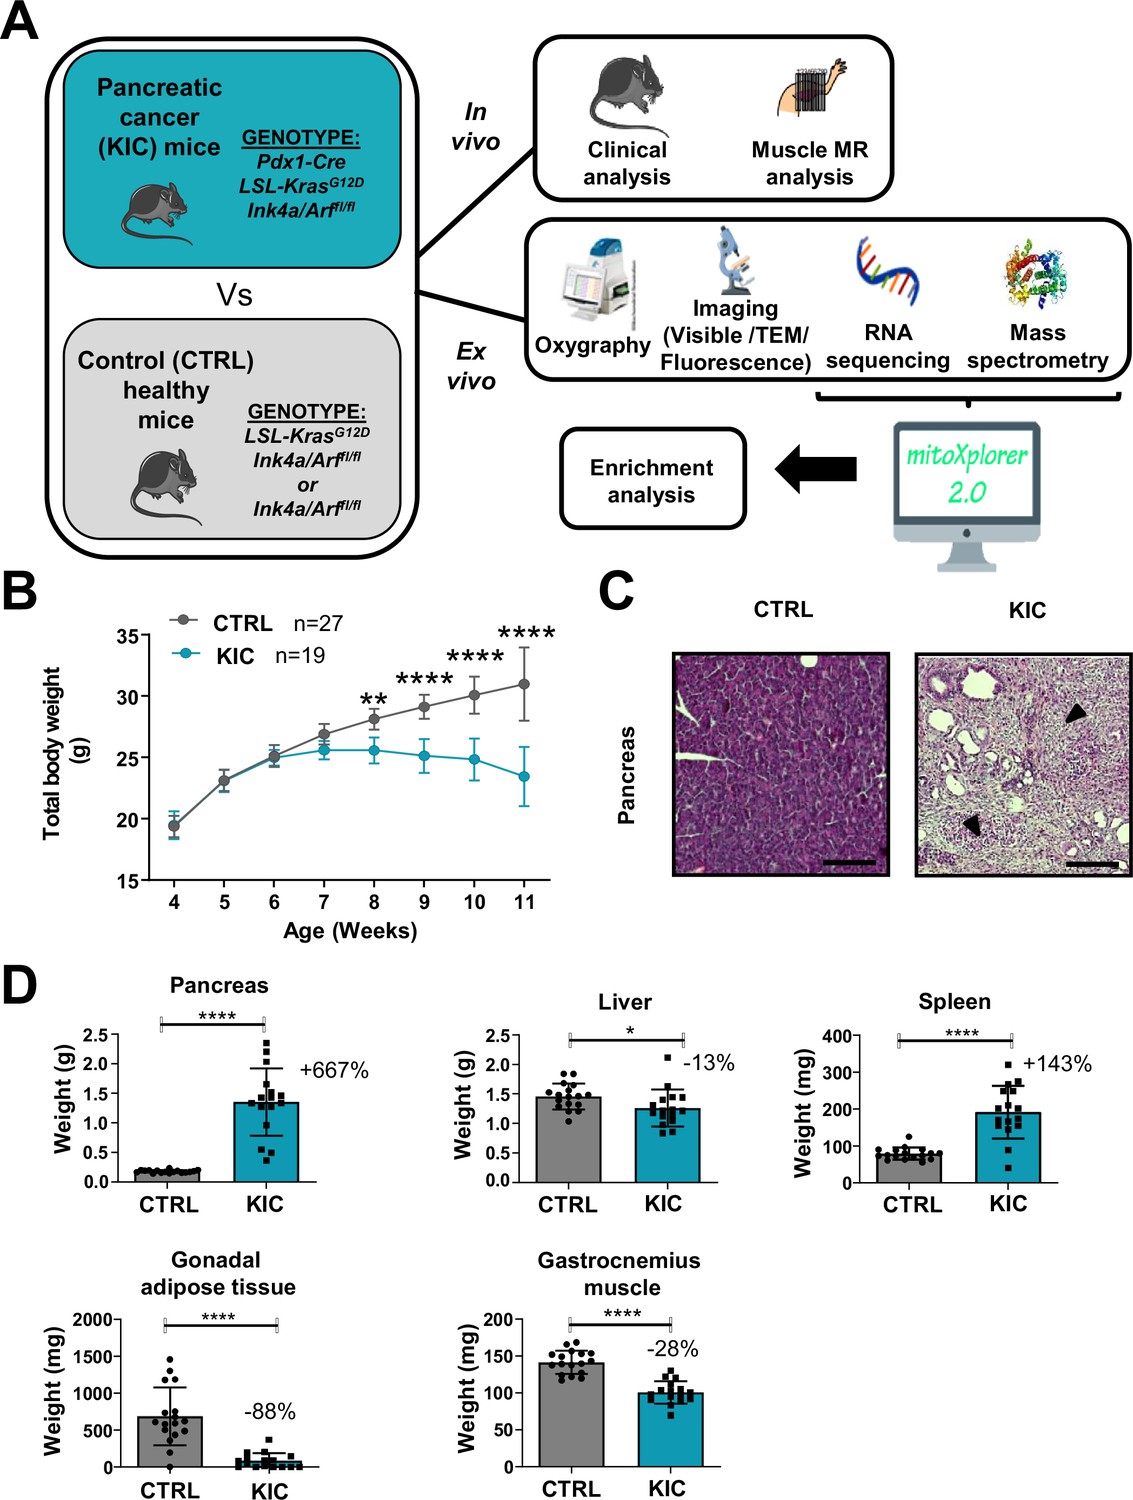
Spontaneous pancreatic ductal adenocarcinoma (PDAC) KIC mouse model shows an obvious cachexia phenotype with adipose tissue and muscle loss associated with cancer.
(A) Schematic representation of the overall study. (B) Total body weight analysis during disease progression (from 4 to 11 weeks of age) in KIC and CTRL male mice. Data are mean ± 95% of CI and n represents the total number of mice analyzed in each group. Two-way ANOVA Bonferroni test; n=15 or more for control and KIC mice per time-point; **p<0.01, ****p<0.0001. (C) Representative hematoxylin, phloxine, and saffron (HPS) staining of pancreas from healthy control versus cancer KIC mice. Dark arrows point to stromal fibrotic areas relative to PDAC. Scale bar = 500 µm. (D) Total tissue weights of pancreas, liver, spleen, gonadal adipose tissue, and gastrocnemius muscle of healthy control mice versus end-stage (9–11 weeks) cancer KIC mice. n=17 control and n=16 KIC. Data are mean ± SD. For the gastrocnemius muscle, the weight mean of the two muscles of each individual was used to calculate the mean. Unpaired two-tailed Mann-Whitney t-tests; *p<0.05, ****p<0.0001, and n represents the number of mice that were analyzed.
Figure 2 with 1 supplement
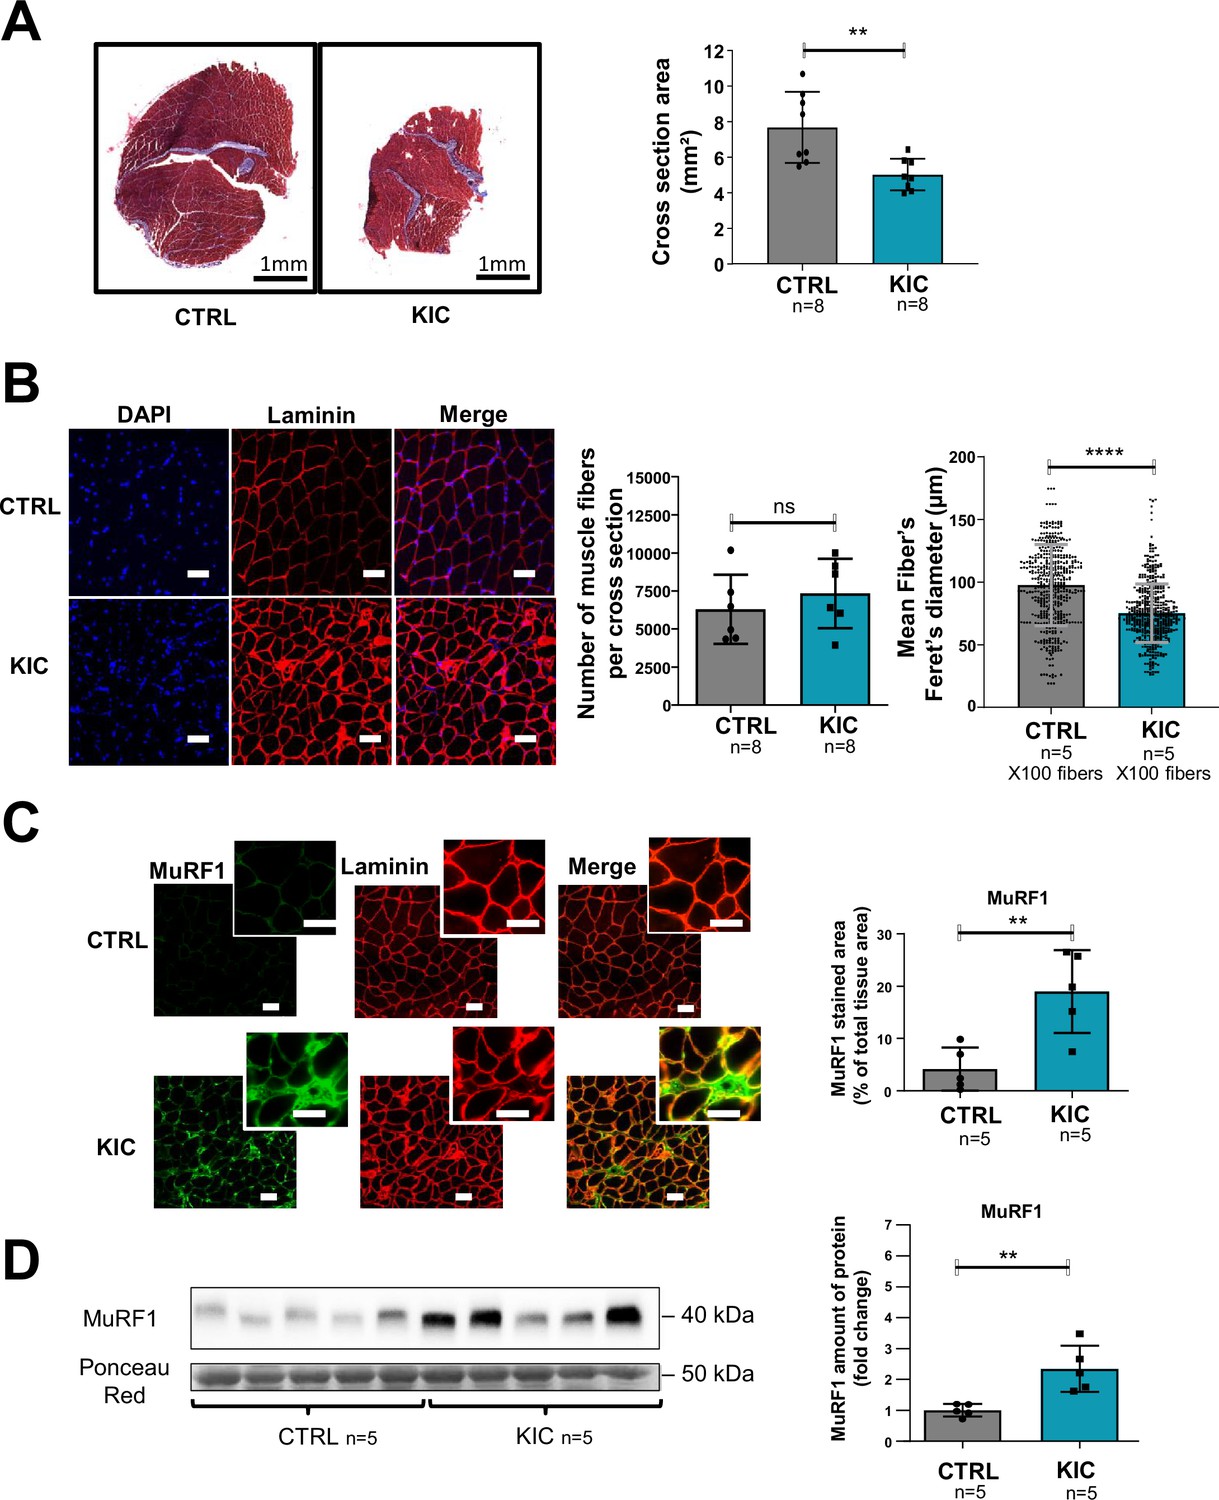
Pancreatic ductal adenocarcinoma (PDAC) mice show muscle atrophy associated with fiber’s size decrease and activation of the proteasome pathway.
(A) (Left) Representative images of transversal sections of gastrocnemius muscle from cancer KIC male mice (9- to 11-week-old bearing a tumor) and age-matched healthy control, following Masson’s trichrome staining. Scale bars, 1 mm. (Right) Diagrams of cross-sectional areas of gastrocnemius muscle from healthy control mice and cancer KIC mice (n=8/group). Data are mean ± SD. Unpaired two-tailed Mann-Whitney t-tests; **p<0.01, and n represents the number of mice that were analyzed. (B) (Left) Representative immunostaining of gastrocnemius muscle cross sections from control and KIC mice stained with DAPI (blue; nuclei), and anti-laminin antibody (red) to evaluate muscle fiber’s size. Scale bars, 40 µm. (Right) Number of muscle fibers counted in gastrocnemius cross sections from control and KIC mice, and mean fiber’s (100) minimal Feret’s diameter in gastrocnemius muscle from control and KIC mice. Data are mean ± SD. Unpaired two-tailed Mann-Whitney t-tests; ns = non-significant, ****p<0.0001, and n represents the number of mice that were analyzed. (C) (Left) Representative immunostaining of transverse sections of gastrocnemius muscle from control and KIC male mice stained for anti-MuRF1 (green) to evaluate muscle atrophy, anti-laminin (red) to evaluate muscle fibers, and merged images. Scale bars, 40 µm. (Right) MuRF1 immunofluorescent staining quantification in transversal sections of gastrocnemius muscle from control and KIC mice. Data are mean ± SEM. Unpaired one-tailed Mann-Whitney t-tests; **p<0.01 and n represents the number of mice that were analyzed. (D) (Left) Representative immunoblot for MuRF1 in gastrocnemius muscle from CTRL and KIC mice (n=5/group). The loading control indicated is the Ponceau Red staining of the membrane at the 50 kDa level (the same membrane as in Figure 4E is shown in duplicate). (Right) Quantification of immunoblots to show the MuRF1 protein levels in gastrocnemius muscle from CTRL and KIC mice. The relative protein amount was calculated from the control mean in two different experiments. n=5 mice/group. Data are mean ± SD. Unpaired two-tailed Mann-Whitney t-tests; **p<0.01 and n represents the number of mice that were analyzed.
-
Figure 2—source data 1
Uncropped and labeled gels for Figure 2.
- https://cdn.elifesciences.org/articles/93312/elife-93312-fig2-data1-v1.zip
-
Figure 2—source data 2
Raw unedited gels for Figure 2.
- https://cdn.elifesciences.org/articles/93312/elife-93312-fig2-data2-v1.zip
Figure 2—figure supplement 1
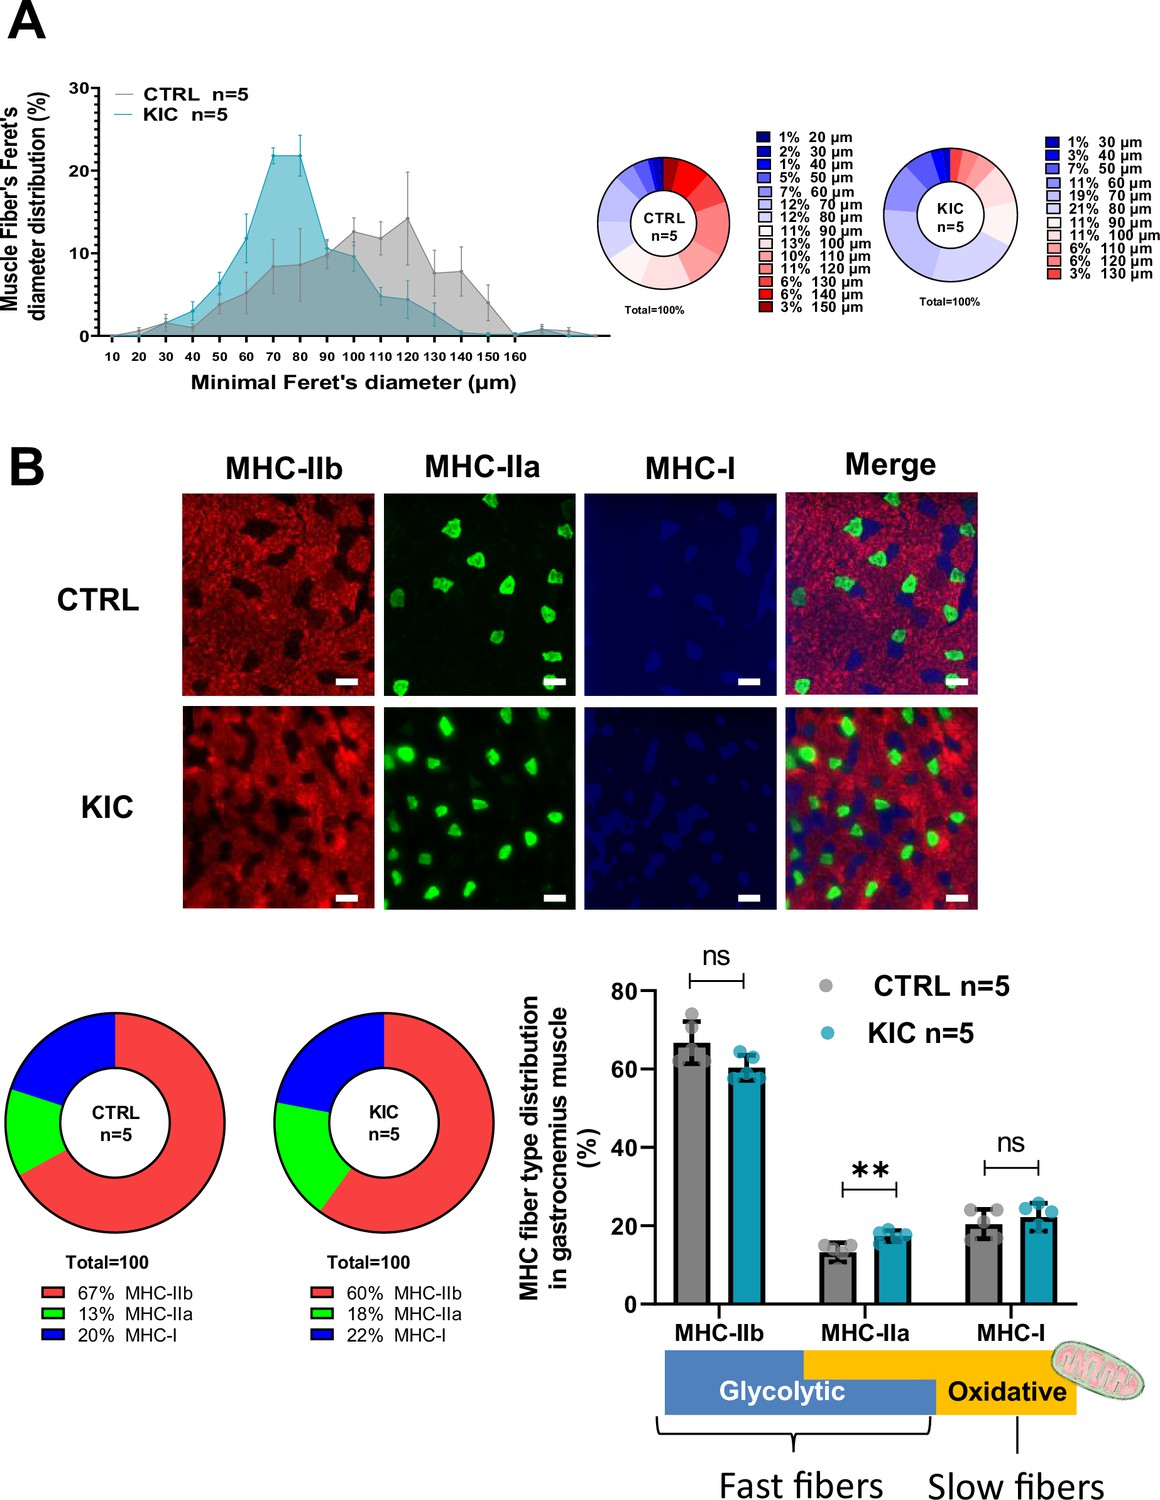
Decreased fiber’s size but moderate change in proportion of the different fiber types in pancreatic ductal adenocarcinoma (PDAC) atrophic muscle (related to Figure 2).
(A) Muscle fiber’s size distribution in gastrocnemius muscle from control and KIC mice. (Left) Minimal Feret’s diameters were determined in gastrocnemius cross sections from laminin immunofluorescent staining (Figure 2B). Hundred fiber diameters were counted per group. The values are expressed as the percentage of the quantified fibers from 10 to 160 µm, and the image counts are representative of n=5 mice muscle cross sections used for each experimental condition. Values correspond to the mean ± SEM. The line represents the median distribution of minimal Feret’s diameters observed in healthy control (CTRL) versus cancer (KIC) mice. (Right) Mean percentage of muscle fiber’s distribution for the control and cancer groups. (B) (Top) Representative immunostaining of transversal sections of gastrocnemius muscle from healthy control and cancer KIC male mice stained for MHC-IIb (red), MHC-IIa (green), and MHC-I (blue). Scale bars, 40 µm. (Bottom left) MHC-fiber-type distribution mean in gastrocnemius muscles from CTRL and KIC mice (n=5 mice/group). (Bottom right) MHC-fiber-type distribution in gastrocnemius muscle from control and KIC mice (n=5 mice/group). Data are mean ± SEM. Unpaired two-tailed Mann-Whitney t-tests; ns = non-significant, **p<0.01. The scheme under the graph illustrates the different fiber-type characteristics.
Figure 3
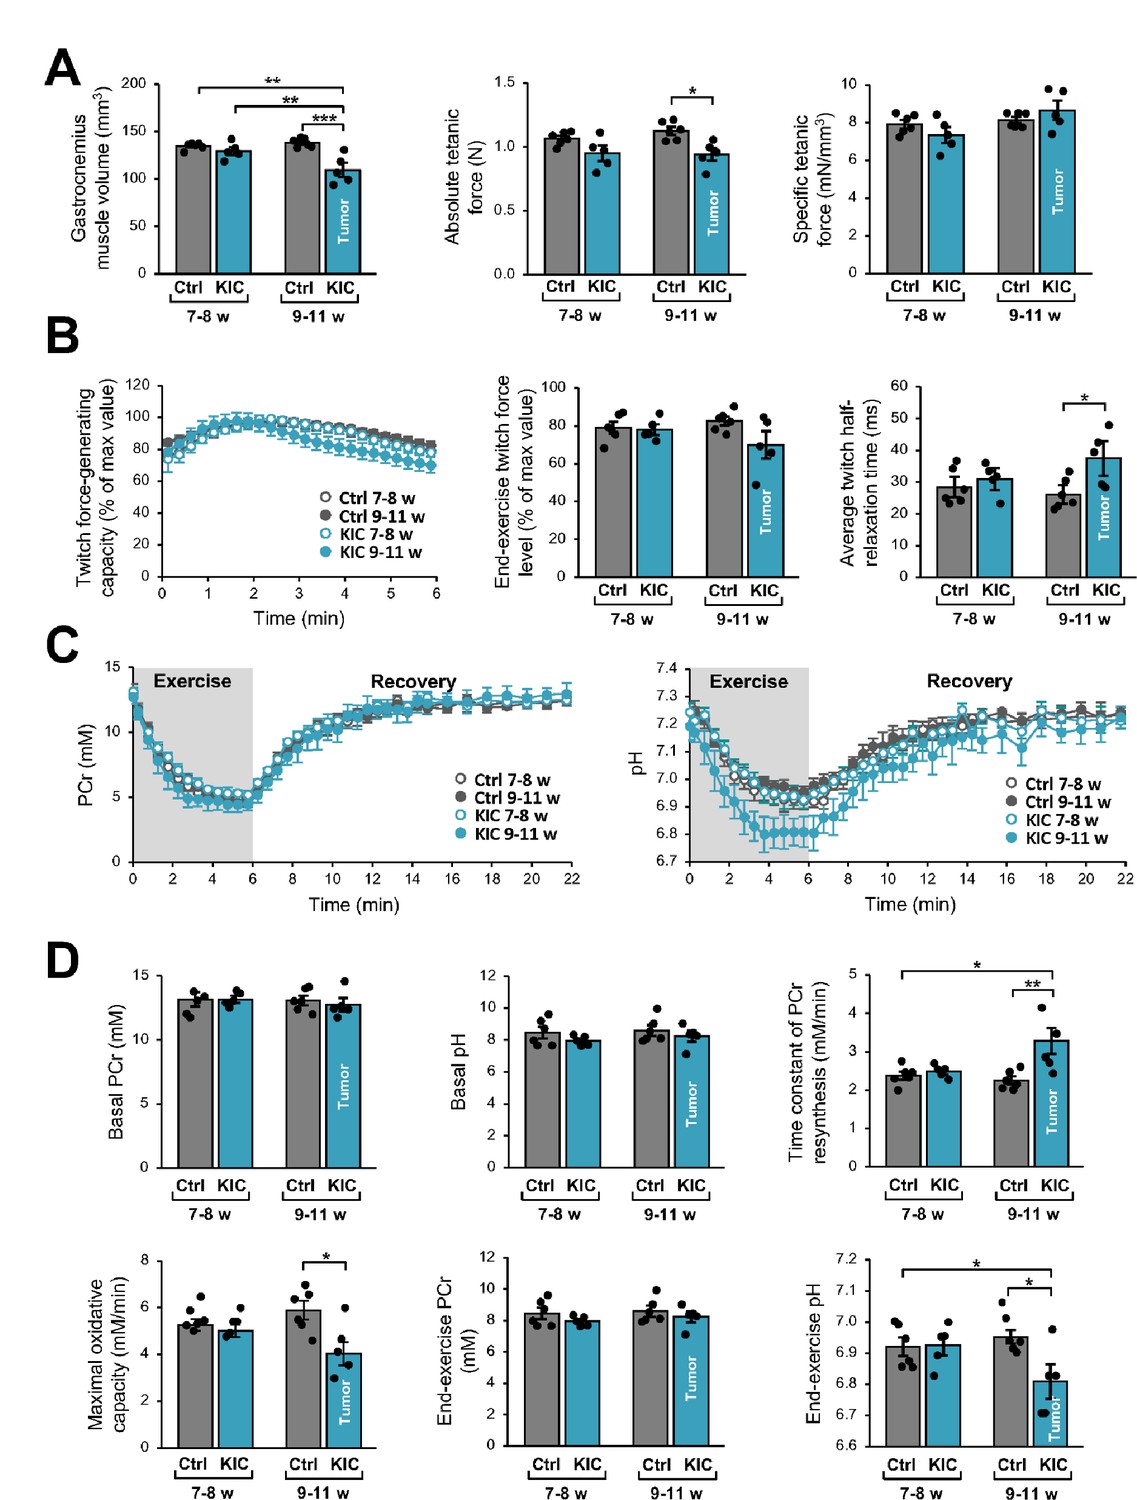
Noninvasive magnetic resonance (MR) investigation of gastrocnemius muscle function and bioenergetics.
This longitudinal investigation was done in the same KIC mice, at 7- to 8-week-old (pre-tumoral) and at 9–11 weeks of age (bearing a tumor), and same age-matched control mice. (A) (Left) Gastrocnemius muscle volume was calculated from MR images. (Middle and right) Absolute and specific force production in response to a tetanic electrostimulation train (150 Hz; 0.5 s duration). (B) (Left) Twitch force-generating capacity (expressed as percent of maximal twitch force value) during the 6 min bout of exercise performed simultaneously to the dynamic 31P-MRS acquisition. (Middle) Twitch force level at the end of the 6 min bout. (Right) Twitch half-relaxation time averaged over the whole bout of exercise. (C) Changes in phosphocreatine (PCr) level (left) and pH (right) throughout the 6 min exercise and the 16 min post-exercise recovery period; for both panels, the first time-point (t=0) indicates the basal value. (D) Basal PCr level and pH were measured in resting muscle. Time constant of PCr resynthesis and maximal oxidative capacity were measured during recovery. The drop of PCr and acidosis were determined at the end of the 6 min bout of exercise. Data are means ± SEM. Controls, n=7; KIC, n=5. All samples were normally distributed according to the Shapiro-Wilk test. Significant differences were determined by two-factor (group × age) repeated measures ANOVA followed when appropriate by Tukey-Kramer post hoc multiple comparison tests. *p<0.05, **p<0.01, ***p<0.001.
Figure 4
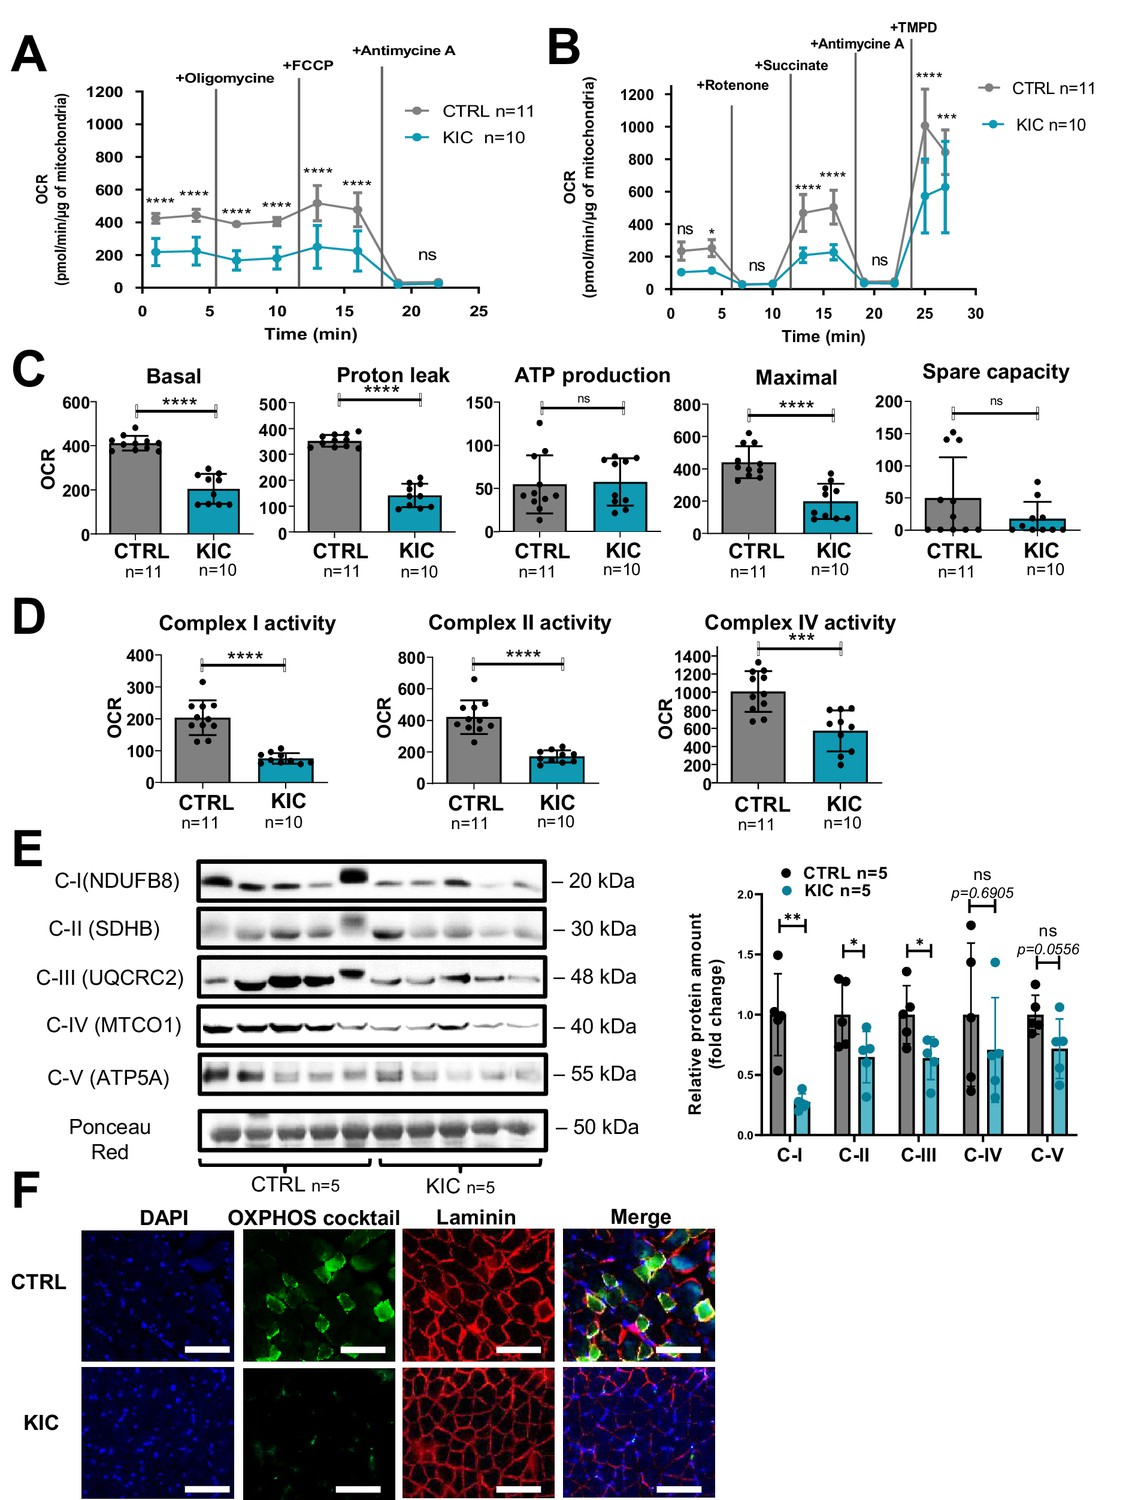
Cancer-associated sarcopenia is correlated with a decrease of mitochondrial respiratory activity and respiratory complexes.
(A, B) Representative Seahorse XF oxygen consumption rate assays performed on mitochondria isolated from gastrocnemius muscle of age-matched healthy control and cancer (9- to 11-week-old bearing a tumor) KIC mice. The curves were normalized to 1 µg of mitochondrial protein (the assays were done with 2.5 µg of mitochondria). (A) Mitochondrial coupling assay. The analysis medium was supplemented with ADP (5 mM), succinate (10 mM), and rotenone (2 µM). (B) Electron transport chain assay performed on the same samples of isolated mitochondria. The analysis medium was supplemented with pyruvate (5 mM), malate (1 mM), and FCCP (4 µM) to allow maximal respiration. Data are mean ± SD and n represents the number of mice analyzed. Two-way ANOVA Bonferroni test; ns = non-significant, *p<0.05, ***p<0.001, ****p<0.0001. (C, D) Quantification of the different parameters of mitochondrial respiratory activity, normalized per µg of mitochondrial protein. (C) Parameters calculated from the mitochondrial coupling assay. From left to right: basal respiration, measured as the basal OCR subtracted from the background OCR (i.e. OCR after antimycin A addition); proton leak, measured as the OCR after oligomycin addition subtracted from the background OCR; ATP production from mitochondria, measured as the basal OCR subtracted from the OCR after oligomycin addition; maximal respiration, measured as the OCR after FCCP addition subtracted from the background OCR; spare capacity, i.e., the difference between maximal and basal mitochondrial respiration. (D) Respiratory complexes activities calculated from the OCR values obtained in the electron transport chain assay. From left to right: complex I activity, measured as the basal OCR subtracted from the OCR after rotenone addition; complex II activity, measured as the difference between succinate-driven OCR and OCR after antimycin A addition; complex IV respiration, measured as the difference between TMPD-driven OCR and OCR after antimycin A addition. Data are mean ± SD. Unpaired two-tailed Mann-Whitney t-tests; ns = non-significant, ***p<0.001, ****p<0.0001; n represents the number of mice analyzed per condition. (E) Left: Representative immunoblot for mitochondrial complexes using the rodent cocktail oxidative phosphorylation (OXPHOS) antibodies specific of one protein for each complex: CI (NDUFB8), CII (SDHB), CIII (UQCRC2), CIV (MTCO1), CV (ATP5A), in gastrocnemius muscle from CTRL and KIC mice (n=5/group). The loading control indicated is the Ponceau Red staining of the membrane at the 50 kDa level. Right: Relative protein amount of CI (NDUFB8), CII (SDHB), CIII (UQCRC2), CIV (MTCO1), CV (ATP5A) in gastrocnemius muscle from CTRL and KIC male mice. The relative protein amount was calculated from the mean of CTRL from two different experiments. n=5 mice/group. Data are mean ± SD. Unpaired two-tailed Mann-Whitney t-tests; ns = non-significant with p-value indicated above, *p<0.05, **p<0.01. (F) Representative immunostaining of gastrocnemius muscle cross sections from control (n=5) and KIC (n=5) mice stained for mitochondrial electron transport chain complexes I to V (green) to evaluate mitochondrial mass, DAPI (blue) to evaluate nucleus, laminin (red) to evaluate muscle fibers, and merged images as indicated. Scale bars, 100 µm.
-
Figure 4—source data 1
Uncropped and labeled gels for Figure 4.
- https://cdn.elifesciences.org/articles/93312/elife-93312-fig4-data1-v1.zip
-
Figure 4—source data 2
Raw unedited gels for Figure 4.
- https://cdn.elifesciences.org/articles/93312/elife-93312-fig4-data2-v1.zip
Figure 5 with 1 supplement
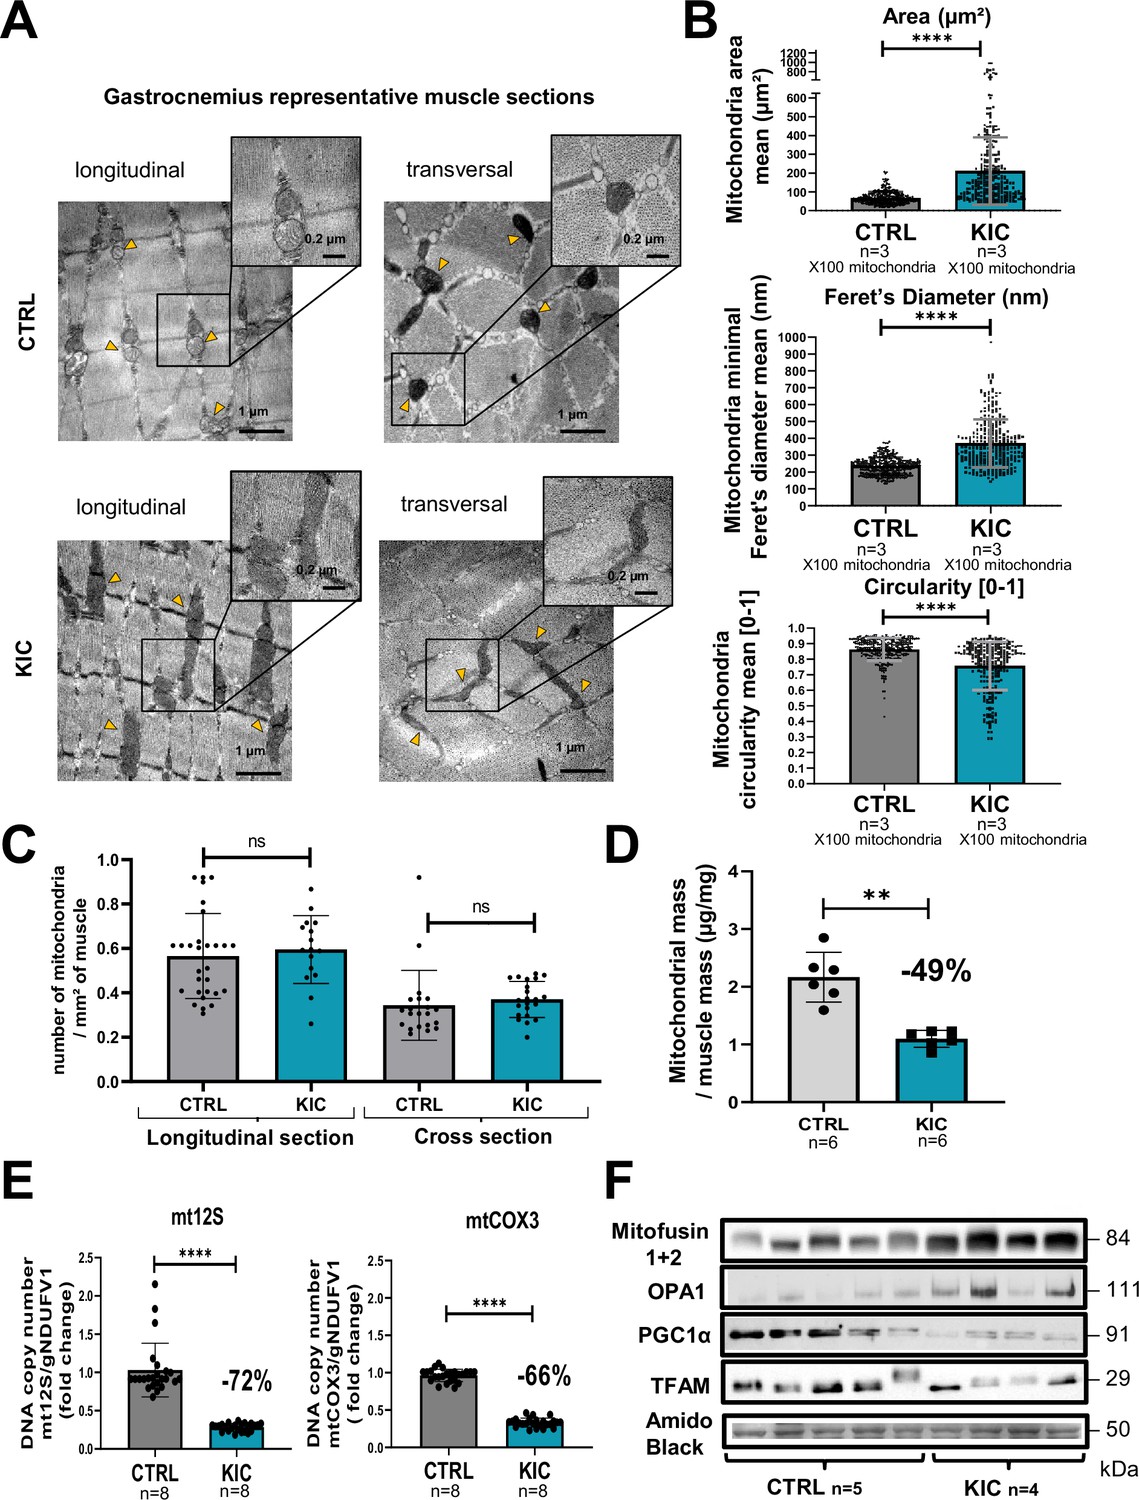
Mitochondrial structure is profoundly altered in cancer KIC muscles.
(A–C) Transmission electron microscopy (TEM) analysis of muscles showing altered mitochondria in cancer mouse muscle. (A) Representative TEM micrographs of longitudinal and transversal sections of gastrocnemius muscles from CTRL and cancer KIC mice showing mitochondrial ultrastructure. Scale bar = 1 or 0.2 µm. Yellow triangles point to mitochondria. (B) Quantification of mitochondrial morphological characteristics. From top to bottom: Mitochondrial area (µm²), mitochondrial minimal Feret’s diameter, and mitochondrial circularity in longitudinal sections of gastrocnemius muscles from CTRL healthy mice and cancer KIC mice. n=3 mice/group and 100 mitochondria measured/mouse. Data are mean ± SD. Unpaired two-tailed Mann-Whitney t-test. **** p<0.0001. (C) Quantification of the number of mitochondria per mm² in longitudinal and transversal sections of gastrocnemius muscles from CTRL healthy mice and cancer KIC mice. n=3 mice/group and 15 or more pictures have been taken and measured/mouse. Data are mean ± SD. Unpaired two-tailed Mann-Whitney t-test; ns = non-significant. (D) Mitochondrial mass of total isolated mitochondria (in µg of proteins), normalized by the related entire gastrocnemius muscle mass (in mg) in CTRL and KIC mice. Data are mean ± SD; n=6 mice/group. Unpaired two-tailed Mann-Whitney t-tests; **p<0.01. (E) Relative mitochondrial DNA content in gastrocnemius muscle of CTRL and KIC mice using relative level of mtCOX3 (left) and mt12S (right) as mitochondrial genes normalized on gNDUFV1 as nuclear gene. Data are mean ± SD, n=8 mice/group. Unpaired two-tailed Mann-Whitney t-tests, ****p<0.0001. (F) Representative immunoblots for Mitofusin1+2 and OPA1 (involved in mitochondrial fusion), PGC1α (involved in mitochondrial biogenesis), and TFAM (involved in mitochondrial DNA replication, repair, and transcription) in gastrocnemius muscle from CTRL (n=5) and KIC (n=4) mice. The loading control indicated is the Amido Black staining of the PGC1α membrane at the 50 kDa level.
-
Figure 5—source data 1
Uncropped and labeled gels for Figure 5.
- https://cdn.elifesciences.org/articles/93312/elife-93312-fig5-data1-v1.zip
-
Figure 5—source data 2
Raw unedited gels for Figure 5.
- https://cdn.elifesciences.org/articles/93312/elife-93312-fig5-data2-v1.zip
Figure 5—figure supplement 1
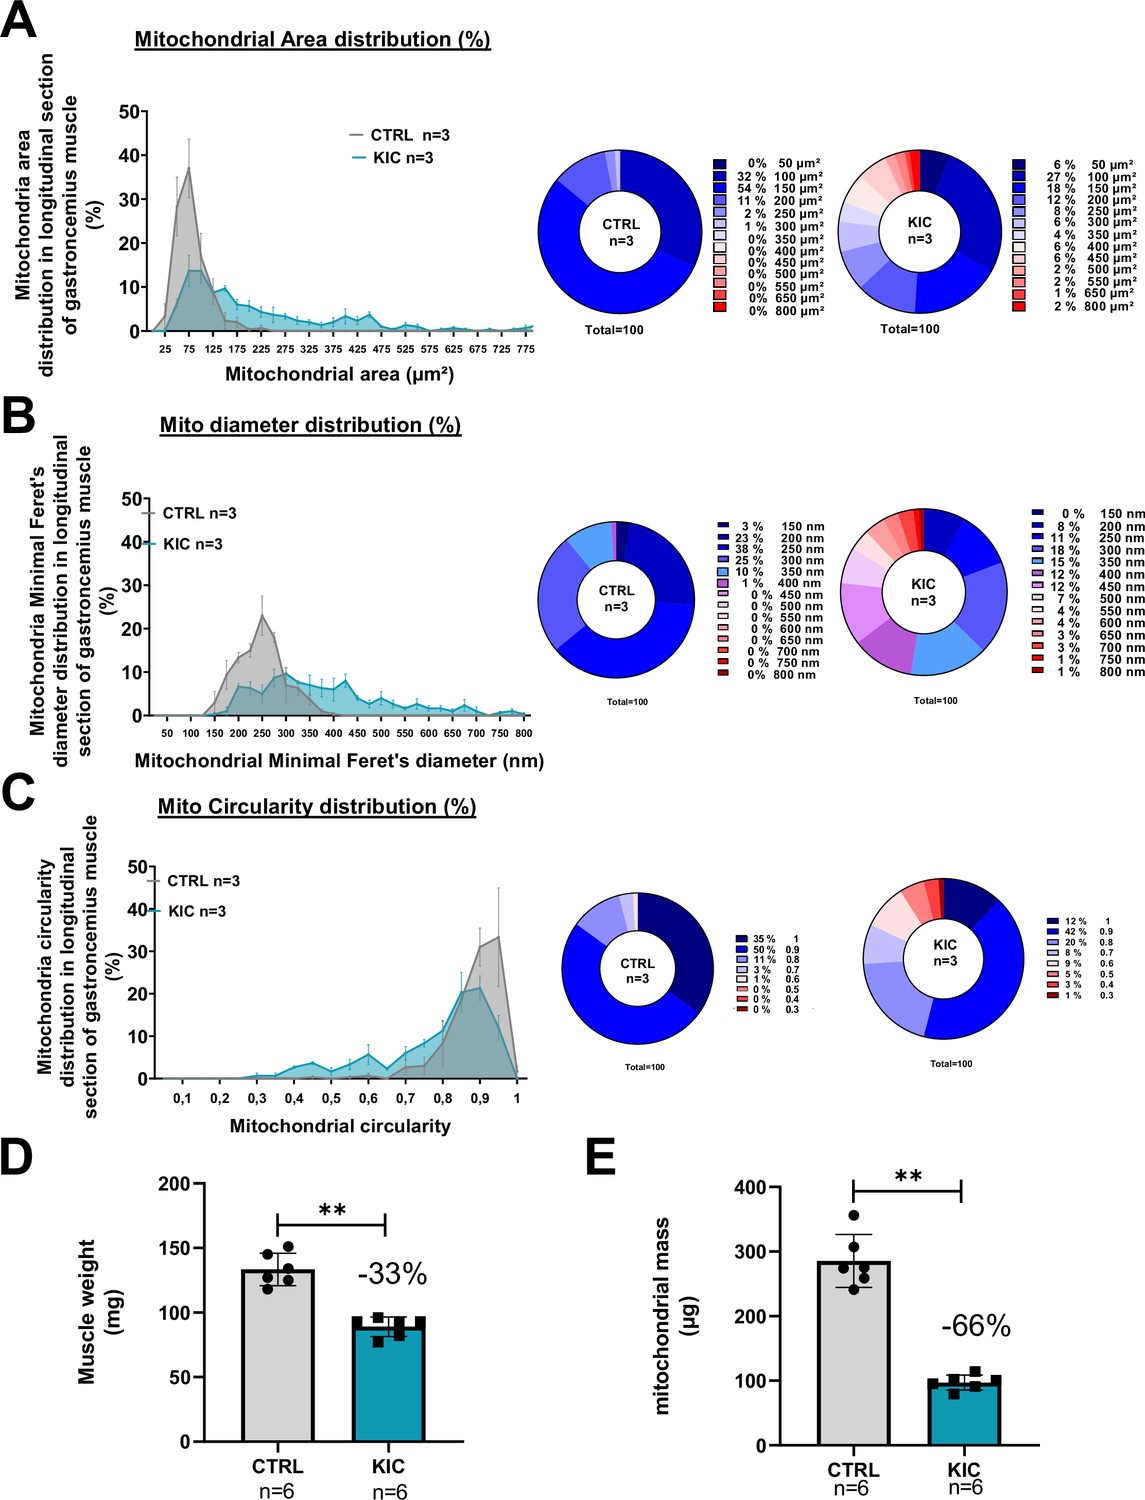
Mitochondrial morphology is profoundly altered in KIC muscles (related to Figure 5).
(A–C) Percentages (%) for mitochondrial morphological characteristics in longitudinal sections of gastrocnemius muscles from healthy CTRL and cancer KIC mice, analyzed by transmission electron microscopy (TEM). (A) Mitochondrial area (µm²), (B) mitochondrial minimal Feret’s diameter, and (C) mitochondrial circularity. n=3 mice/group and 100 mitochondria measured/mouse. (D) Muscle weight of entire gastrocnemius muscle used for mitochondrial isolation shown in (E), and to normalize mitochondrial mass quantity shown in Figure 5D. Data are mean ± SD; n=6 mice/group. Unpaired two-tailed Mann-Whitney t-tests; **p<0.01. (E) Total mass (in protein equivalent) of mitochondria isolated from entire gastrocnemius muscle from CTRL and KIC mice. Data are mean ± SD; n=6 mice/group. Unpaired two-tailed Mann-Whitney t-tests; **p<0.01.
Figure 6 with 4 supplements
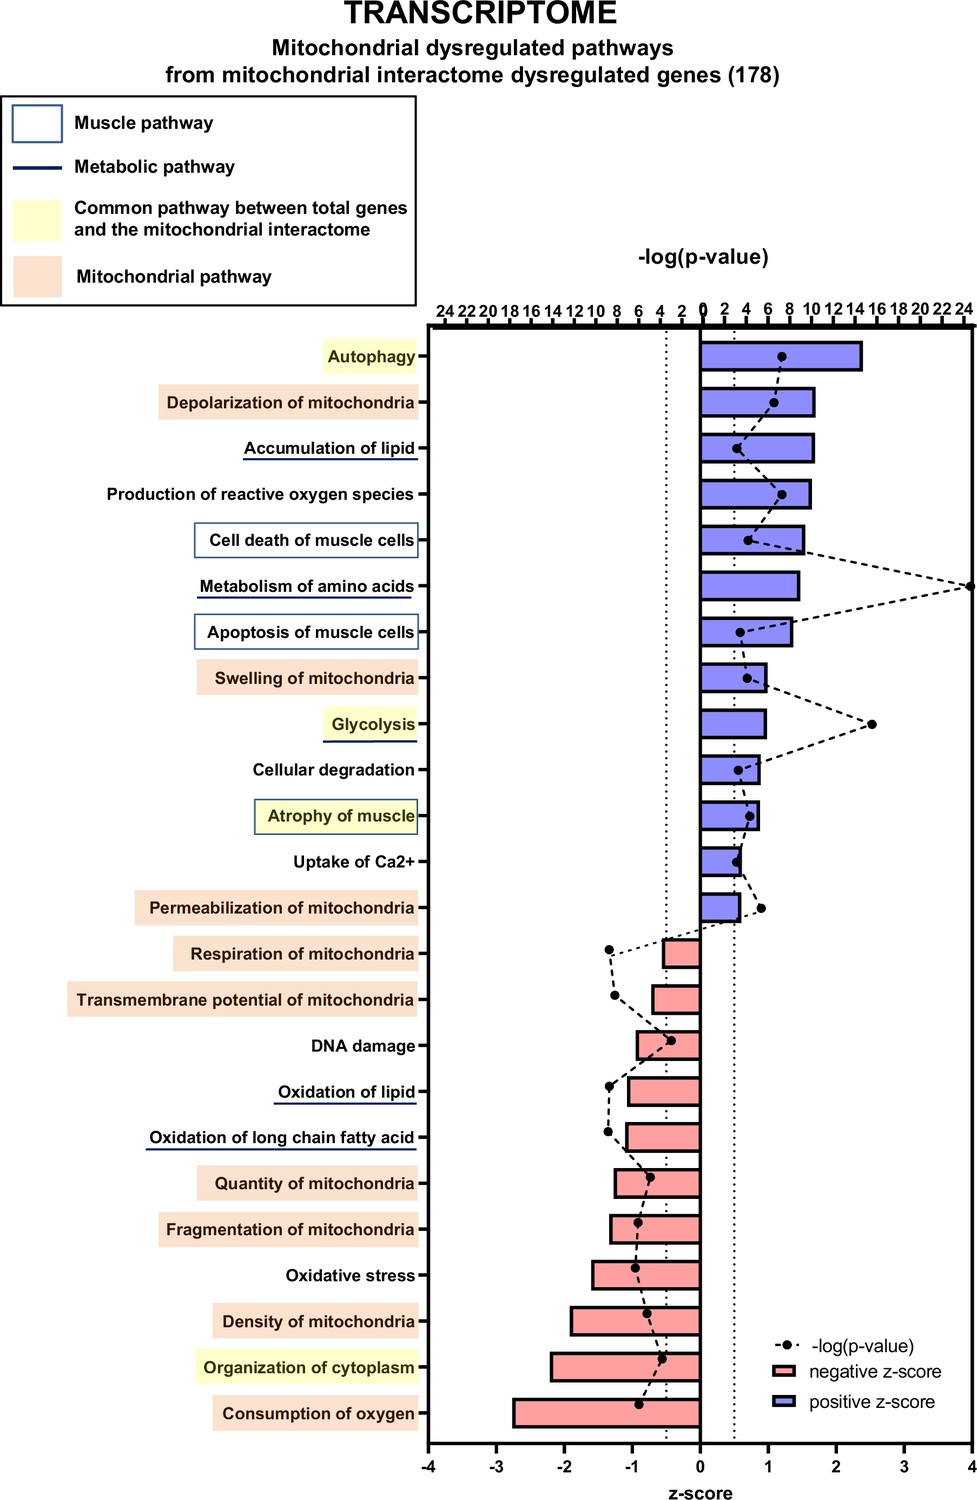
Transcriptomic analysis demonstrates multiple mitochondria-associated gene dysregulations in cancer sarcopenic muscles.
Ingenuity Pathways Analysis (IPA) showing functions, pathways, and diseases significantly dysregulated in gastrocnemius muscle of cancer KIC mice compared to healthy control mice, associated with genes of the mitochondrial interactome extracted from mitoXplorer tool with significant dysregulations (false discovery rate [FDR]>0.05)=178 genes. Each process is represented using z-score>0.5 as upregulated (blue) or downregulated (red), and the significance represented as –log(p-value) with black dots connected with a dotted line. Muscle pathways are framed by a square. Common pathways between total genes and the mitochondrial interactome are highlighted in yellow. Mitochondrial pathways are highlighted in orange. Other metabolic pathways are underlined.
Figure 6—figure supplement 1
Transcriptomic analysis of cancer sarcopenic muscles (related to Figure 6).
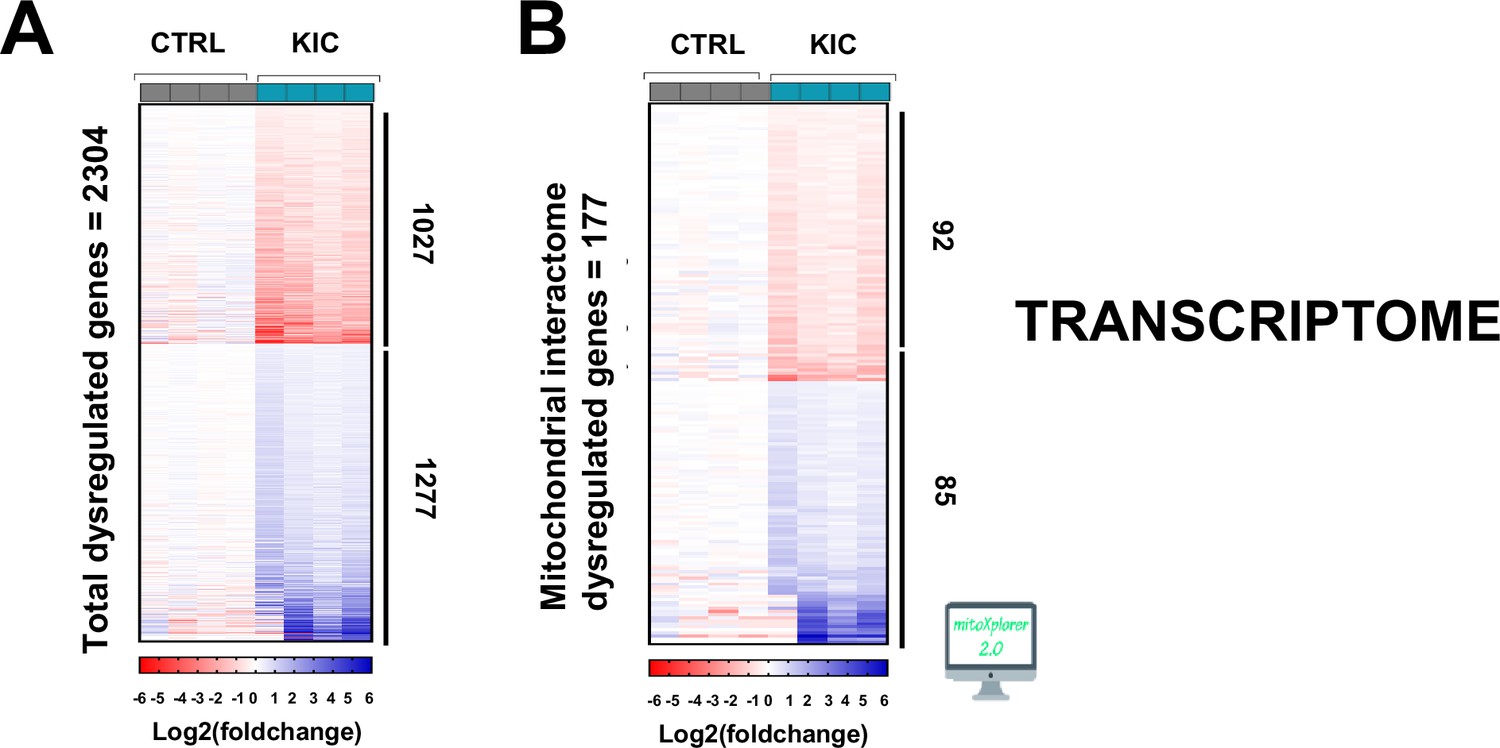
(A) Heatmap representing total number of dysregulated genes (false discovery rate [FDR]<0.05) in gastrocnemius muscle from cancer KIC mice (n=4) compared to healthy CTRL mice (n=4). (B) Heatmap representing dysregulated genes from mitochondrial interactome after mitoXplorer selection (FDR<0.05) in gastrocnemius muscle from the same mice as (A).
Figure 6—figure supplement 2
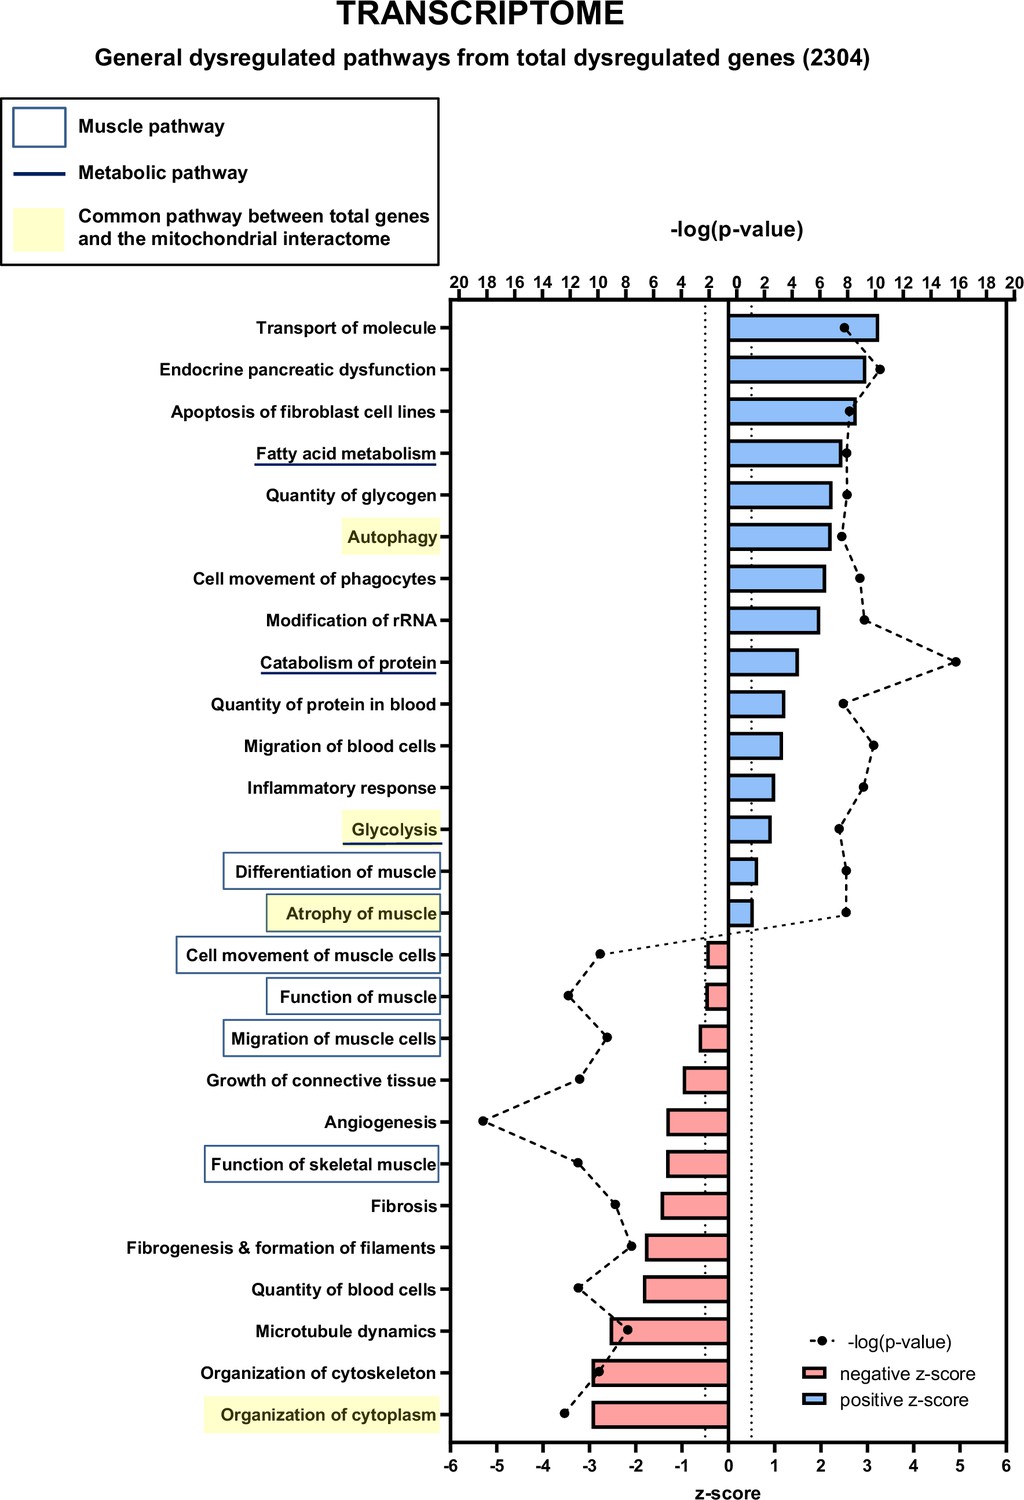
Transcriptomic analysis of total dysregulated genes in cancer sarcopenic muscles (related to Figure 6).
Ingenuity Pathways Analysis (IPA) showing functions, pathways, and diseases significantly dysregulated in gastrocnemius muscle of cancer KIC mice compared to healthy control mice, associated with all genes with significant dysregulation (false discovery rate [FDR]>0.05)=2304 genes. Each process is represented using z-score>0.5 as upregulated (blue) or downregulated (red), and the significance represented as –log(p-value) with black dots connected with a dotted line.
Figure 6—figure supplement 3
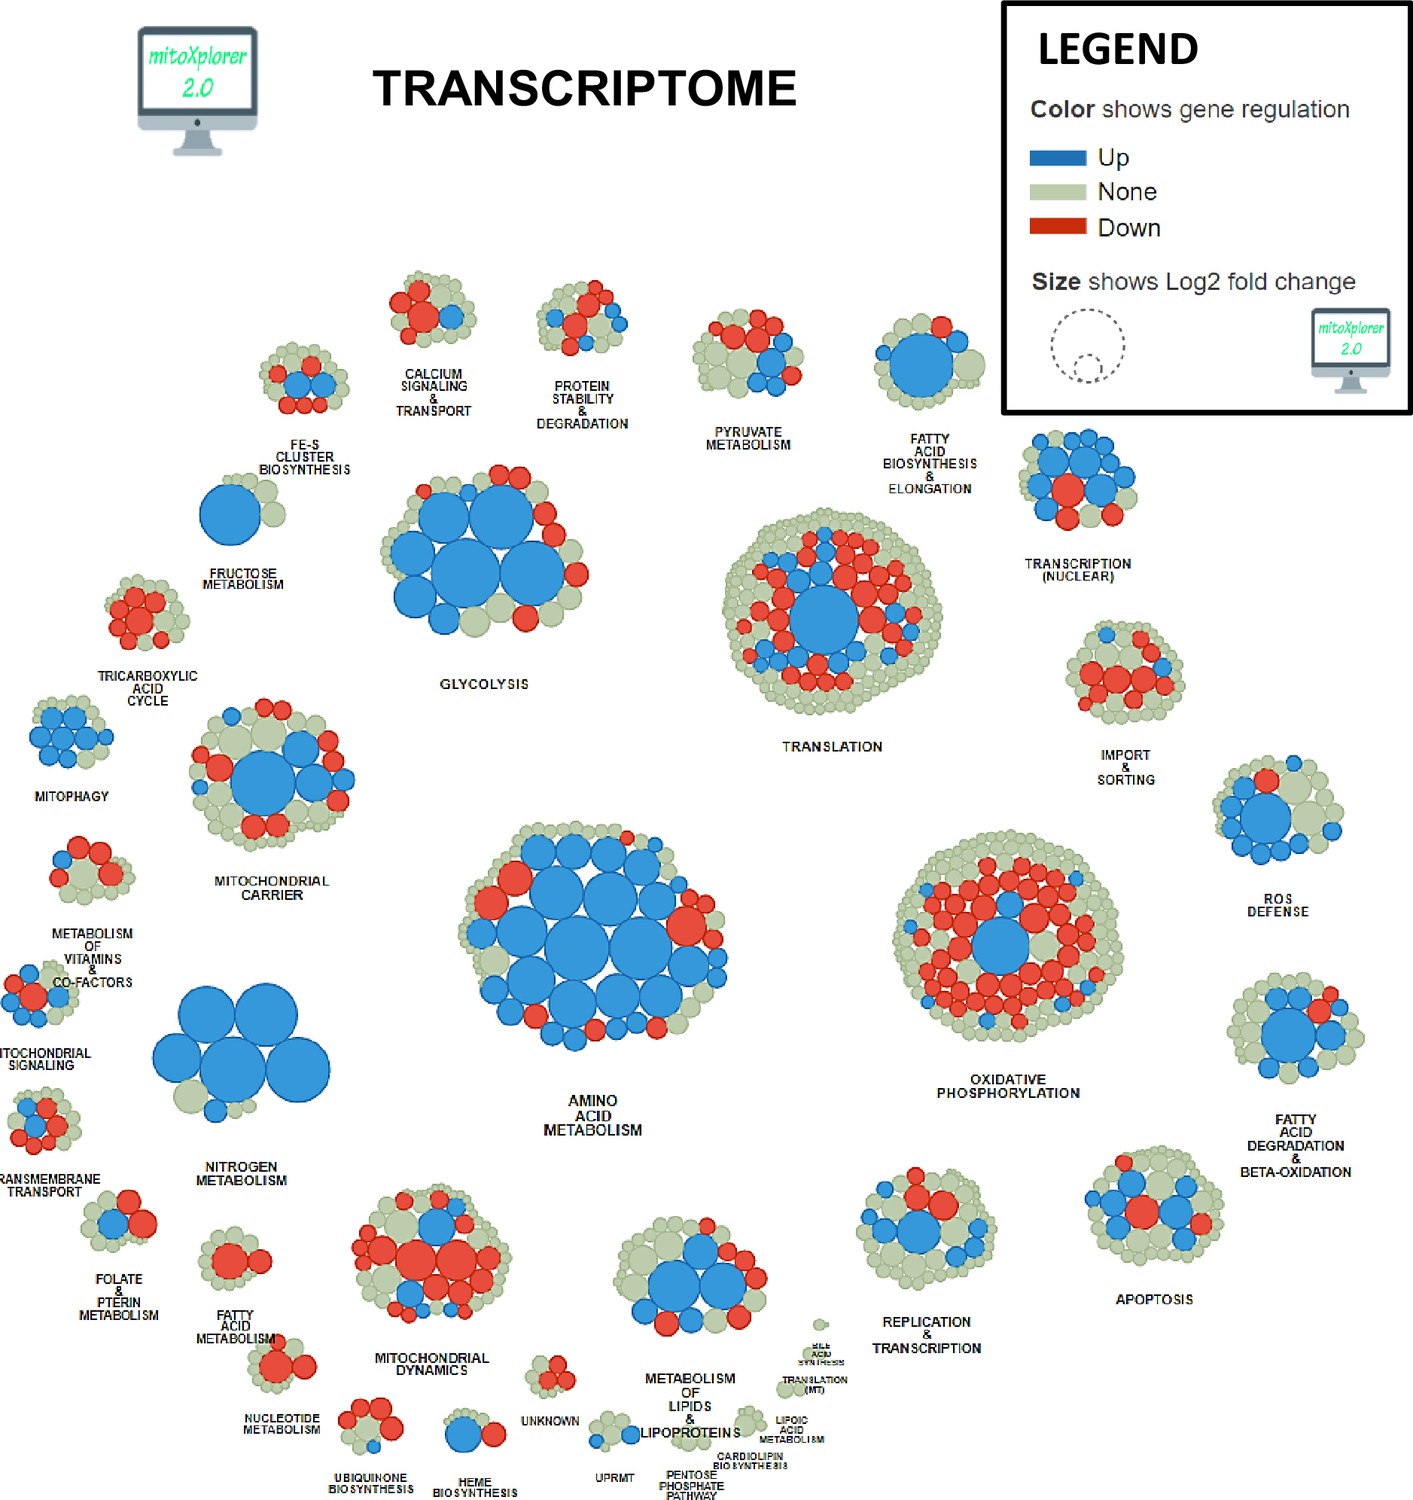
Mitochondrial interactome of down- or upregulated genes involved in mitochondrial processes in KIC gastrocnemius muscle compared to CTRL (muscle RNA n=4 for each condition).
Genes have been selected from total dysregulated genes with false discovery rate (FDR)<0.05, and affiliated to processes after enrichment using mitoXplorer tool.
Figure 6—figure supplement 4
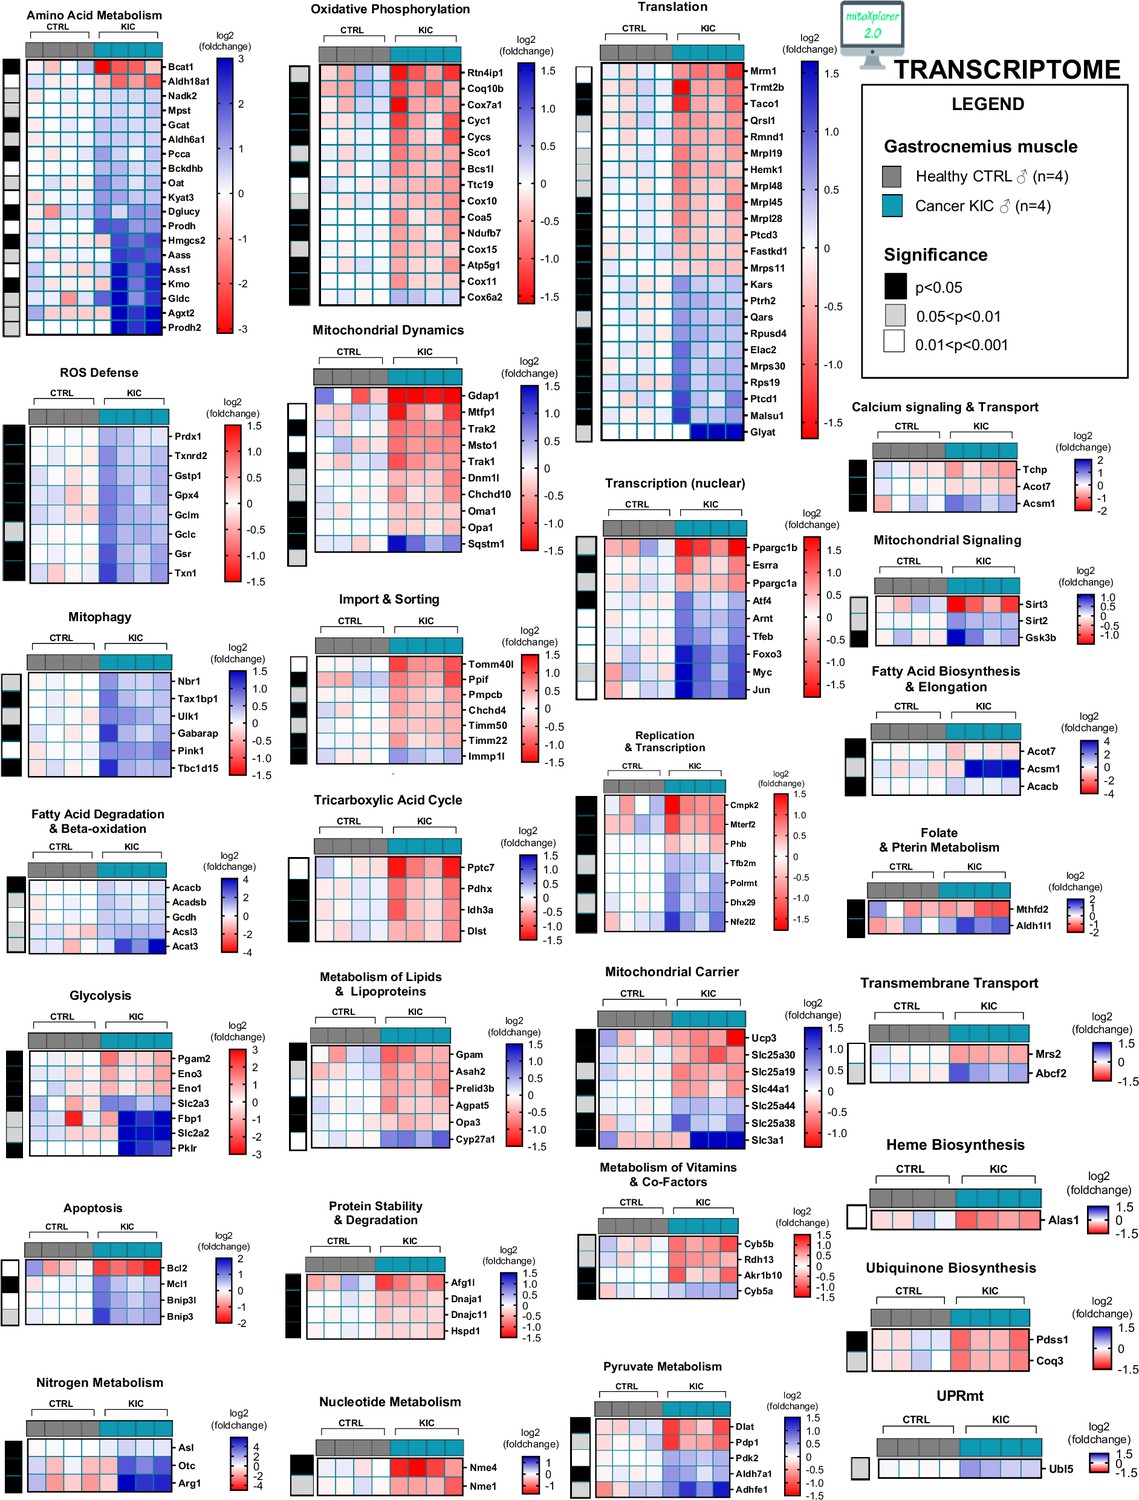
Cancer sarcopenic muscles demonstrate obvious mitochondria-associated genes dysregulation (related to Figure 6 and Figure 6—figure supplement 3).
Heatmaps showing log2(fold change) of differentially dysregulated genes involved in mitochondrial processes (based on false discovery rate [FDR]<0.05) in cancer KIC gastrocnemius muscle compared to healthy CTRL (muscle RNA n=4 for each condition).
Figure 7 with 7 supplements
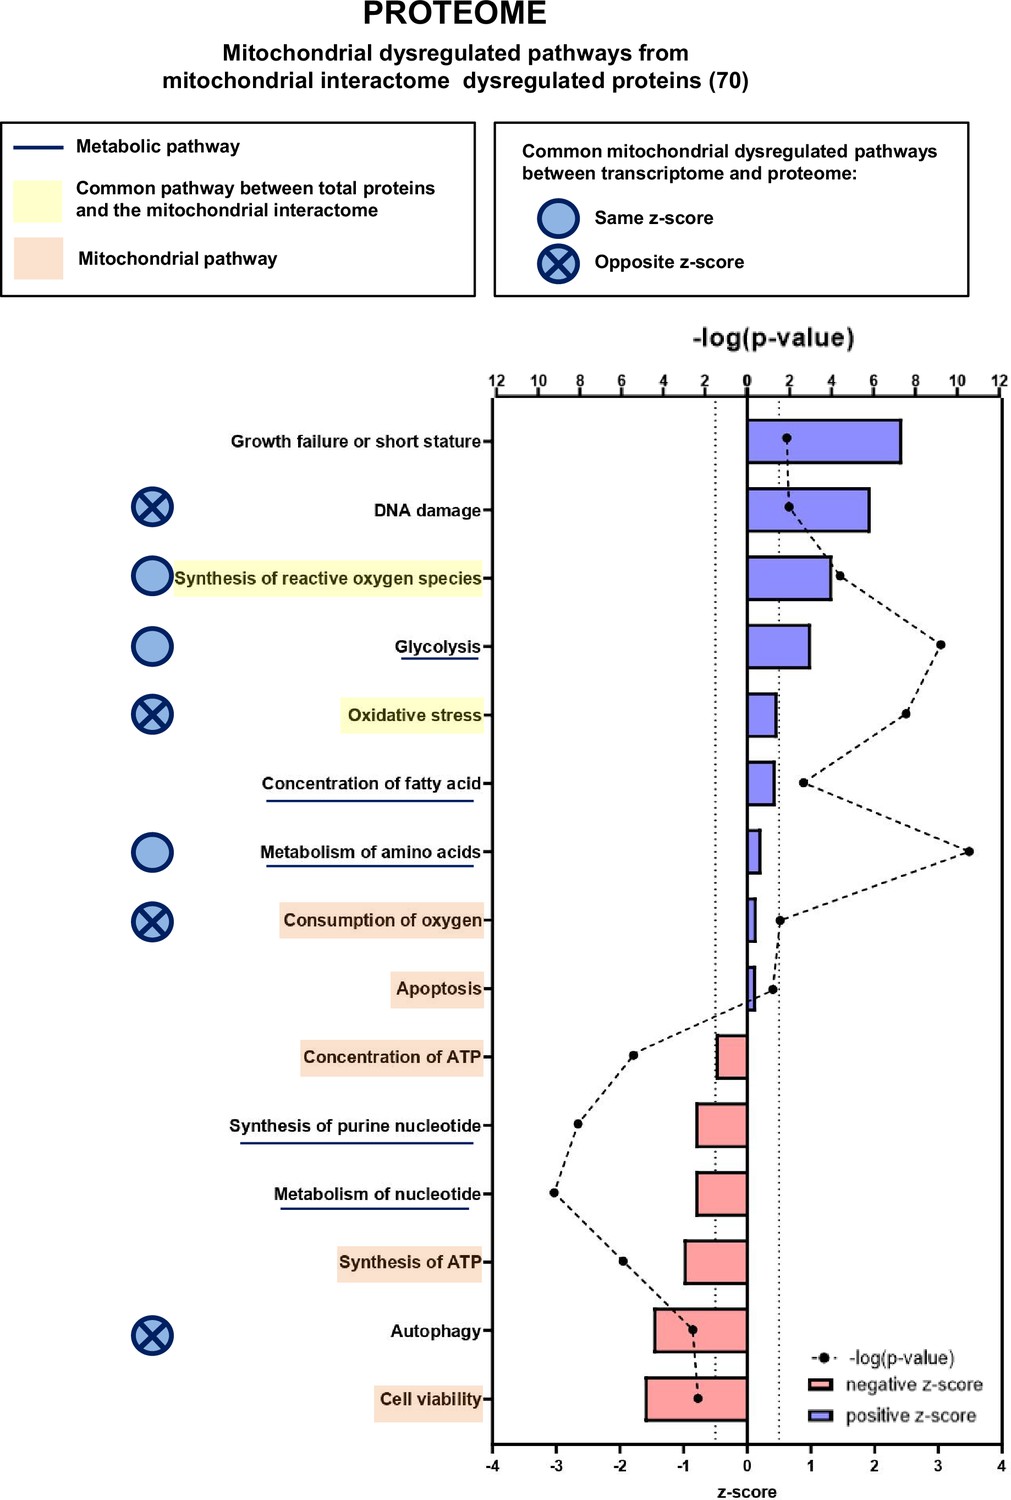
Proteomic analysis shows that numerous mitochondrial proteins are dysregulated in cancer sarcopenic muscle.
Ingenuity Pathways Analysis (IPA) enrichment analysis of dysregulated functions, pathways, and diseases in gastrocnemius muscle of cancer KIC compared to control mice, associated with proteins of the mitochondrial interactome extracted from mitoXplorer tool with significant dysregulations (p-value<0.05, peptide>1, log2(fold change)>0.5)=53 proteins. Each process is represented using z-score>0.5 as upregulated (blue) or downregulated (red), and the significance represented as –log(p-value) with black dots connected with a dotted line. Common pathways between total proteins and the mitochondrial interactome are highlighted in orange. Mitochondrial pathways are highlighted in yellow. Muscle pathways are framed by a square. Common pathways between total genes and the mitochondrial interactome are highlighted in yellow. Mitochondrial pathways are highlighted in orange. Other metabolic pathways are underlined. Common mitochondrial dysregulated pathways between transcriptome and proteome are indicated by a blue circle which is empty when the z-score is the same and contains a cross when the z-score is opposite.
Figure 7—figure supplement 1
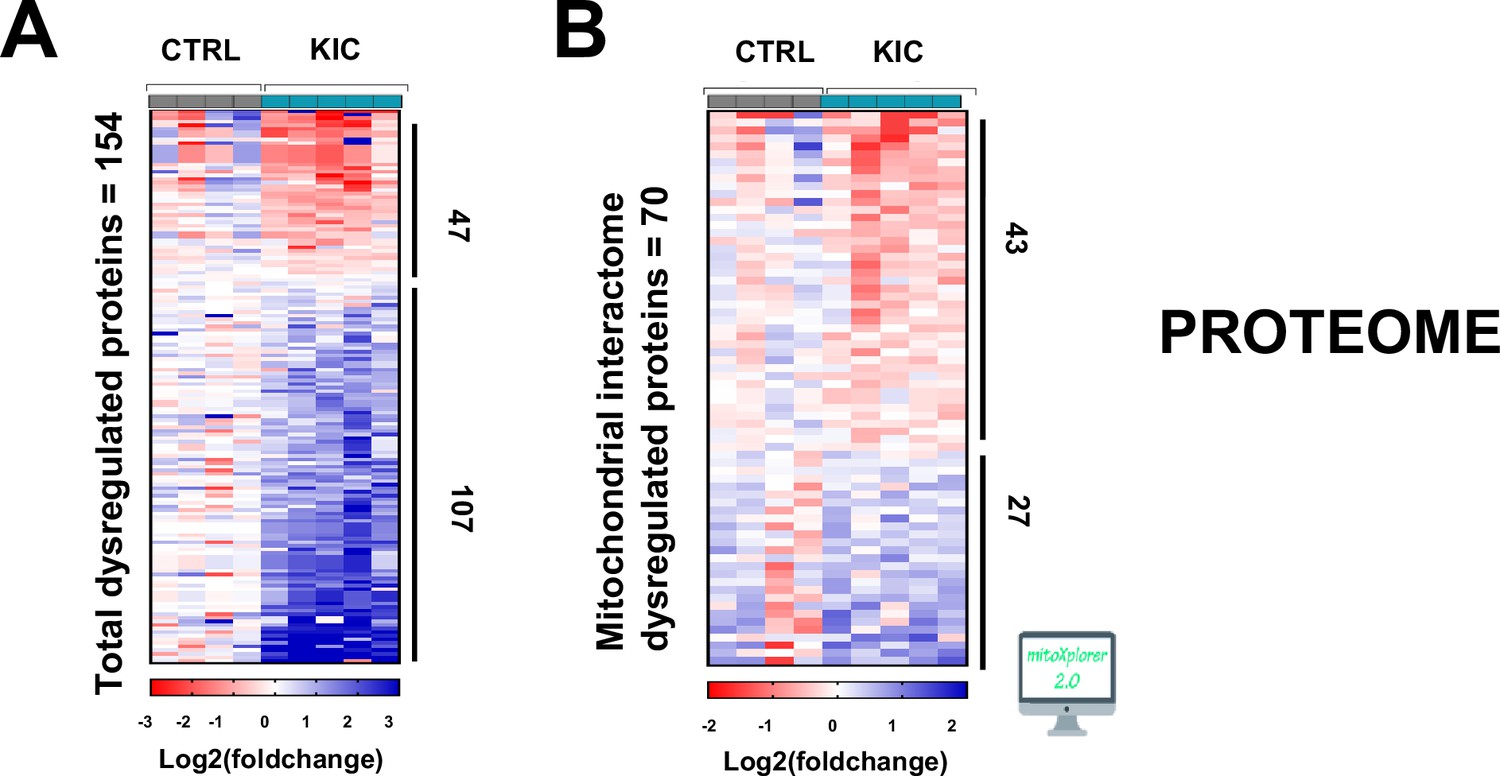
Proteomic analysis of cancer sarcopenic muscles (related to Figure 7).
(A) Heatmap representing total number of dysregulated proteins in gastrocnemius muscle from cancer KIC mice (n=5) compared to healthy CTRL mice (n=4). (B) Heatmap representing dysregulated proteins from mitochondrial interactome after mitoXplorer selection in gastrocnemius muscle from the same mice as (A).
Figure 7—figure supplement 2
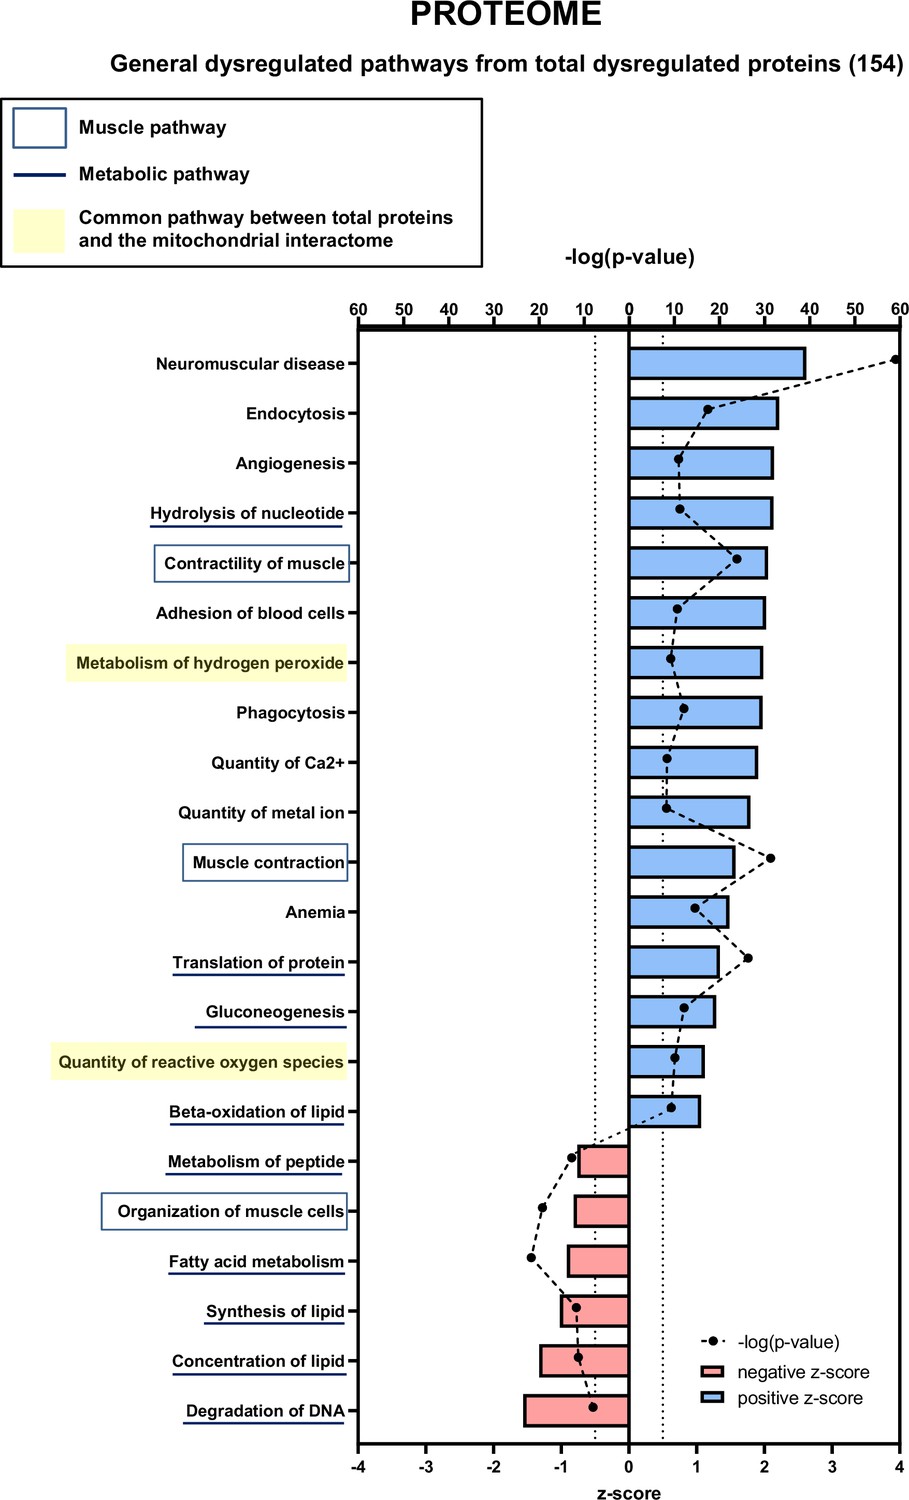
Proteomic analysis showing total proteins dysregulated in cancer sarcopenic muscle (related to Figure 7).
Ingenuity Pathways Analysis (IPA) enrichment analysis of dysregulated functions, pathways, and diseases in gastrocnemius muscle of cancer KIC compared to control mice, associated with all proteins with significant dysregulations (p-value<0.05)=360 proteins. Each process is represented using z-score>0.5 as upregulated (blue) or downregulated (red), and the significance represented as –log(p-value) with black dots connected with a dotted line.
Figure 7—figure supplement 3
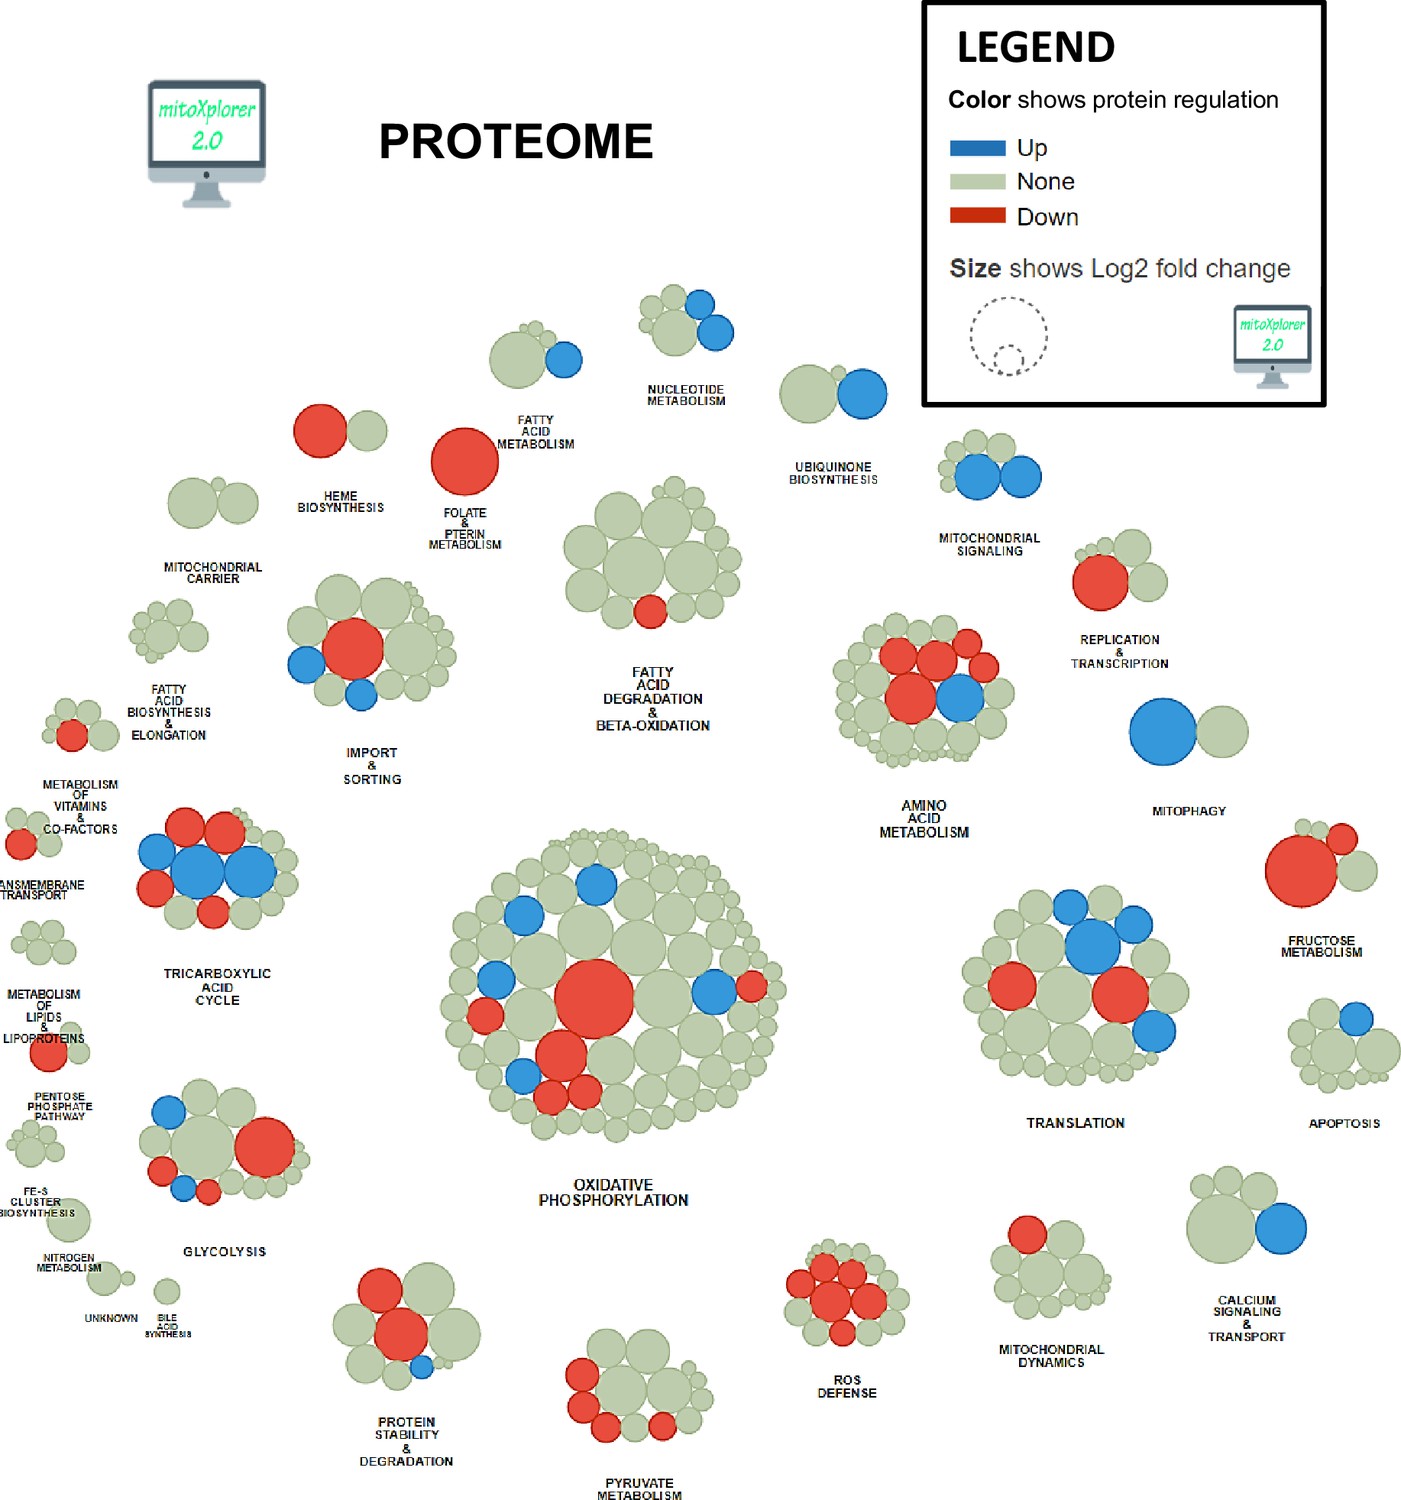
Mitochondrial interactome of down- or upregulated proteins involved in mitochondrial processes in KIC gastrocnemius muscle compared to CTRL.
Proteins have been selected from total dysregulated proteins and affiliated to processes after enrichment using mitoXplorer tool.
Figure 7—figure supplement 4
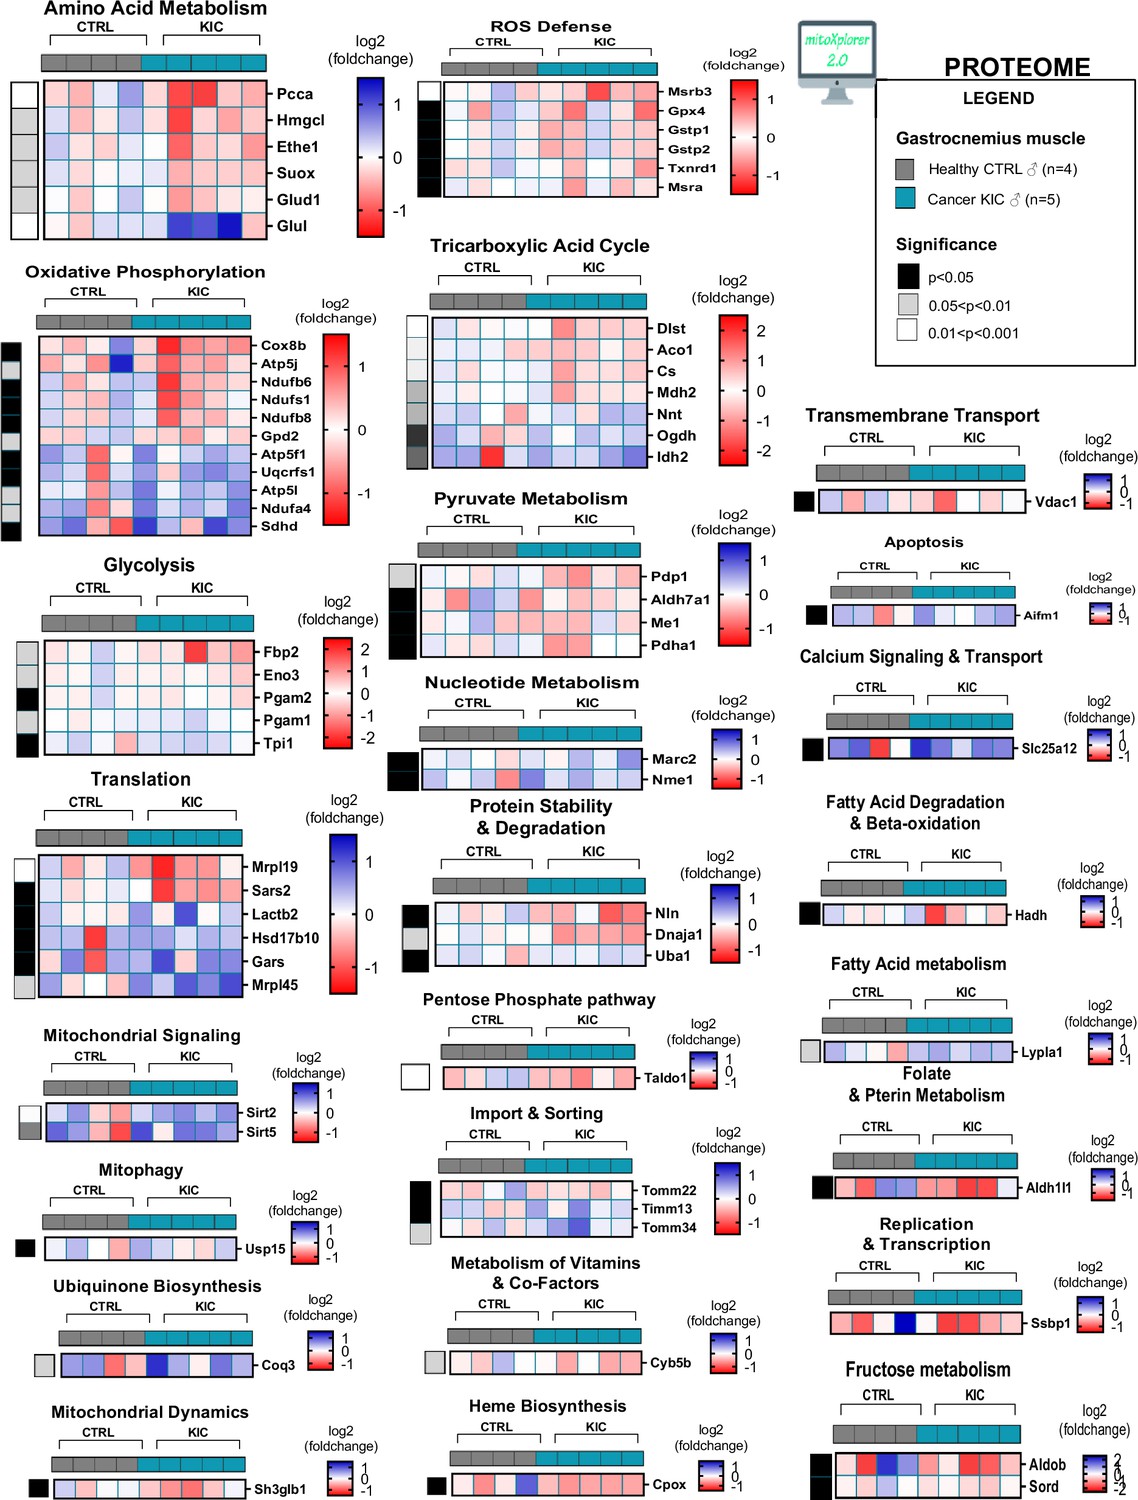
Cancer sarcopenic muscles demonstrate obvious mitochondria-associated protein dysregulation (related to Figure 7 and Figure 7—figure supplement 3).
Heatmap representing dysregulated proteins from mitochondrial interactome after mitoXplorer selection (p-value<0.05, peptide>1, log2(fold change)>0.5) in same gastrocnemius muscles as in Figure 7—figure supplement 3.
Figure 7—figure supplement 5
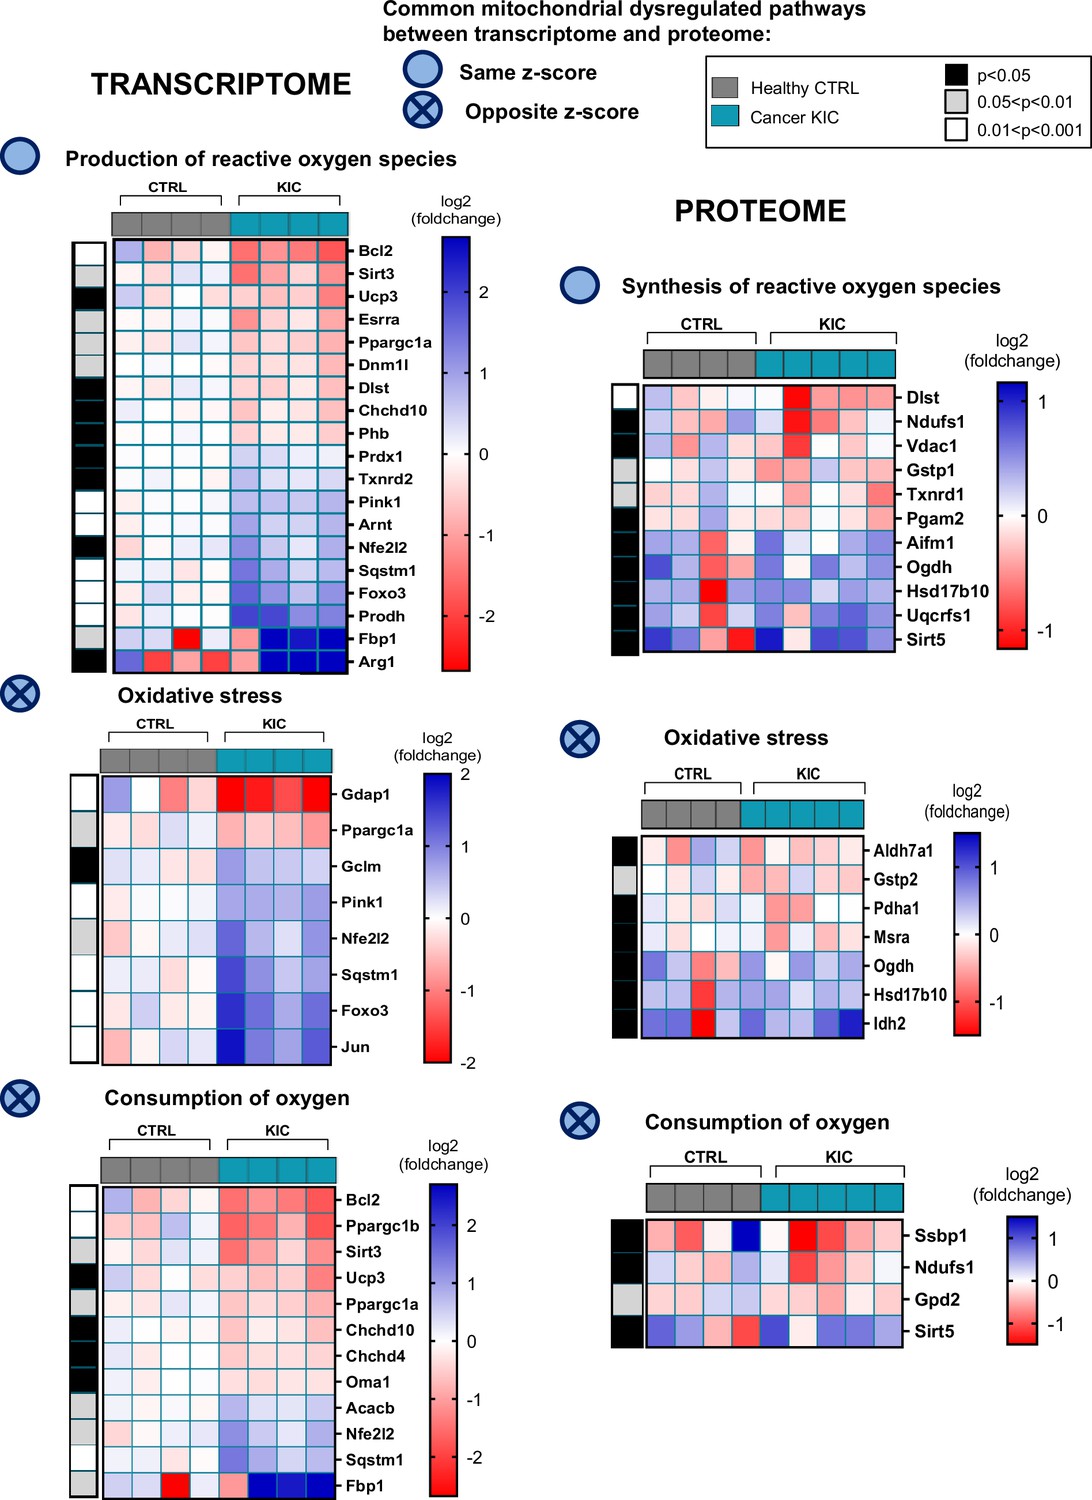
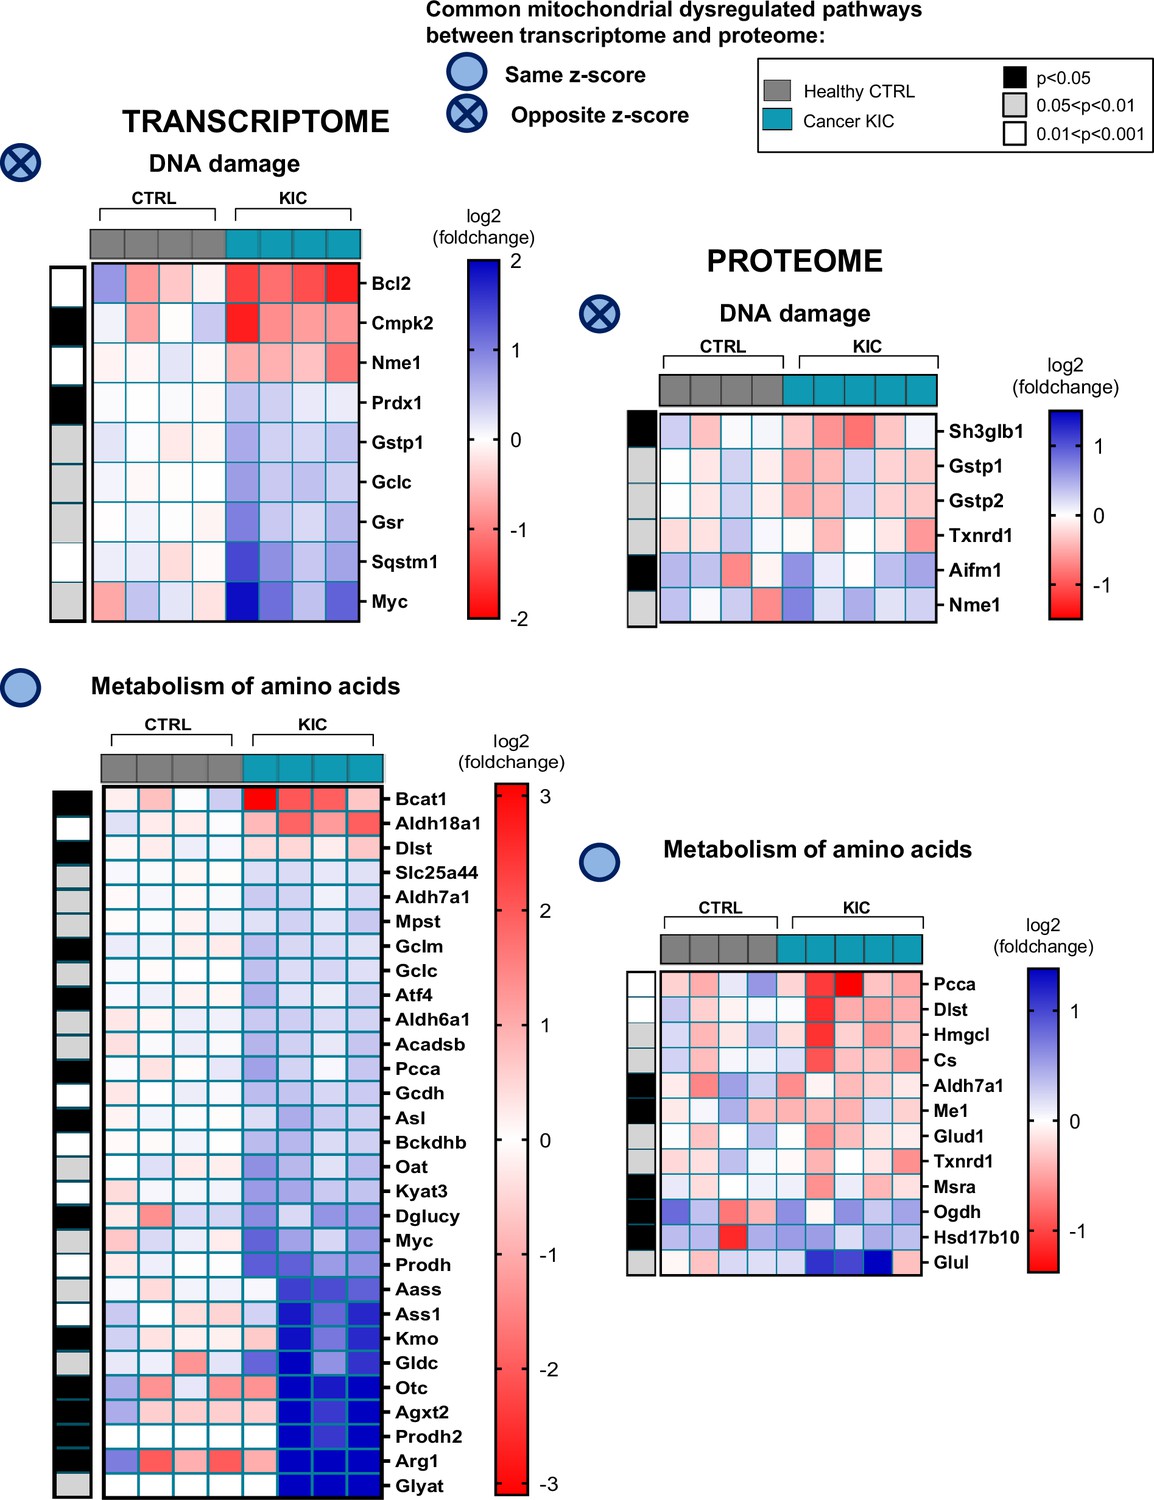
Common mitochondrial dysregulated pathways between transcriptomic and proteomic analyses (related to Figures 6 and 7).
Heatmaps corresponding to the differential pathways, production of reactive oxygen species (ROS), oxidative stress, and consumption of oxygen, in transcriptome (left) and proteome (right) analyses.
Figure 7—figure supplement 6
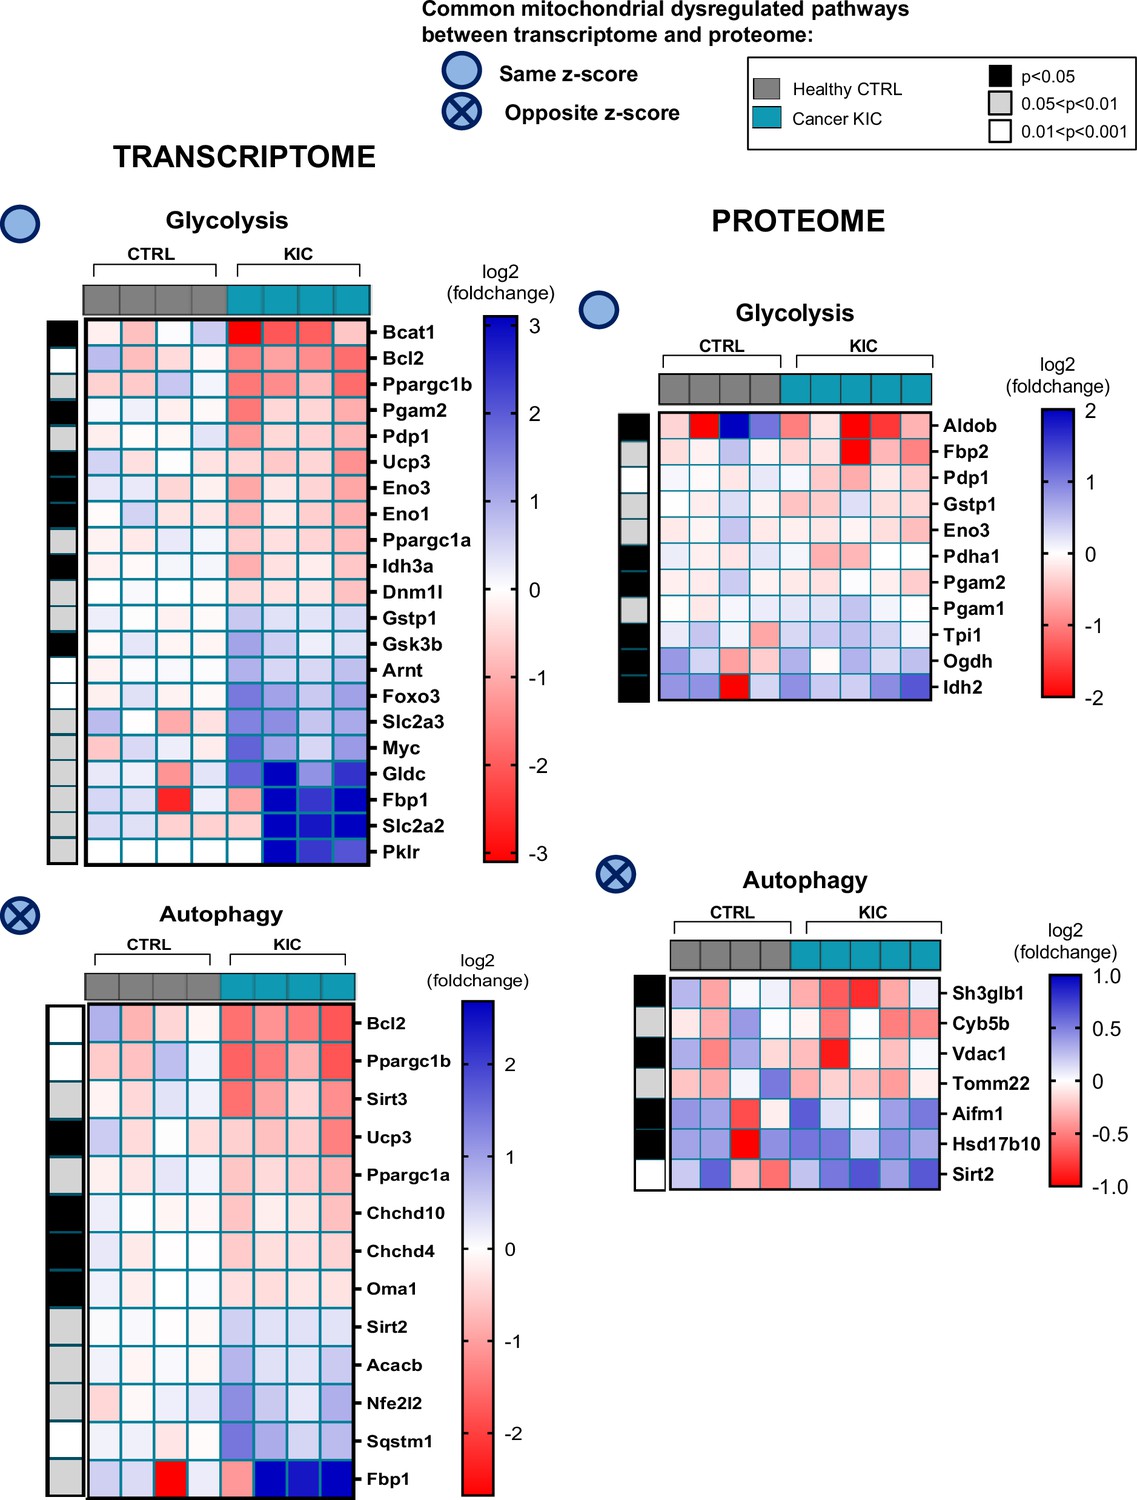
Common mitochondrial dysregulated pathways between transcriptomic and proteomic analyses (related to Figures 6 and 7).
Heatmaps corresponding to the differential pathways, glycolysis and autophagy, in transcriptome (left) and proteome (right) analyses.
Tables
Table 1
Comparison of mitoXplorer heatmaps for transcriptomics and proteomics analyses (related to Figure 6—figure supplement 4, Figure 7—figure supplement 4).
| Regulation in KIC muscle versus control | Genes/proteins | Pathways |
|---|---|---|
| Upregulated both in transcriptomics and proteomics analyses | Sirt2 | Mitochondrial signaling |
| Downregulated both in transcriptomics and proteomics analyses | Eno3 Pgam2 Mrpl19 Dlst Pdp1 Dnaja1 Cyb5b | Glycolysis Glycolysis Translation Tricarboxylic acid cycle Pyruvate metabolism Protein stability and degradation Metabolism of vitamins and cofactors |
| Upregulated in transcriptomics and downregulated in proteomics analyses | Pcca Gpx4 Gstp1 Aldh7a1 Aldh1l1 | Amino acid metabolism ROS defense ROS defense Pyruvate metabolism Folate and pterin metabolism |
| Downregulated in transcriptomics and upregulated in proteomics analyses | Mrpl45 Coq3 Nme1 | Translation Ubiquinone biosynthesis Nucleotide metabolism |
Additional files
Download links
A two-part list of links to download the article, or parts of the article, in various formats.
Downloads (link to download the article as PDF)
Open citations (links to open the citations from this article in various online reference manager services)
Cite this article (links to download the citations from this article in formats compatible with various reference manager tools)
Integrative study of skeletal muscle mitochondrial dysfunction in a murine pancreatic cancer-induced cachexia model
eLife 13:RP93312.
https://doi.org/10.7554/eLife.93312.2


