Spatial and temporal pattern of structure–function coupling of human brain connectome with development
- State Key Laboratory of Cognitive Neuroscience and Learning & IDG/McGovern Institute for Brain Research, Beijing Normal University, China
- BABRI Centre, Beijing Normal University, China
- Beijing Key Laboratory of Brain Imaging and Connectomics, Beijing Normal University, China
- School of Computer Science and Engineering, Beihang University, China
Figures
Figure 1 with 1 supplement
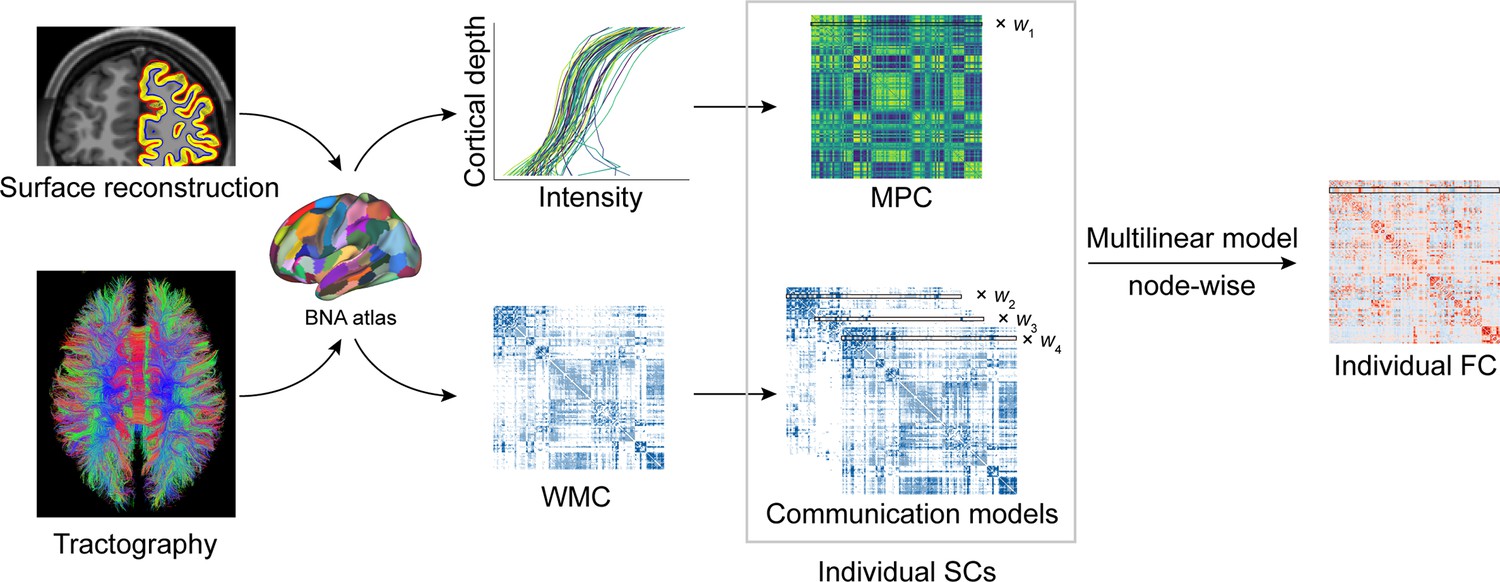
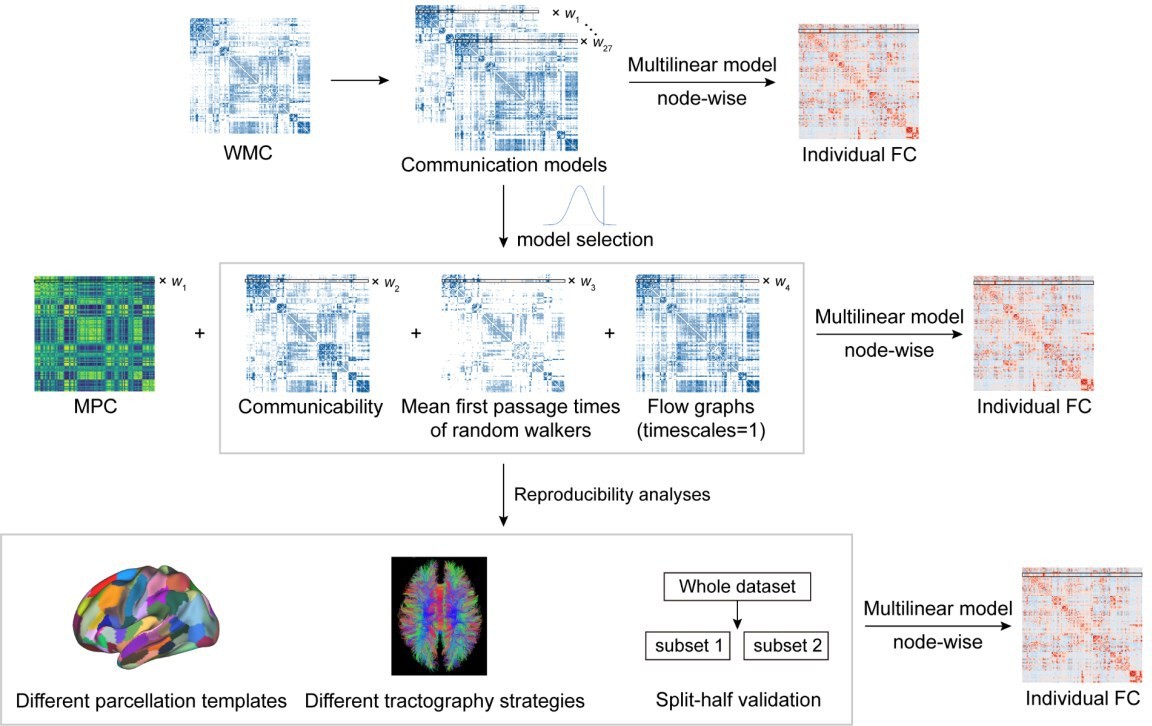
Structural connectome–functional connectome (SC–FC) coupling framework.
The framework used to quantify nodal SC–FC coupling in the human brain. The microstructure profile covariance (MPC) was used to map similarity networks of intracortical microstructure (voxel intensity sampled in different cortical depth) for each cortical node. The white matter connectome (WMC) represents the extracortical excitatory projection structure, and communication models were then constructed to represent the complex process of communication. A multilinear model was constructed to examine the association of individual nodewise SC (MPC and communication models) profiles with FC profiles.
Figure 1—figure supplement 1
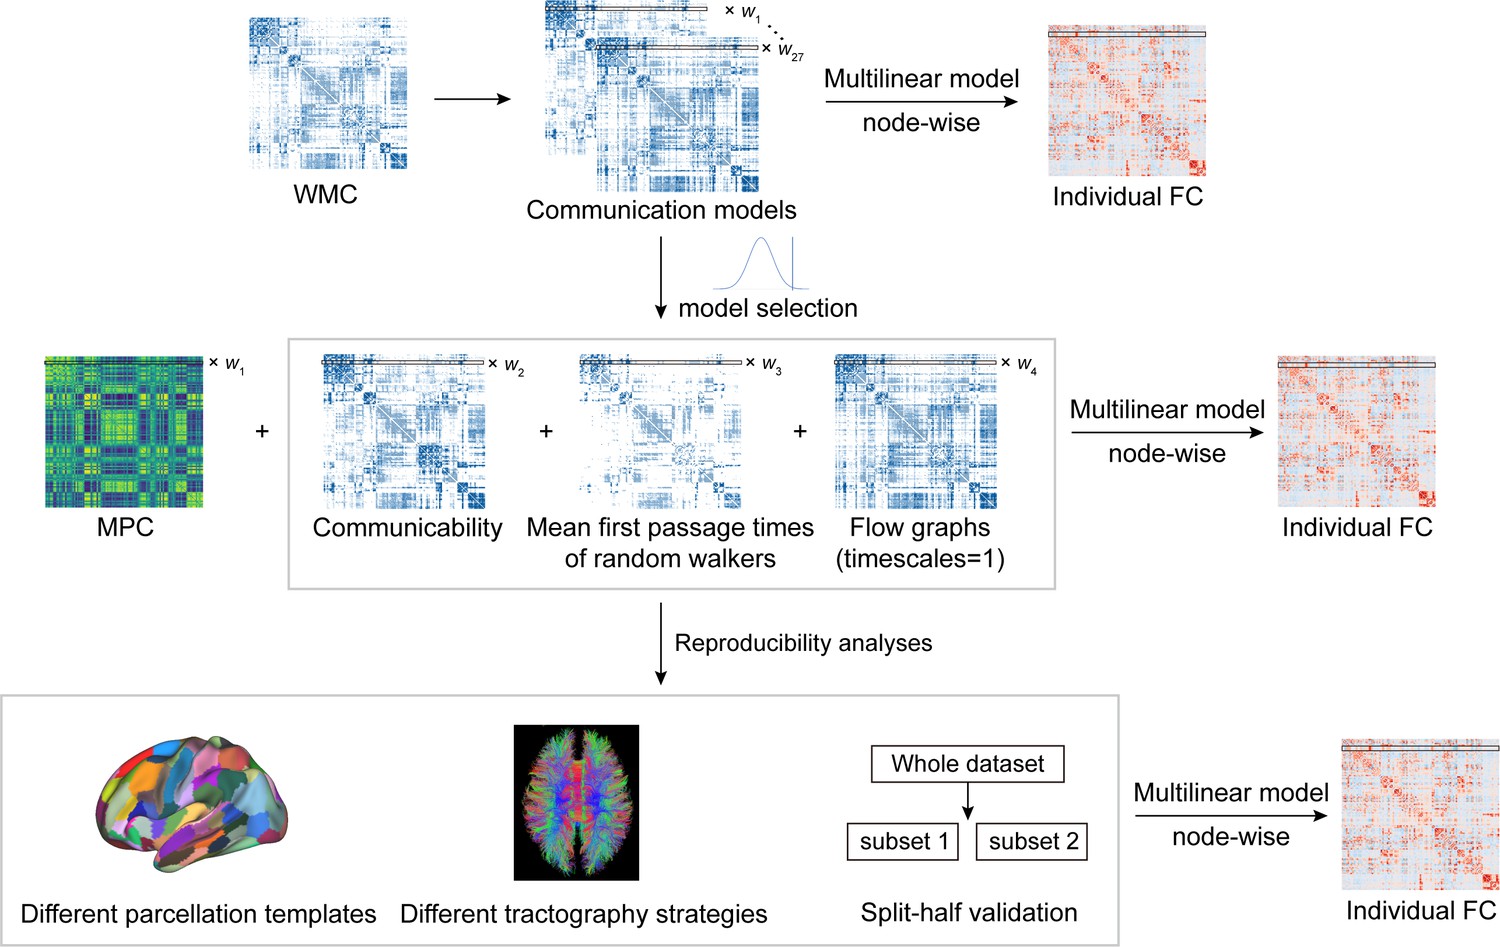
Pipeline of communication model selection and reproducibility analyses.
Figure 2 with 1 supplement
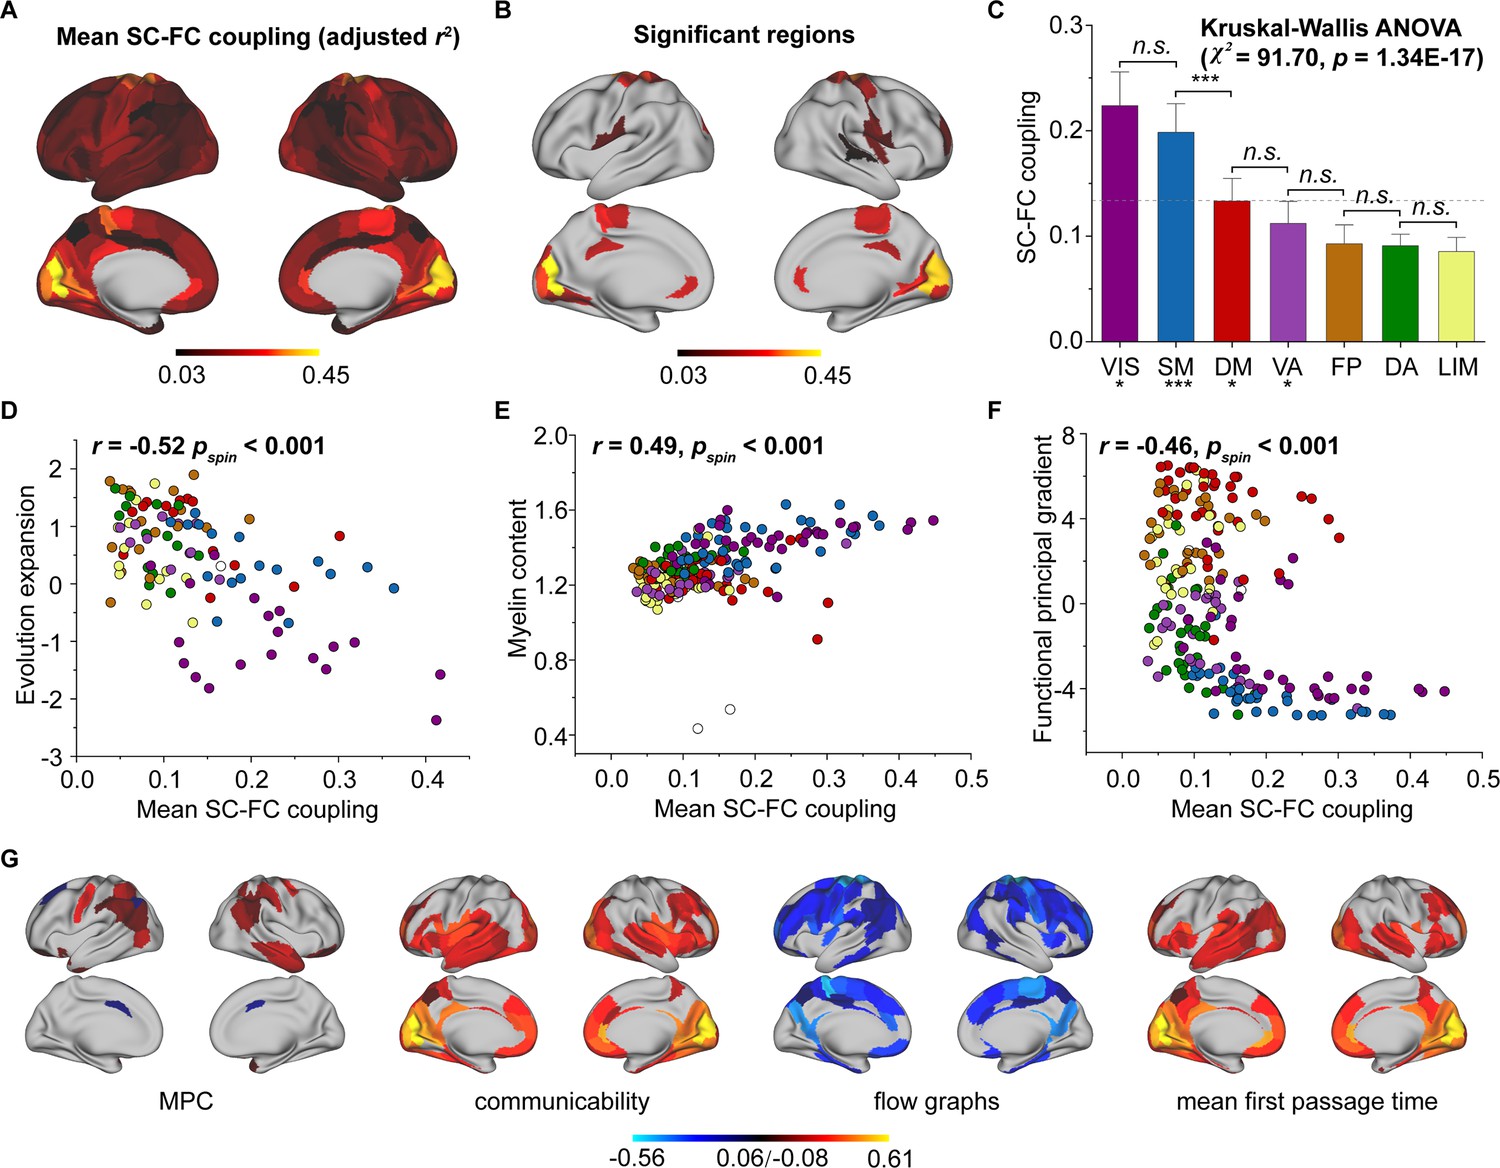
Cortical structural connectome–functional connectome (SC–FC) coupling in young individuals.
(A) Spatial pattern of SC–FC coupling. (B) Spatial patterns with significant predictions (p < 0.05, spin test). (C) SC–FC coupling comparisons among functional networks. The error bars represent 95% confidence intervals (n = 210). (D–F) SC–FC coupling aligns with evolution expansion, myelin content, and functional principal gradient. (G) Preferential contributions of cortical regions across different structural connections. Note: ***p < 0.001; *p < 0.05; n.s.: p > 0.05. VIS, visual network; SM, somatomotor network; DA, dorsal attention network; VA, ventral attention network; LIM, limbic network; FP, frontoparietal network; DM, default mode network.
Figure 2—figure supplement 1
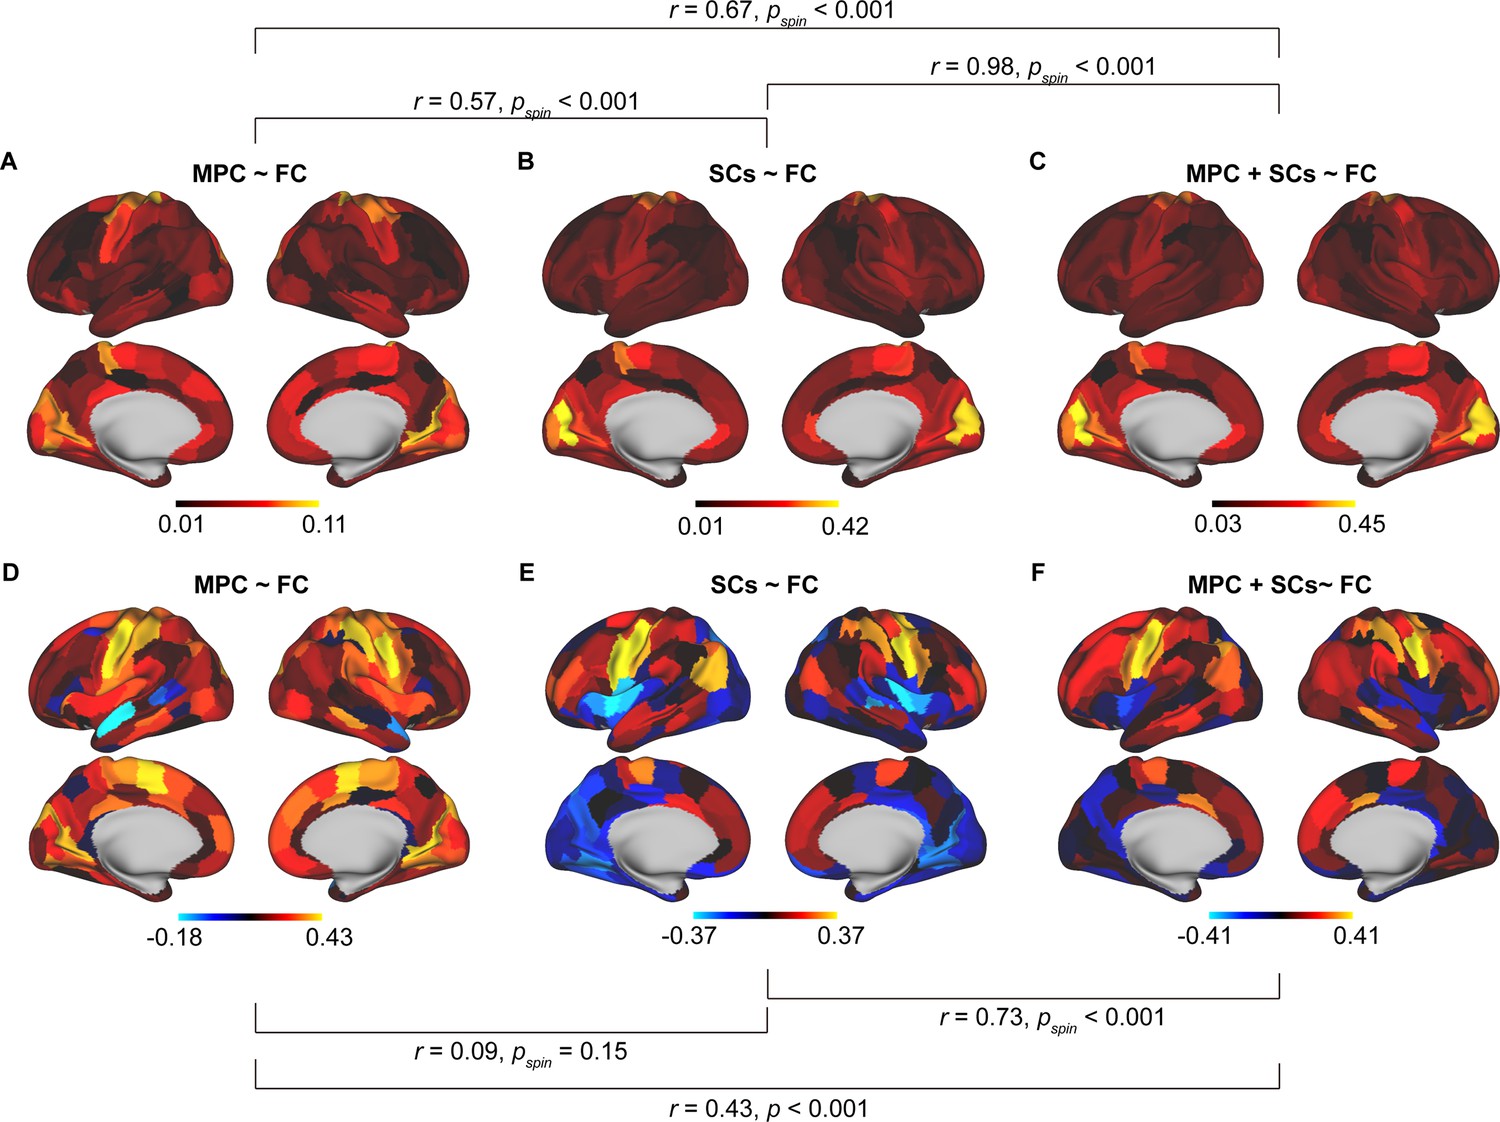
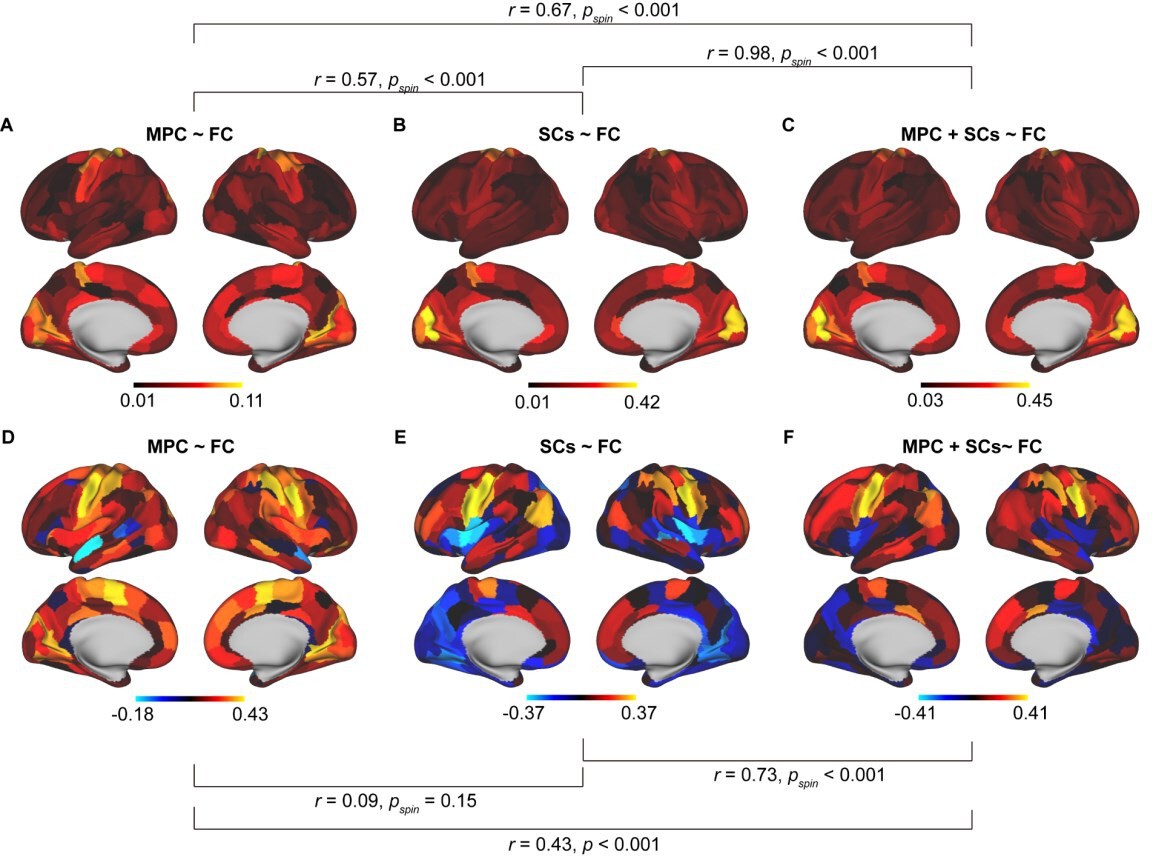
Comparison results between different models.
Spatial pattern of mean structural connectome–functional connectome (SC–FC) coupling based on microstructure profile covariance (MPC) ~ FC (A), SCs ~ FC (B), and MPC + SCs ~ FC (C). Correlation of age with SC–FC coupling across cortex based on MPC ~ FC (D), SCs ~ FC (E), and MPC + SCs ~ FC (F).
Figure 3 with 4 supplements
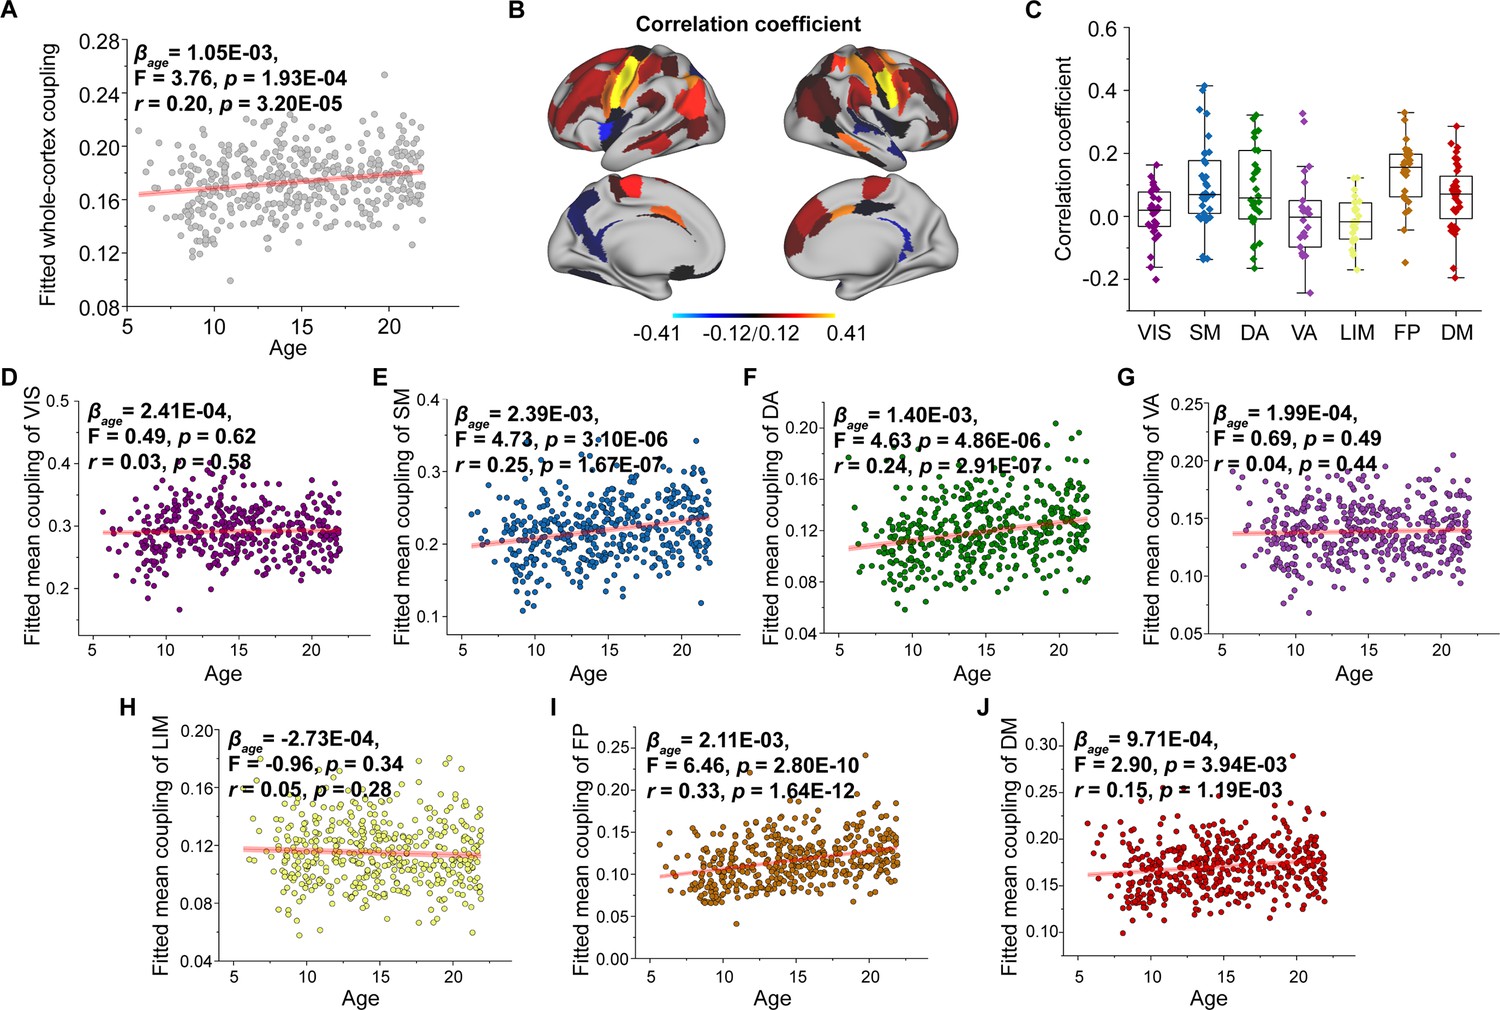
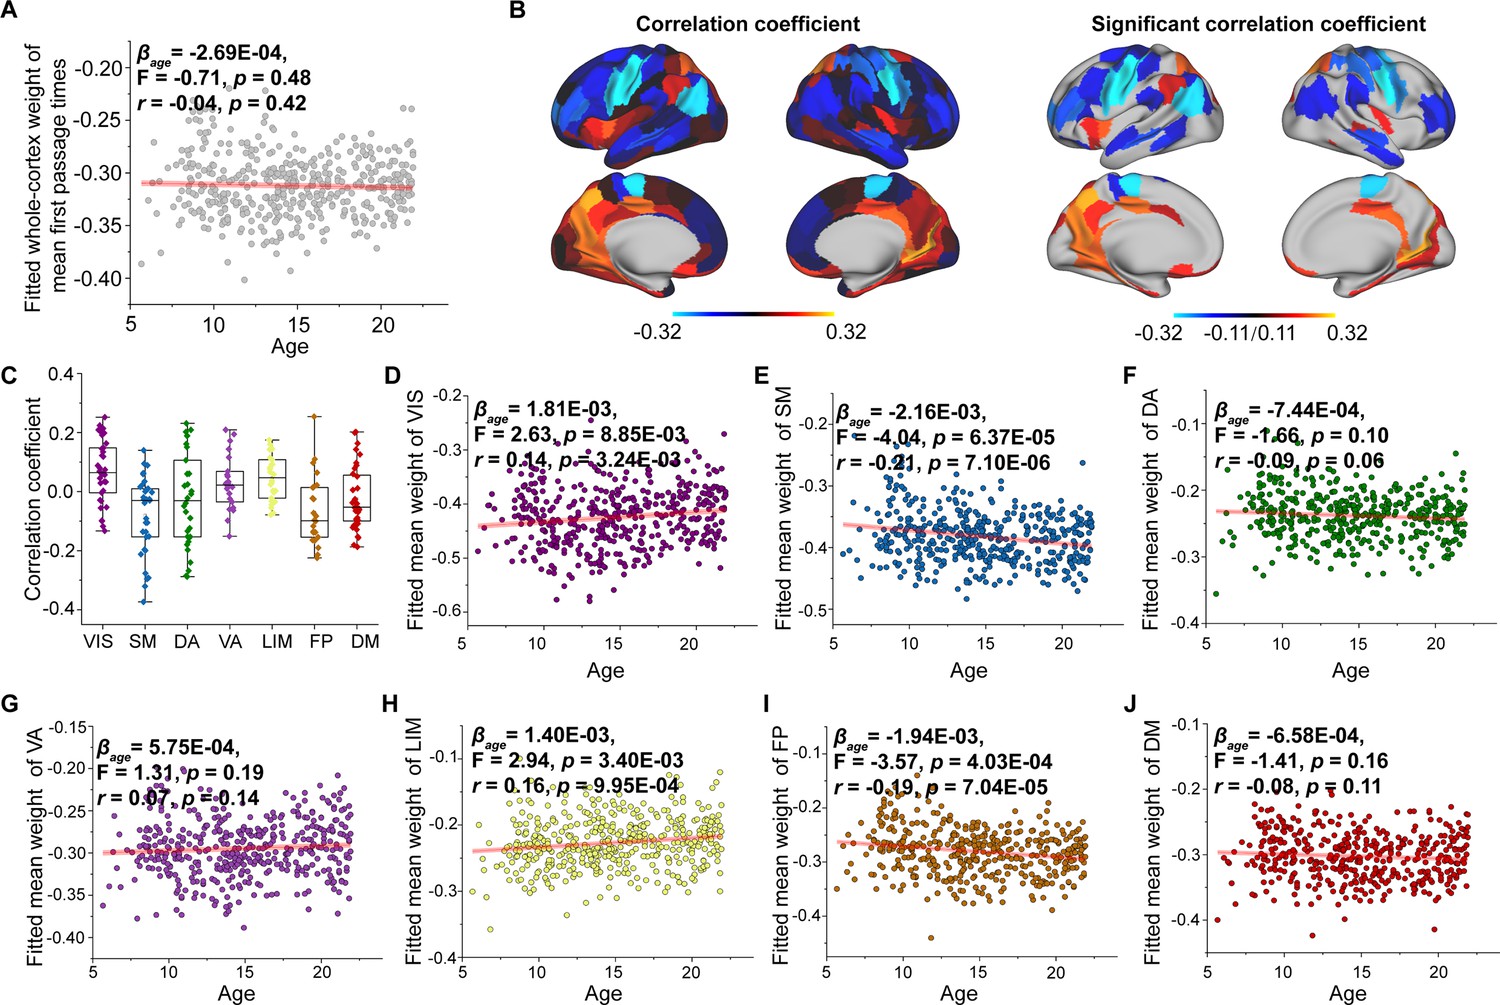
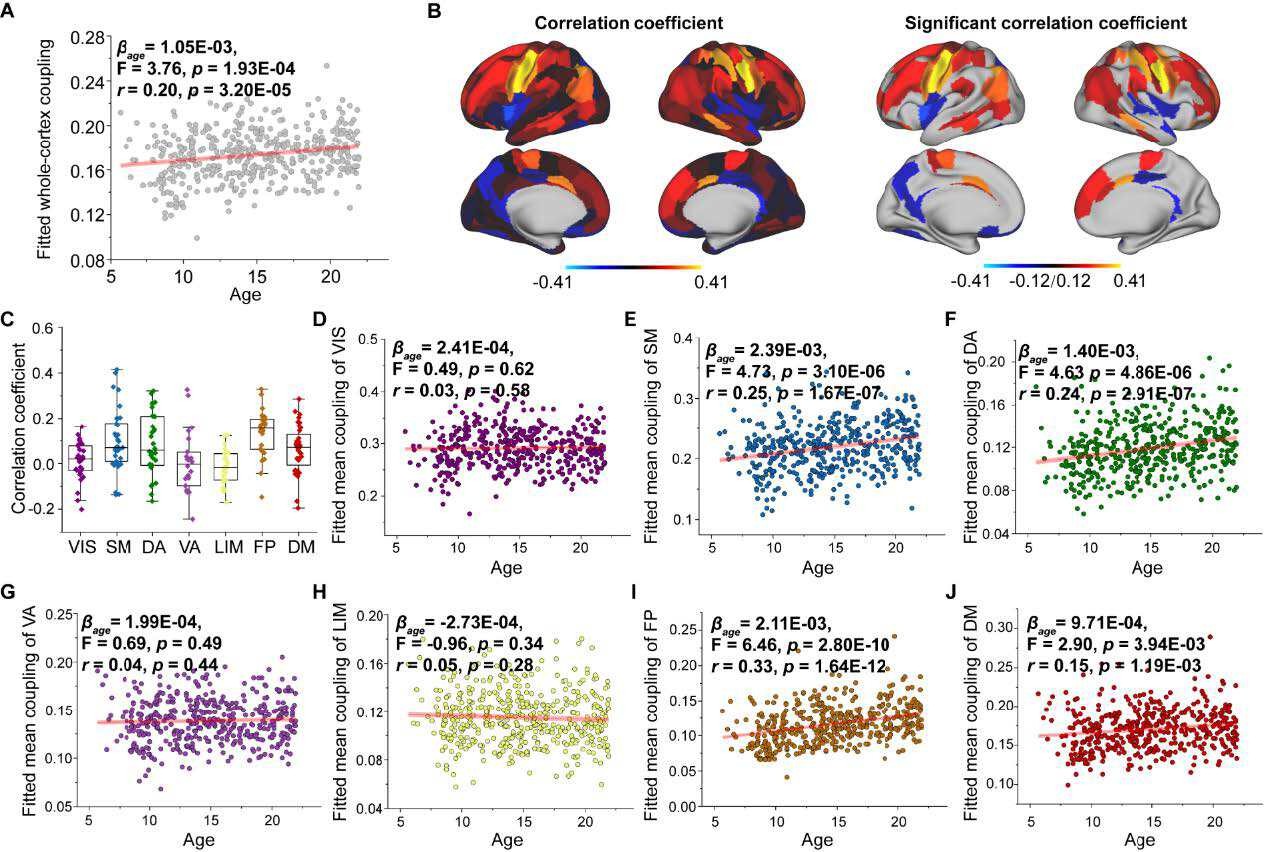
Age-related changes in structural connectome–functional connectome (SC–FC) coupling.
(A) Increases in whole-brain coupling with age. (B) Correlation of age with SC–FC coupling across all regions and significant regions (p < 0.05, FDR corrected). (C) Comparisons of age-related changes in SC–FC coupling among functional networks. Each point represents a brain region (n = 210). The boxes show the median and interquartile range (IQR; 25–75%), and the whiskers depict 1.5 × IQR from the first or third quartile. (D–J) Correlation of age with SC–FC coupling across the VIS, SM, DA, VA, LIM, FP, and DM. VIS, visual network; SM, somatomotor network; DA, dorsal attention network; VA, ventral attention network; LIM, limbic network; FP, frontoparietal network; DM, default mode network.
Figure 3—figure supplement 1
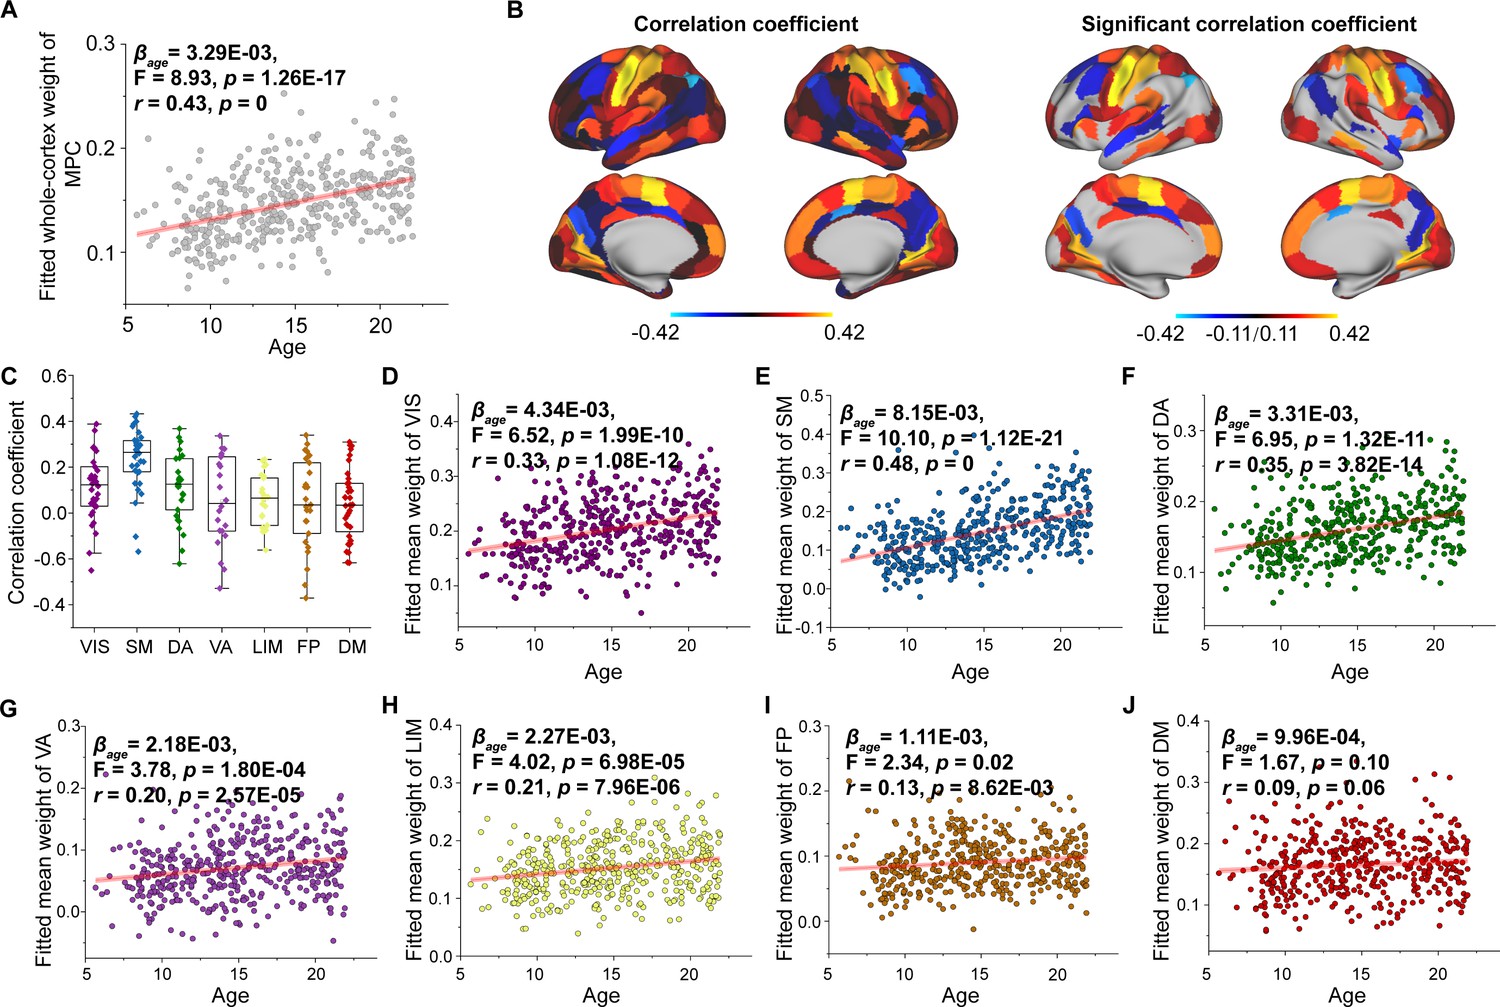
Age-related changes in microstructure profile covariance (MPC) weight.
(A) Increases in MPC weight across the whole brain with age. (B) Correlation of age with MPC weight across significant regions (p < 0.05, FDR corrected). (C) Comparison of changes in MPC weight among functional subnetworks. Each point represents a brain region (n = 210). The boxes show the median and interquartile range (IQR; 25–75%), and the whiskers depict 1.5 × IQR from the first or third quartile. (D–J) Correlation of age with MPC weight across the VIS, SM, DA, VA, LIM, FP, and DM. VIS, visual network; SM, somatomotor network; DA, dorsal attention network; VA, ventral attention network; LIM, limbic network; FP, frontoparietal network; DM, default mode network.
Figure 3—figure supplement 2
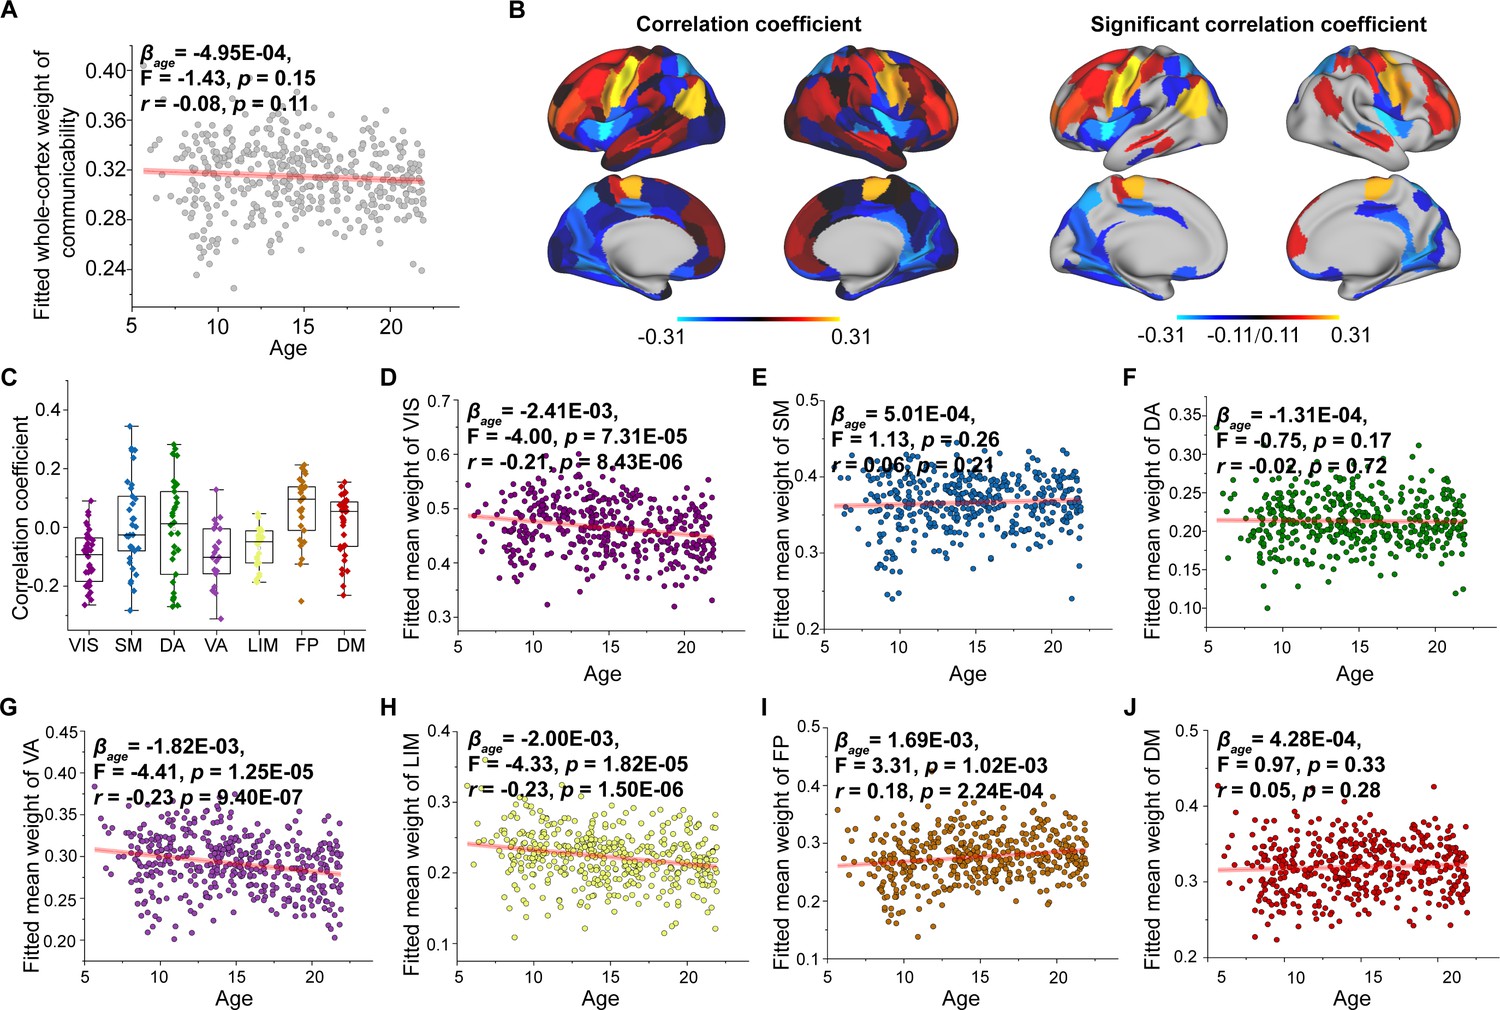
Age-related changes in communicability weight.
(A) Increases in communicability weight across the whole brain with age. (B) Correlation of age with communicability weight across significant regions (p < 0.05, FDR corrected). (C) Comparison of changes in communicability weight among functional subnetworks. Each point represents a brain region (n = 210). The boxes show the median and interquartile range (IQR; 25–75%), and the whiskers depict 1.5 × IQR from the first or third quartile. (D–J) Correlation of age with communicability weight across the VIS, SM, DA, VA, LIM, FP, and DM. VIS, visual network; SM, somatomotor network; DA, dorsal attention network; VA, ventral attention network; LIM, limbic network; FP, frontoparietal network; DM, default mode network.
Figure 3—figure supplement 3
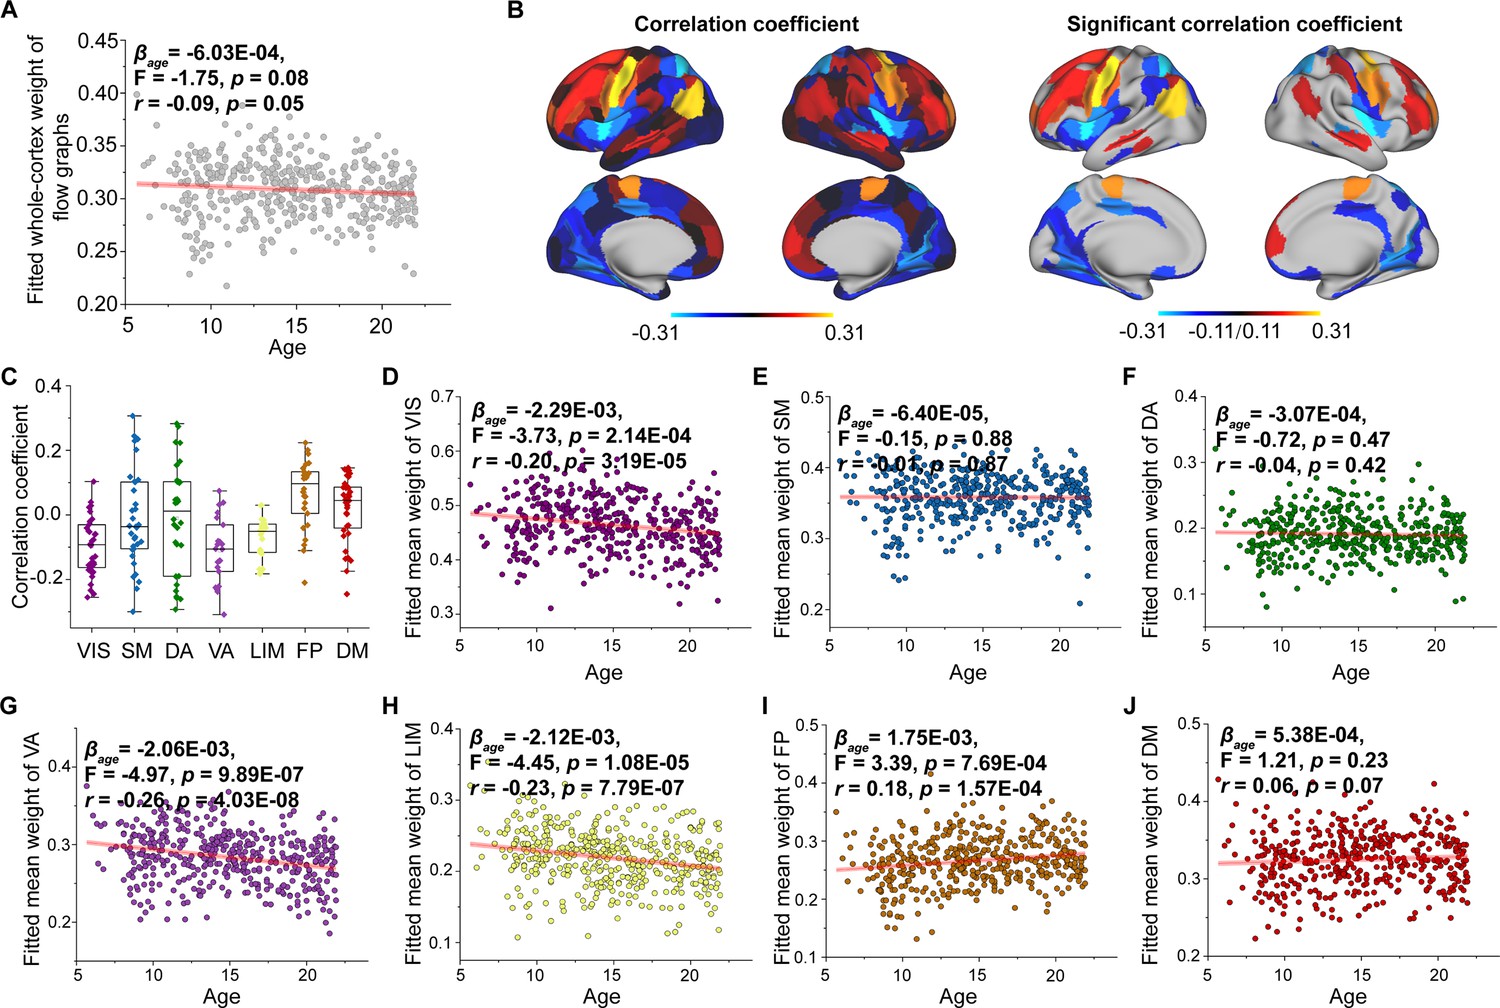
Age-related changes in flow graph weight.
(A) Increases in flow graph weight across the whole brain with age. (B) Correlation of age with flow graph weight across significant regions (p < 0.05, FDR corrected). (C) Flow graphs of changes in weight among functional networks. Each point represents a brain region (n = 210). The boxes show the median and interquartile range (IQR; 25–75%), and the whiskers depict 1.5 × IQR from the first or third quartile. (D–J) Correlation of age with flow graph weight across the VIS, SM, DA, VA, LIM, FP, and DM. VIS, visual network; SM, somatomotor network; DA, dorsal attention network; VA, ventral attention network; LIM, limbic network; FP, frontoparietal network; DM, default mode network.
Figure 3—figure supplement 4
Age-related changes in the weight of the mean first-passage time.
(A) Increases in the weight of the mean first-passage time across the whole brain with age. (B) Correlation of age with mean first-passage time weight across significant regions (p < 0.05, FDR corrected). (C) Comparison of changes in mean first-passage time weight among functional networks. Each point represents a brain region (n = 210). The boxes show the median and interquartile range (IQR; 25–75%), and the whiskers depict 1.5 × IQR from the first or third quartile. (D–J) Correlation of age with mean first-passage time weight across the VIS, SM, DA, VA, LIM, FP, and DM. VIS, visual network; SM, somatomotor network; DA, dorsal attention network; VA, ventral attention network; LIM, limbic network; FP, frontoparietal network; DM, default mode network.
Figure 4 with 1 supplement
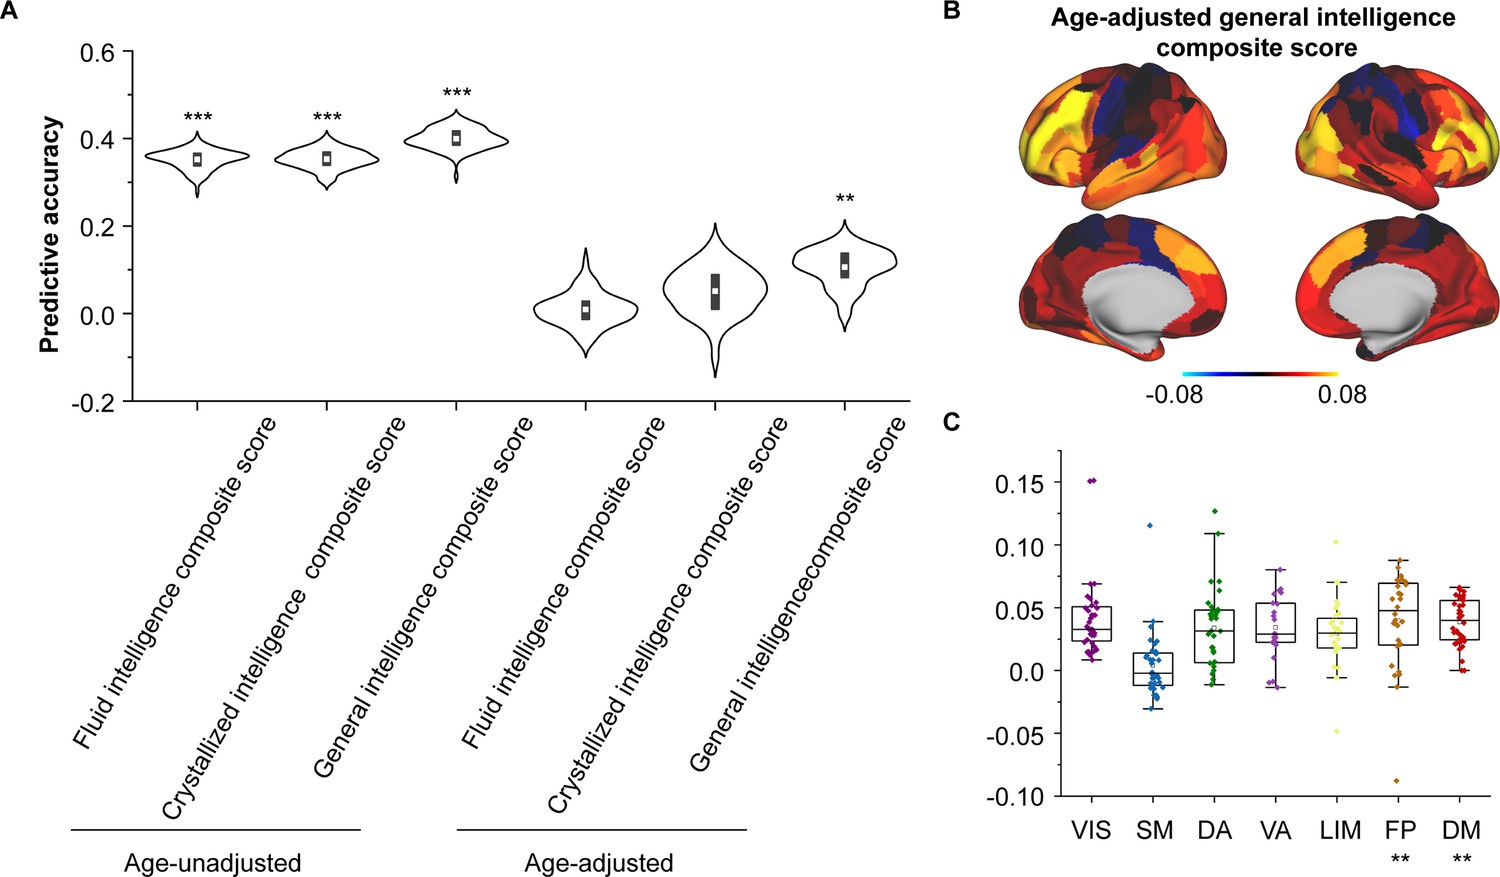
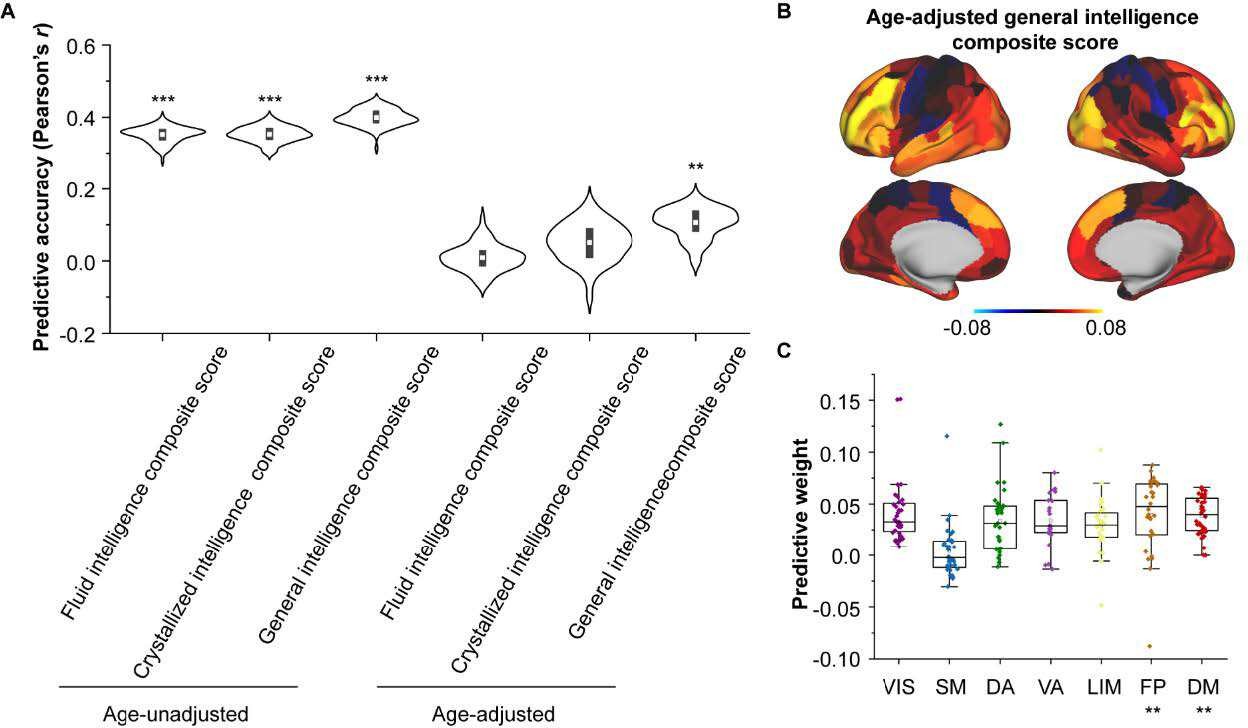
Encoding individual differences in intelligence using regional structural connectome–functional connectome (SC–FC) coupling.
(A) Predictive accuracy of fluid, crystallized, and general intelligence composite scores. (B) Regional distribution of predictive weight. (C) Predictive contribution of functional networks. Each point represents a brain region (n = 210). The boxes show the median and interquartile range (IQR; 25–75%), and the whiskers depict the 1.5 × IQR from the first or third quartile. Note: ***p < 0.001; **p < 0.01.
Figure 4—figure supplement 1
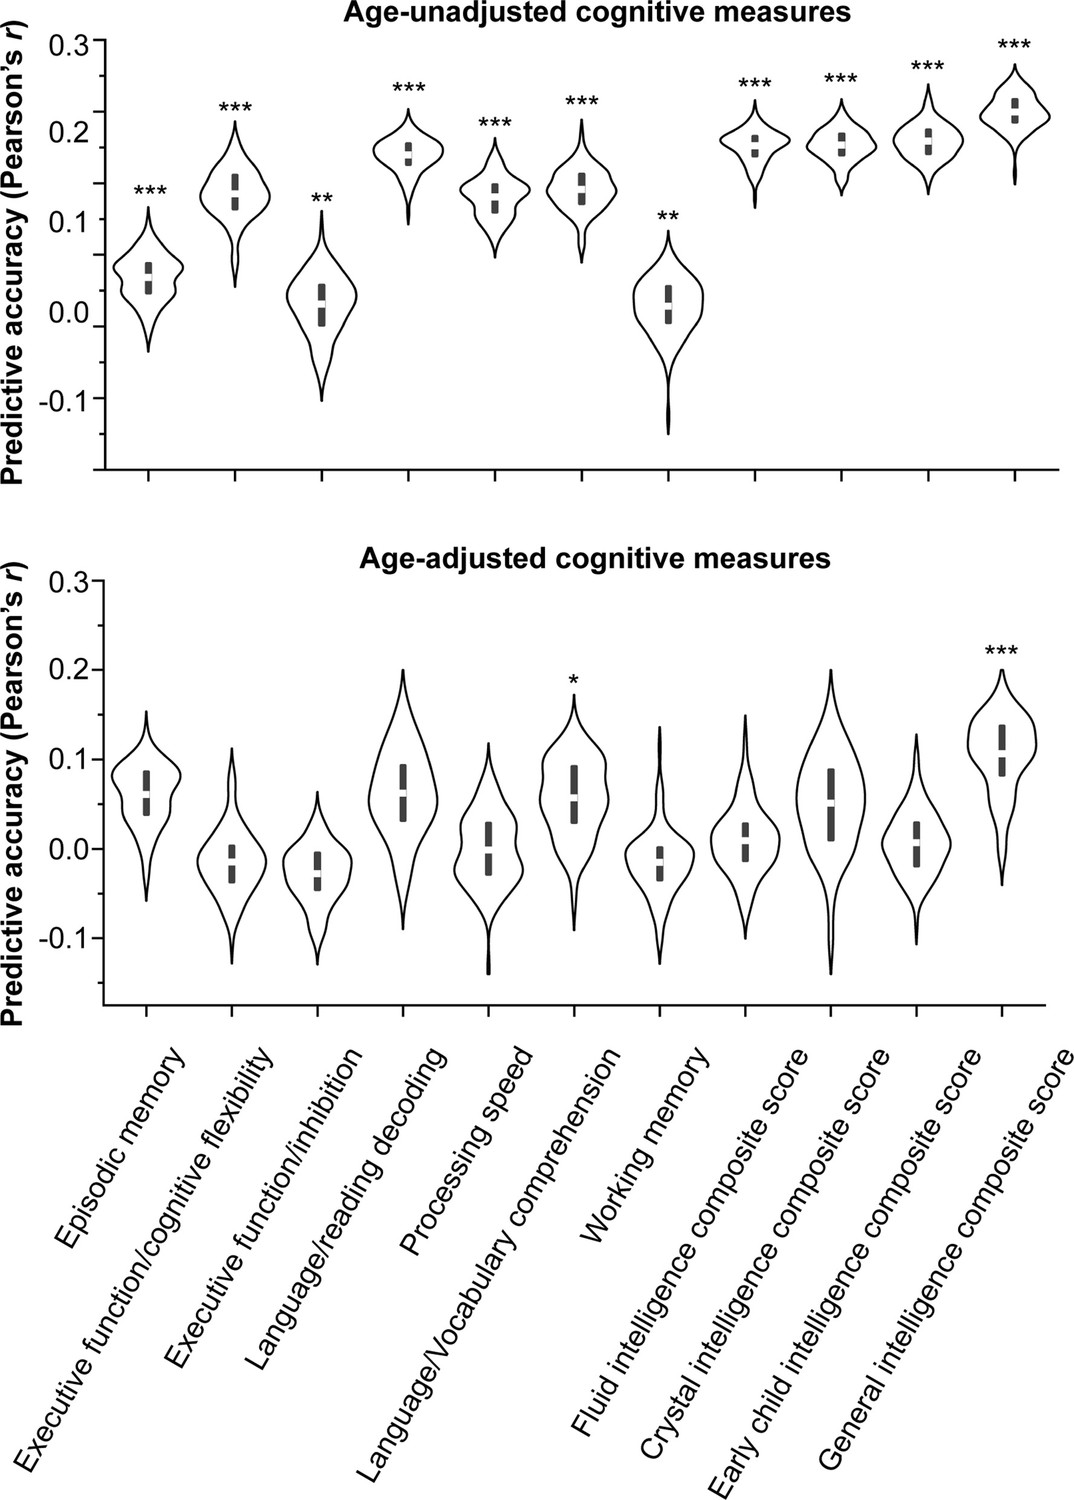
Predictive accuracy of regional structural connectome–functional connectome (SC–FC) coupling across cognitive measures.
The top panel shows the predictive accuracy of regional SC–FC coupling across cognitive measures not adjusted for age, and the bottom panel shows the predictive accuracy across age-adjusted cognitive measures. Note: ***p < 0.001; **p < 0.01; *p < 0.05.
Figure 5 with 1 supplement
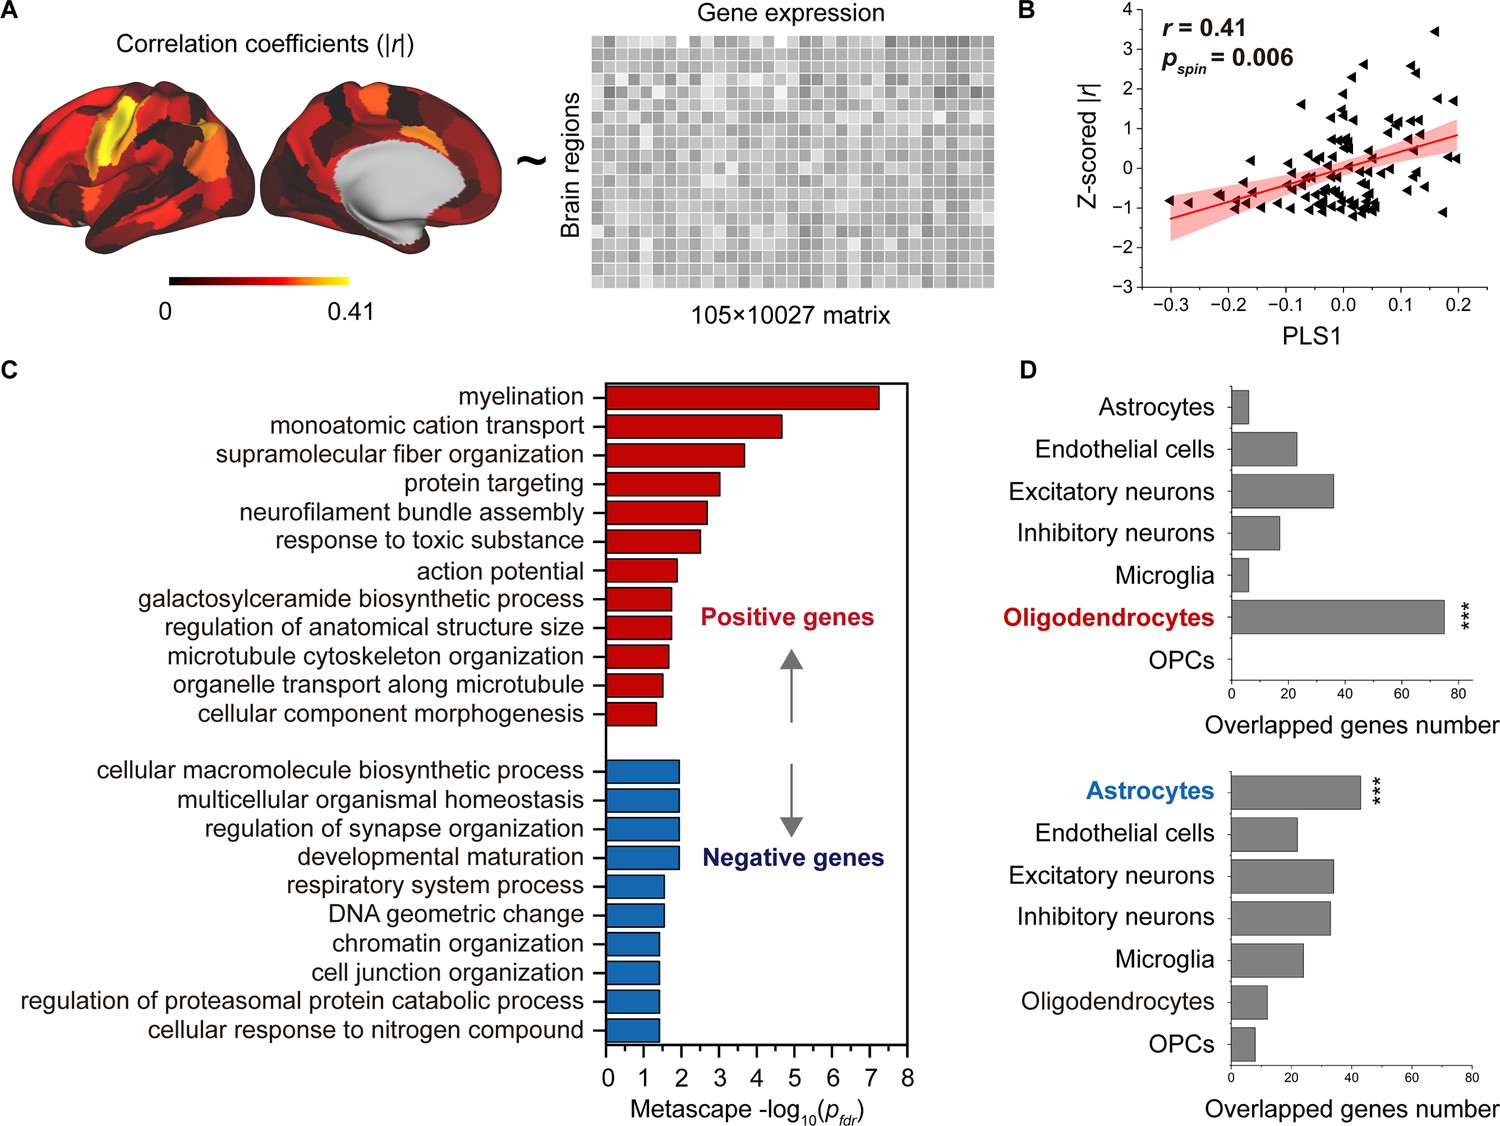
Association between developmental changes in structural connectome–functional connectome (SC–FC) coupling and gene transcriptional profiles.
(A) The map of developmental changes (absolute value of correlation coefficients) in SC–FC coupling across 105 left brain regions (left panel), and the normalized gene transcriptional profiles containing 10,027 genes in 105 left brain regions (right panel). (B) The correlation between developmental changes in SC–FC coupling and the first partial least square component (PLS1) from the PLS regression analysis. (C) Enriched terms of significant genes. (D) Cell type-specific expression of significant genes. Note: pspin: spin test; pfdr: FDR corrected; ***p < 0.001.
Figure 5—figure supplement 1
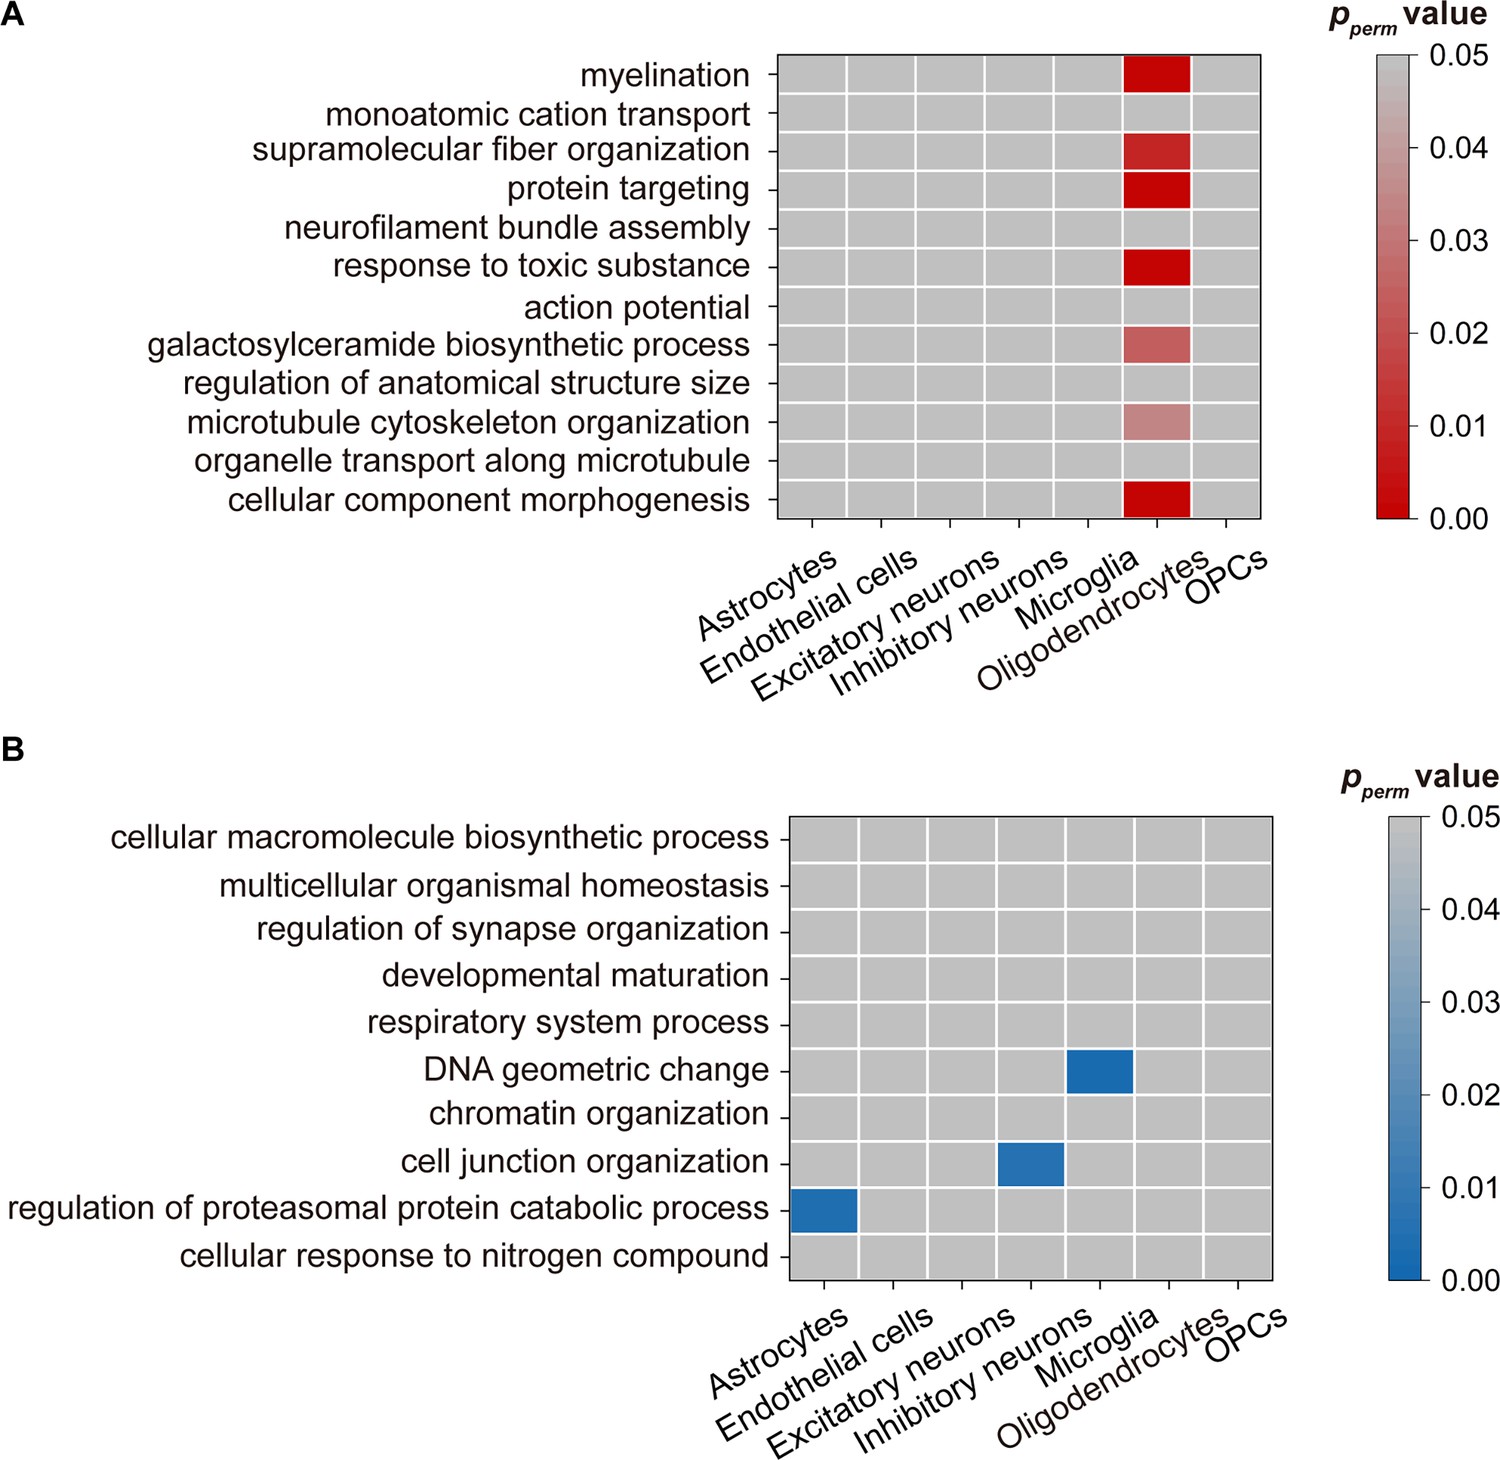
Cell-specific expression in each pathway.
(A) Genes with positive weights. (B) Genes with negative weights. Note: pperm: permutation test.
Figure 6
Reproducibility analyses with different parcellation templates (HCPMMP).
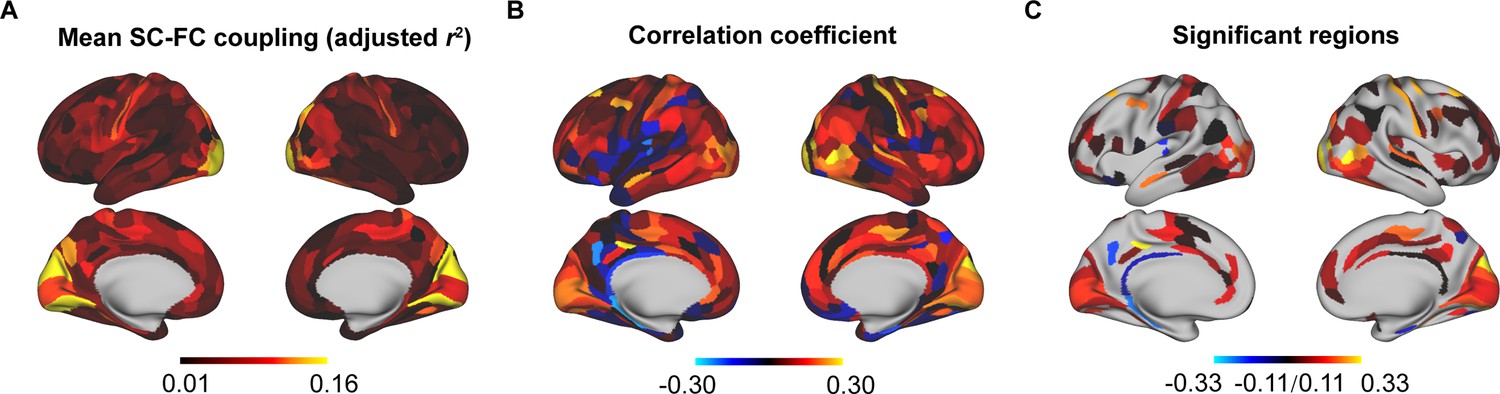
(A) Spatial pattern of structural connectome–functional connectome (SC–FC) coupling. (B) Correlation of age with SC–FC coupling. (C) Correlation of age with SC–FC coupling across significant regions (p < 0.05, FDR corrected).
Figure 7
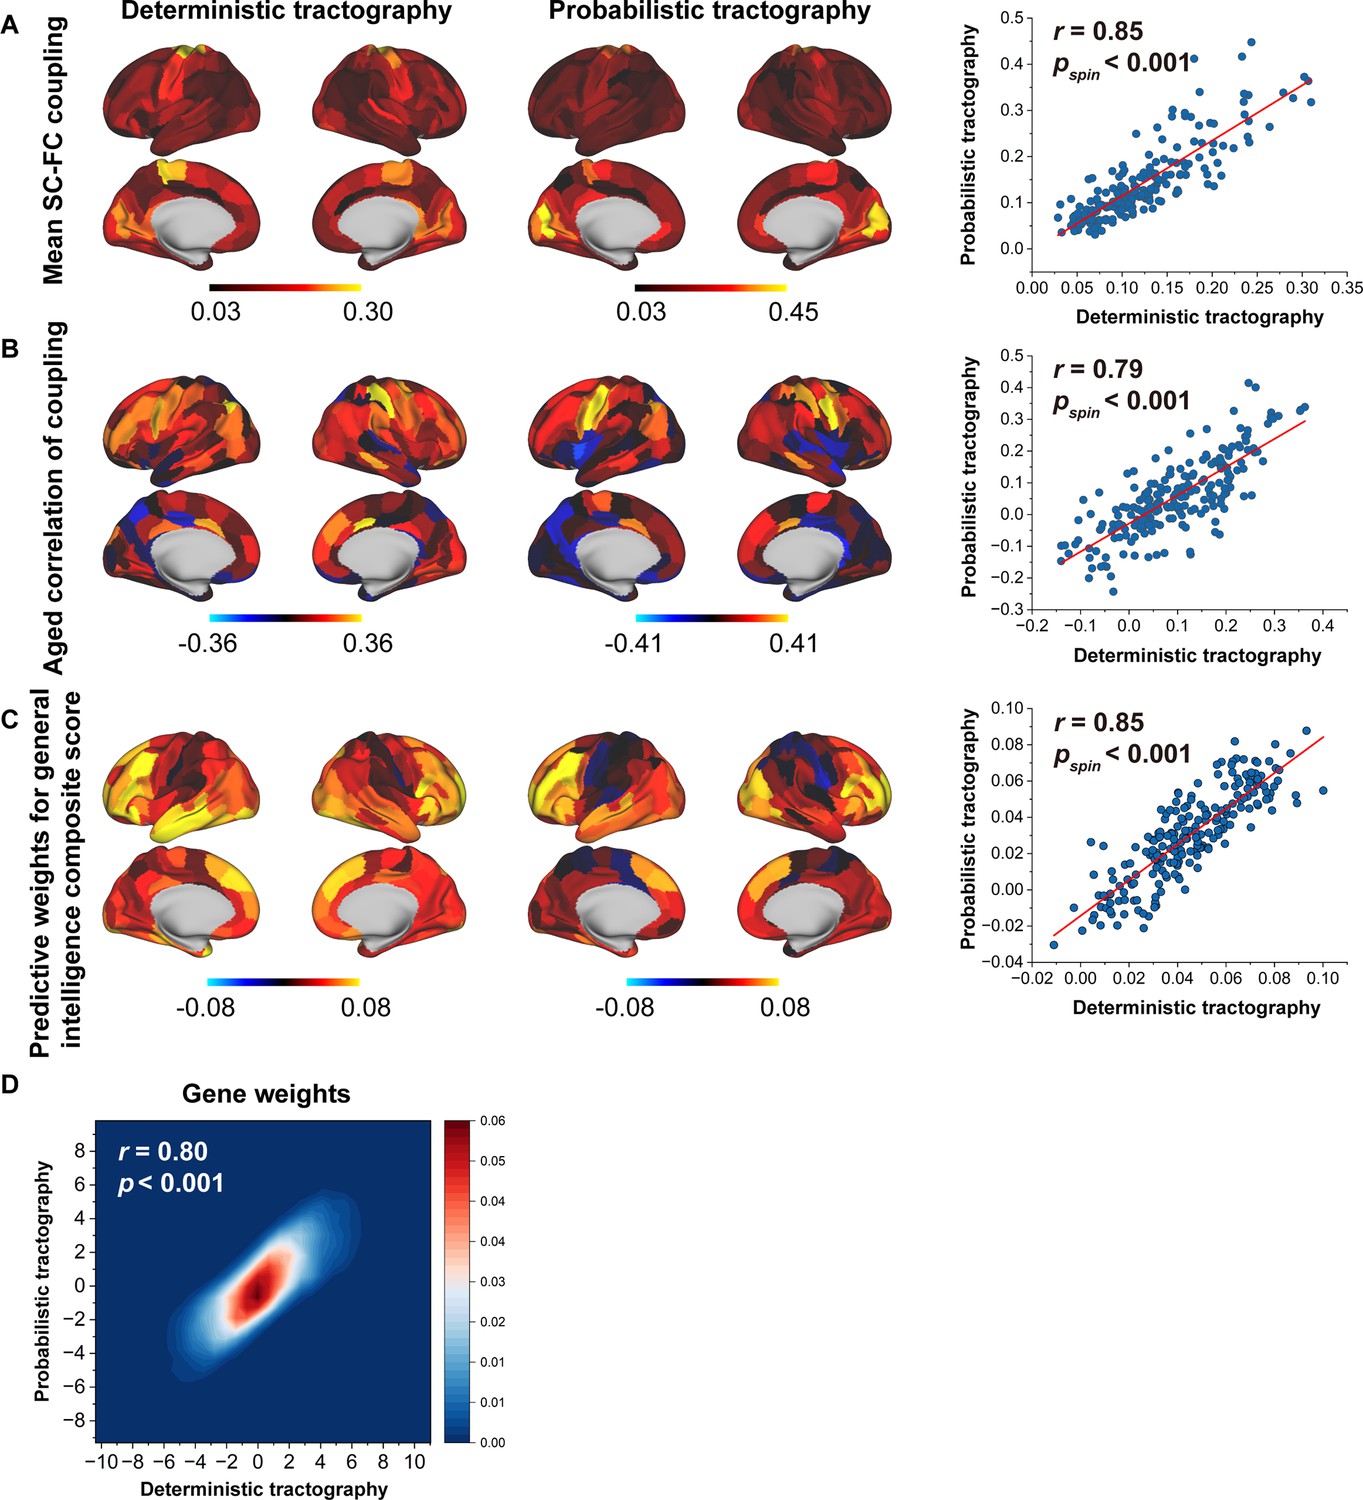
Reproducibility analyses with different tractography strategies.
(A) The consistency of mean structural connectome–functional connectome (SC–FC) coupling between deterministic and probabilistic tractography. (B) The consistency of the correlation between age and SC–FC coupling between deterministic and probabilistic tractography. (C) The consistent predictive weights for the general intelligence composite score between deterministic and probabilistic tractography. (D) The consistency of gene weights between deterministic and probabilistic tractography.
Figure 8
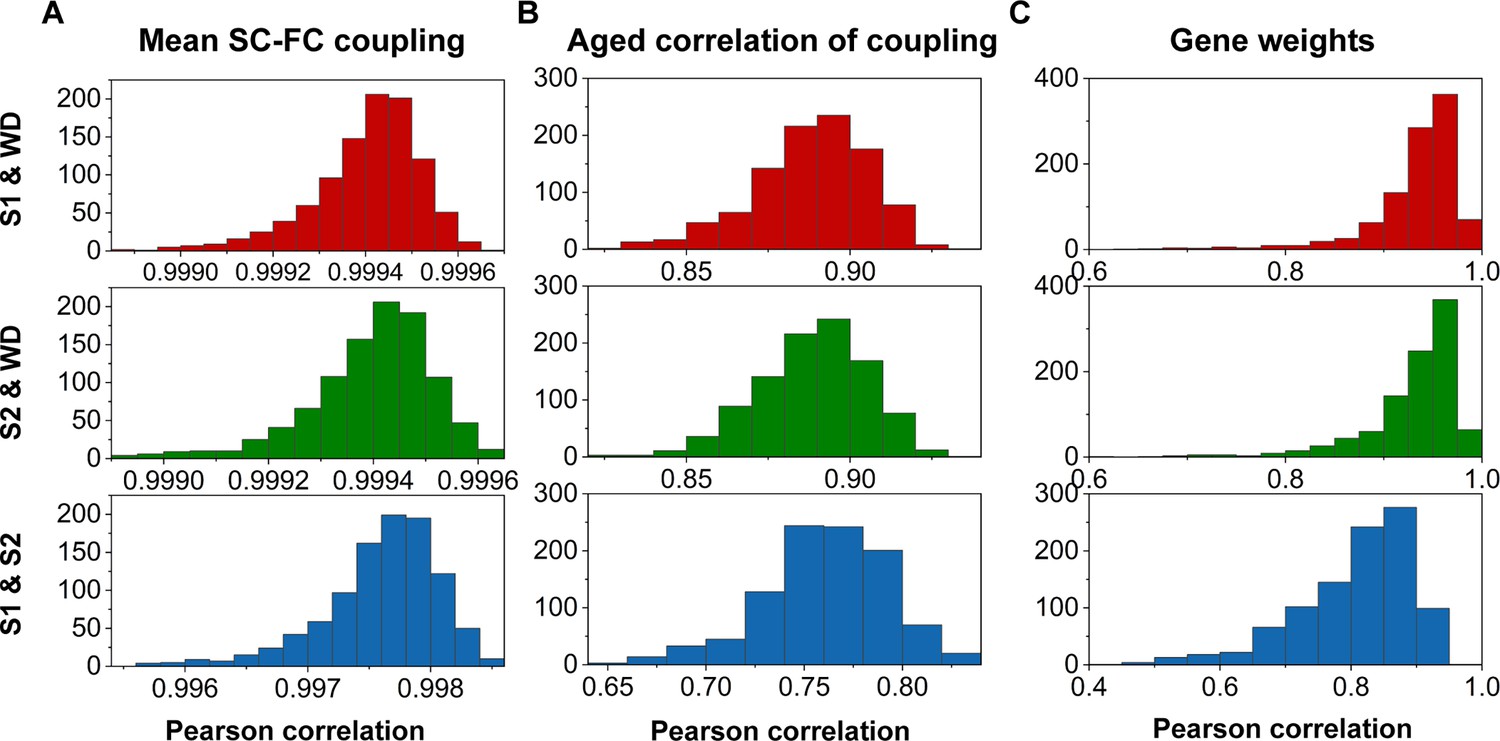
Reproducibility analyses with split-half validation.
(A) The consistency of mean structural connectome–functional connectome (SC–FC) coupling among S1, S2, and the whole dataset (WD). (B) The consistency of the correlation between age and SC–FC coupling among S1, S2, and the WD. (C) Consistent gene weights among S1, S2, and WD.
Figure 9 with 2 supplements
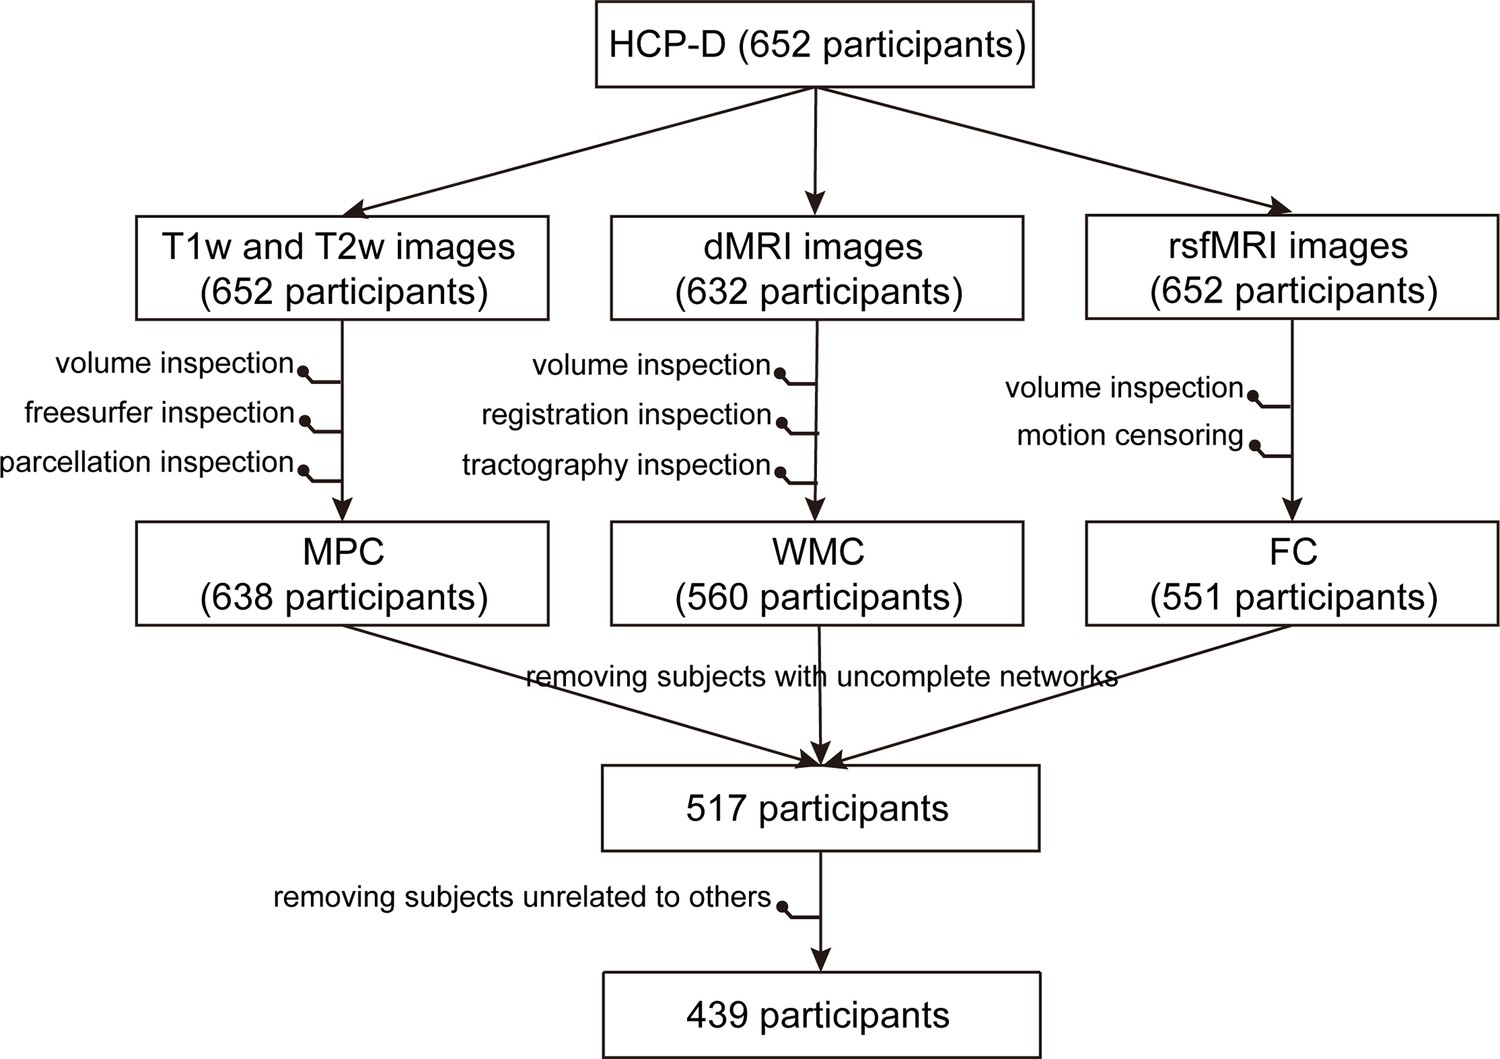
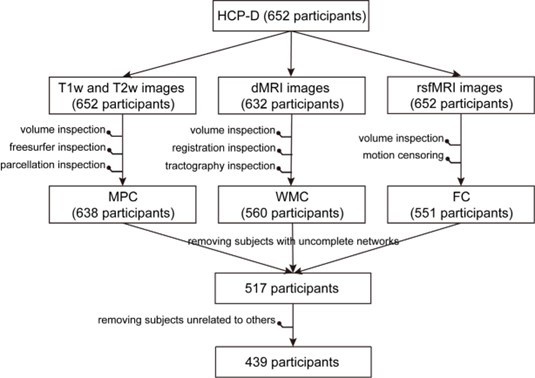
Exclusion of participants in the whole multimodal data processing pipeline.
Figure 9—figure supplement 1
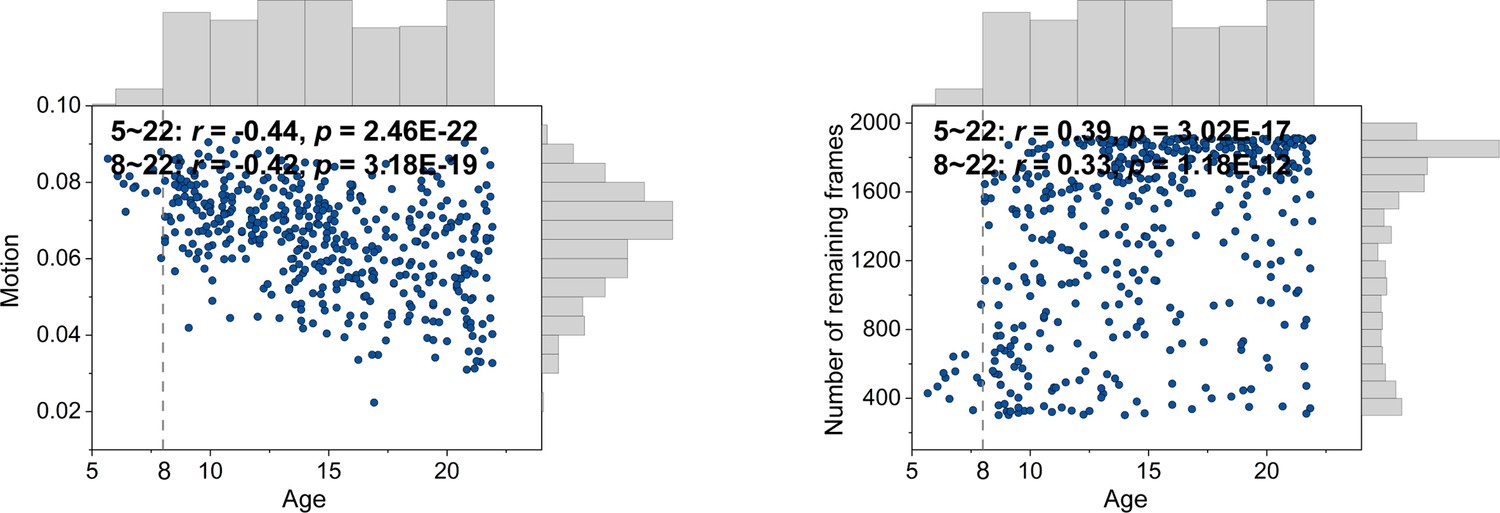
Correlations between motion and age and number of remaining frames and age.
Figure 9—figure supplement 2
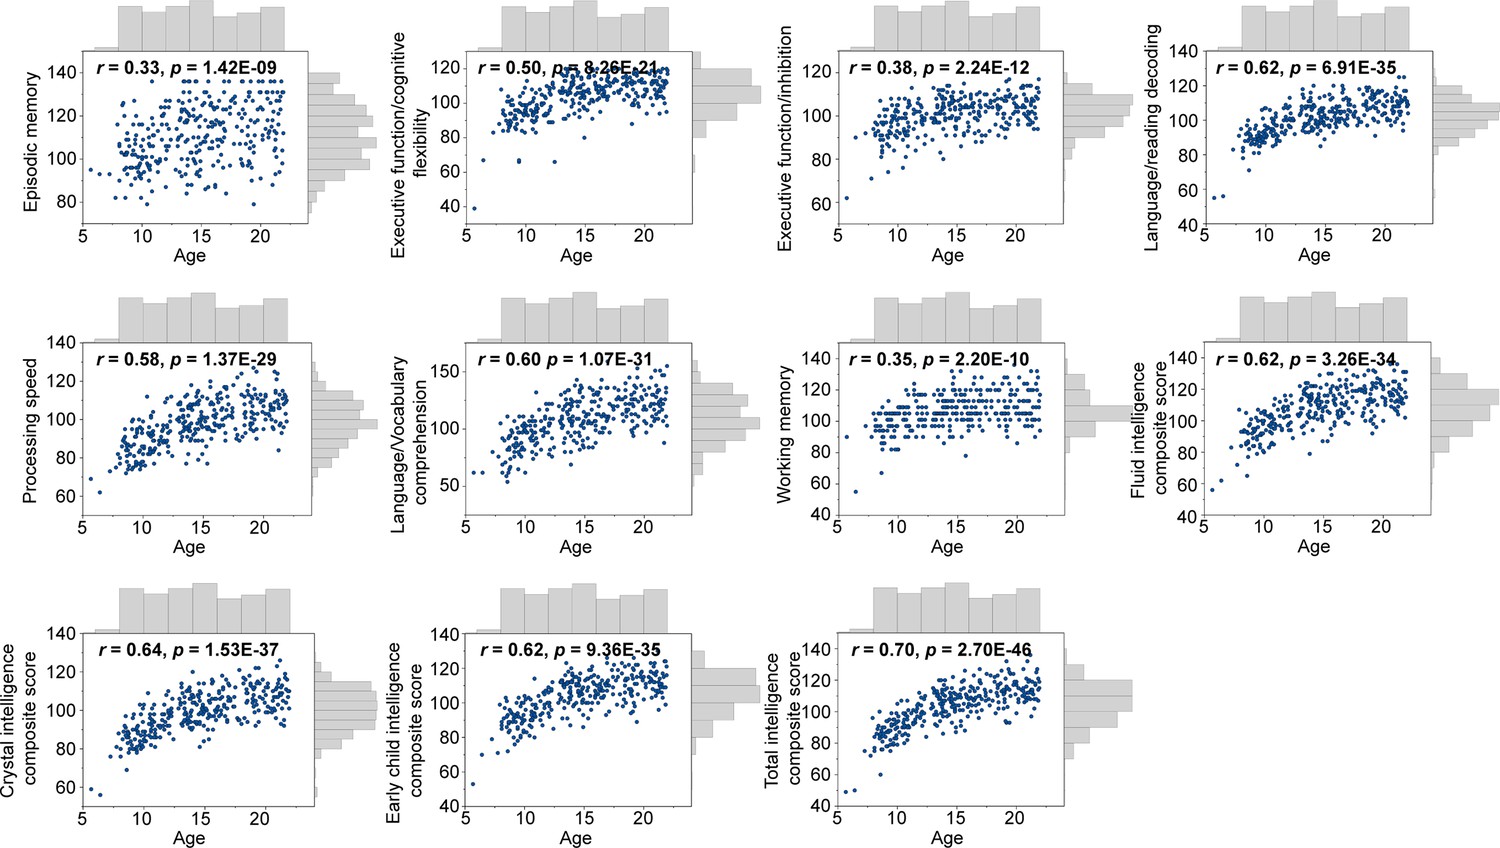
Cognitive scores and age distributions of scans.
Author response image 1
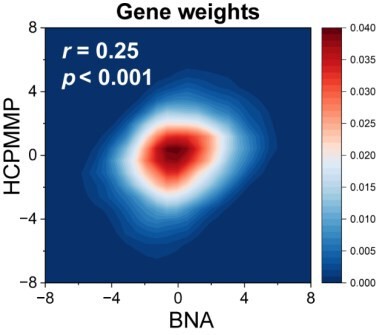
The consistency of gene weights between HCPMMP and BNA.
Author response image 2
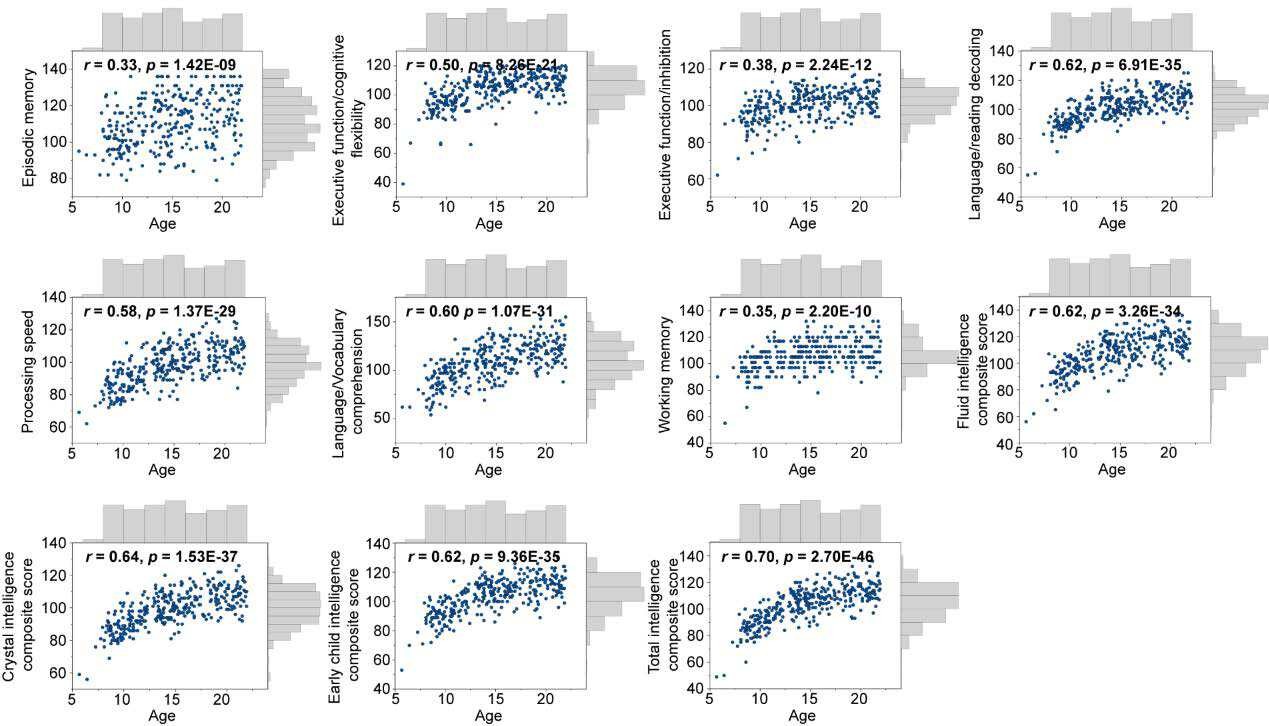
Cognitive scores and age distributions of scans.
Author response image 3
Aged-related changes in SC-FC coupling.
(A) Increases in whole-brain coupling with age. (B) Correlation of age with SC-FC coupling across all regions and significant regions (p<0.05, FDR corrected). (C) Comparisons of age-related changes in SC-FC coupling among functional networks. The boxes show the median and interquartile range (IQR; 25–75%), and the whiskers depict 1.5× IQR from the first or third quartile. (D-J) Correlation of age with SC-FC coupling across the VIS, SM, DA, VA, LIM, FP and DM. VIS, visual network; SM, somatomotor network; DA, dorsal attention network; VA, ventral attention network; LIM, limbic network; FP, frontoparietal network; DM, default mode network.
Author response image 4
Pipeline of model selection and reproducibility analyses.
Author response image 5
Comparison results between different models.
Spatial pattern of mean SC-FC coupling based on MPC ~ FC (A), SCs ~ FC (B), and MPC + SCs ~ FC (C). Correlation of age with SC-FC coupling across cortex based on MPC ~ FC (D), SCs ~ FC (E), and MPC + SCs ~ FC (F).
Author response image 6
Encoding individual differences in intelligence using regional SC-FC coupling.
(A) Predictive accuracy of fluid, crystallized, and general intelligence composite scores. (B) Regional distribution of predictive weight. (C) Predictive contribution of functional networks. The boxes show the median and interquartile range (IQR; 25–75%), and the whiskers depict the 1.5× IQR from the first or third quartile.
Author response image 7
Exclusion of participants in the whole multimodal data processing pipeline.
Author response image 8
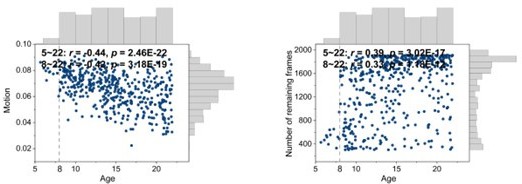
Figure S14.
Correlations between motion and age and number of remaining frames and age.
Tables
Table 1
Predictive significance of the communication model.
| Predictor | pspin | Predictor | pspin | ||
|---|---|---|---|---|---|
| Shortest path length | Gamma values = 0.12 | 0.93 | Path transitivity | Weight-to-cost transformations = 0.12 | 0.84 |
| Gamma values = 0.25 | 0.69 | Weight-to-cost transformations = 0.25 | 0.97 | ||
| Gamma values = 0.5 | 0.63 | Weight-to-cost transformations = 0.5 | 0.90 | ||
| Gamma values = 1 | 0.89 | Weight-to-cost transformations = 1 | 0.75 | ||
| Gamma values = 2 | 0.77 | Weight-to-cost transformations = 2 | 0.90 | ||
| Gamma values = 4 | 0.45 | Weight-to-cost transformations = 4 | 0.61 | ||
| Communicability | <0.001 | Matching index | 0.42 | ||
| Cosine similarity | 0.25 | Greedy navigation | 0.99 | ||
| Search information | Weight-to-cost transformations = 0.12 | 0.63 | Mean first-passage times of random walkers | 0.01 | |
| Weight-to-cost transformations = 0.25 | 0.59 | Flow graphs | Timescales = 1 | <0.001 | |
| Weight-to-cost transformations = 0.5 | 0.32 | Timescales = 2.5 | 0.26 | ||
| Weight-to-cost transformations = 1 | 0.72 | Timescales = 5 | 0.91 | ||
| Weight-to-cost transformations = 2 | 0.60 | Timescales = 10 | 0.80 | ||
| Weight-to-cost transformations = 4 | 0.75 | ||||
-
Note: pspin: spin test. The communication models in bold provide the optimal combination.
Author response table 1
| In-scanner head motion | Intracranial volume | |||
|---|---|---|---|---|
| r value | p value | r value | p value | |
| Episodic memory | -0.04 | 0.494825 | 0.00 | 0.963828 |
| Executive function/cognitive flexibility | -0.13 | 0.017108 | -0.02 | 0.729339 |
| Executive function/inhibition, language/reading decoding | 0.00 | 0.985376 | -0.01 | 0.911467 |
| Language/reading decoding | -0.09 | 0.124475 | 0.03 | 0.596947 |
| Processing speed | -0.07 | 0.215465 | 0.11 | 0.049091 |
| Language/vocabulary comprehension | -0.15 | 0.007839 | 0.01 | 0.835508 |
| Working memory | -0.02 | 0.767743 | 0.08 | 0.16235 |
| Fluid intelligence composite score Crystal intelligence composite score | -0.12 | 0.034428 | 0.02 | 0.695776 |
| Early child intelligence composite | -0.09 | 0.112609 | 0.08 | 0.153797 |
| score | -0.09 | 0.107082 | 0.04 | 0.503285 |
| Total intelligence composite score | -0.12 | 0.037287 | 0.07 | 0.219497 |
| Age-adjusted cognitive score |
Additional files
Download links
A two-part list of links to download the article, or parts of the article, in various formats.
Downloads (link to download the article as PDF)
Open citations (links to open the citations from this article in various online reference manager services)
Cite this article (links to download the citations from this article in formats compatible with various reference manager tools)
Spatial and temporal pattern of structure–function coupling of human brain connectome with development
eLife 13:RP93325.
https://doi.org/10.7554/eLife.93325.3


