Mesenchyme instructs growth while epithelium directs branching in the mouse mammary gland
- Cell and Tissue Dynamics Research Program, Institute of Biotechnology, Helsinki Institute of Life Science (HiLIFE), University of Helsinki, Finland
- Sorbonne University, INSERM, Research Center Saint-Antoine, France
- Department of Geosciences and Geography, University of Helsinki, Finland
Figures
Figure 1 with 1 supplement
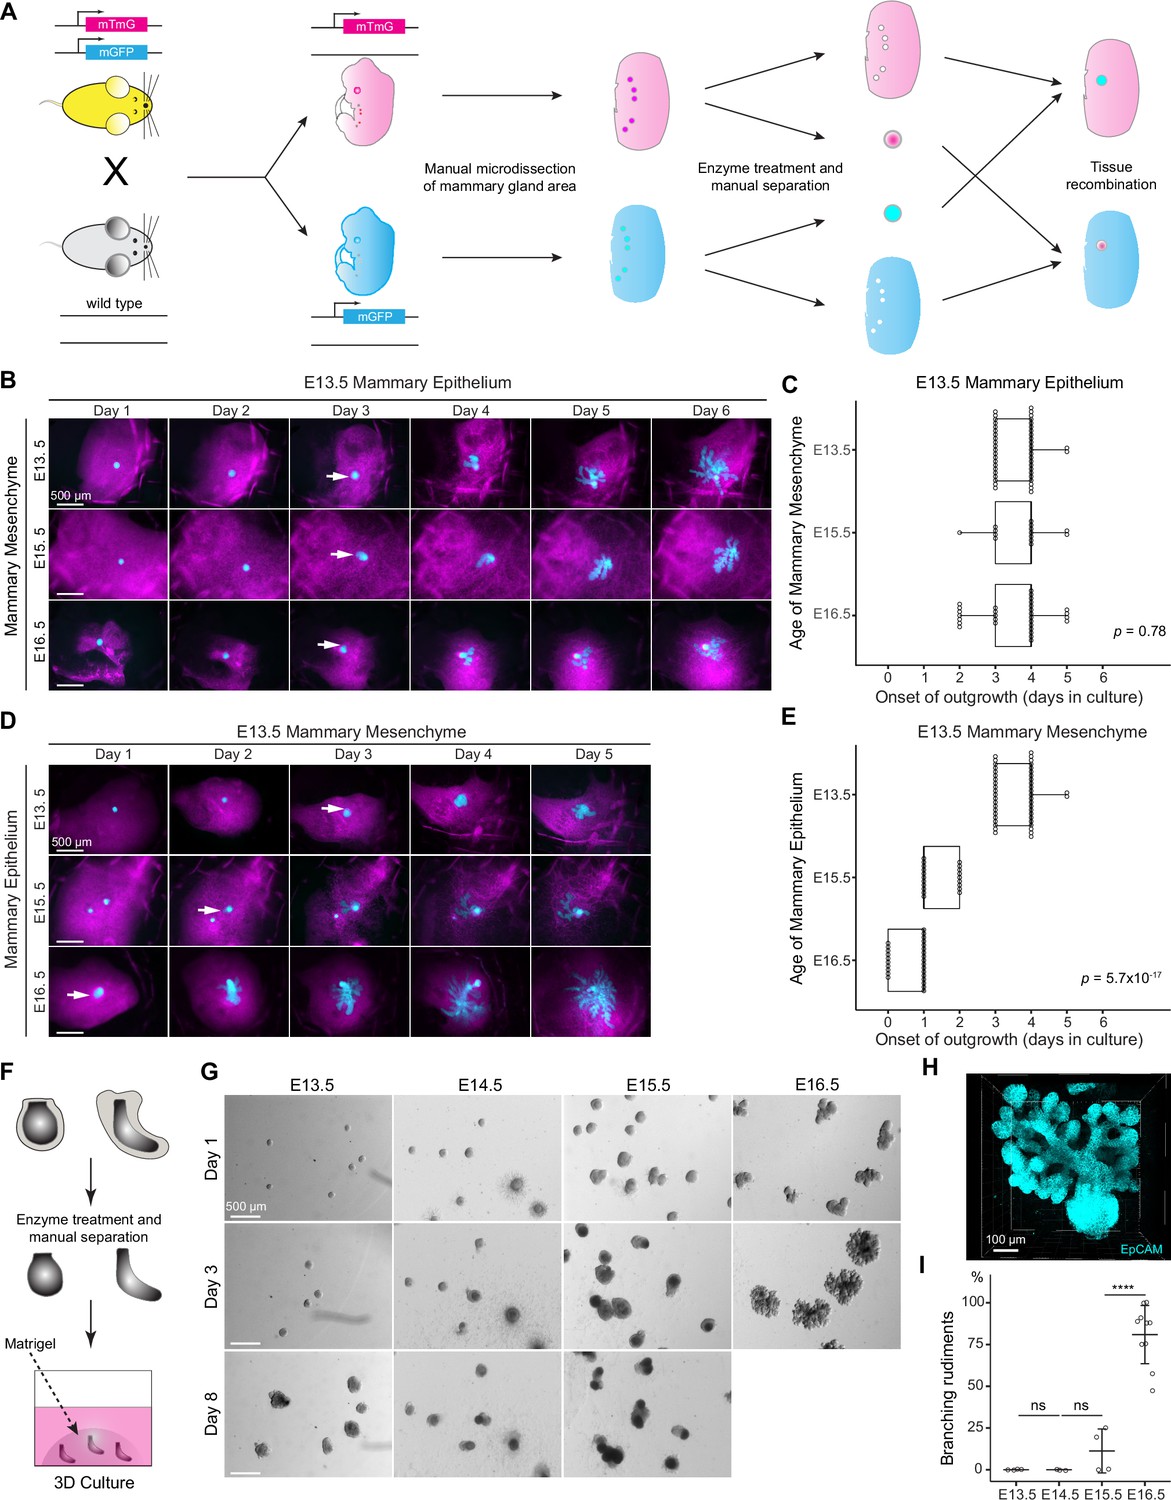
The timing of mammary gland outgrowth is an inherent property of the epithelium.
(A) A scheme illustrating the experimental procedure used in tissue recombination experiments. (B) Representative images showing the onset of outgrowth of E13.5 mammary epithelia recombined with E13.5, E15.5, or E16.5 mammary mesenchymes, respectively. The appearance of the primary outgrowth is indicated with arrow. Scale bar, 500 µm. (C) Quantification of the time (in days) required for onset of the branching. Data were pooled from three to six independent experiments of E13.5 mammary epithelia recombined with E13.5 (n=46 explants), E15.5 (n=14), and E16.5 (n=30) mammary mesenchymes. Statistical significance was assessed with the Kruskal–Wallis test. (D) Representative images showing onset of outgrowth of E13.5, E15.5, and E16.5 mammary epithelia recombined with E13.5 mammary mesenchymes. The appearance of the primary outgrowth is indicated with arrows. Scale bar, 500 µm. (E) Quantification of the time (in days) required for the onset of the primary outgrowth. Data were pooled from three to six independent experiments of E13.5 (n=46 explants), E15.5 (n=20) and E16.5 (n=27) mammary epithelia recombined with E13.5 mammary mesenchyme. Statistical significance was assessed with the Kruskal–Wallis test. (F) A scheme illustrating the 3D culture of intact, mesenchyme-free epithelial mammary rudiments. (G) Representative images showing the growth of E13.5, E14.5, E15.5, and E16.5 epithelial mammary rudiments in 3D culture; only E16.5 mammary rudiments were capable of branching (see also Figure 1—figure supplement 1C). Scale bar, 500 µm. (H) Representative 3D projection image of an EpCAM-stained E16.5 mammary rudiment after three days of 3D culture in Matrigel. Scale bar, 100 µm. (I) Quantification of branching mammary rudiments in 3D culture. Data are presented as percentage of branching mammary rudiments (mean ± SD) from a total of 4 (E13.5), 3 (E14.5), 4 (E15.5), and 10 (E16.5) independent experiments (each with minimum 6 rudiments in culture). The statistical significances were assessed using unpaired two-tailed Student’s t-test with Bonferroni correction. ns, non-significant; ****, p<0.001.
-
Figure 1—source data 1
Source data of quantifications represented as graphs in Figure 1C, E1.
- https://cdn.elifesciences.org/articles/93326/elife-93326-fig1-data1-v2.xlsx
Figure 1—figure supplement 1

Mesenchyme does not alter the timing of mammary gland outgrowth but is required for initiation of branching.
(A, B) Confocal optical sections of whole-mount imaged explants at the end of the experiment from Figure 1B and D, Epithelium and mesenchyme were always isolated from embryos ubiquitously expressing a different fluorescent protein (GFP or tdTomato). (A) Representative images showing E13.5 mammary epithelia (cyan) recombined with E13.5, E15.5, or E16.5 mammary mesenchymes (magenta) stained with EpCAM to assess the purity of the epithelial compartment. Scale bars, 100 µm. (B) Representative images showing E13.5, E15.5, or E16.5 mammary epithelia (cyan) recombined with E13.5 mammary mesenchyme (magenta) stained with EpCAM to assess the purity of the epithelial compartment. Scale bars, 100 µm. (C) Representative images showing the growth of E13.5, E14.5, E15.5, and E16.5 epithelial mammary rudiments in 3D Matrigel culture. Images were acquired once per day. Scale bar, 500 µm. (D, E) Confocal optical sections of whole mount-stained E14.5 and E16.5 mammary epithelia after 2 days of culture in 3D Matrigel matrix, stained for cleaved caspase-3 and nuclei (D). Quantification of the percentage of cleaved caspase-3 positive cells is shown in (E). Altogether, 17 mammary epithelia from ten E14.5 embryos and 19 mammary epithelia from ten E16.5 embryos were assessed. Scale bar, 50 µm. Data are pooled from two to three independent experiments and presented as mean ± SD. Statistical significances were calculated with unpaired two-tailed Student’s t-test. **, p<0.01.
-
Figure 1—figure supplement 1—source data 1
Source data of quantifications represented as graphs in Figure 1—figure supplement 1E.
- https://cdn.elifesciences.org/articles/93326/elife-93326-fig1-figsupp1-data1-v2.xlsx
Figure 2
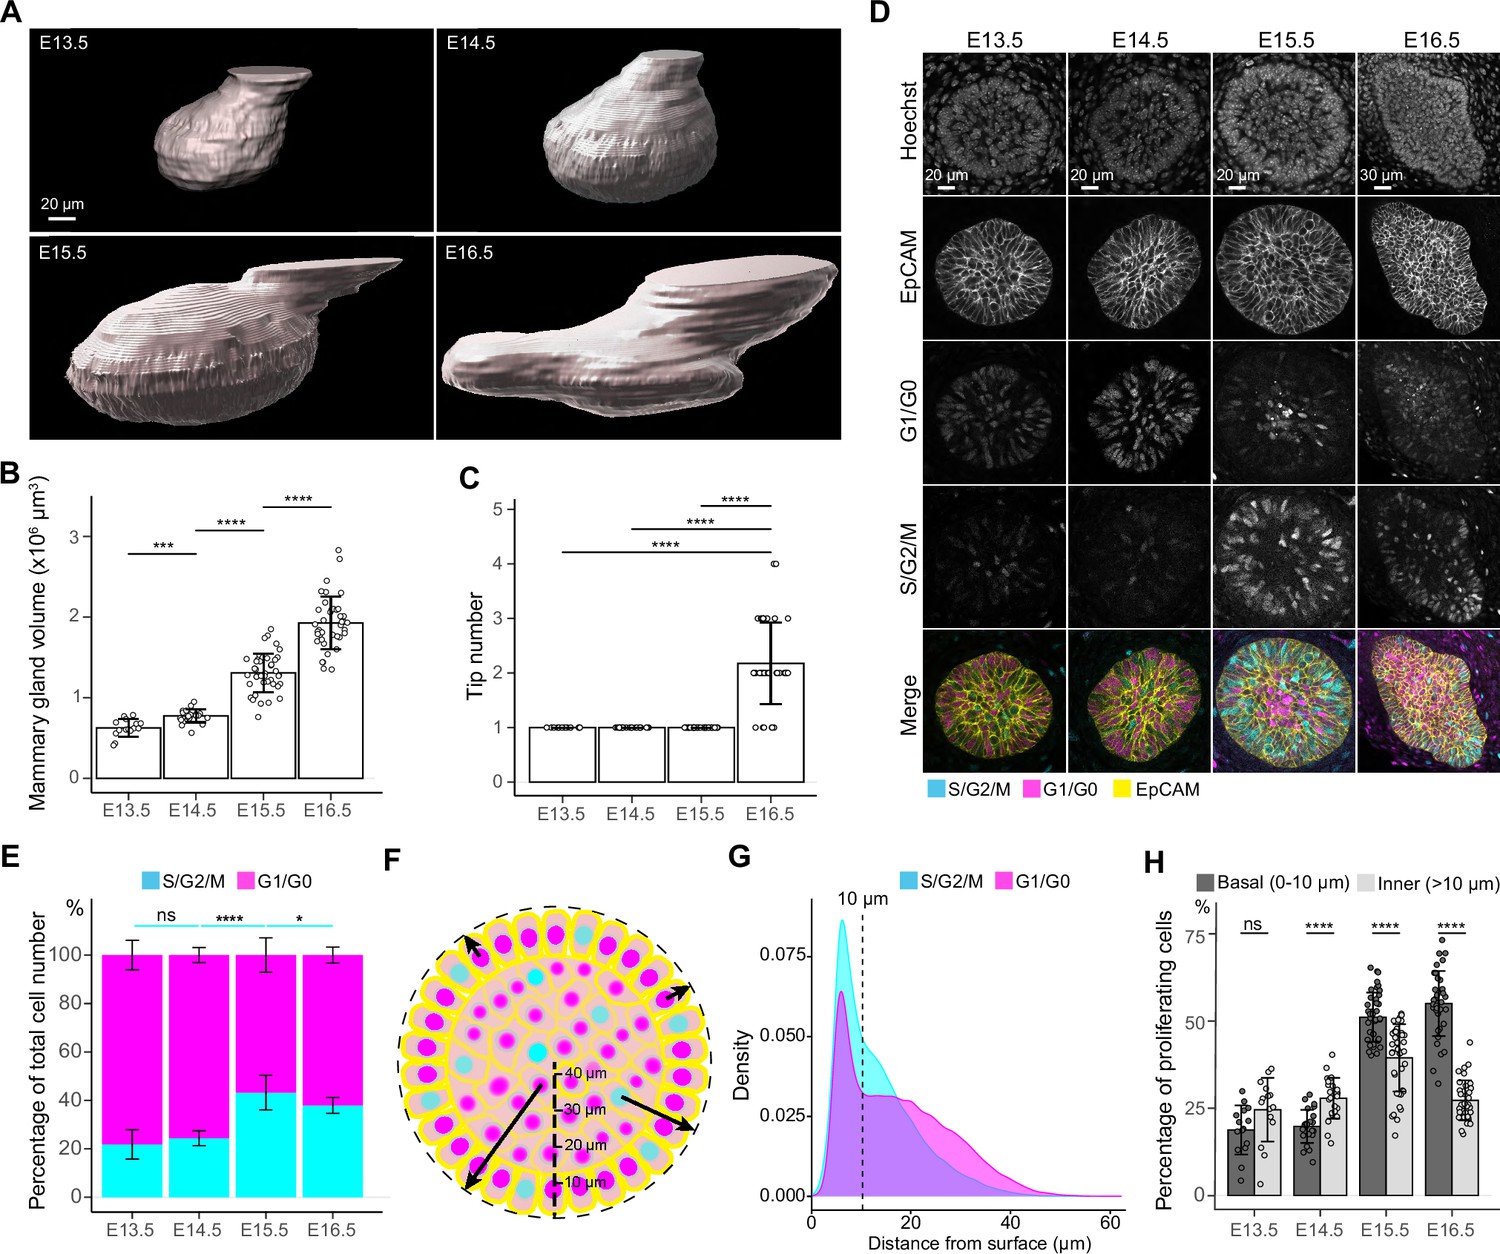
Cell cycle dynamics in embryonic mammary glands.
(A) Representative 3D surface rendering images of EpCAM-stained E13.5, E14.5, E15.5, and E16.5 epithelial mammary rudiments, based on 3D confocal imaging. Mammary gland 2 is shown. Scale bar, 20 µm. (B, C) Quantification of epithelial mammary gland volume (B) and number of branching tips (C), nE13.5=15, nE14.5=24, nE15.5=41, nE16.5=36. (D) Confocal optical sections of whole mount-stained mammary glands from E13.5, E14.5, E15.5, and E16.5 Fucci2a embryos stained with EpCAM. Scale bars, 20 µm (E13.5-E15.5) and 30 µm (E16.5). (E) Quantification of the proportions of all epithelial cells in S/G2/M and G1/G0 phases. Altogether, 15 glands (in total 9228 cells) from three E13.5 embryos, 24 glands (in total 17,599 cells) from five E14.5 embryos, 41 glands (in total 40,431 cells) from eight E15.5 embryos, and 36 glands (in total 50,574 cells) from seven E16.5 embryos were analyzed. (F) A schematic image illustrating how the distance of cells (center of the nucleus) was quantified with respect to the surface of mammary rudiments. (G) Density plot showing the distribution of the distance of nuclei in S/G2/M and G1/G0 phase to the surface of the mammary rudiment. Density plot revealed that a cluster of cells was localized within the distance of 10 µm (dashed line), which was set as the threshold to define ‘basal’ and ‘inner’ (luminal) cells. (H) Quantification of the proportion of epithelial cells in S/G2/M phase in basal and inner compartments in E13.5-E16.5 epithelial mammary rudiments. Sample sizes are as in (E). Data are presented as mean ± SD. The statistical significance was assessed using unpaired two-tailed Student’s t-test with Bonferroni correction. ns, non-significant; *, p<0.05; ***, p<0.001; ****, p<0.0001.
-
Figure 2—source data 1
Source data of quantifications represented as graphs in Figure 2B, C, E and H.
- https://cdn.elifesciences.org/articles/93326/elife-93326-fig2-data1-v2.xlsx
Figure 3 with 1 supplement
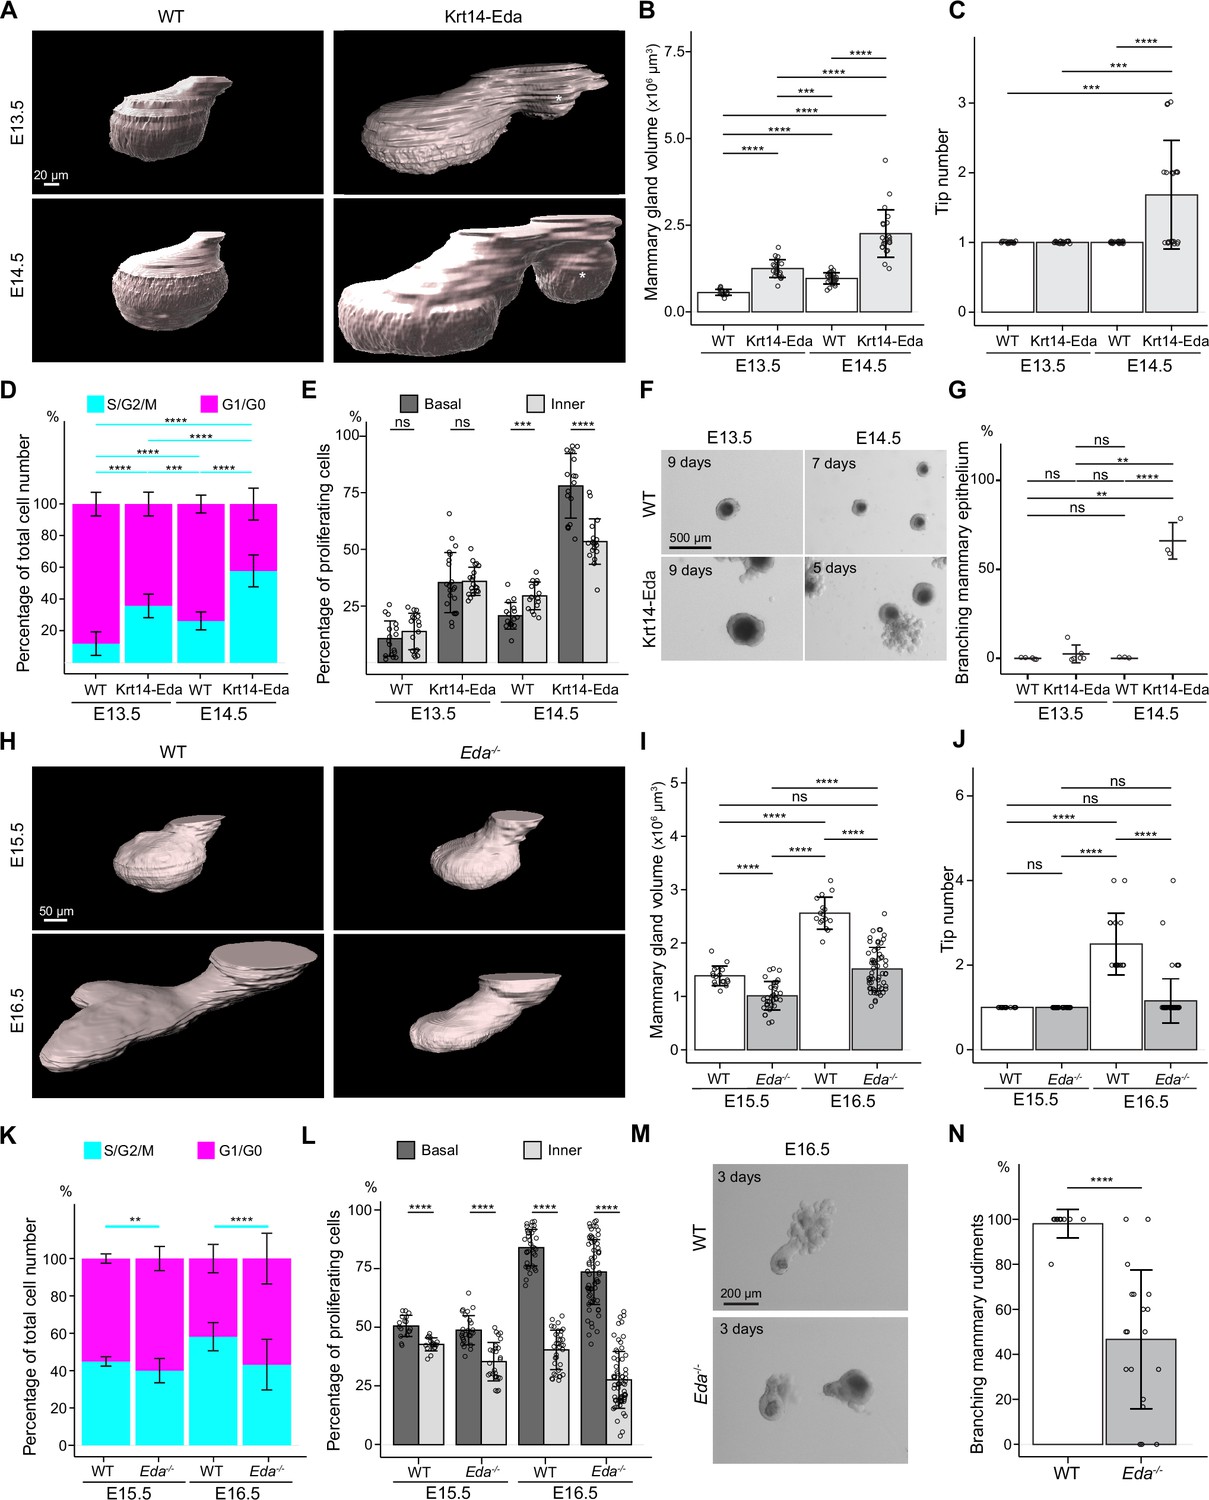
Basal-cell biased proliferation precedes, but is not sufficient to drive onset of branching.
(A) Representative 3D surface rendering images of EpCAM-stained mammary glands of Krt14-Eda embryos and their wild type (WT) littermates at E13.5 and E14.5. Mammary gland 2 is shown. Ectopic mammary rudiments (asterisk) common in Krt14-Eda embryos were excluded from the analysis. Scale bar, 20 µm. (B, C) Quantification of mammary gland volume (B) and branching tip number (C) at E13.5 (nWT = 17, nKrt14-Eda=21) and at E14.5 (nWT = 27 and nKrt14-Eda=22). (D, E) Quantification of the proportions of mammary epithelial cells in S/G2/M and G1/G0 phases in the entire epithelium (D) and the proportions of mammary epithelial cells in S/G2/M phase in basal and inner compartments (E) in WT or Krt14-Eda embryos at E13.5 (nWT = 17 glands and in total 7714 cells from three embryos, nKrt14-Eda=21 glands and in total 15,561 cells from 4 embryos) and E14.5 (nWT = 16 glands and in total 10,221 cells from 4 embryos, nKrt14-Eda=18 glands and in total 10,520 cells from 5 embryos). (F) Representative images showing the growth of E13.5 and E14.5 Krt14-Eda and wild type littermate epithelial mammary rudiments in 3D Matrigel culture. Note branching in E14.5 Krt14-Eda mammary rudiments. Scale bar, 500 µm. (G) Quantification of branching mammary rudiments in 3D culture. Data are presented as percentage of branching mammary rudiments (mean ± SD) from a total of 5 (E13.5 WT), 6 (E13.5 Krt14-Eda), 3 (E14.5 WT) and 3 (E14.5 Krt14-Eda) independent experiments (each with minimum 5 rudiments in culture). (H) Representative 3D surface rendering images of EpCAM-stained E15.5 and E16.5 epithelial mammary rudiments of Eda-/- and wild type embryos. Mammary gland 2 is shown. Scale bar, 50 µm. (I, J) Quantification of epithelial mammary gland volume (I) and number of branching tips (J), at E15.5 (nWT = 17 and nEda-/- = 33) and at E16.5 (nWT = 32 and nEda-/- = 68). (K, L) Quantification of the proportions of mammary epithelial cells in S/G2/M or G1/G0 phases (K) and the proportions of mammary epithelial cells in S/G2/M phase in basal and inner compartments (L) in WT or Eda-/- embryos at E15.5 (nWT = 17 glands and in total 14,054 cells from 3 embryos, nEda-/- = 27 glands and in total 21,986 cells from 5 embryos) and E16.5 (nWT = 34 glands and in total 72,279 cells from 3 embryos, nEda-/- = 64 glands and in total 76,844 cells from 3 embryos). (M) Representative images showing E15.5 and E16.5 Eda-/- and wild type epithelial mammary rudiments in 3D culture after 3 days. Scale bar, 200 µm. (N) Quantification of branching mammary rudiments in 3D culture. Data are presented as percentage of branching mammary rudiments from a total of 10 WT and 19 Eda-/- E16.5 embryos (each with 3–6 rudiments in culture). Data are presented as mean ± SD. The statistical significance was assessed using unpaired two-tailed Student’s t-test with Bonferroni correction, except Wilcoxon test with Bonferroni correction for (C, G and J). ns, non-significant; *, p<0.05; **, p<0.01; ***, p<0.001; ****, p<0.0001.
-
Figure 3—source data 1
Source data of quantifications represented as graphs in Figure 3B–E, G1–L and N.
- https://cdn.elifesciences.org/articles/93326/elife-93326-fig3-data1-v2.xlsx
Figure 3—figure supplement 1
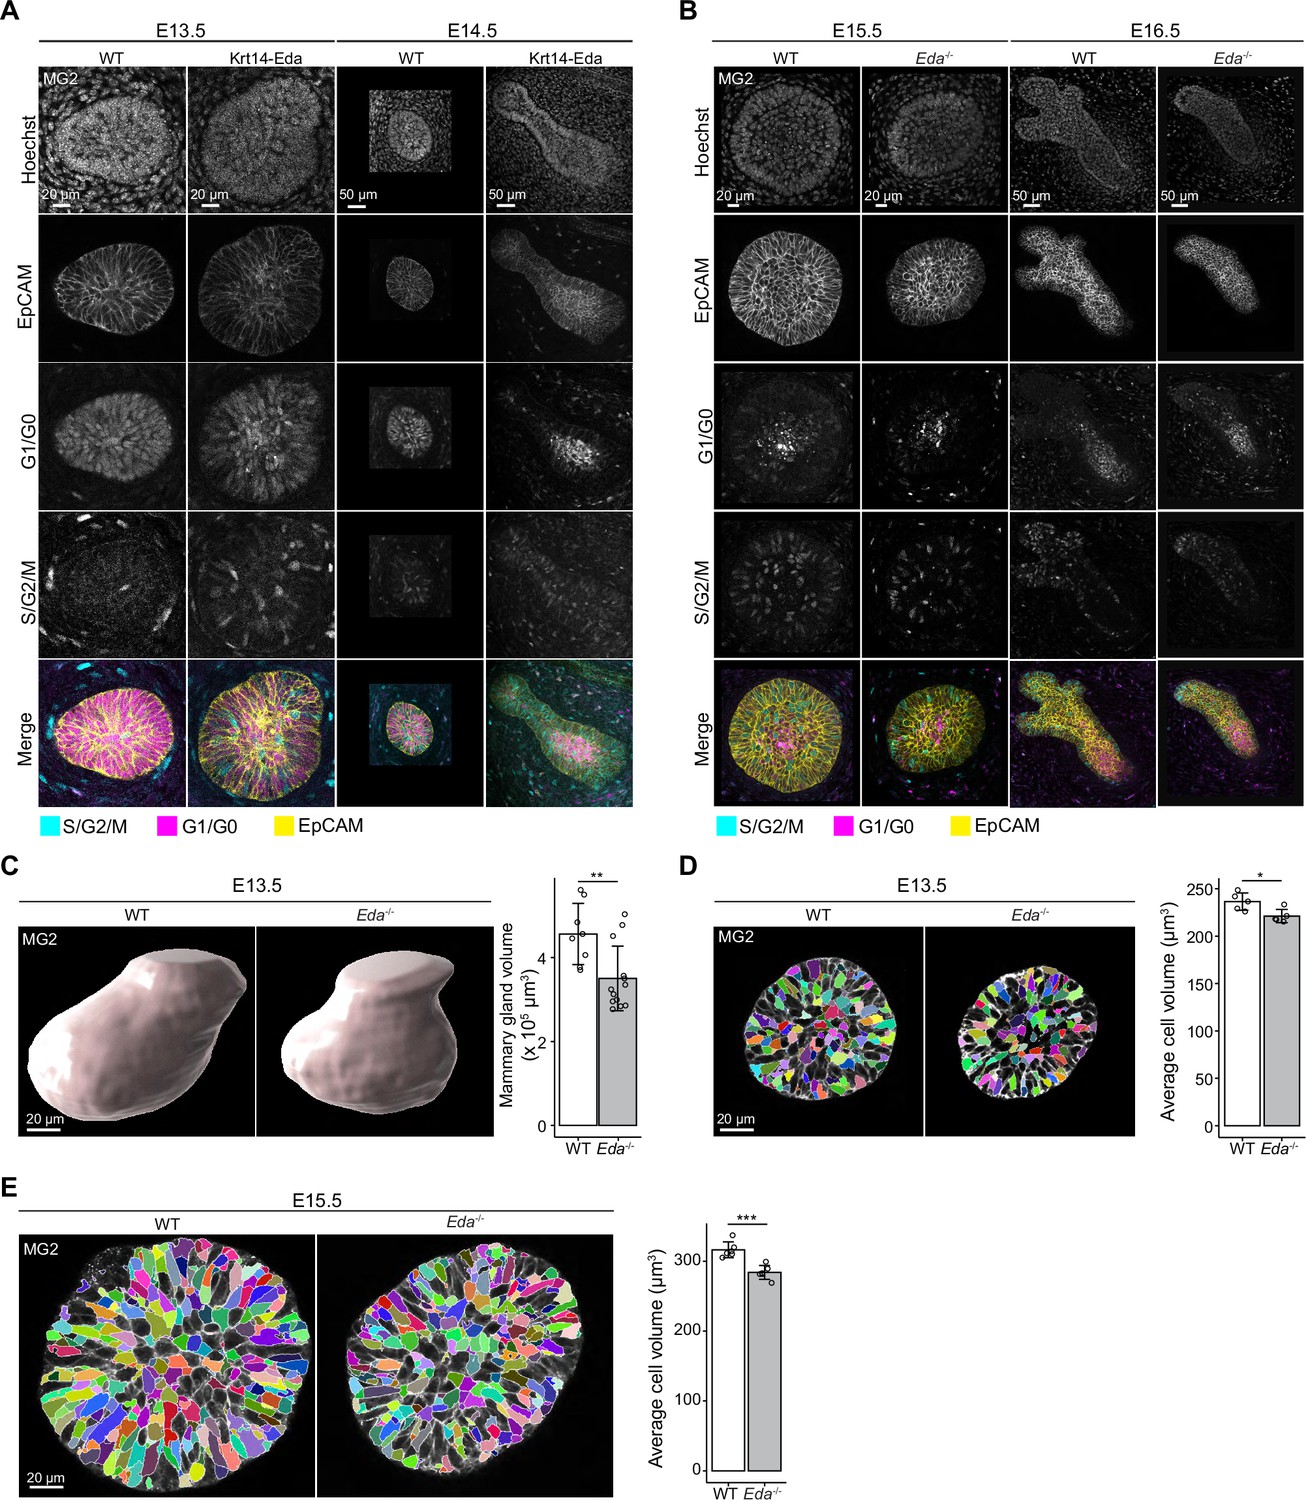
The cellular dynamics of mammary epithelium in Eda gain-of-function and loss-of-function mouse models.
(A) Confocal optical sections of whole-mount mammary glands from E13.5 and E14.5 Krt14-Eda or WT littermate embryos expressing Fucci2a reporter stained with EpCAM. Scale bars, 20 µm (E13.5) and 50 µm (E14.5). (B) Confocal optical sections of whole-mount mammary glands from E15.5 and E16.5 WT or Eda-/- Fucci2a embryos stained with EpCAM. Scale bars, 20 µm (E15.5) or 50 µm (E16.5). (C) Representative 3D surface rendering images and bud volume quantification of EpCAM-stained mammary gland 2 from WT or Eda-/- embryos at E13.5 (nWT = 8, nEda-/- = 13). Scale bars, 20 µm. (D, E) Representative optical sections showing the 3D segmentation and cellular volume quantification of epithelial cells of mammary gland 2 from WT or Eda-/- embryos at E13.5 (nWT = 5 glands with total 3385 cells, nEda-/- = 5 glands with total 2369 cells) (D) and E15.5 (nWT = 6 glands with total 11,151 cells, nEda-/- = 6 glands with total 7946 cells). (E). Scale bars, 20 µm. Data are presented as mean ± SD and the statistical significances were assessed using unpaired two-tailed Student’s t-test. *, p<0.05; **, p<0.01; ***, p<0.001.
-
Figure 3—figure supplement 1—source data 1
Source data of quantifications represented as graphs in Figure 3—figure supplement 1C–E.
- https://cdn.elifesciences.org/articles/93326/elife-93326-fig3-figsupp1-data1-v2.xlsx
Figure 4 with 2 supplements
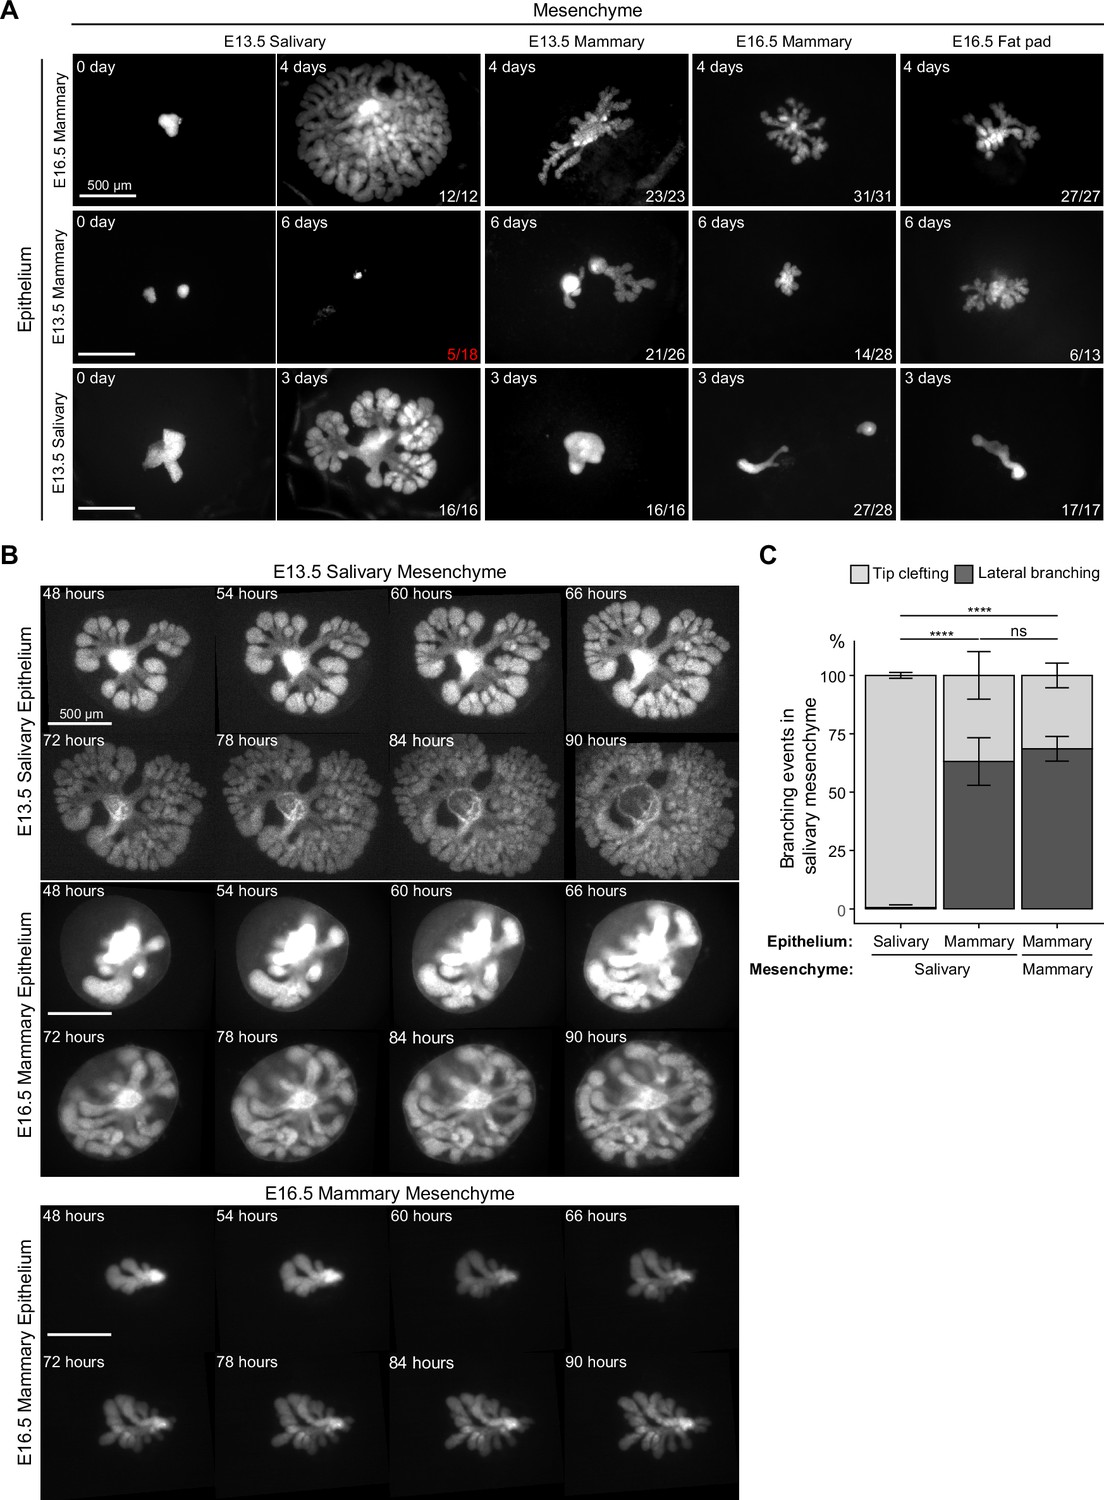
Mammary mesenchyme is indispensable for the branching ability of the mammary gland.
Recombination experiments between micro-dissected mammary and salivary gland tissues using fluorescently labeled epithelia (see also Figure 1). (A) Representative images showing growth of the indicated epithelia recombined with distinct mesenchymes. Images were taken 0–6 days after culture as indicated in each figure. n in the lower right corner indicates growing recombinants out of those that survived, except for E13.5 mammary epithelium recombined with E13.5 salivary gland mesenchyme where it shows the number of survived recombinants/total recombinants (in red). In these recombinants, the epithelia never branched. Data were pooled from three to four independent experiments. Scale bars, 500 µm. (B) Captions of time-lapse live imaging series of explants consisting of E13.5 salivary epithelium or E16.5 mammary epithelium recombined with E13.5 salivary mesenchyme or E16.5 mammary mesenchyme. Images were captured every 2 hr starting 48 hr after recombination. The full video is provided as Figure 4—video 1. Scale bar, 500 µm. (C) Quantification of the branching events (lateral branching and tip clefting) from time-lapse videos. A pooled data from three independent experiments: in total of 239 branching events from 9 explants consisting of salivary epithelium and salivary mesenchyme, 159 branching events from 8 explants consisting of mammary epithelium and salivary gland mesenchyme and 40 branching events from 4 explants consisting of mammary epithelium and mammary gland mesenchyme were analyzed. Data are represented as mean ± SD and the statistical significance was assessed with unpaired two-tailed Student’s t-test with Bonferroni correction. p values: ns, non-significant; ****, p<0.0001.
-
Figure 4—source data 1
Source data of quantifications represented as graphs in Figure 4C.
- https://cdn.elifesciences.org/articles/93326/elife-93326-fig4-data1-v2.xlsx
Figure 4—figure supplement 1
Quality control of tissue separation and recombination.
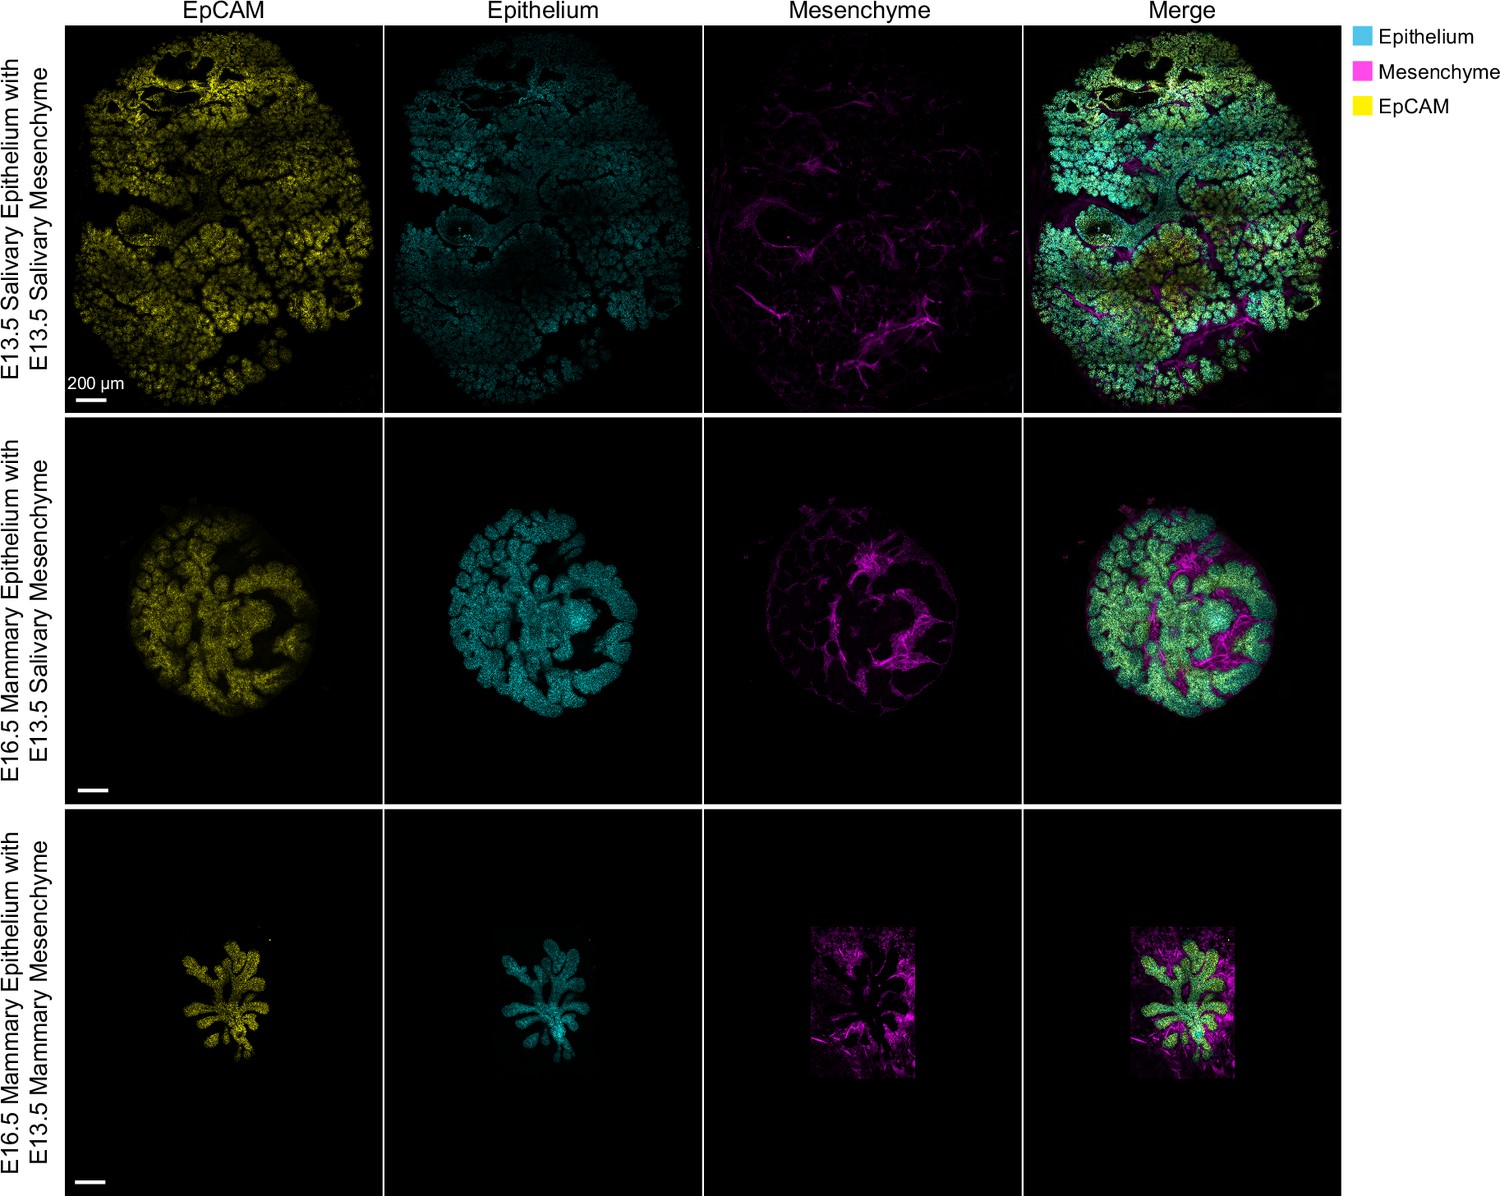
Representative confocal optical sections of whole-mount imaged explants at the end of the experiment from Figure 4B. Epithelium and mesenchyme were always isolated from embryos ubiquitously expressing a different fluorescent protein (GFP or tdTomato). E13.5 salivary or E16.5 mammary epithelium (cyan) was recombined with E13.5 salivary or E13.5 mammary mesenchyme (magenta), cultured for 94 hr, fixed and whole-mount imaged with confocal microscopy: E13.5 salivary, or E16.5 mammary epithelia (cyan) recombined with E13.5 salivary or mammary mesenchyme (magenta) explants were stained with EpCAM to assess the purity of the epithelial compartment. Scale bars, 200 µm.
Figure 4—video 1
Time-lapse live imaging showing the growth of E13.5 salivary epithelium (left) and E16.5 mammary epithelium (middle) in E13.5 salivary mesenchyme and E16.5 mammary epithelium in E16.5 mammary mesenchyme (right).
Images were captured every 2 hr starting 48 hr after recombination. Scale bar, 500 µm.
Figure 5 with 1 supplement
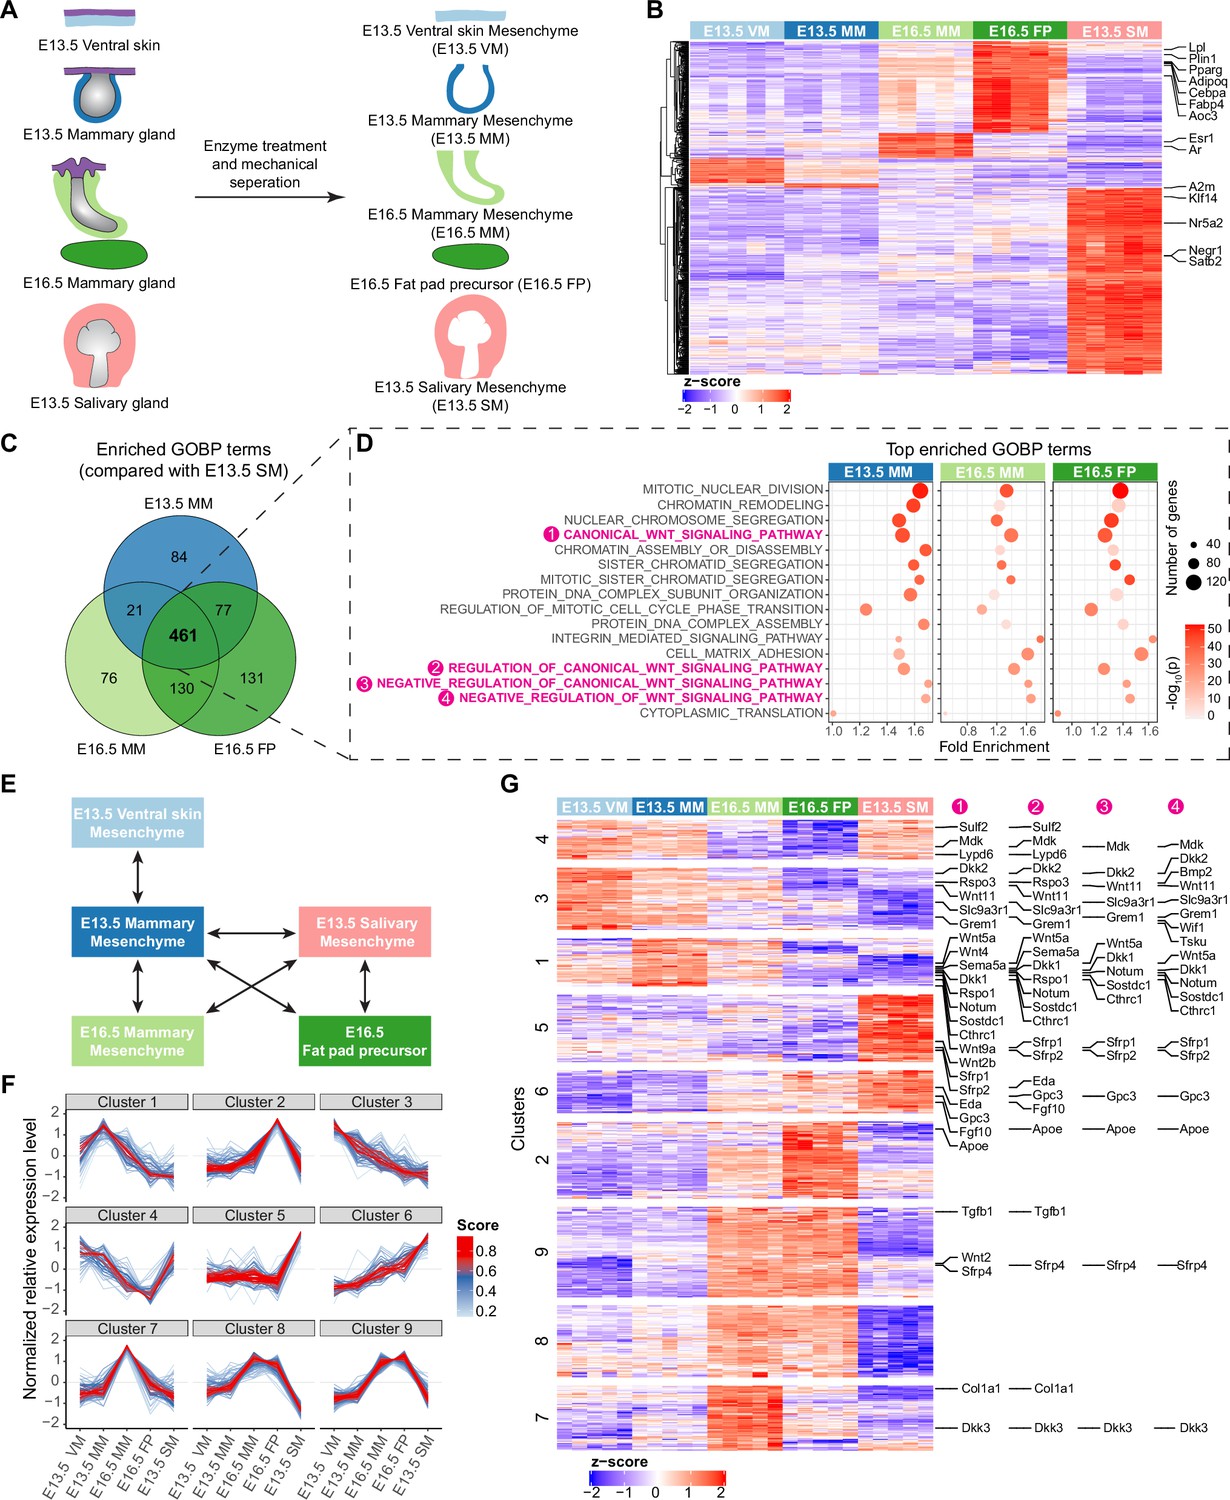
Transcriptomic analysis identifying mesenchymal signals potentially regulating epithelial growth.
(A) A scheme illustrating the tissues isolated for RNA-Seq analysis. (B) Heatmap showing the expression of the identified marker genes (with a threshold of average of normalized expression value in each group ≥100, fold change ≥2 and adjusted p-value <0.05) in different mesenchymes using the z-score of log2-transformed normalized expression value (also see Supplementary file 1). (C) Venn diagram showing 461 enriched Gene Ontology Biological Process (GOBP) terms shared among E13.5 mammary mesenchyme (MM), E16.5 MM and E16.5 fat pad (FP) when compared to E13.5 salivary gland mesenchymes (SM) separately. (D) Top 10 (among the 461 shared terms) of the most significantly enriched GOBP terms in each comparison resulted in 16 distinct terms in total. Four out of 16 terms were related to Wnt signaling pathway (in magenta). (E) A scheme illustrating the pair-wise comparisons used to identify the genes with the potential to regulate epithelial growth. Altogether 644 genes encoding extracellular matrix proteins and ligands with average of normalized expression value in each group ≥200, fold change ≥1.5 and adjusted p-value <0.05 were identified. (F) mFuzz cluster analysis of the genes identified in (E) (also see Supplementary file 2). (G) Heatmap showing the expression of genes identified in (E) using the z-score of log2-transformed normalized expression value. The clusters were defined by mFuzz shown in (F). The genes within the Wnt related GOBP terms identified in (D) are indicated accordingly in the right.
Figure 5—figure supplement 1

Transcriptomic profiling of different mesenchymes.
(A) Scatter plot shows the principal component analysis of E13.5 ventral skin mesenchyme (VM), E13.5 mammary mesenchyme (MM), E16.5 MM, E16.5 fat pad (FP), and E13.5 salivary gland mesenchyme (SM). (B) Heatmap shows the significantly altered KEGG signaling pathways comparing E13.5 MM, E16.5 MM, or E16.5 FP with E13.5 SM separately. WNT_SIGNALING_PATHWAY (marked with Magenta) is low in E16.5 MM and E16.5 FP compared to other tissues. (C) Graphs representing mRNA expression of Axin2 as measured by RNA-Seq. Data are presented as normalized expression values (mean ± SD). Each dot represents one biological replicate.
Figure 6 with 1 supplement
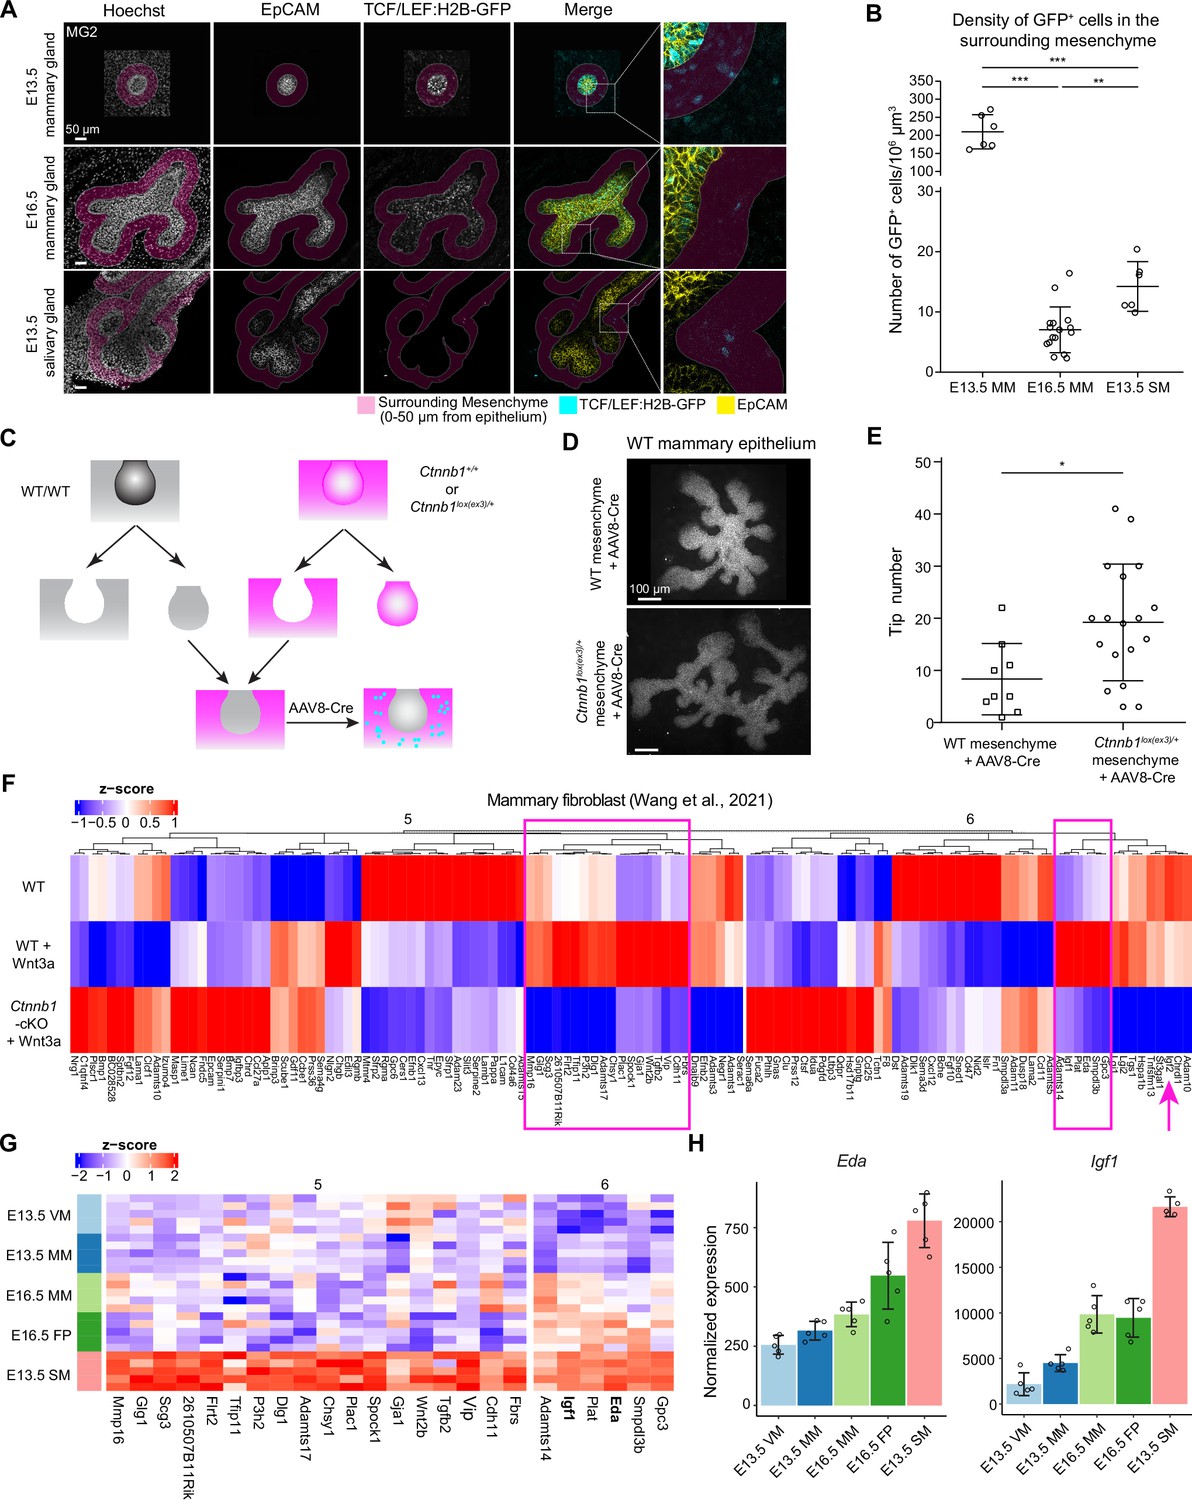
Wnt-activated mesenchyme promotes growth of the mammary epithelium.
(A) Confocal optical sections of whole mount EpCAM-stained tissues expressing TCF/LEF:H2B-GFP Wnt reporter from E13.5 and E16.5 mammary glands and E13.5 salivary glands. The mesenchyme within 0–50 µm distance from epithelia in 3D was labeled as magenta. Scale bars, 50 µm. (B) Quantification of the density of mesenchymal Wnt reporter-expressing (GFP+) cells within 0–50 µm distance from the epithelium. Altogether, 6 and 16 mammary gland 2 from three E13.5 embryos and eight E16.5 embryos, respectively, and 6 salivary glands from three E13.5 embryos were analyzed. Data are presented as mean ± SD. Statistical significance was assessed using unpaired two-tailed Student’s t-test with Bonferroni correction. **, p<0.01; ***, p<0.001. (C) A scheme illustrating the experimental design for mesenchymal activation of Wnt/ß-catenin signaling activity. (D) Representative images showing EpCAM stained wild type mammary epithelia after 6 days culture in wild type or Ctnnb1lox(ex3)/+ mesenchyme infected with AAV8-Cre virus during the first 48 hr. (E) Quantification of the number of branching tips of wild type mammary epithelia recombined with wild type or Ctnnb1lox(ex3)/+ mesenchyme after 6 days of culture. Data are presented as mean ± SD (n=9 and 18 for WT and Ctnnb1lox(ex3)/+ mesenchyme, respectively) and represented from three independent experiments. Statistical significance was assessed using unpaired two-tailed Student’s t-test. *, p<0.05. (F) Unsupervised cluster of heatmap showing the expression of cluster 5 and 6 genes identified by mFuzz analysis (see Figure 5F) in a published dataset (Wang et al., 2021) that compared gene expression levels in wild type and β-catenin deficient mammary fibroblasts cultured with or without Wnt3a protein. Data are shown as z-score of log2-transformed normalized expression values. Two subsets of potential mesenchymal Wnt target genes identified are marked (box in magenta). In addition, Igf2 is highlighted with an arrow. (G) Heatmap showing the expression of the candidate genes from (F) in different mesenchymes of the RNA-Seq data. Data are shown as z-score of log2-transformed normalized expression values. (H) Graphs representing mRNA expression of Eda and Igf1 as measured by RNA-Seq. Data are presented as normalized expression values (mean ± SD). Each dot represents one biological replicate.
-
Figure 6—source data 1
Source data of quantifications represented as graphs in Figure 6B, E and H.
- https://cdn.elifesciences.org/articles/93326/elife-93326-fig6-data1-v2.xlsx
Figure 6—figure supplement 1
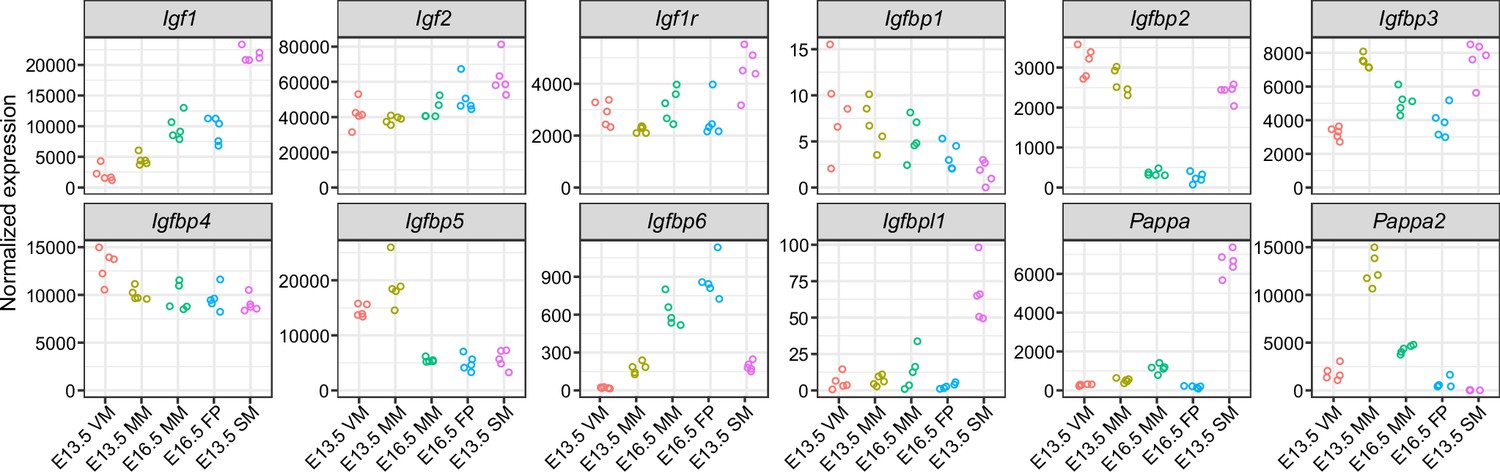
Expression of IGF pathway genes in the mesenchymal tissues.
Graphs show mRNA expression of the indicated genes by RNA-Seq in E13.5 ventral, non-mammary skin mesenchyme (VM), E13.5 mammary mesenchyme (MM), E16.5 MM, E16.5 fat pad precursor (FP), and E13.5 salivary gland mesenchyme (SM). Each dot represents one biological replicate.
Figure 7 with 1 supplement
IGF-1R is required for embryonic mammary gland development and branching morphogenesis.
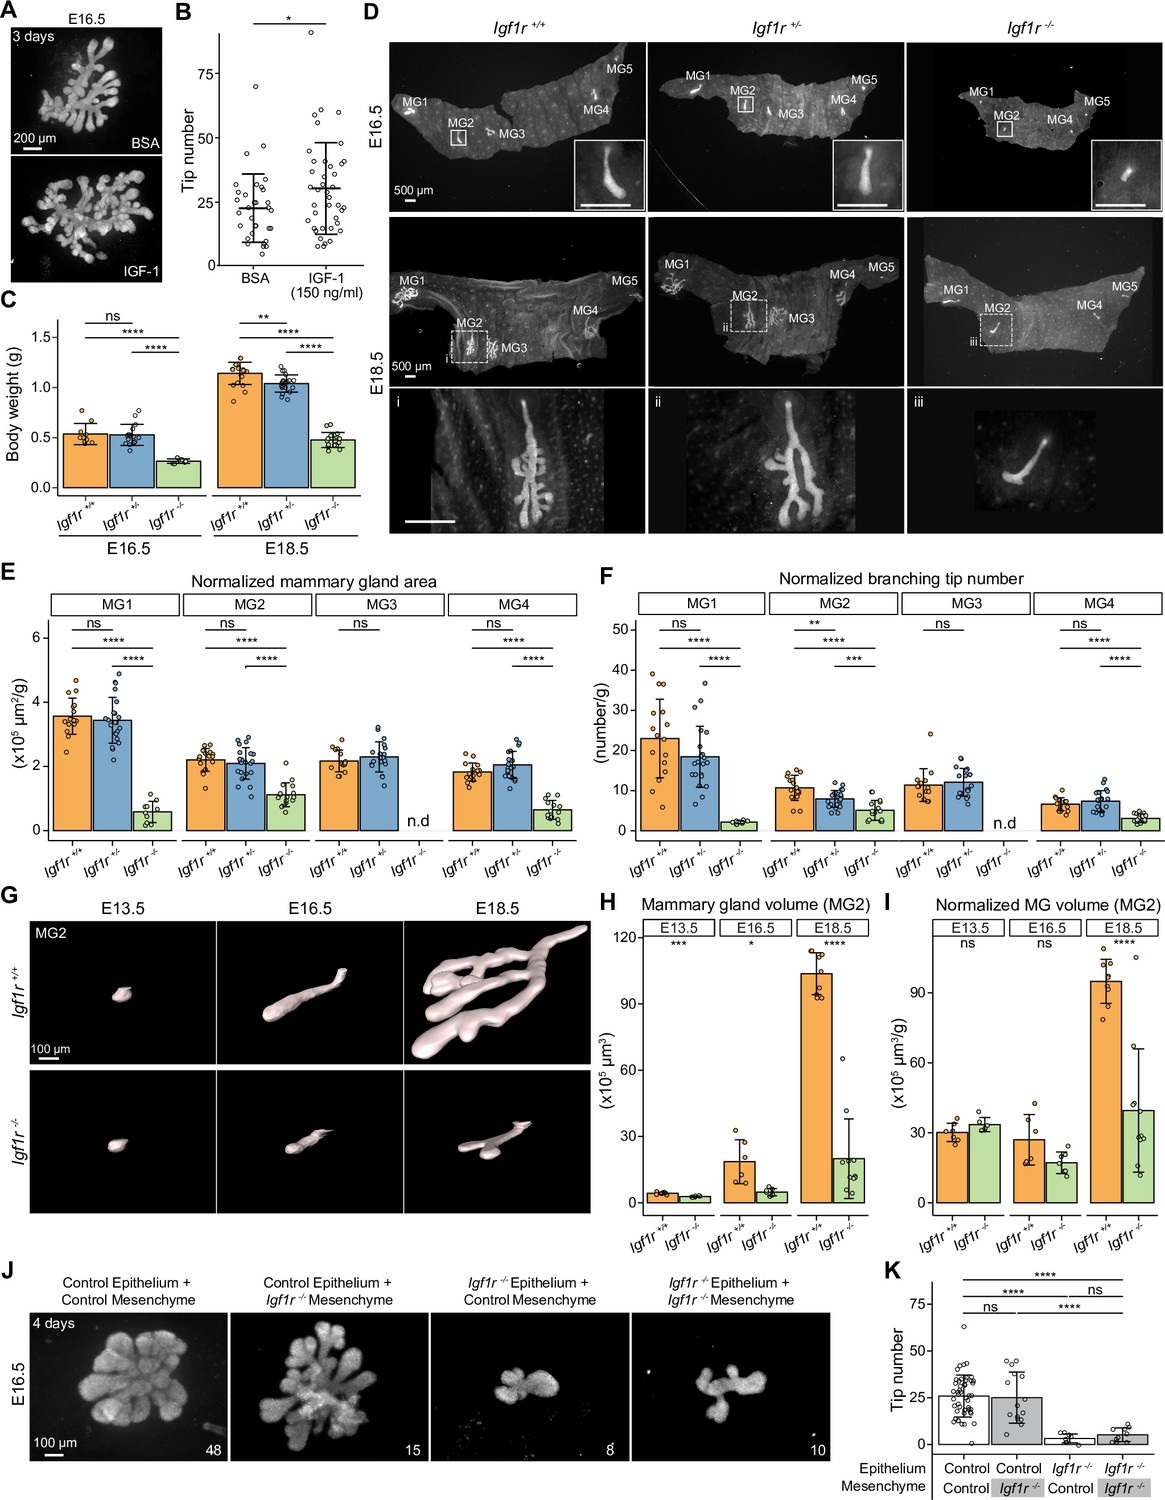
(A) Representative images of E16.5 Krt14-Cre;Rosa26mTmG/+ mammary glands cultured ex vivo for three days in the presence of 150 ng/ml recombinant IGF-1 or vehicle (BSA). Scale bar, 200 µm. (B) Quantification of the number of branching tips in vehicle (n=33) and IGF-1 treated (n=40) mammary gland explants. Data are pooled from five independent experiments and presented as mean ± SD. (C) Body weight of Igf1r +/+, Igf1r +/-and Igf1r -/- embryos at E16.5 (nIgf1r+/+=10, nIgf1r+/-=16, nIgf1r-/-=7), and E18.5 (nIgf1r+/+=20, nIgf1r+/-=20, nIgf1r-/-=17). (D) Representative images of EpCAM-stained ventral skin including mammary glands (MG) 1–5 from Igf1r +/+, Igf1r +/- and Igf1r -/- female embryos at E16.5, and E18.5. Note absence of MG3 in Igf1r -/- embryos. Magnifications show mammary gland 2. Scale bars, 500 µm. (E, F) Quantification of mammary gland area (E) and number of branch tips (F) normalized to body weight in Igf1r +/+, Igf1r +/- and Igf1r -/- embryos at E18.5. MG5 was often lost during dissection and therefore was not included in the analysis. n.d, not detected. (G) Representative 3D surface rendering images of EpCAM-stained mammary gland 2 from Igf1r +/+ and Igf1r -/- embryos at E13.5 (nIgf1r+/+=7, nIgf1r-/-=6), E16.5 (nIgf1r+/+=6, nIgf1r-/-=7), and E18.5 (nIgf1r+/+=9, nIgf1r-/-=11), based on 3D confocal imaging. Scale bar, 100 µm. (H–I), Quantification of epithelial mammary gland volume (H) and volume normalized with body weight (I). Data are presented as mean ± SD. (J, K) Representative images (J) showing the growth of E16.5 mammary epithelia isolated from control (Igf1r +/+ or Igf1r +/-) or Igf1r -/- embryos recombined with E16.5 mammary mesenchyme from control or Igf1r -/- embryos, as indicated in each figure. Explants were cultured for 4 days and the epithelium visualized with EpCAM staining. Quantifications are shown in (K). Scale bar, 100 µm. Data are pooled from 6 independent experiments and presented as mean ± SD. n is indicated in the right corner of each image in (J). Statistical significances were assessed using unpaired two-tailed Student’s t-test for (A) or unpaired two-tailed Student’s t-test with Bonferroni correction for (C, E, F, H, I and K). ns, non-significant; *, p<0.05; **, p<0.01; ***, p<0.001; ****, p<0.0001.
-
Figure 7—source data 1
Source data of quantifications represented as graphs in Figure 7B, C, E, F, H, I and K.
- https://cdn.elifesciences.org/articles/93326/elife-93326-fig7-data1-v2.xlsx
Figure 7—figure supplement 1
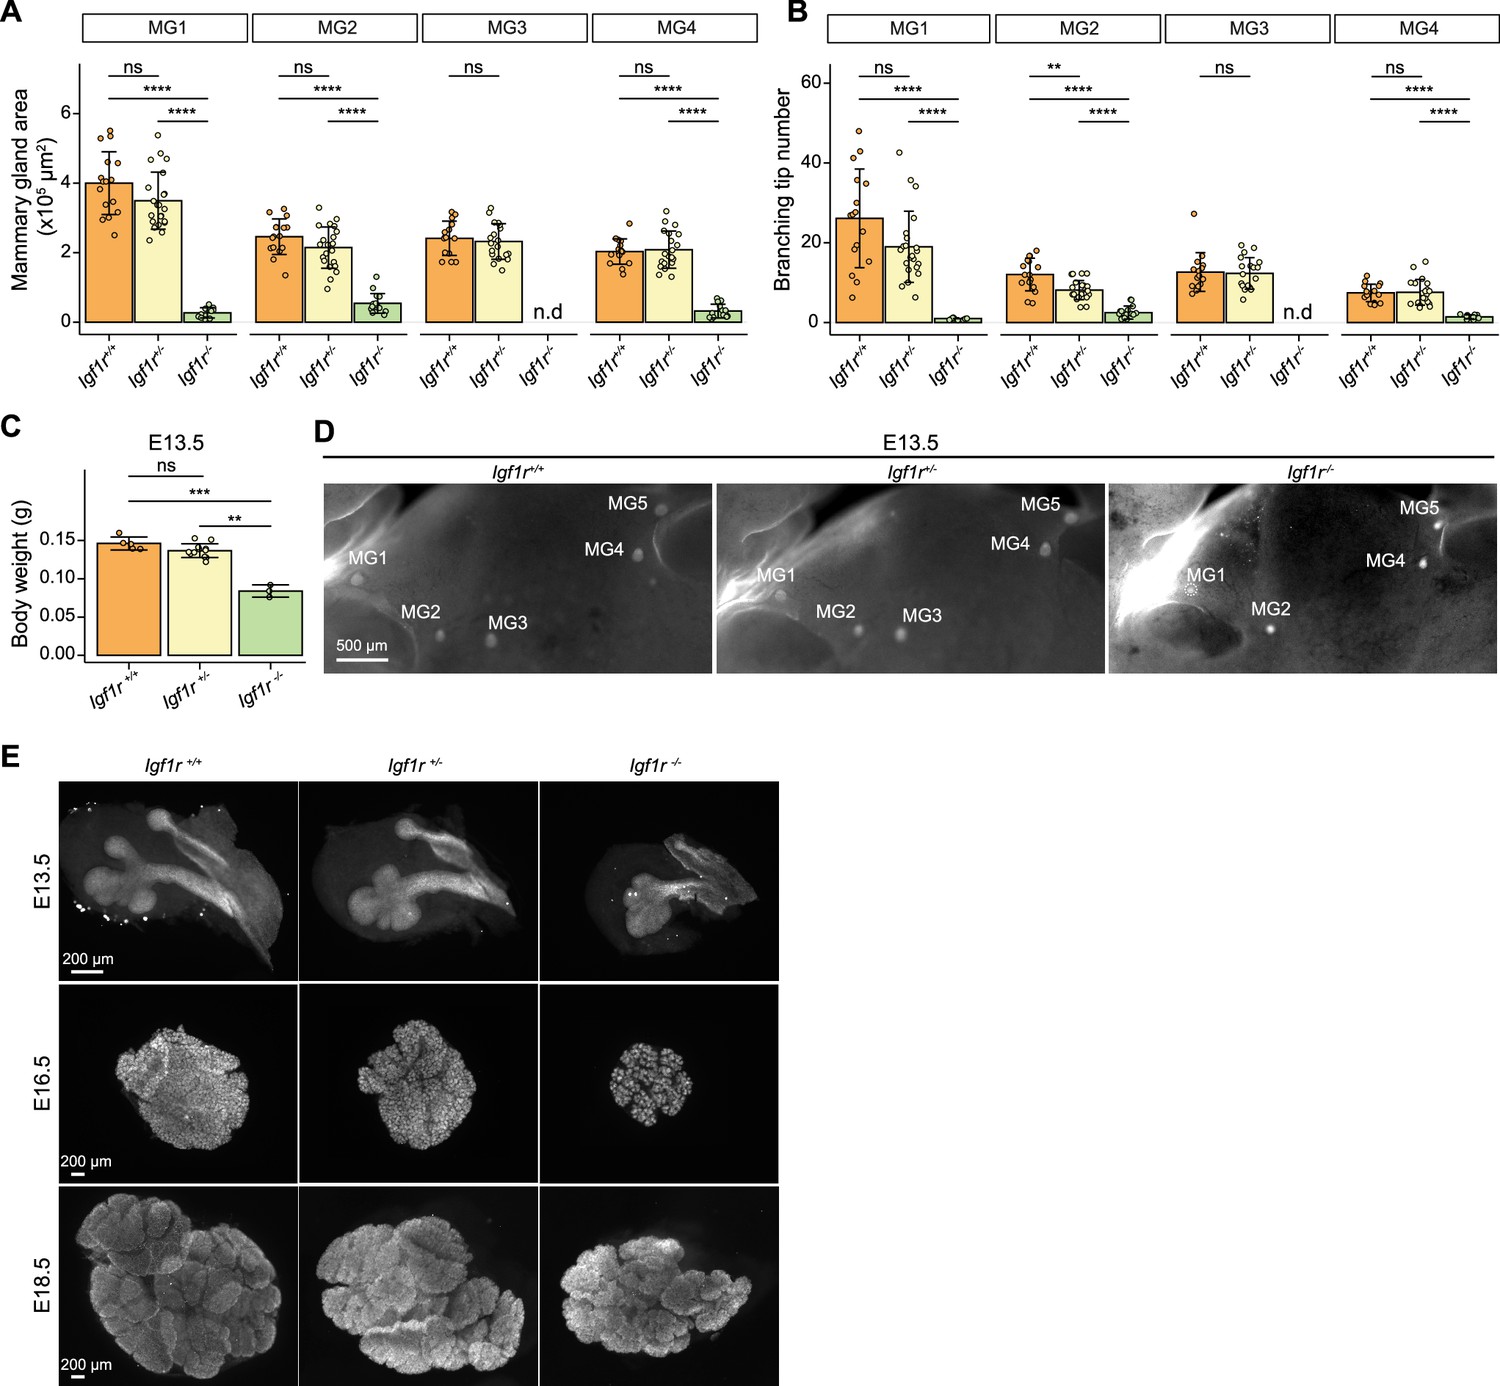
Impact of Igf1r deficiency on mammary gland and salivary gland growth and branching.
(A, B) Quantification of mammary gland area (A) and tip number (B) of E18.5 Igf1r +/+, Igf1r +/- and Igf1r -/- female embryos. Samples are the same as in Figure 7E and F. Data are presented as mean ± SD. (C) Body weight of Igf1r +/+, Igf1r +/-, and Igf1r -/- embryos at E13.5 (nIgf1r+/+=5, nIgf1r+/-=13; nIgf1r-/-=3). Data are presented as mean ± SD. (D) Representative images of EpCAM-stained E13.5 embryos showing mammary glands (MG) 1–5 from Igf1r +/+, Igf1r +/-and Igf1r -/- embryos. Scale bar, 500 µm. (E) Representative images of EpCAM-stained Igf1r +/+, Igf1r +/-, and Igf1r -/- salivary glands at E13.5 (nIgf1r+/+=6, nIgf1r+/-=8; nIgf1r-/-=20), E16.5 (nIgf1r+/+=15, nIgf1r+/-=29; nIgf1r-/-=5), and E18.5 (nIgf1r+/+=6, nIgf1r+/-=13; nIgf1r-/-=6). Scale bars, 200 µm. Statistical significances were assessed using unpaired two-tailed Student’s t-test with Bonferroni correction. ns, non-significant; **, p<0.01, ***; p<0.001; ****, p<0.0001.
-
Figure 7—figure supplement 1—source data 1
Source data of quantifications represented as graphs in Figure 7-figure supplement 1A-C.
- https://cdn.elifesciences.org/articles/93326/elife-93326-fig7-figsupp1-data1-v2.xlsx
Tables
Key resources table
| Reagent type (species) or resource | Designation | Source or reference | Identifiers | Additional information |
|---|---|---|---|---|
| Antibody | rat anti-mouse CD326 (EpCAM), monoclonal | BD Pharmingen | Cat# 552370; RRID:AB_394370 | 1:500 |
| Antibody | rabbit anti-mouse Krt14, polyclonal | Thermo Fisher Scientific (Lab Vision) | Cat# RB-9020-P; RRID:AB_149790 | 1:500 |
| Antibody | rabbit anti-cleaved Caspase-3, polyclonal | Cell Signaling Technology | Cat# 9661; RRID:AB_2341188 | 1:500 |
| Antibody | Alexa Fluor 488-conjugated Donkey anti-Rat secondary antibody, polyclonal | Thermo Fisher Scientific | Cat# A-21208; RRID:AB_2535794 | 1:500 |
| Antibody | Alexa Fluor 647-conjugated Donkey anti-Rat secondary antibody, polyclonal | Thermo Fisher Scientific | Cat# A48272; RRID:AB_2893138 | 1:500 |
| Peptide, recombinant protein | Mouse IGF-1 | R&D systems | 791 MG | 150 ng/ml |
| Strain, strain background (Mus musculus, C57/Bl6) | Krt14-Eda | PMID:12812793 | ||
| Strain, strain background (Mus musculus, C57/Bl6) | Krt14-Cre | PMID:1508351815083518 | ||
| Strain, strain background (Mus musculus,) | Eda-/- | The Jackson Laboratory | Strain #:000314; RRID:IMSR_JAX:000314 | |
| Strain, strain background (Mus musculus, C57/Bl6) | Rosa26Fucci2a flox/Fucci2a flox | EMMA | EMMA:08395; RRID:IMSR_EM:08395 | The original strain was bred with Pgk1-cre before using in this study. |
| Strain, strain background (Mus musculus, C57/Bl6) | Pgk1-cre | The Jackson Laboratory | Strain #:020811; RRID:IMSR_JAX:020811 | |
| Strain, strain background (Mus musculus, ICR) | Rosa26mTmG | The Jackson Laboratory | Strain #:007576; RRID:IMSR_JAX:007576 | |
| Strain, strain background (Mus musculus, mix) | Rosa26mGFP/mTmG | This paper | Obtained by breeding mTmG mouse with Pgk1-cre | |
| Strain, strain background (Mus musculus, C57/Bl6) | Ctnnb1lox(ex3)/lox(ex3) | PMID:10545105 | RRID: MGI:2673882 | |
| Strain, strain background (Mus musculus, 129S2/SvPasCrl) | Igf1r +/- | PMID:12483226 | RRID: MGI:3775301 | |
| Strain, strain background (Mus musculus, C57/Bl6) | TCF/LEF:H2B-GFP | PMID: 21176145 | Strain #:013752; RRID:IMSR_JAX:013752 | |
| Chemical compound, drug | Hoechst 33342 | Invitrogen | H3570 | 1:1000 |
| Other | Adeno-Associated Virus (AAV8-Cre) | Gene Transfer and Cell Therapy Core Facility, Faculty of Medicine, University of Helsinki | 1:100 (stock: 1.13×10⁹ vg/µl) | |
| Software, algorithm | Imaris | Bitplane | RRID:SCR_007370 | |
| Software, algorithm | Fiji | http://fiji.sc | RRID:SCR_002285 | |
| Software, algorithm | AfterQc | PMID:28361673 | RRID:SCR_016390 | |
| Software, algorithm | SortMeRNA | PMID:23071270 | RRID:SCR_014402 | |
| Software, algorithm | DEseq2 | PMID;25516281 | RRID:SCR_015687 | |
| Software, algorithm | Limma | PMID:25605792 | RRID:SCR_010943 | |
| Software, algorithm | biomaRt | PMID:16082012; 19617889 | RRID:SCR_019214 | |
| Software, algorithm | Salmon | PMID:28263959 | RRID:SCR_017036 | |
| Software, algorithm | Mfuzz | PMID:28263959;16078370 | RRID:SCR_000523 | |
| Software, algorithm | GraphPad Prism | GraphPad Software | RRID:SCR_002798 | |
| Software, algorithm | R Project for Statistical Computing | http://www.r-project.org/ | RRID:SCR_001905 |
Additional files
-
Supplementary file 1
The list of identified marker genes for each mesenchyme and their normalized expression value in each sample.
- https://cdn.elifesciences.org/articles/93326/elife-93326-supp1-v2.xlsx
-
Supplementary file 2
The results of mFuzz analysis shown in Figure 5F and the normalized expression value of each gene in each sample.
- https://cdn.elifesciences.org/articles/93326/elife-93326-supp2-v2.xlsx
-
MDAR checklist
- https://cdn.elifesciences.org/articles/93326/elife-93326-mdarchecklist1-v2.pdf
Download links
A two-part list of links to download the article, or parts of the article, in various formats.
Downloads (link to download the article as PDF)
Open citations (links to open the citations from this article in various online reference manager services)
Cite this article (links to download the citations from this article in formats compatible with various reference manager tools)
Mesenchyme instructs growth while epithelium directs branching in the mouse mammary gland
eLife 13:e93326.
https://doi.org/10.7554/eLife.93326


