Neural evidence of functional compensation for fluid intelligence in healthy ageing
- Medical Research Council Cognition and Brain Sciences Unit, United Kingdom
- Department of Psychiatry, University of Cambridge, United Kingdom
- School of Psychology, University of Sussex, United Kingdom
- Department of Clinical Neurosciences, University of Cambridge, United Kingdom
- Department of Psychology, University of Cambridge, United Kingdom
Figures
Figure 1
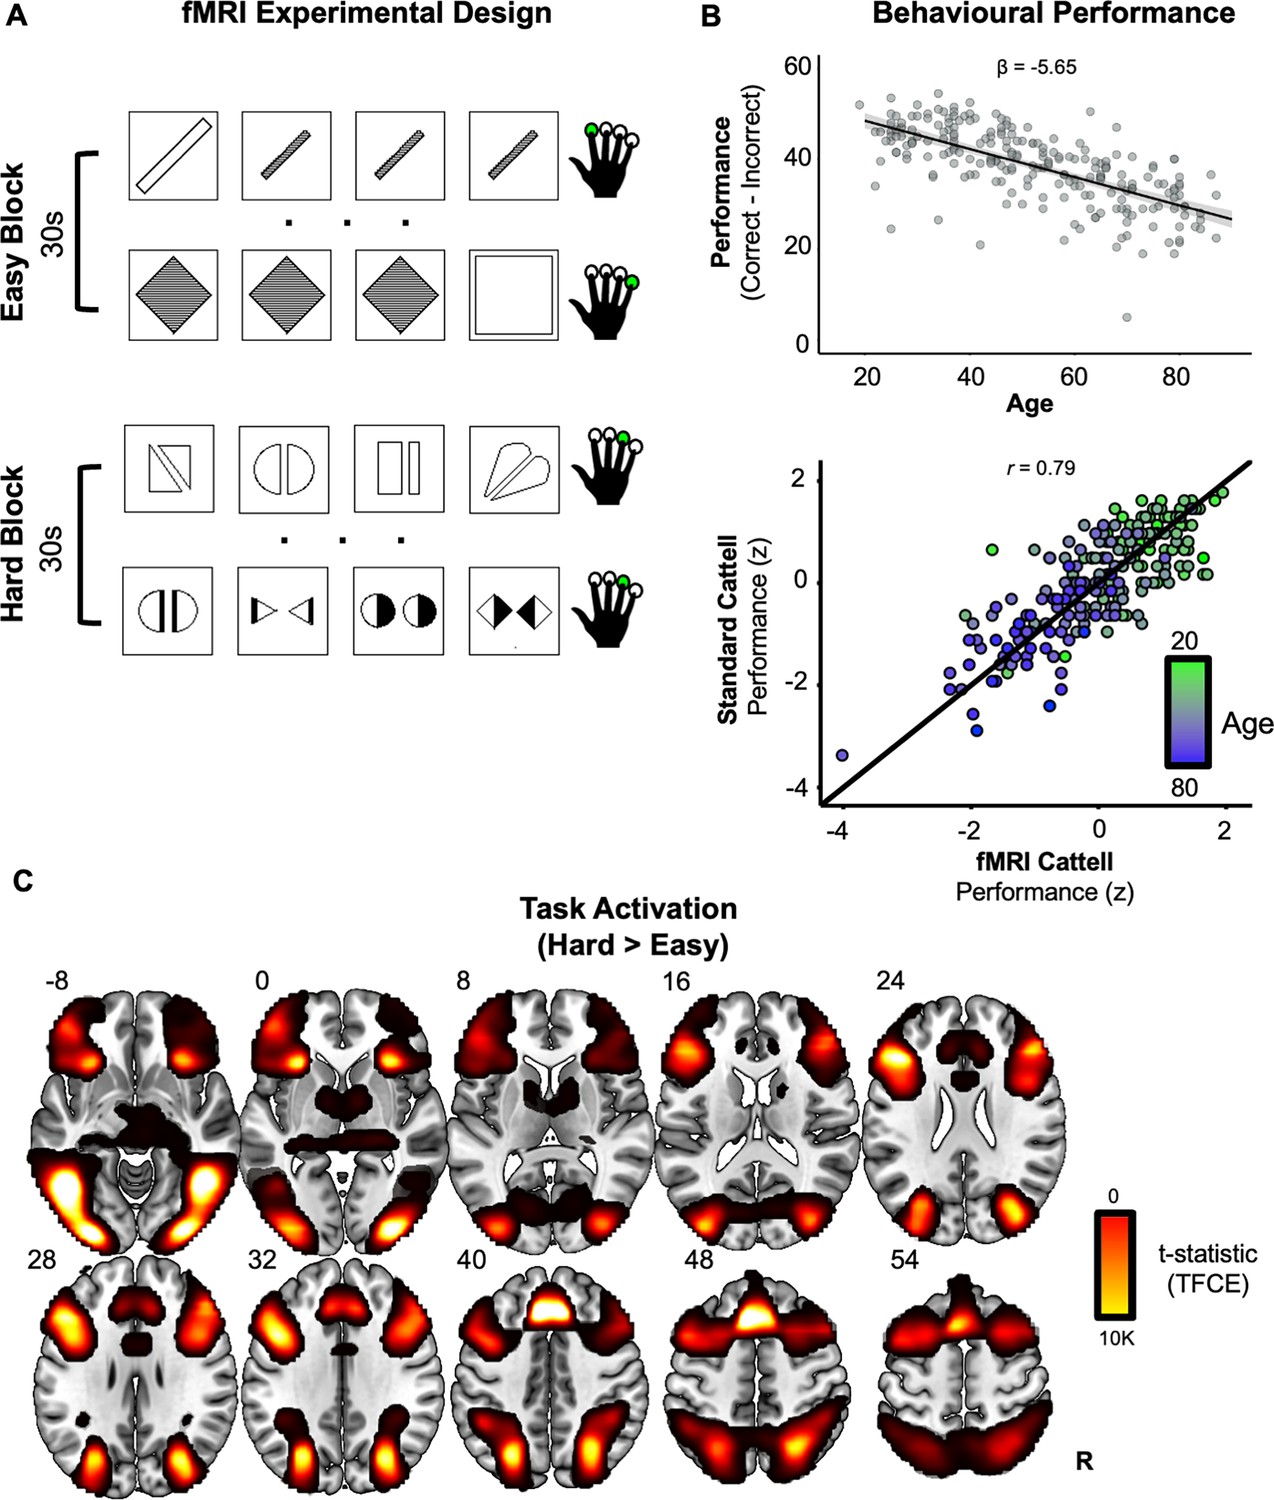
Experimental design, behavioural performance and task activation effects.
(A) Functional magnetic resonance imaging (fMRI) version of Cattell task. On each trial (each row), participants select the odd-one-out from four panels with a single finger button-press (green circles). Condition blocks (30 s) alternate between easy vs. hard puzzles. (B) Behavioural age-related decline. Performance (correct minus incorrect in fMRI version of Cattell task) significantly declined linearly with age (upper). High reliability was observed between performance measures from the standard Cattell task and the modified version used for fMRI (lower). In the upper panel, the black line represents the fitted-regression estimates with shaded 95% confidence intervals. In the lower panel, the black line represents perfect correlation between the two Cattell versions. (C) Univariate task effect. Whole-brain voxel-wise activations for solving the puzzles in the hard, relative to easy, blocks, after threshold-free cluster enhanced (TFCE) correction (slices are labelled with z MNI coordinates).
Figure 2
Univariate analysis.
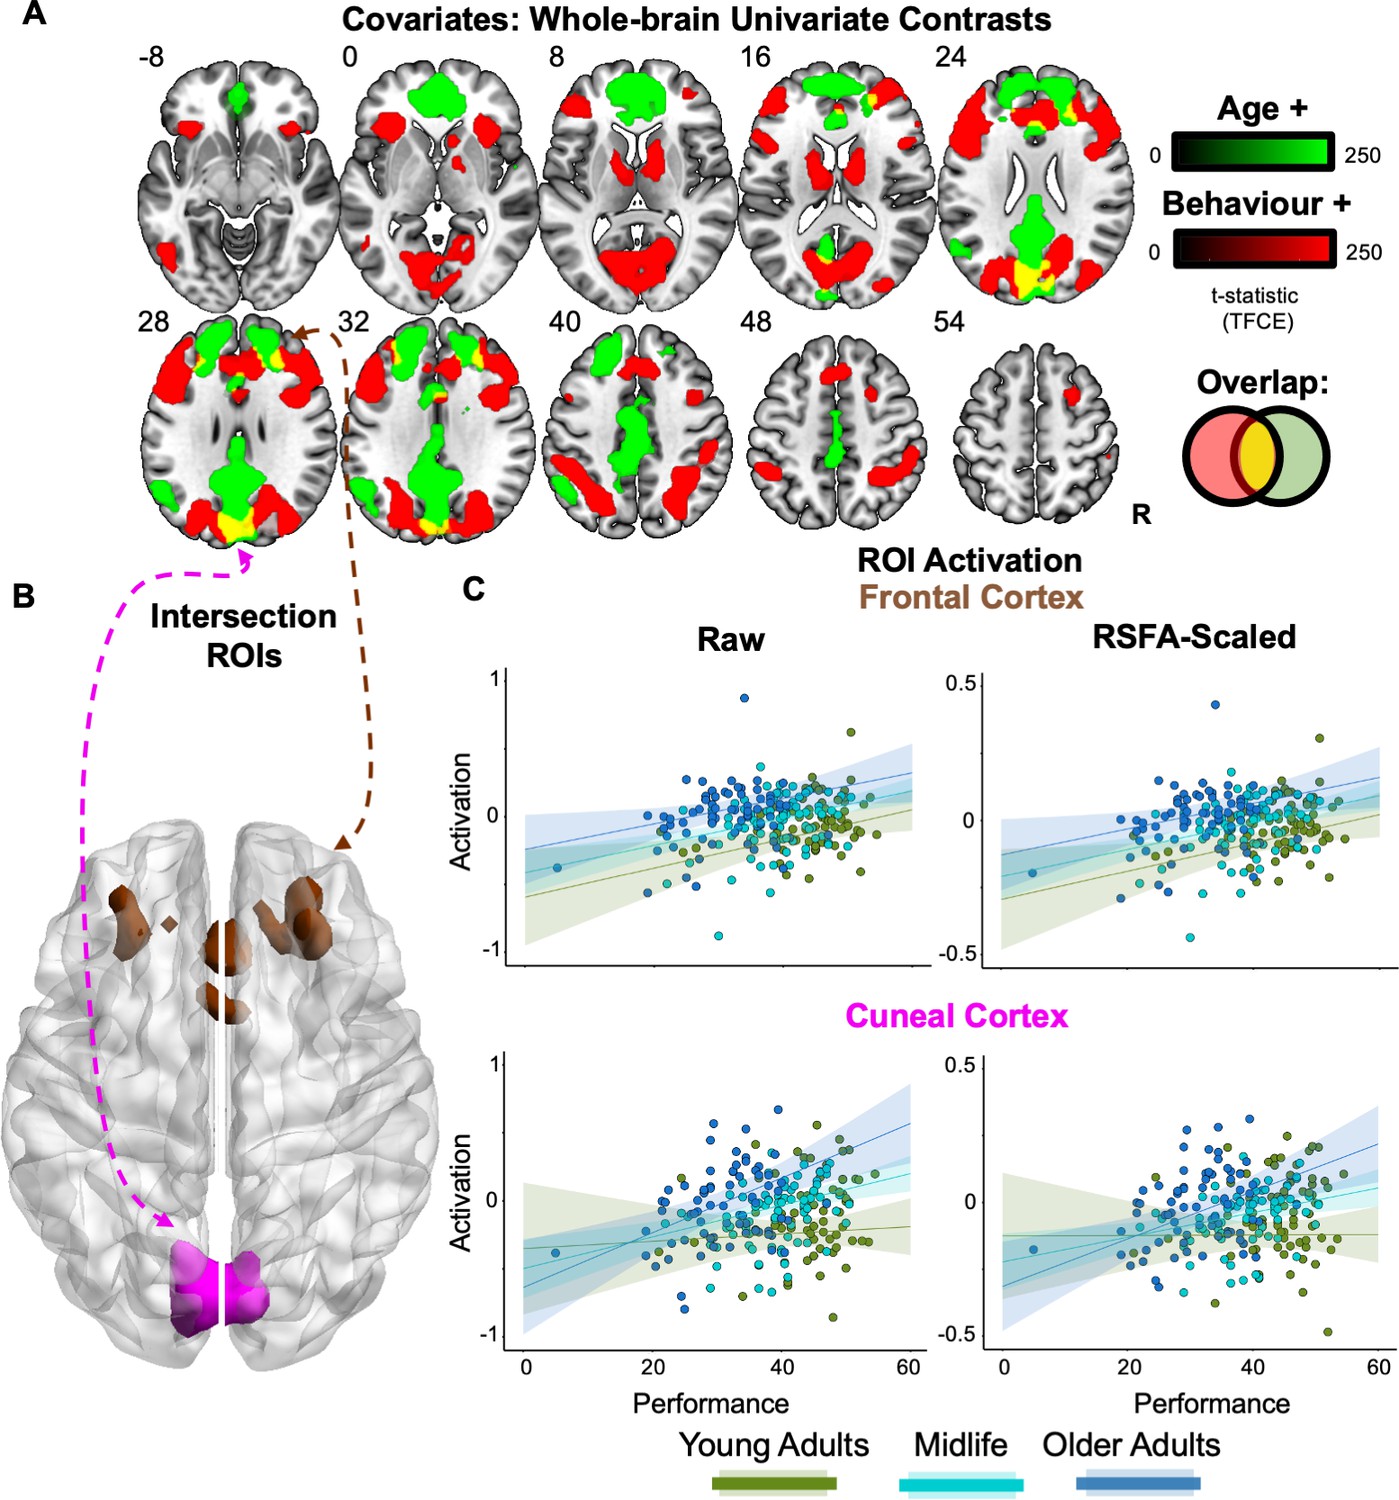
(A) Whole-brain effects of age and performance. Age (green) and performance (red) positively predicted unique aspects of increased task activation, with their spatial overlap (yellow) being overlaid on a template MNI brain, using p < 0.05 threshold-free cluster enhanced (TFCE) with z MNI coordinate labels. (B) Intersection regions of interest (ROIs). A bilateral cuneal (magenta) and frontal cortex (brown) ROI were defined from voxels that showed a positive and unique effect of both age and performance (yellow map in A). (C) ROI activation. Activation (raw = left; Resting State Fluctuation Amplitude [RSFA]-scaled = right) is plotted against behavioural performance based on a tertile split between three age groups (19–44, 45–63, and 64–87 years).
Figure 3
Multivariate analysis.
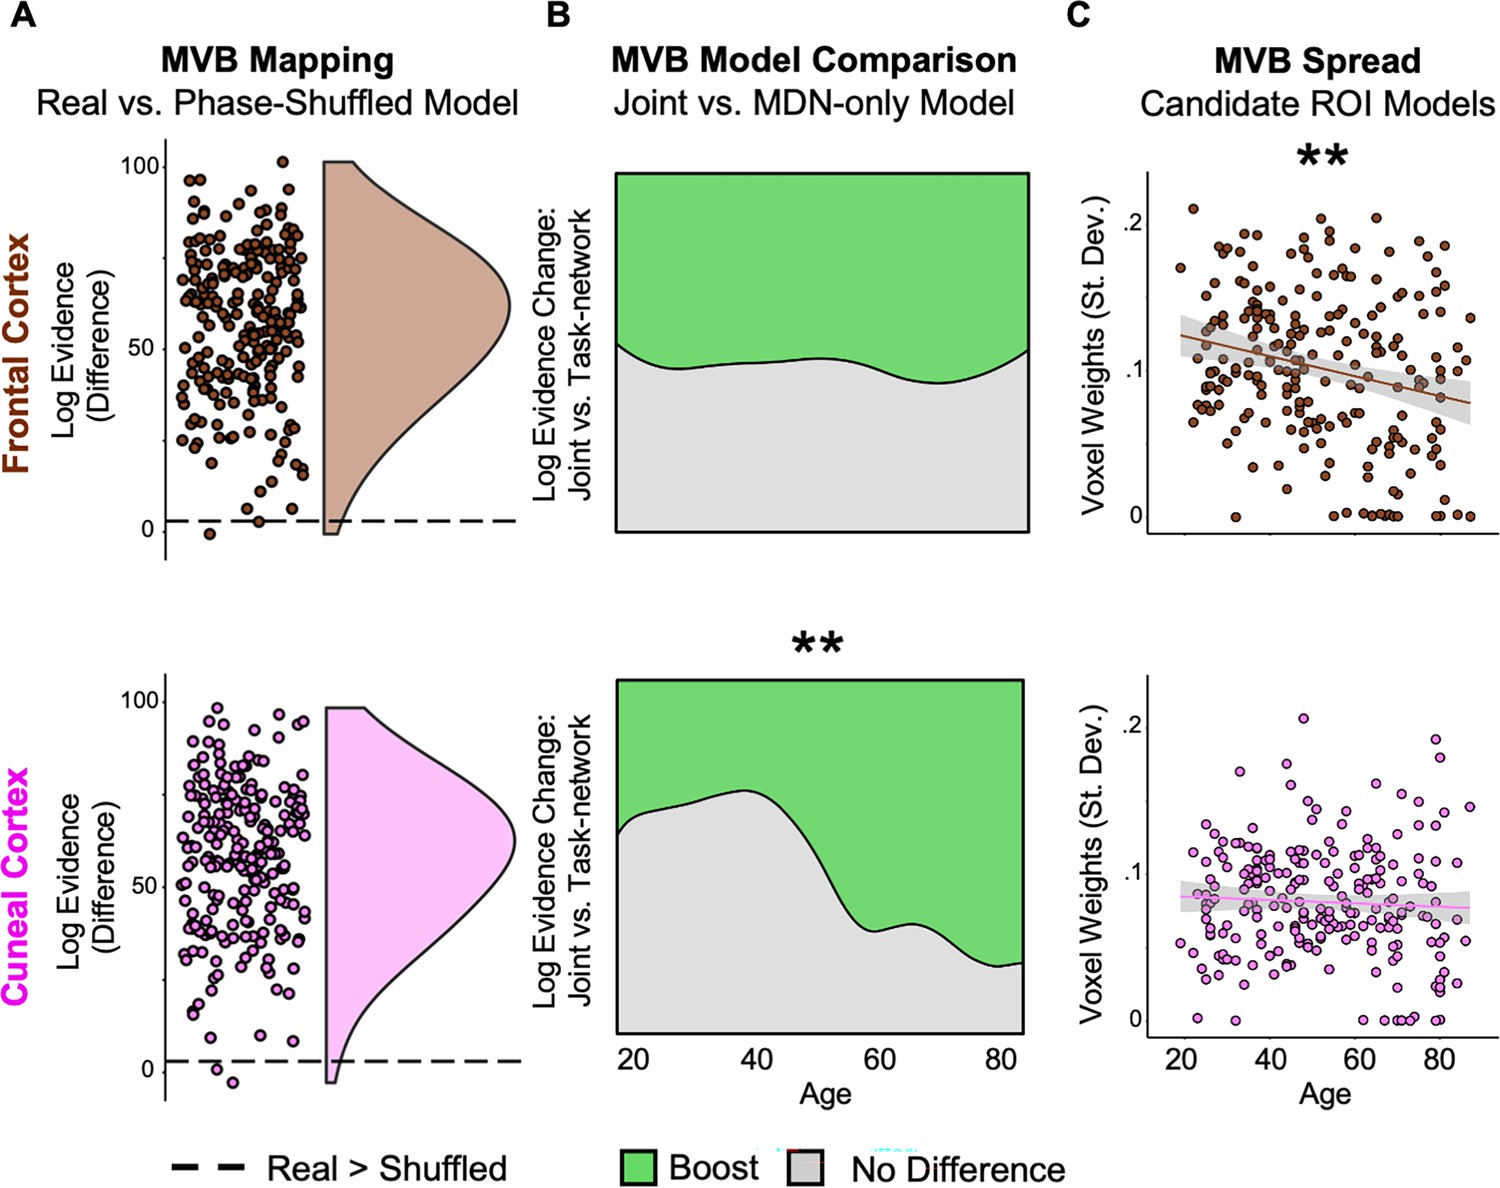
(A) Multivariate Bayesian (MVB) decoding. Points represent the difference in log evidence per participant (for the real vs. shuffled model) for the joint model using activation patterns to decode the [Hard > Easy] contrast. (B) Boost likelihood model comparison. Across age, a smoothed density estimate represents the likelihood that there was a boost (of log evidence >3; green) or no difference (grey) to model evidence per participant when decoding models included activation patterns from either of the compensation regions of interest (ROIs) (Figure 2B) in addition to the multiple demand network (MDN) (Figure 1C), relative to a model that sampled only from the MDN. A significant positive linear effect of age on boost likelihood was observed for the cuneal (lower) but not frontal ROI (upper). (C) MVB spread. Points represent the spread (standard deviation) of multivariate responses, showing a reduction with age in frontal cortex. ** denotes p < 0.01.
Author response image 1

Negative effect of age on MVB log evidence model outcomes for frontal cortex.
Tables
Table 1
Standardised coefficients in multiple regression predicting functional magnetic resonance imaging (fMRI) activation (Hard − Easy) as a function of Age and Performance for the two regions of interest (ROIs) identified in Figure 2.
Note that the p-values for the main effects of Age and Performance are biased by the selection of these voxels. RSFA = scaled by Resting-State Fluctuation Amplitudes (see text).
| Region | Coefficient | Estimate | t value | p |
|---|---|---|---|---|
| Cuneal | ||||
| Constant term | −0.06 | −2.57 | 0.011 | |
| Age | 0.09 | 3.57 | <0.001 | |
| Performance | 0.08 | 3.21 | 0.002 | |
| Sex | −0.05 | −2.59 | 0.01 | |
| Age × Performance | 0.04 | 2.21 | 0.028 | |
| Cuneal (RSFA) | ||||
| Constant term | −0.03 | −2.60 | 0.010 | |
| Age | 0.04 | 3.24 | 0.001 | |
| Performance | 0.04 | 3.11 | 0.002 | |
| Sex | −0.02 | −2.52 | 0.013 | |
| Age × Performance | 0.02 | 1.97 | 0.049 | |
| Frontal | ||||
| Constant term | −0.03 | −2.02 | 0.045 | |
| Age | 0.08 | 4.24 | <0.001 | |
| Performance | 0.08 | 4.54 | <0.001 | |
| Sex | <0.001 | −0.35 | 0.728 | |
| Age × Performance | <0.001 | −0.15 | 0.882 | |
| Frontal (RSFA) | ||||
| Constant term | −0.02 | −1.99 | 0.048 | |
| Age | 0.04 | 4.12 | <0.001 | |
| Performance | 0.04 | 4.48 | <0.001 | |
| Sex | 0.00 | −0.37 | 0.709 | |
| Age × Performance | 0.00 | −0.13 | 0.898 |
Table 2
Standardised coefficients in multivariate Bayesian (MVB) multiple logistic regression analyses predicting boost likelihood as a function of age or the spread of voxel weights (with Sex and Mean Univariate Activation as covariates).
| Analysis | Model | Coefficient | Estimate | z/t-statistic | p |
|---|---|---|---|---|---|
| Boost likelihood | |||||
| Cuneal ROI + Task-network (166 voxels each) | |||||
| Constant term | 2.17 | 8.79 | <0.001 | ||
| Age | 0.79 | 3.23 | <0.001 | ||
| Sex | 0.08 | 0.37 | 0.714 | ||
| Univariate | −0.34 | −1.59 | 0.112 | ||
| Frontal ROI + Task-network (85 voxels each) | |||||
| Constant term | 2.20 | 9.30 | <0.001 | ||
| Age | 0.04 | 0.19 | 0.851 | ||
| Sex | 0.26 | 1.13 | 0.257 | ||
| Univariate | −0.54 | −2.33 | 0.020 | ||
| Spread (weights) | |||||
| Cuneal ROI | |||||
| Constant term | <−0.001 | <0.001 | >0.999 | ||
| Age | −0.06 | −0.84 | 0.403 | ||
| Sex | −0.05 | −0.64 | 0.521 | ||
| Univariate | 0.01 | 0.09 | 0.932 | ||
| Frontal ROI | |||||
| Constant term | <−0.001 | <0.001 | >0.999 | ||
| Age | −0.19 | −2.89 | 0.005 | ||
| Sex | −0.09 | −1.37 | 0.171 | ||
| Univariate | 0.09 | 1.33 | 0.185 |
Additional files
Download links
A two-part list of links to download the article, or parts of the article, in various formats.
Downloads (link to download the article as PDF)
Open citations (links to open the citations from this article in various online reference manager services)
Cite this article (links to download the citations from this article in formats compatible with various reference manager tools)
Neural evidence of functional compensation for fluid intelligence in healthy ageing
eLife 13:RP93327.
https://doi.org/10.7554/eLife.93327.3


