Evolutionary rate covariation is a reliable predictor of co-functional interactions but not necessarily physical interactions
- Department of Human Genetics, University of Utah, United States
- Department of Computational Biology, University of Pittsburgh, United States
- Department of Biological Sciences, University of Pittsburgh, United States
Figures
Figure 1

Overview of experimental schema and hypotheses.
Proteins that share functional/physical relationships have similar relative rates of evolution across the phylogeny, as shown in (A) with SMC5 and SMC6. The color scale along the bottom indicates the relative evolutionary rate (RER) of the specific protein for that species compared to the genome-wide average. A higher (red) RER indicates that the protein is evolving at a faster rate than the genome average for that branch. Conversely, a lower (blue) RER indicates that protein is evolving at a slower rate than the genome average. The ERC (right) is a Pearson correlation of the RERs for each shared branch of the gene pair. (B) Suppose the correlation in RERs between two proteins is due to compensatory coevolution and physical interactions. In that case, the correlation of their rates (.ie., ERC value) would be higher for just the amino acids in the physically interacting domain. (C) Outline of experimental design. All panels were created with Biorender.com and published using a CC BY-NC-ND license with permission.
© 2024, BioRender Inc. Figure 1 was created using BioRender, and is published under a CC BY-NC-ND 4.0 [https://creativecommons.org/licenses/by-nc-nd/4.0/]. Further reproductions must adhere to the terms of this license
Figure 2 with 2 supplements
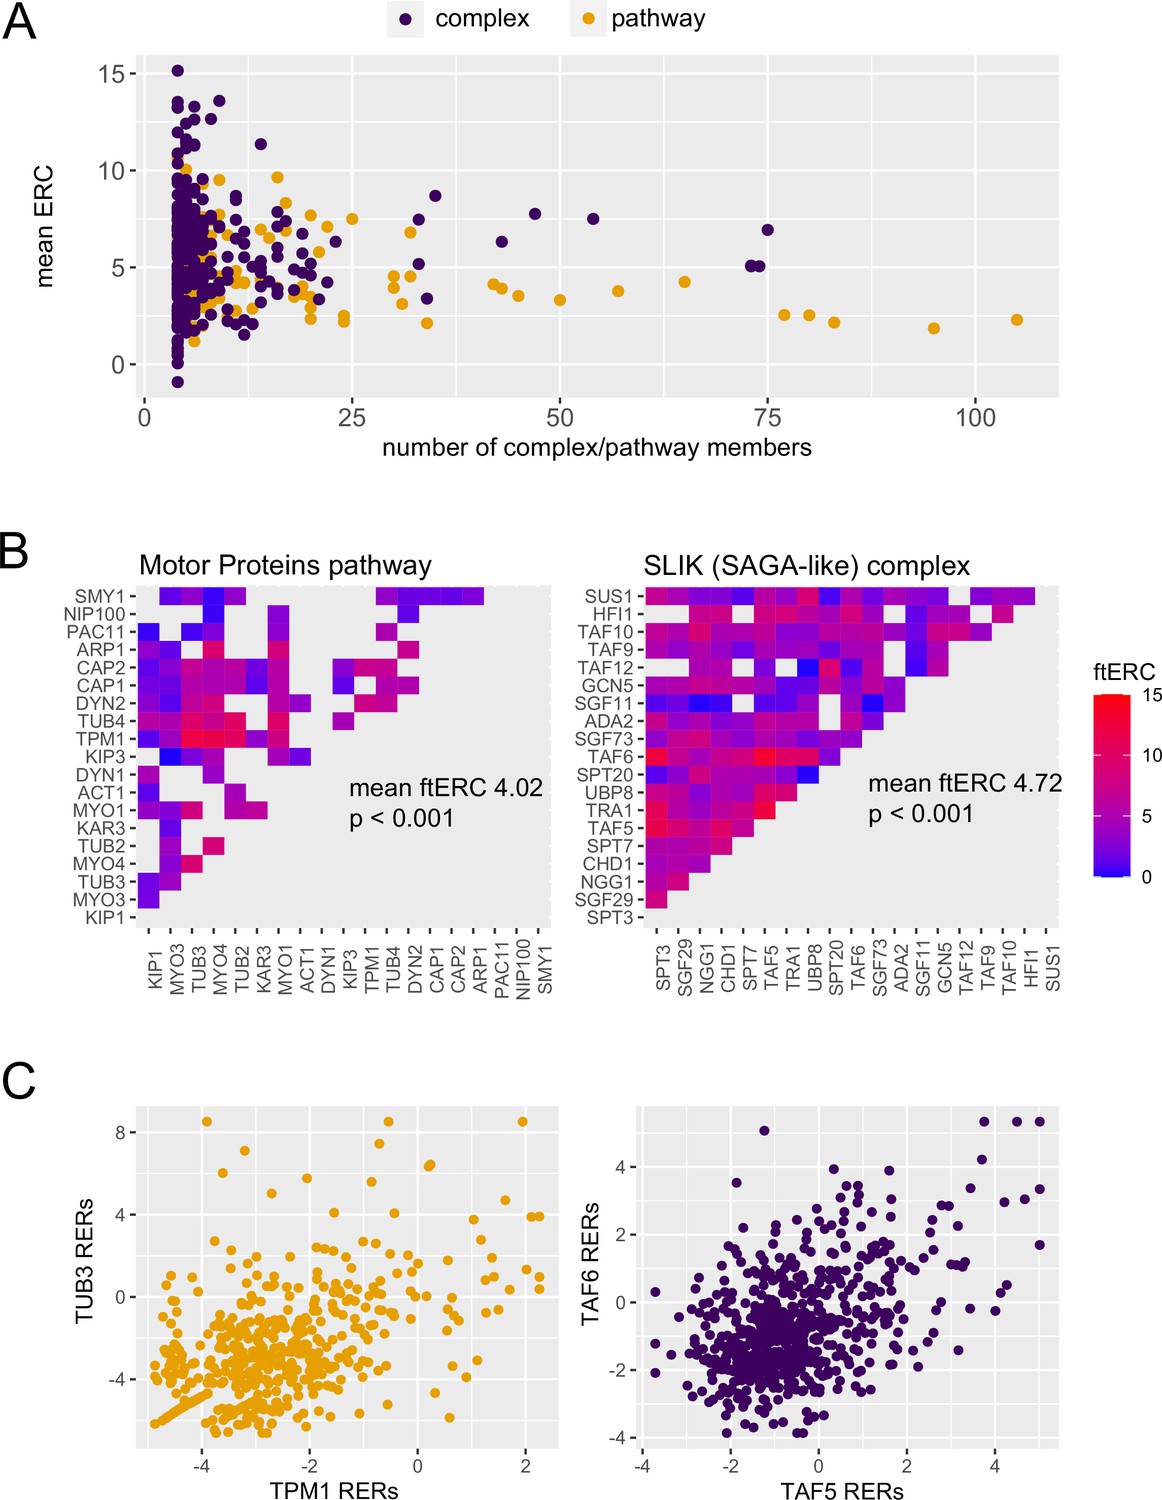
Protein complexes and cellular pathways have significantly high average evolutionary rate covariation (ERC).
(A) The mean ERC values for 617 protein complexes (purple, median 5.366) and 125 cellular pathways (orange, median 4.597) versus the number of members contributing to the score. (B) Heat maps of the ERC scores for each protein pair in the motor proteins pathway (left) and SLIK complex (right). ERC for members of the motor proteins pathways that physically interact was set to NA (gray). (C) Scatter plots of the relative evolutionary rates for the top scoring pair from the motor proteins pathway (orange) and SLIK complex (purple).
Figure 2—figure supplement 1
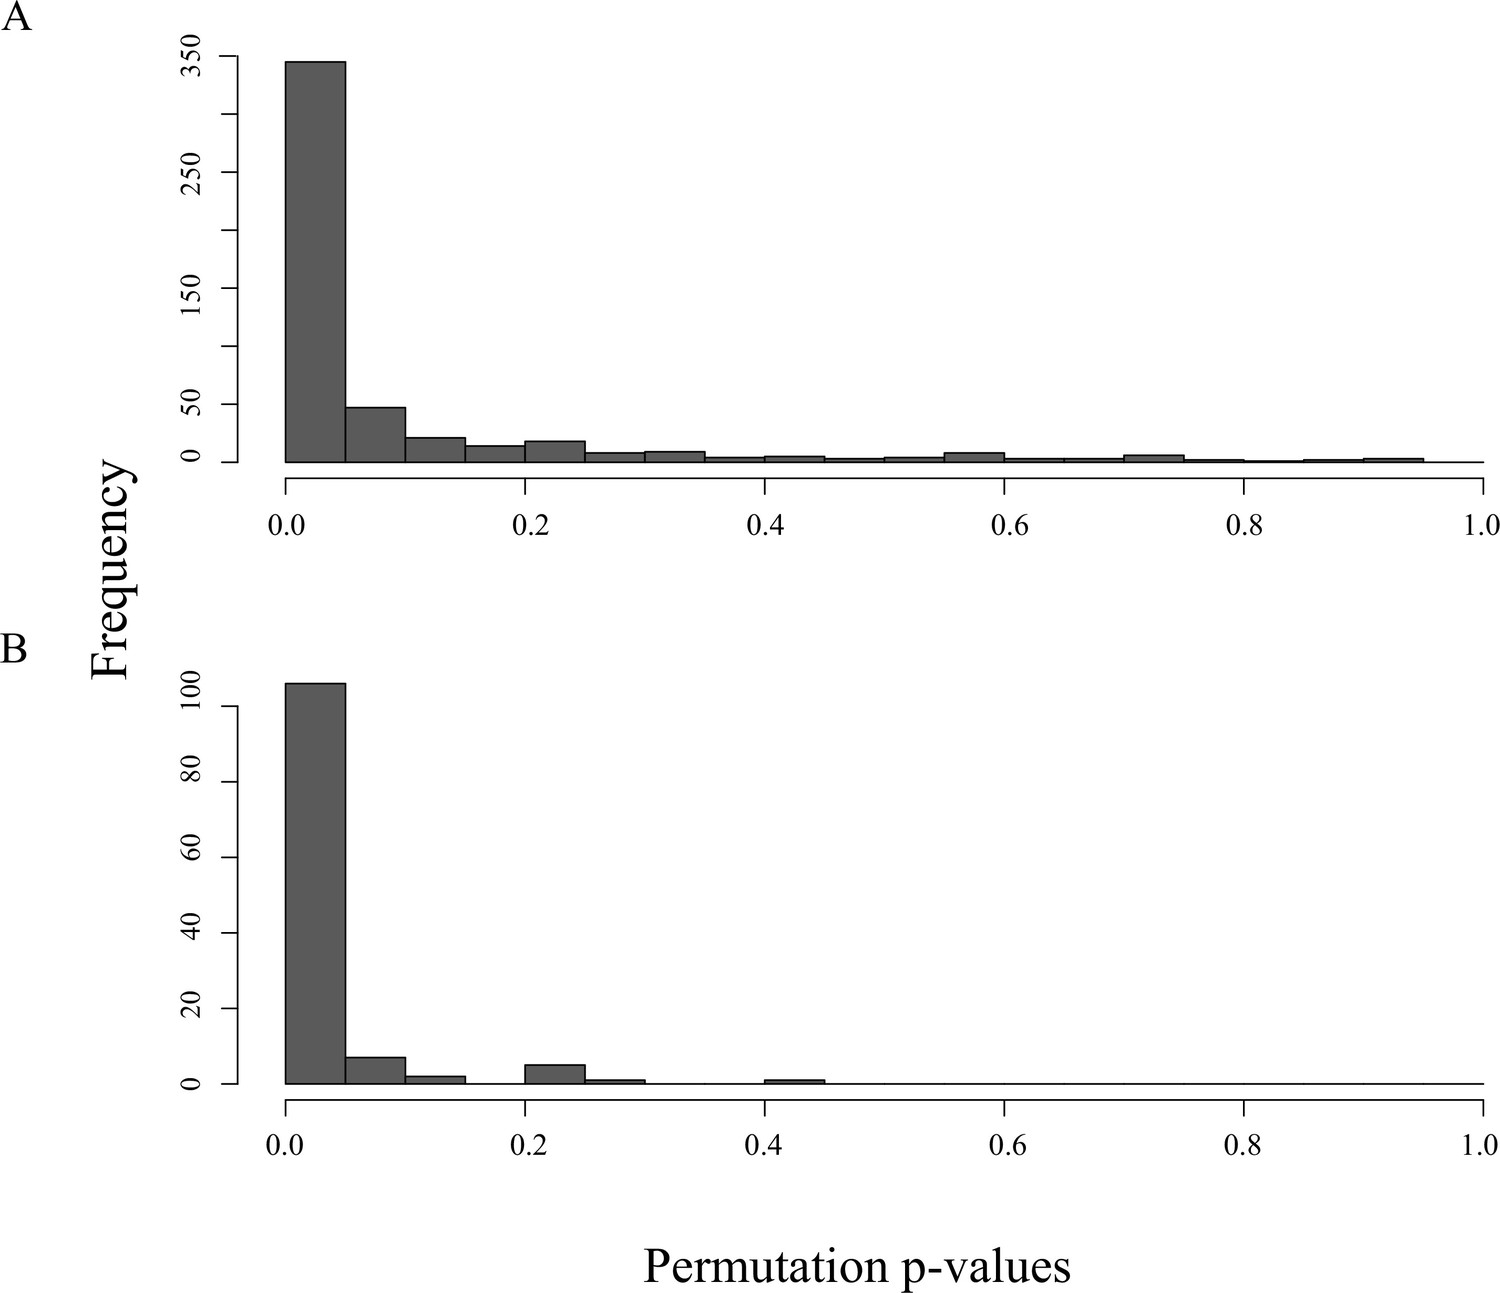
Permutation p-value distribution of 617 protein complexes (A) and 125 pathways (B) when compared to a null distribution of 1000 samples.
Figure 2—figure supplement 2

Histogram of the Fisher transformed evolutionary rate covariation (ERC) values for all 12,552 orthologous genes in the 343 yeast dataset.
Median = 0.953.
Figure 3
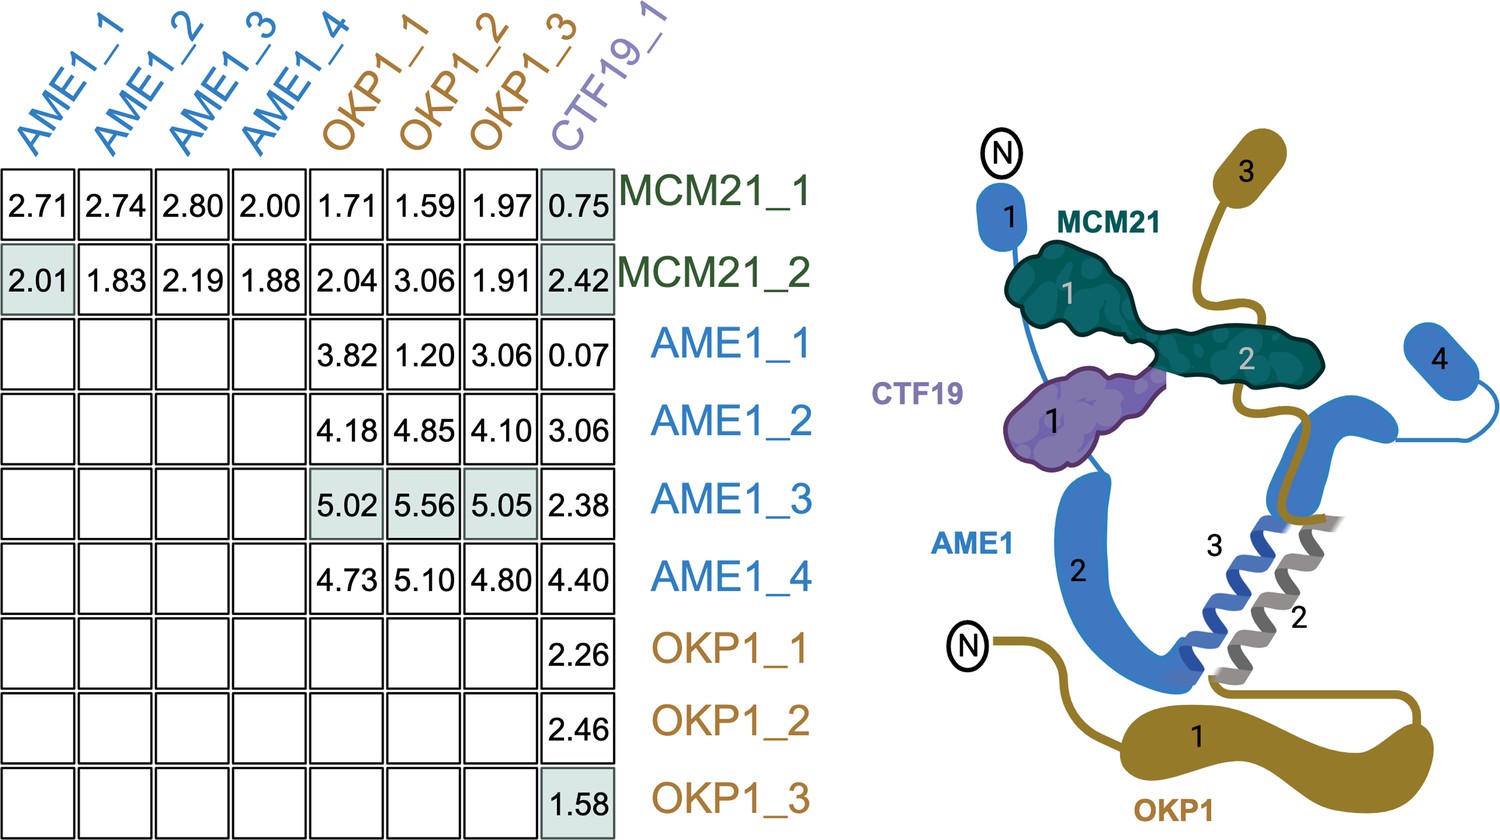
Recreation of Figure 1B with the COMA complex.
The table shows the evolutionary rate covariation (ERC) values for each domain pair as labeled in the cartoon on the right. The domain pairs with physical interactions are highlighted in green.
Figure 4
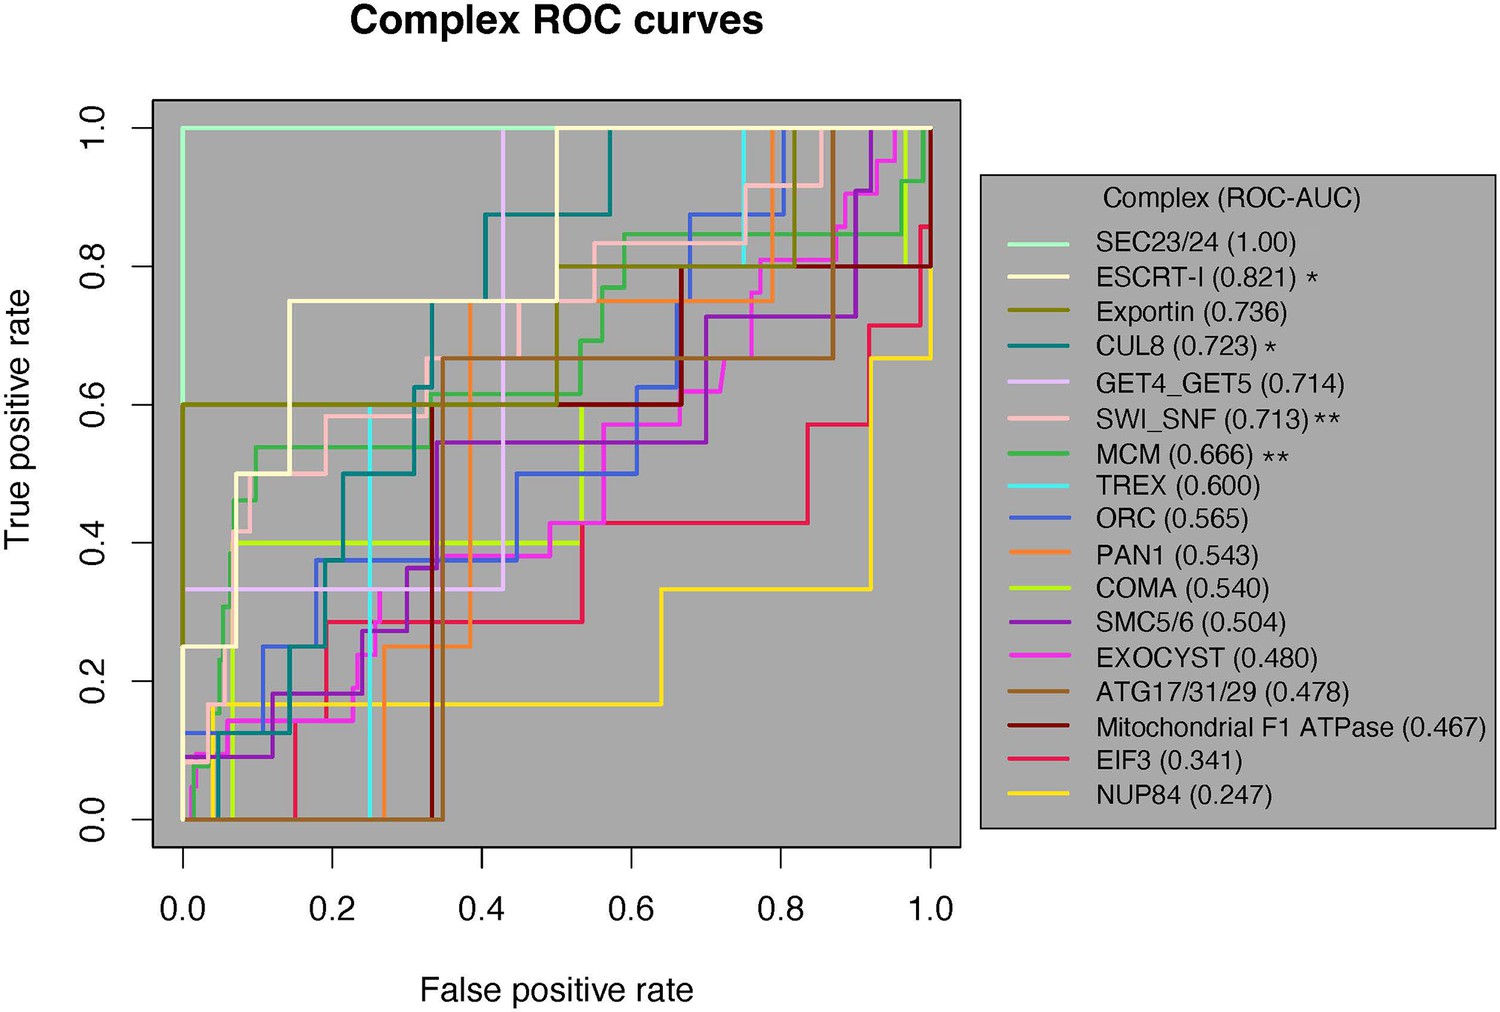
Receiver-operating characteristic (ROC) curve analysis of all 17 protein complexes.
Of the 17 complexes, 12 have an ROC-AUC > 0.5. The SEC23/24 complex (bright green) has the highest ROC-AUC at 1, and the NUP84 complex (marigold) has the lowest AUC of 0.247. One-tailed Mann–Whitney U test, *p<0.05, **p<0.01. AUC, area under the curve.
Figure 5
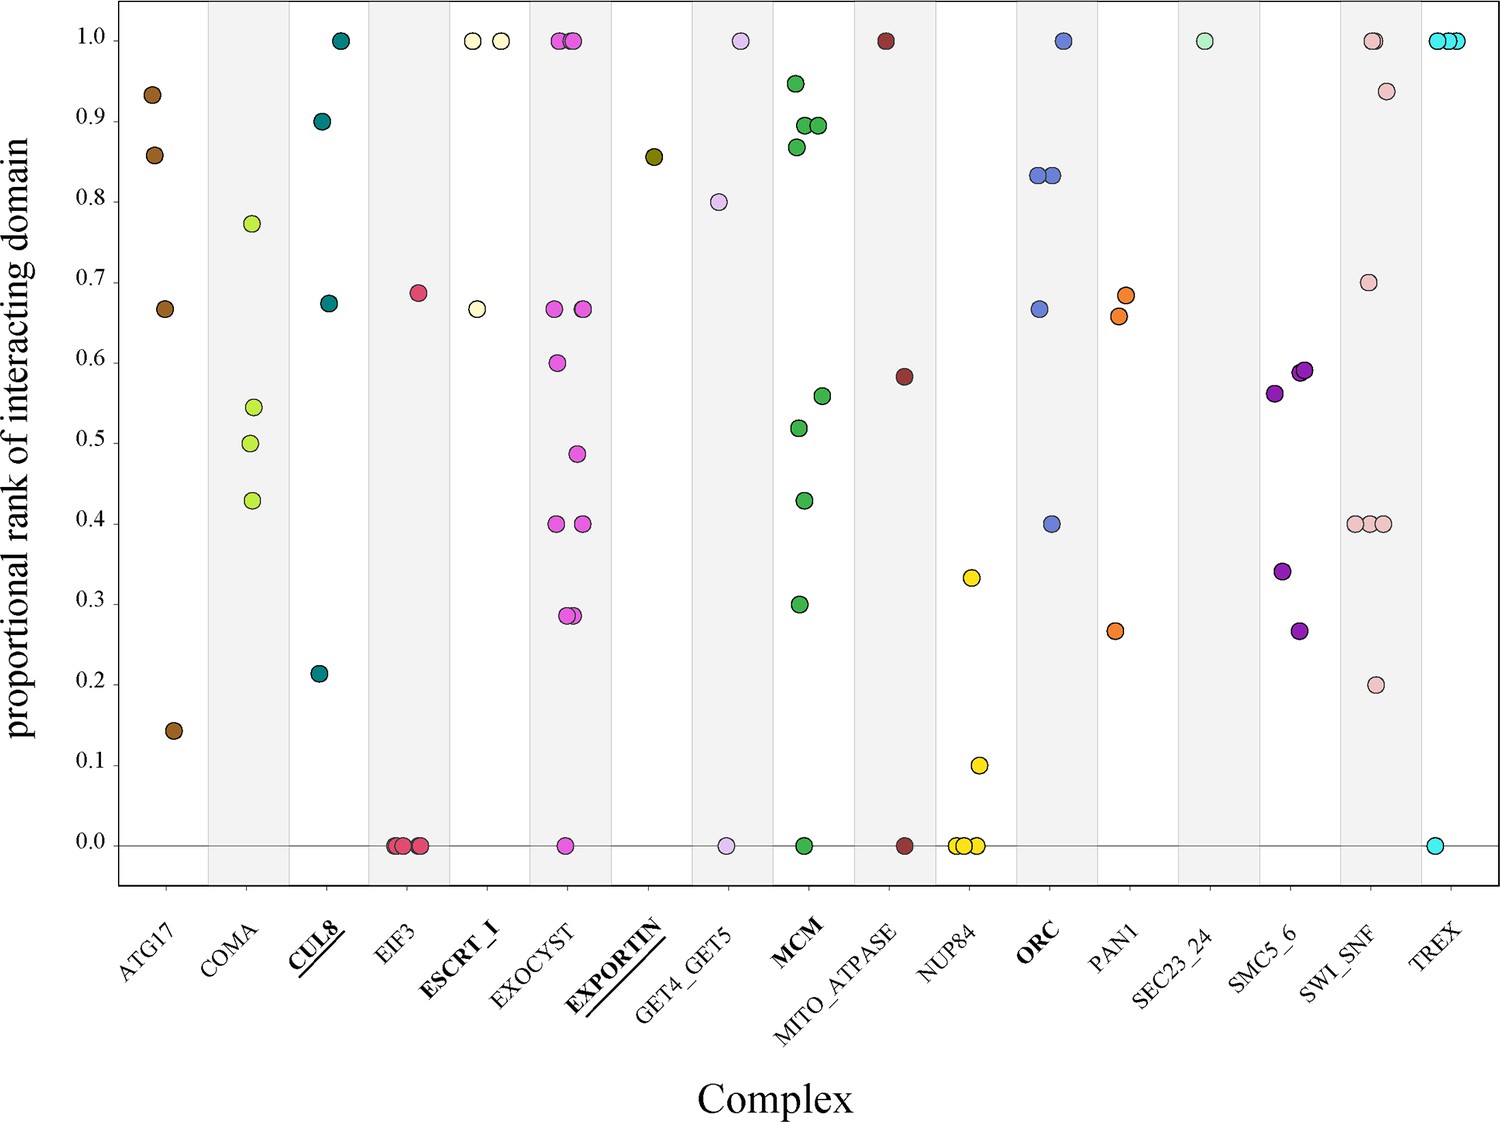
Protein-vs-protein physically interacting domains do not consistently rank higher than nonphysically interacting domains.
The domains from individual protein pairs within each complex were ranked, and the proportional ranking of the physically interacting domain was calculated. Each dot represents the proportional rank of the interacting domain pair for a protein pair, with colors representing the compledataxes. A score of 1 indicates that the physically interacting domains were ranked first. A score of 0 indicates that the physically interacting domains were ranked last. Permutation test, p<0.05 (bold), p<0.01 (bold and underlined).
Tables
Table 1
Evolutionary rate covariation for 17 protein complexes and their physically interacting domains.
| Complex | Complex ERC | Complex permutation p-value | Physically interacting domain ERC | Nonphysically interacting domain ERC | Number of proteins (domains) |
|---|---|---|---|---|---|
| Eukaryotic translation initiation factor 3 core complex (Politis et al., 2015) | 11.539 | <0.001 | 8.852 | 11.125 | 6 (14) |
| MCM complex (Frigola et al., 2017) | 12.116 | <0.001 | 10.283 | 8.000 | 6 (26) |
| NUP84 (Shi et al., 2014) | 3.590 | 0.001 | 1.541 | 4.411 | 5 (9) |
| Origin of replication complex (Feng et al., 2021) | 5.420 | 0.012 | 5.250 | 4.035 | 6 (15) |
| PAN1 actin cytoskeleton-regulatory complex (Complex Portal, 2023) | 6.140 | 0.014 | 4.963 | 4.716 | 3 (13) |
| SMC5-6 SUMO ligase complex (Yu et al., 2021) | 8.813 | 0.004 | 5.153 | 4.110 | 4 (15) |
| TREX (Xie et al., 2021) | 5.368 | 0.02 | 4.157 | 4.129 | 5 (12) |
| EXOCYST (Ganesan et al., 2020) | 12.040 | <0.001 | 6.221 | 5.974 | 8 (21) |
| COMA complex (Fischböck-Halwachs et al., 2019) | 2.883 | 0.157 | 3.051 | 2.869 | 4 (11) |
| SWI/SNF chromatin remodeling complex (Han et al., 2020; Schubert et al., 2013) | 1.853 | 0.291 | 4.121 | 1.783 | 7 (20) |
| CUL8-MMS1-MMS22-CTF4 E3 ubiquitin ligase complex (Mimura et al., 2010) | 0.9925 | 0.175 | 2.611 | 1.576 | 5 (14) |
| GET4-GET5 transmembrane domain recognition complex (Chang et al., 2010) | 2.501 | 0.17 | 4.569 | 3.302 | 4 (7) |
| ATG17-ATG31-ATG29 complex (Ragusa et al., 2012) | 1.825 | 0.29 | 3.444 | 1.584 | 5 (9) |
| ESCRT-I complex (Kostelansky et al., 2007) | 2.752 | 0.137 | 4.041 | 2.402 | 4 (8) |
| Mitochondrial F1 ATPase (Jothi et al., 2006) | 11.015 | <0.001 | 4.883 | 5.654 | 3 (7) |
| SEC23/24 heterodimer (Jothi et al., 2006) | 9.321 | 0.004 | 10.530 | 7.754 | 2 (10) |
| Exportin CSE1 with cargo (Jothi et al., 2006) | 10.902 | <0.001 | 8.871 | 6.326 | 2 (12) |
-
ERC, evolutionary rate covariation.
Key resources table
| Reagent type (species) or resource | Designation | Source or reference | Identifiers | Additional information |
|---|---|---|---|---|
| Software, algorithm | ERC | https://github.com/nclark-lab/erc/; copy archived at Clark and Little, 2023 | See ‘Calculating ERC’ | |
| Other | 343 yeast amino acid sequences and trees | https://doi.org/10.1016/j.cell.2018.10.023 | https://doi.org/10.6084/m9.figshare.5854692.v1 |
Additional files
Download links
A two-part list of links to download the article, or parts of the article, in various formats.
Downloads (link to download the article as PDF)
Open citations (links to open the citations from this article in various online reference manager services)
Cite this article (links to download the citations from this article in formats compatible with various reference manager tools)
Evolutionary rate covariation is a reliable predictor of co-functional interactions but not necessarily physical interactions
eLife 12:RP93333.
https://doi.org/10.7554/eLife.93333.3


