Working memory gating in obesity is moderated by striatal dopaminergic gene variants
- Department of Neurology, Max Planck Institute for Human Cognitive & Brain Sciences, Germany
- International Max Planck Research School NeuroCom, Germany
- Collaborative Research Centre 1052, University of Leipzig, Germany
- Department of Psychology and Logopedics, Faculty of Medicine, University of Helsinki, Finland
- Institute of Psychology, Otto von Guericke University Magdeburg, Germany
- Department of Child and Adolescent Psychiatry, University of Würzburg, Germany
- Medical Department III – Endocrinology, Nephrology, Rheumatology, University of Leipzig Medical Center, Germany
- Department of Psychiatry and Psychotherapy, Technische Universität Dresden, Germany
- School of Psychology, University of Plymouth, United Kingdom
Figures
Figure 1
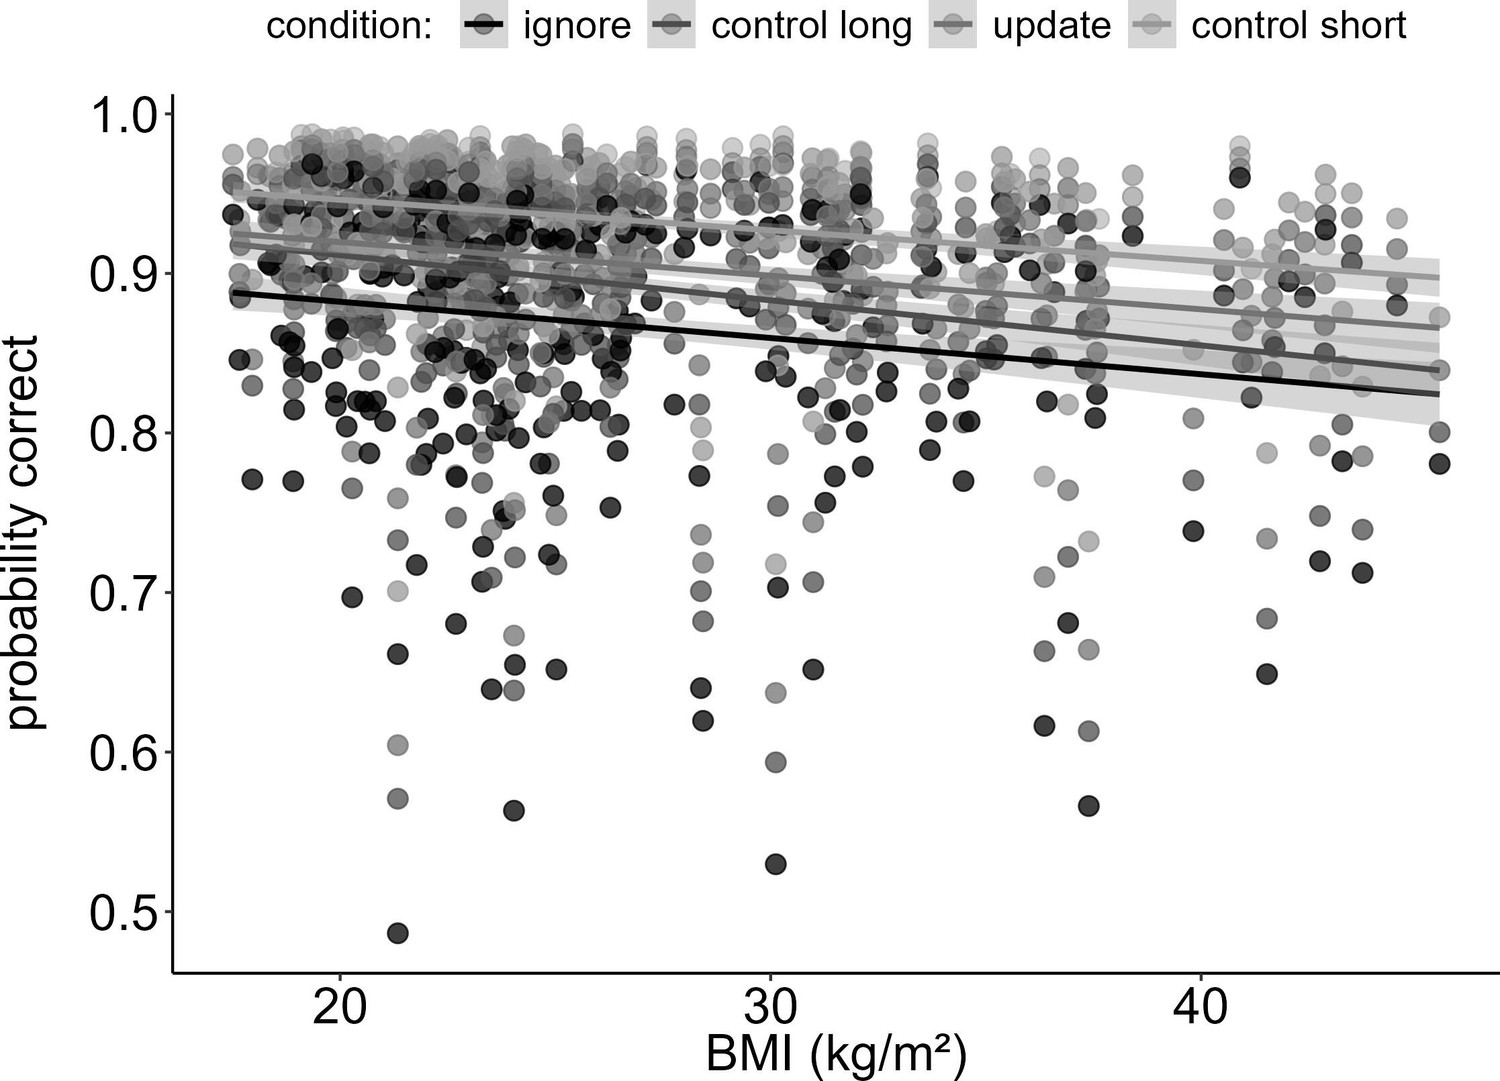
Main effect of BMI on working memory performance (model 1).
Increasing BMI was associated with worse performance (pcorrected < 0.001, OR = 0.84). This trend was similar for all four conditions, as there was no interaction between BMI and condition (pcorrected > 1). Shaded areas represent the 95% confidence intervals. N = 320.
Figure 2
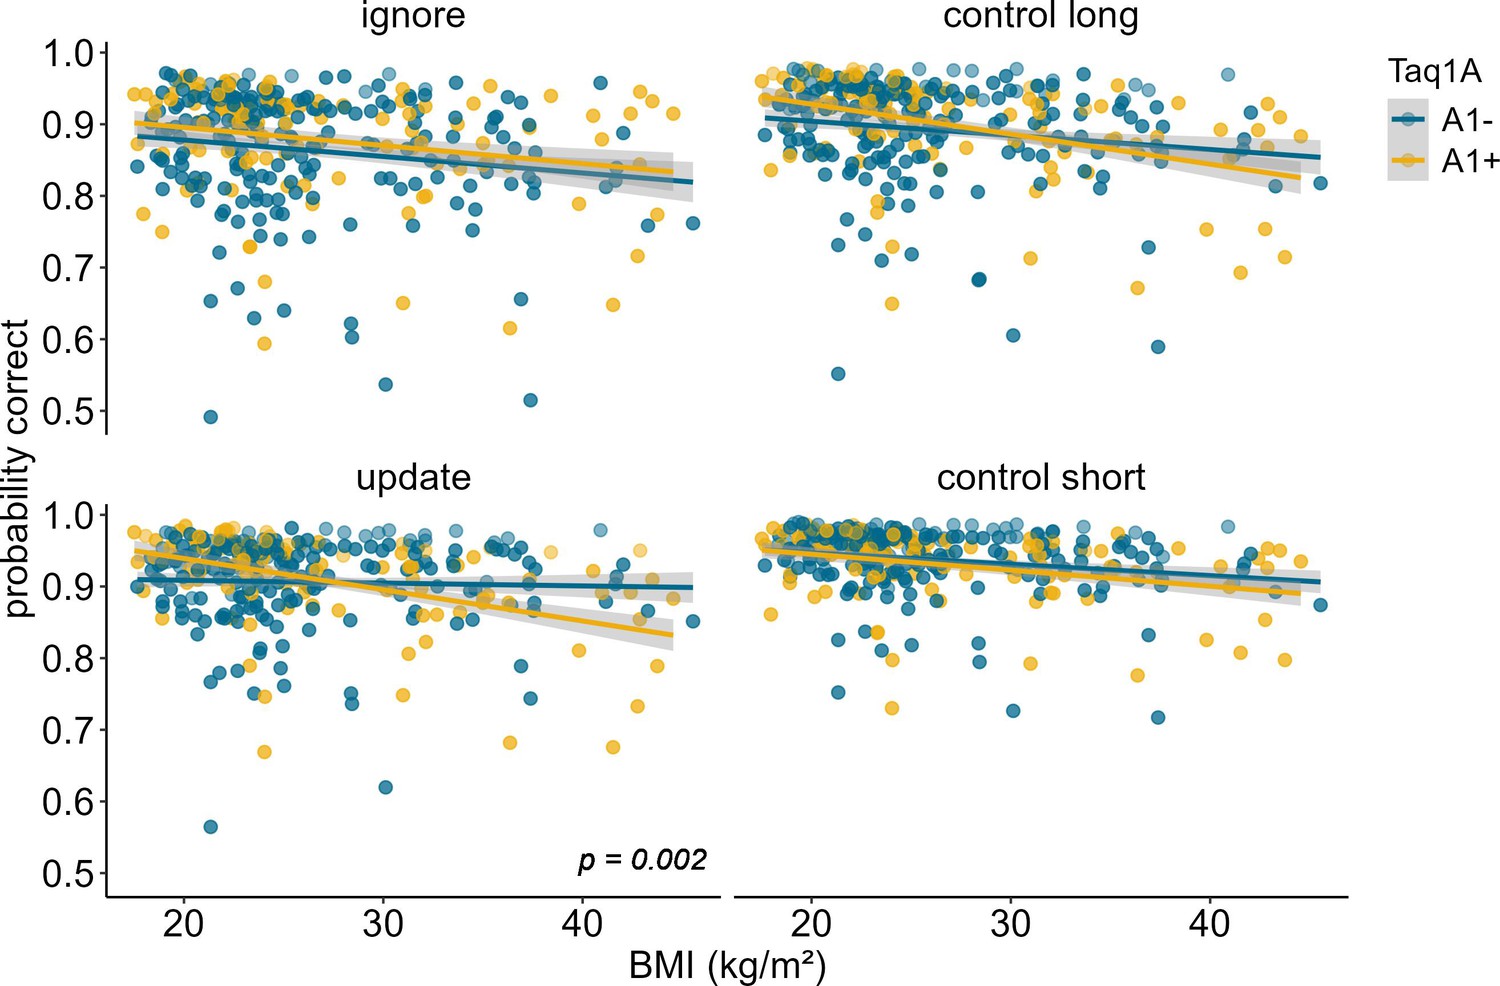
Interaction of Taq1A genotype, BMI, and condition on working memory performance (model 2).
The two-way interaction of Taq1A and BMI was significant in the update condition only (p = 0.002). In this condition, carrying the A-allele led to a 33.9% decrease in performance with each increasing unit of BMI (SE = 7.58), while there was only a 1.22% (SE = 7.21%) decrease in non-carriers. Shaded areas represent the 95% confidence intervals. N = 318.
Figure 3
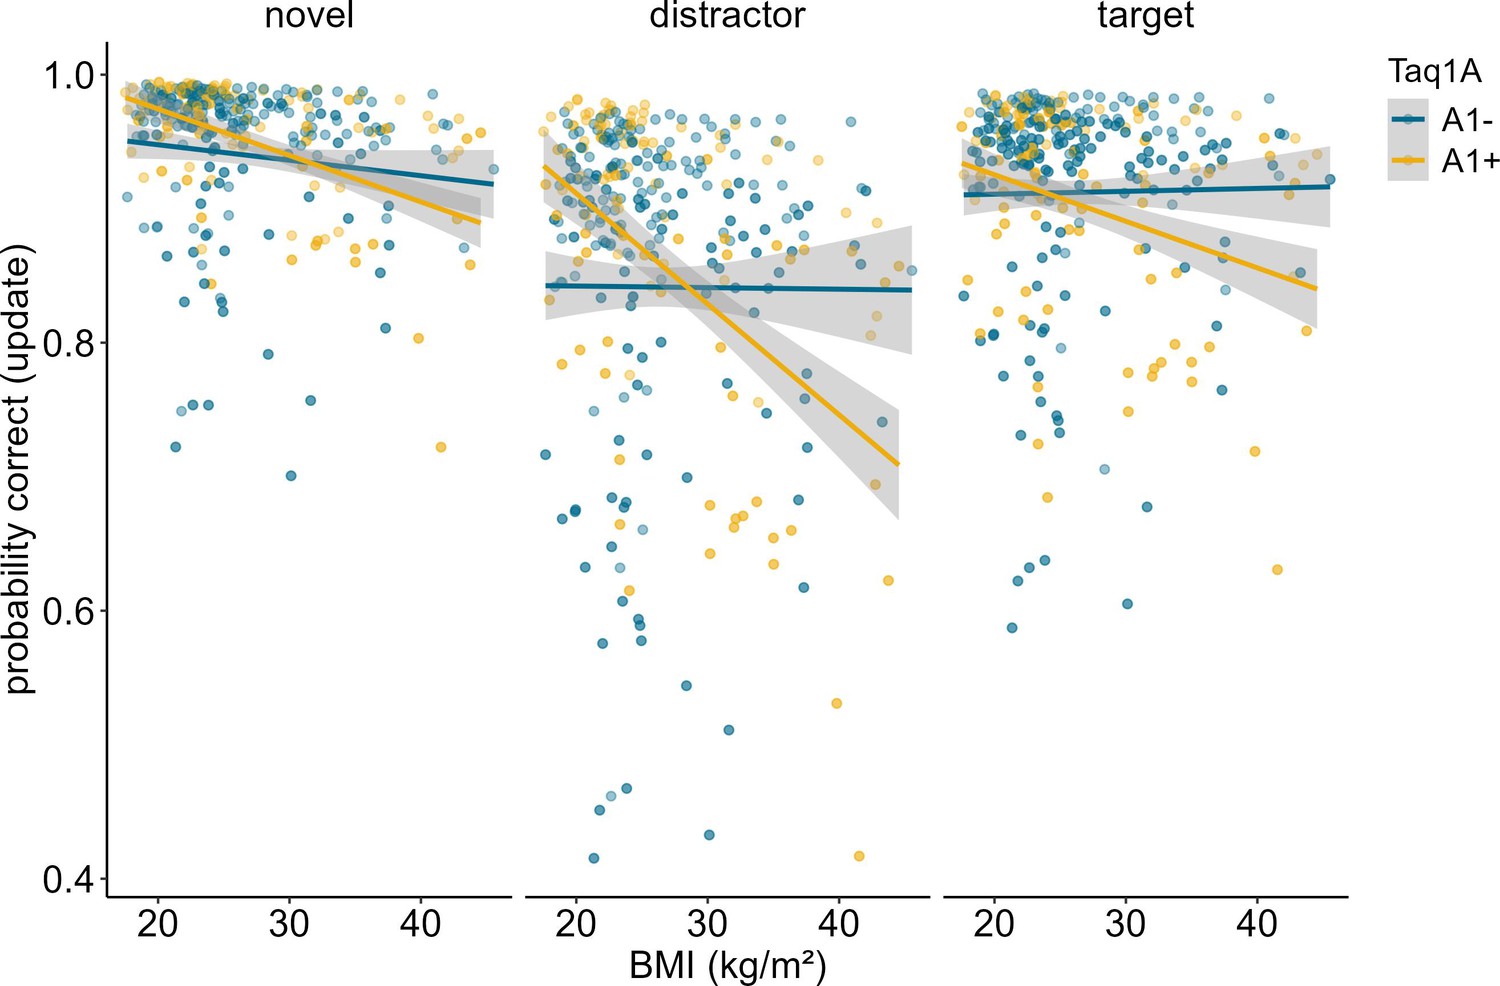
Interaction of Taq1A genotype, BMI, and probe type in updating trials only.
There was no significant three-way interaction between probe type, BMI and Taq1A (p = 0.439). The BMI - Taq1A interaction was in a similar direction in all trials. There was a significant main effect of probe type (p < 0.001). Trials where the probe was a distractor had lowest probability to be correct. Shaded areas represent the 95% confidence intervals.
Figure 4
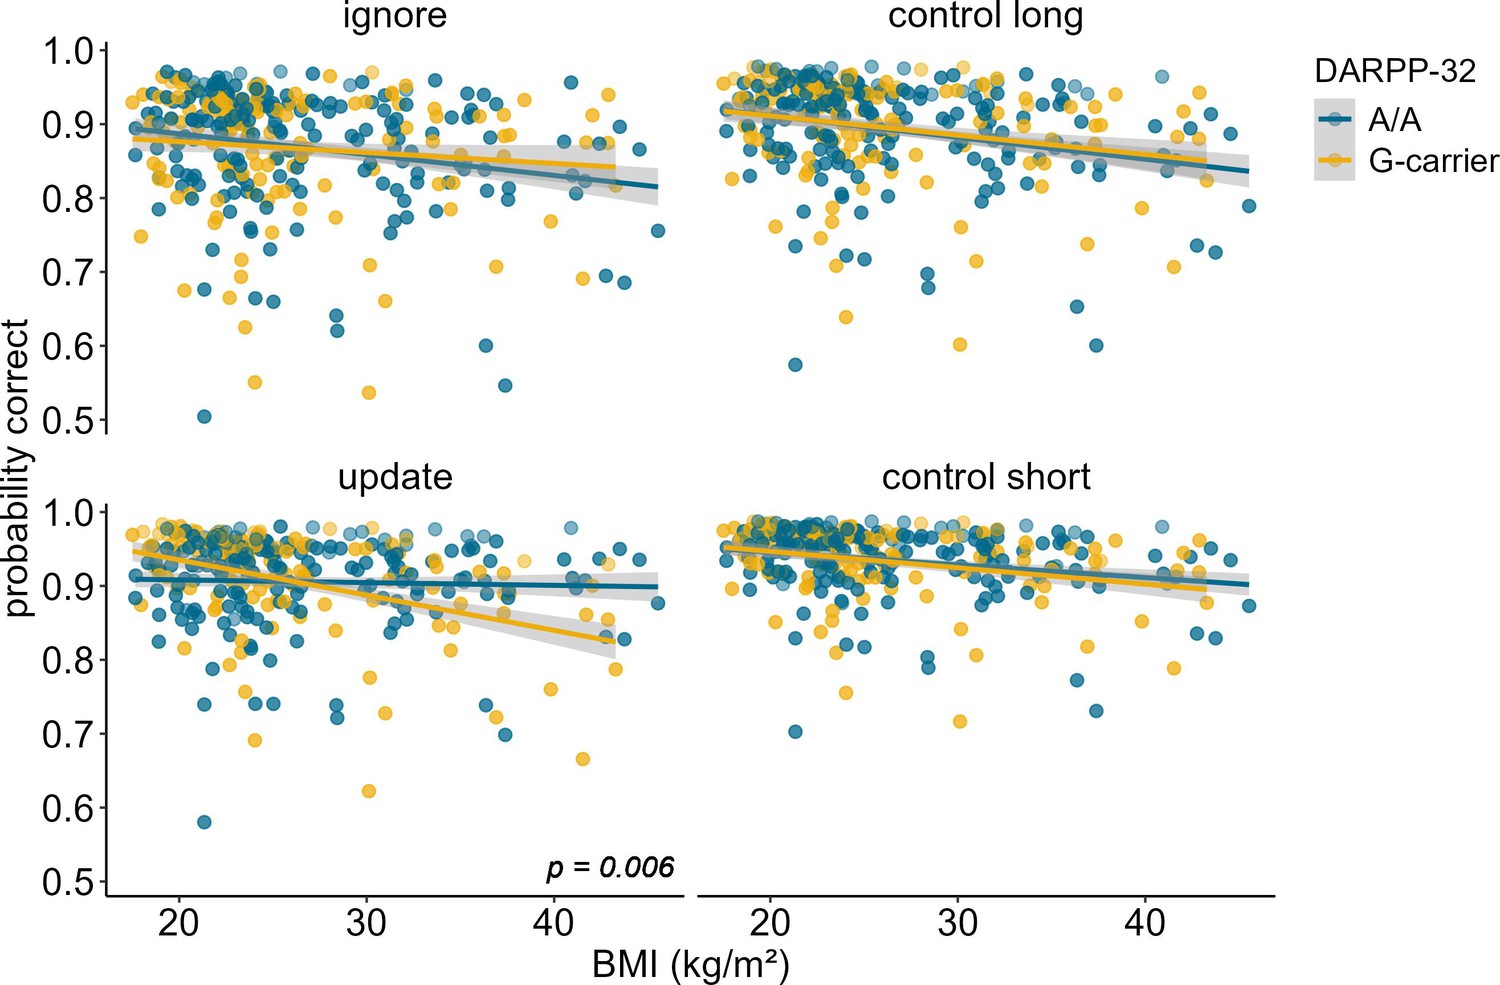
Interaction of DARPP-32, BMI, and condition on working memory performance (model 3).
The two-way interaction of DARPP-32 and BMI was significant in the update condition only (p = 0.006). In this condition, carrying the G-allele led to a 32.4% decrease in performance with each increasing unit of BMI (SE = 7.86), while there was only a 4.39% (SE = 6.61) decrease in A/A homozygots. Shaded areas represent the 95% confidence intervals. N = 320.
Figure 5
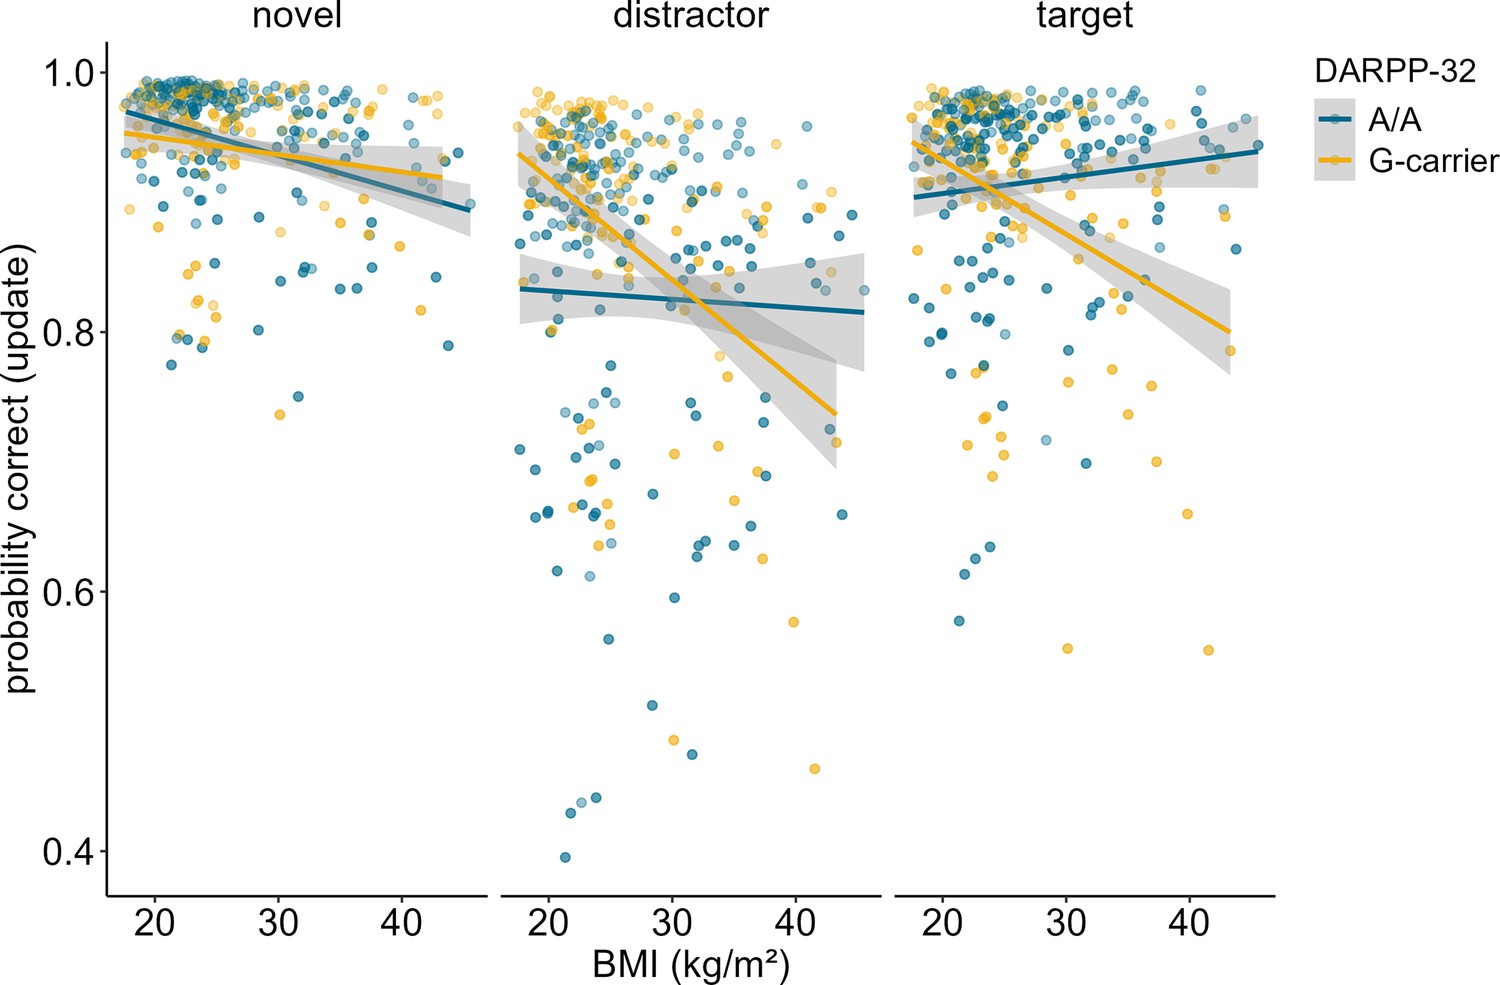
Interaction of dopamine and cAMP-regulated neuronal phosphoprotein (DARPP)-32 genotype, body mass index (BMI), and probe type for update trials only.
There was a significant three-way interaction between probe type, BMI, and DARPP-32 (p = 0.005). Post hoc analyses showed that the BMI-DARPP interaction was significant in distractor (p=0.046) and target (p=0.008) trials, but not in trials where the probe was a novel item (p=0.242). There was a significant main effect of probe type (p<0.001). Trials where the probe was a distractor had lowest probability to be correct. Shaded areas represent the 95% confidence intervals.
Figure 6
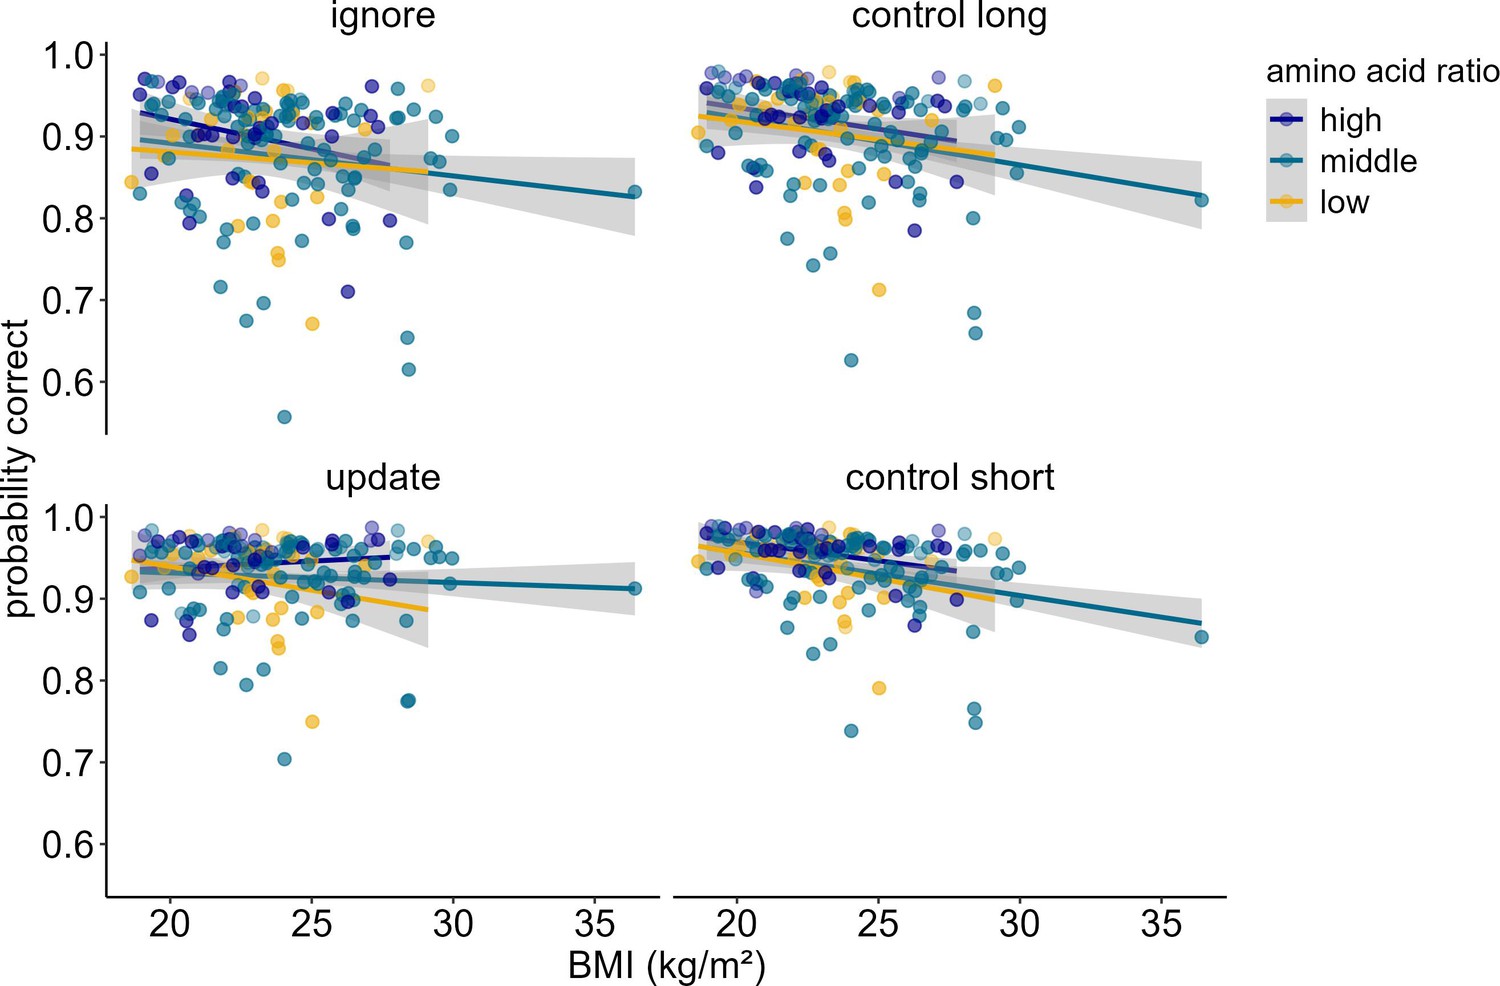
Interaction of Amino Acid Ratio, BMI and condition (model 5).
For illustration purposes, amino acid ratio was artificially grouped into high, middle, and low. The difference in condition (pignore vs. update < 0.001) becomes especially apparent when looking at individuals with high amino acid ratios: With each increasing unit of BMI, performance gets worse in ignore, but better in update. There were no significant differences in the relationship of amino acid ratio and BMI comparing all other conditions against each other (all p > 0.168). Shaded areas represent the 95% confidence intervals. N = 160.
Figure 7

Schematic illustration of the task structure and experimental conditions.
The task consists of three task phases. In the encoding phase, participants have to remember two target stimuli (signaled by the letter “T”), or are presented with a centered cross (short control trials). In the interference phase, participants either have to ignore two non-target stimuli (ignore trials; signaled by the letter “N”) or allow two new stimuli (again marked by a “T”) to replace the previously remembered target stimuli (update trials). No-interference trials (short and long control) do not require any manipulations in the interference phase. At the end of each trial, participants evaluate whether a presented figure was a target figure or not. Figure reused from Hartmann et al. (2023) with permission.
Tables
Table 1
Sample characteristics.
| Project | All | BEDOB | GREADT | WORMCRI | ||||||||
|---|---|---|---|---|---|---|---|---|---|---|---|---|
| N (male) | 320 (166) | 156 (43) | 86 (86) | 78 (37) | ||||||||
| mean (sd) | min | max | mean (sd) | min | max | mean (sd) | min | max | mean (sd) | min | max | |
| BMI | 26.38 (6.35) | 17.51 | 45.54 | 29.172 (7.695) | 17.51 | 45.54 | 24.025 (2.799) | 18.632 | 36.419 | 23.217 (2.735) | 18.929 | 29.888 |
| IQ | 105.41 (10.61) | 71 | 122 | 101.575 (11.979) | 71 | 122 | 109.151 (7.249) | 91 | 118 | 107.731 (10.416) | 74 | 118 |
| Age | 26.93 (6.82) | 12.17 | 49.75 | 26.879 (8.907) | 12.167 | 49.75 | 26.756 (4.474) | 18 | 40 | 26.799 (3.859) | 20.106 | 36.290 |
| DFS | 54.89 (11.61) | 33 | 97 | 55.839 (10.163) | 35 | 91 | 57.046 (15.107) | 33 | 97 | 50.584 (8.546) | 34 | 71 |
Table 2
Full output for the model investigating the BMI-condition interaction (model 1).
| Chisq | Df | Pr(>Chisq) | |
|---|---|---|---|
| (Intercept) | 3623.78 | 1 | <0.001 |
| condition | 282.00 | 3 | <0.001 |
| zBMI | 16.80 | 1 | <0.001 |
| zIQ | 25.10 | 1 | <0.001 |
| Gender | 10.50 | 1 | 0.001 |
| zWM_tired | 36.00 | 1 | <0.001 |
| zWM_conc | 9.19 | 1 | 0.002 |
| condition:zBMI | 2.66 | 3 | 0.447 |
-
N = 320; Marginal R2/conditional R2 = 0.069/0.172.
-
Note: uncorrected p-values are displayed.
Table 3
Full output for the model investigating the COMT-Taq1A-BMI-condition interaction (model 2).
| Chisq | Df | Pr(>Chisq) | |
|---|---|---|---|
| (Intercept) | 3228.77 | 1 | <0.001 |
| condition | 212.81 | 3 | <0.001 |
| COMT | 0.16 | 2 | 0.923 |
| Taq1A | 1.13 | 1 | 0.288 |
| zBMI | 22.15 | 1 | <0.001 |
| zIQ | 24.09 | 1 | <0.001 |
| Gender | 7.53 | 1 | 0.006 |
| zWM_tired | 12.39 | 1 | <0.001 |
| zWM_conc | 30.80 | 1 | <0.001 |
| condition:COMT | 10.30 | 6 | 0.113 |
| condition:Taq1A | 4.69 | 3 | 0.196 |
| COMT:Taq1A | 2.47 | 2 | 0.291 |
| condition:zBMI | 3.49 | 3 | 0.322 |
| COMT:zBMI | 0.86 | 2 | 0.650 |
| Taq1A:zBMI | 2.98 | 1 | 0.085 |
| condition:COMT:Taq1A | 2.09 | 6 | 0.911 |
| condition:COMT:zBMI | 6.29 | 6 | 0.391 |
| condition:Taq1A:zBMI | 12.40 | 3 | 0.006 |
| COMT:Taq1A:zBMI | 3.68 | 2 | 0.159 |
| condition:COMT:Taq1A:zBMI | 4.09 | 6 | 0.665 |
-
N=318.Marginal R2/conditional R2 = 0.076/0.173.
-
Note: uncorrected p-values are displayed.
Table 4
Full output for the model investigating the DARPP-BMI-condition effect (model 3).
| Chisq | Df | Pr(>Chisq) | |
|---|---|---|---|
| (Intercept) | 3511.81 | 1 | <0.001 |
| DARPP | 0.03 | 1 | 0.853 |
| zBMI | 17.18 | 1 | <0.001 |
| condition | 274.62 | 3 | <0.001 |
| zIQ | 25.10 | 1 | <0.001 |
| zWM_conc | 35.27 | 1 | <0.001 |
| zWM_tired | 10.52 | 1 | 0.001 |
| Gender | 9.17 | 1 | 0.002 |
| DARPP:zBMI | 0.18 | 1 | 0.668 |
| DARPP:condition | 1.00 | 3 | 0.801 |
| BMI:condition | 3.61 | 3 | 0.307 |
| DARPP:BMI:condition | 20.21 | 3 | <0.001 |
-
N = 320. Marginal R2/conditional R2 = 0.071/0.173.
-
Note: uncorrected p-values are displayed.
Table 5
Full output for the model investigating the C957T-BMI-condition effect (model 4).
| Chisq | Df | Pr(>Chisq) | |
|---|---|---|---|
| (Intercept) | 328.55 | 1 | <0.001 |
| C957T | 0.03 | 1 | 0.859 |
| zBMI | 3.49 | 1 | 0.062 |
| condition | 48.06 | 3 | <0.001 |
| zIQ | 25.30 | 1 | <0.001 |
| zWM_conc | 33.66 | 1 | <0.001 |
| zWM_tired | 10.54 | 1 | 0.001 |
| Gender | 8.85 | 1 | 0.003 |
| C957T:zBMI | 0.36 | 1 | 0.548 |
| C957T:condition | 7.97 | 3 | 0.047 |
| BMI:condition | 0.31 | 3 | 0.958 |
| C957T:BMI:condition | 0.07 | 3 | 0.995 |
-
N=318. Marginal R2/conditional R2 = 0.070/0.171.
-
Note: uncorrected p-values are displayed.
Table 6
Full output for the final model investigating the amino acid ratio-BMI-condition effect (model 5).
| Chisq | Df | Pr(>Chisq) | |
|---|---|---|---|
| (Intercept) | 13.31 | 1 | <0.001 |
| AAratio | 0.58 | 1 | 0.444 |
| zBMI | 0.98 | 1 | 0.321 |
| condition | 3.43 | 3 | 0.330 |
| zIQ | 11.64 | 1 | <0.001 |
| zWM_conc | 18.60 | 1 | <0.001 |
| Gender | 5.08 | 1 | 0.024 |
| AAratio:zBMI | 0.32 | 1 | 0.570 |
| AAratio:condition | 8.69 | 3 | 0.034 |
| BMI:condition | 9.80 | 3 | 0.020 |
| AAratio:BMI:condition | 10.88 | 3 | 0.012 |
-
N = 160. Marginal R2/conditional R2 = 0.068/0.170.
-
Note: uncorrected p-values are displayed.
Additional files
-
MDAR checklist
- https://cdn.elifesciences.org/articles/93369/elife-93369-mdarchecklist1-v1.pdf
-
Supplementary file 1
Supplementary tables.
(A) Post hoc effects for the interaction of BMI, condition, and Taq1A. (B) Post hoc effects for the interaction of BMI, condition, and DARPP. (C) Full output final model 5 without extreme data point. (D) C957T-Taq1A interaction. (E) C957T-COMT interaction. (F) AminoAcidRatio-Taq1A interaction. (G) AminoAcidRatio-DARPP interaction. (H) Final outputs for the model comparisons for each model.
- https://cdn.elifesciences.org/articles/93369/elife-93369-supp1-v1.xlsx
Download links
A two-part list of links to download the article, or parts of the article, in various formats.
Downloads (link to download the article as PDF)
Open citations (links to open the citations from this article in various online reference manager services)
Cite this article (links to download the citations from this article in formats compatible with various reference manager tools)
Working memory gating in obesity is moderated by striatal dopaminergic gene variants
eLife 13:RP93369.
https://doi.org/10.7554/eLife.93369.3


