Structure of scavenger receptor SCARF1 and its interaction with lipoproteins
- State Key Laboratory of Systems Medicine for Cancer, Shanghai Cancer Institute, Renji Hospital, Shanghai Jiao Tong University School of Medicine, China
- Shanghai Institute of Biochemistry and Cell Biology, Center for Excellence in Molecular Cell Science, Chinese Academy of Sciences, China
- University of Chinese Academy of Sciences, China
- National Facility for Protein Science in Shanghai, Shanghai Advanced Research Institute, Chinese Academy of Sciences, China
- Department of Immunology, School of Basic Medical Sciences, Weifang Medical University, China
- School of Life Science, Westlake University, China
- Shanghai Key Laboratory for Cancer Systems Regulation and Clinical Translation, China
- Department of Biliary-Pancreatic Surgery, Renji Hospital, Shanghai Jiao Tong University School of Medicine, China
Figures
Figure 1 with 2 supplements
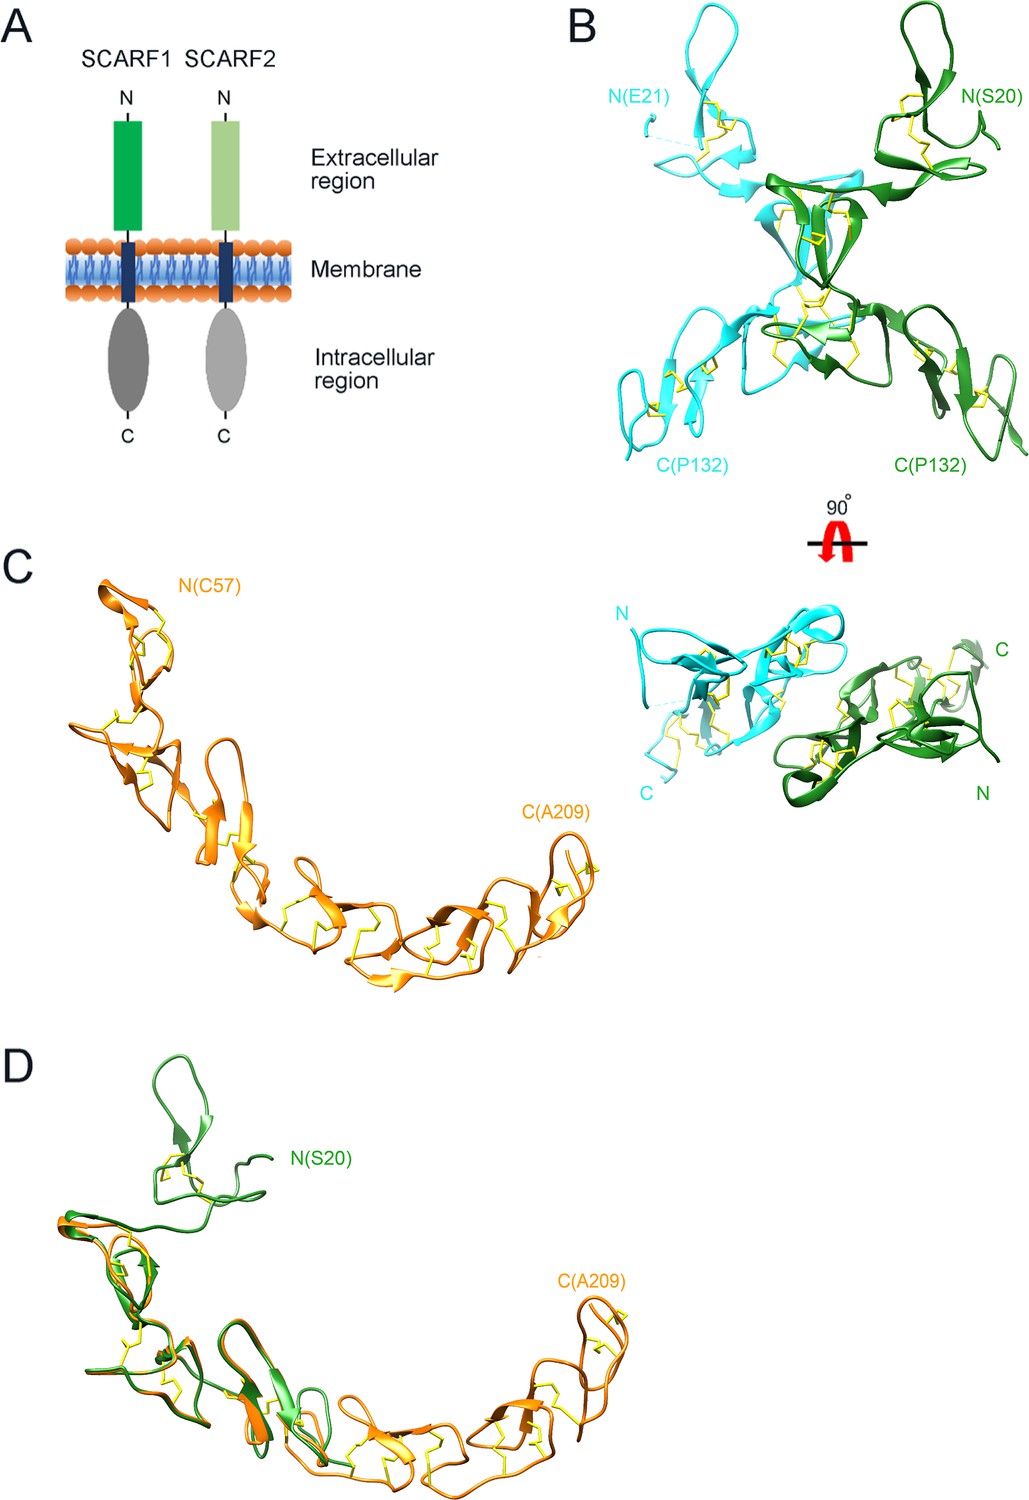
Crystal structure of the N-terminal fragments of SCARF1.
(A) A schematic model of human SCARF1 and SCARF2. (B) Ribbon diagrams of a homodimer of an N-terminal fragment (f1, 20–132aa; two monomers are shown in cyan and green, respectively) of SCARF1. (C) A ribbon diagram of an N-terminal fragment (f2, 57–209aa, gold) of SCARF1. (D) Structure of the N-terminal fragment of SCARF1 (20–209aa) by superimposing the crystal structures of f1 (green) and f2 (gold). Disulfide bonds are shown in yellow (B–D).
Figure 1—figure supplement 1
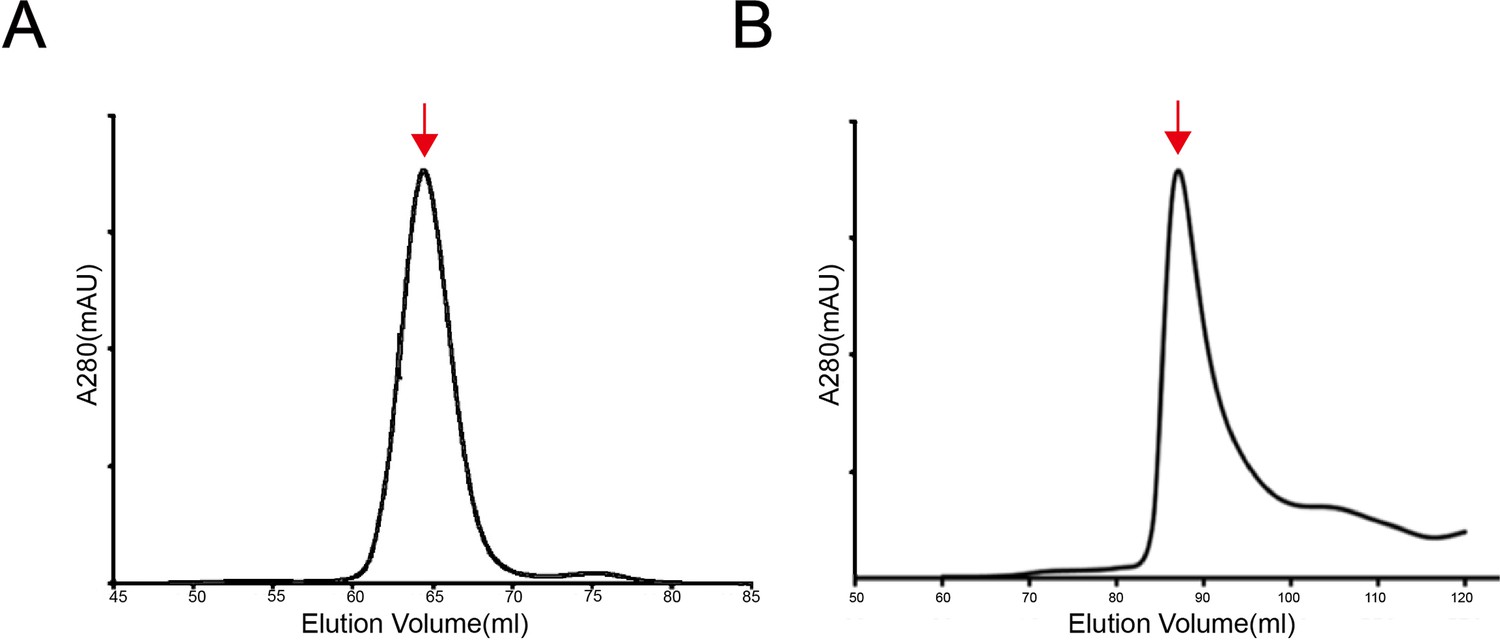
The size exclusion chromatography (SEC) profiles of the SCARF1 fragments for crystallization.
(A) The SEC profile of the purified protein (f1, 20–132aa). (B) The SEC profile of the purified protein (f2, 20–221aa).
Figure 1—figure supplement 2
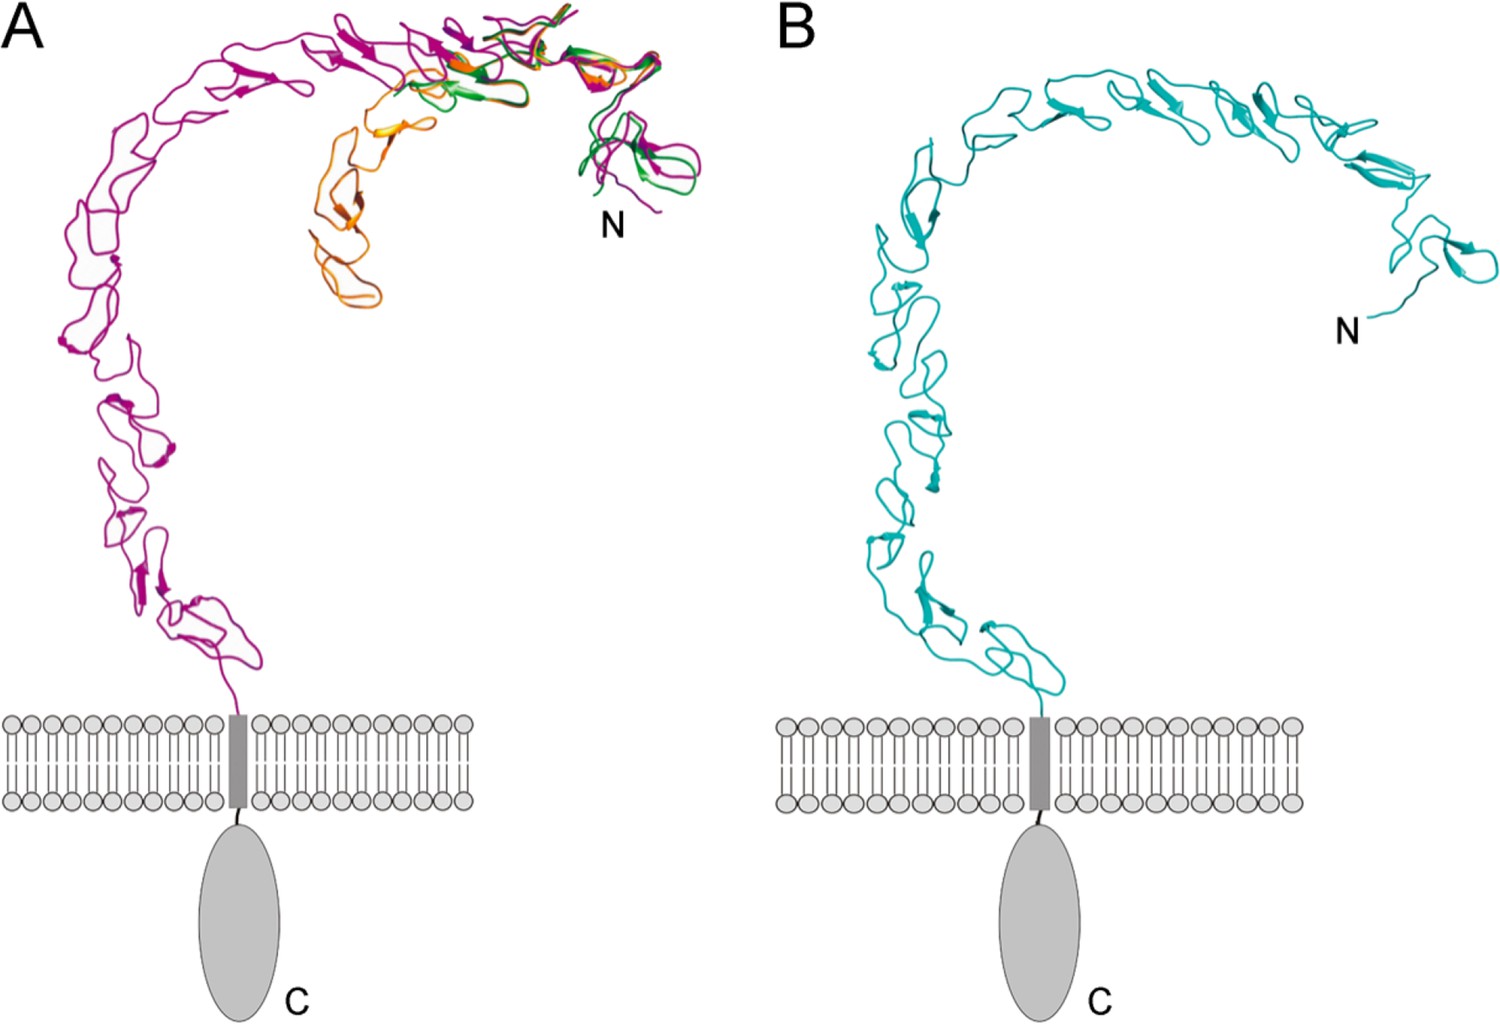
Models of the ectodomains of SCARF1 and SCARF2 by AlphaFold.
(A) Superposition of the crystal structures of f1 (green) and f2 (gold) with the AlphaFold model of the SCARF1 ectodomain (magenta). (B) AlphaFold model of the SCARF2 ectodomain (cyan).
Figure 2 with 2 supplements
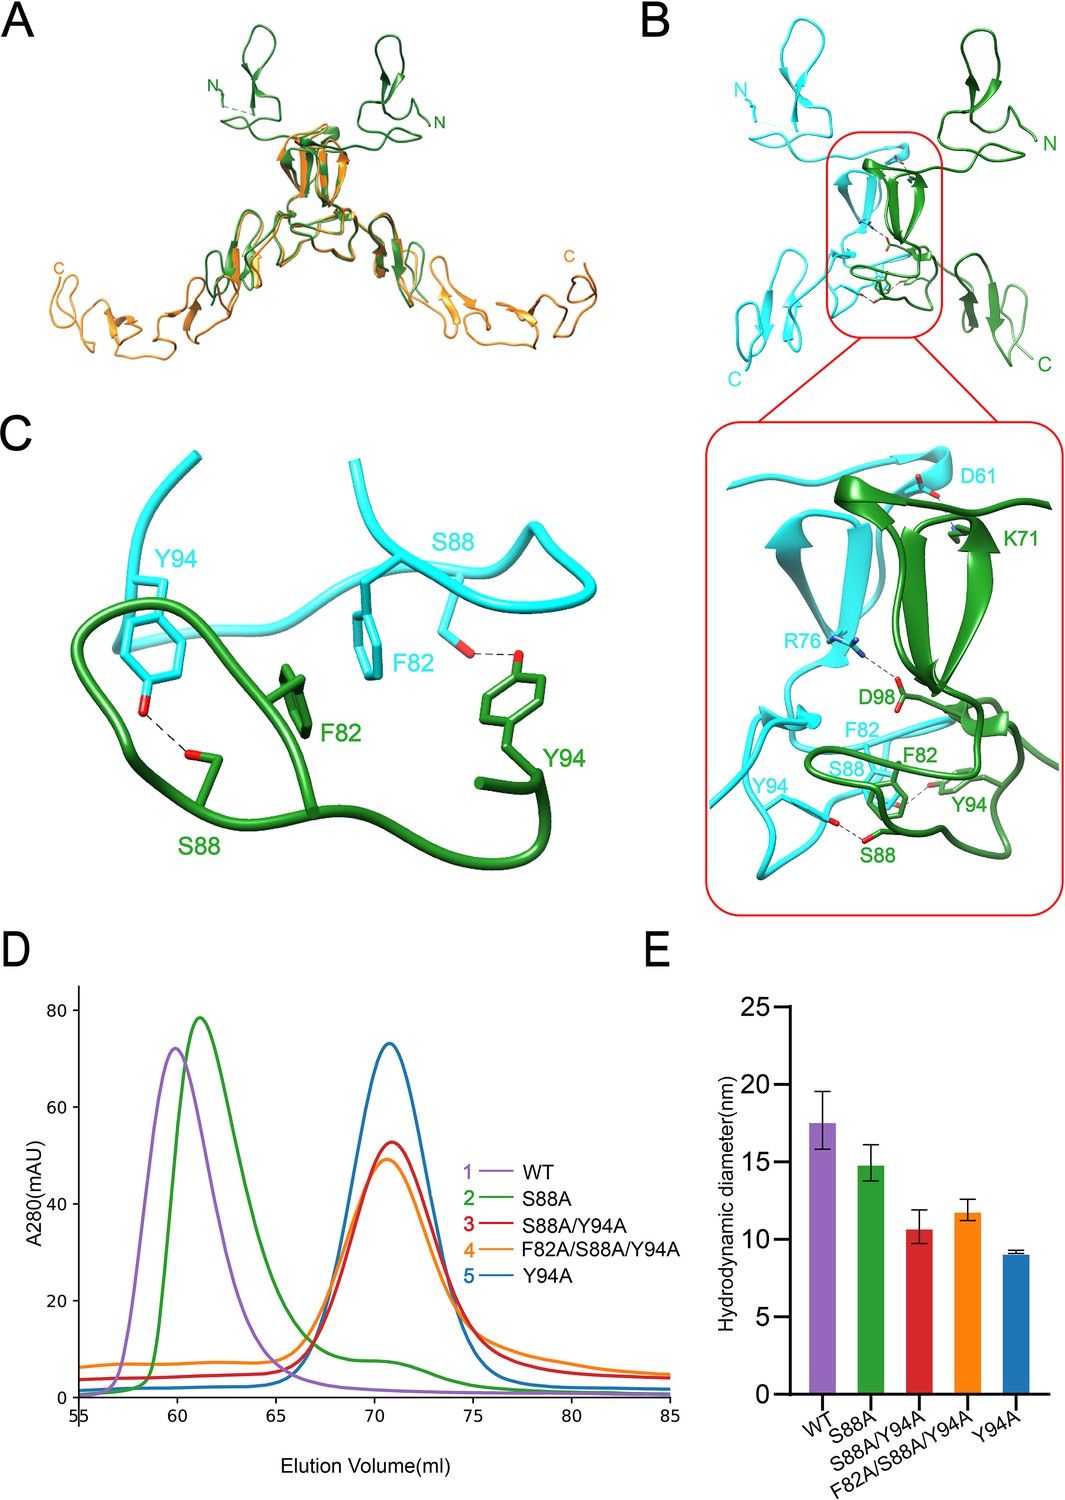
Dimerization of SCARF1.
(A) Superposition of the homodimers of f1 (green) and f2 (gold) in the crystals. (B) The dimeric interface of f1 fragment of SCARF1 (red rectangles). Two monomers are colored in cyan and green, respectively. The side chains of the residues that form hydrogen bonds (dashed lines), salt bridges (dashed lines), and π-π interactions are labeled. (C) A local view of the dimeric interface of SCARF1. The side chains of the residues that form hydrogen bonds (dashed lines) and π-π interactions are labeled. (D) The size exclusion chromatography (SEC) profiles of the wild type and the mutants of SCARF1 ectodomain. (E) The hydrodynamic diameters of the wild type and the mutants of SCARF1 ectodomain measured by dynamic light scattering (DLS).
Figure 2—figure supplement 1
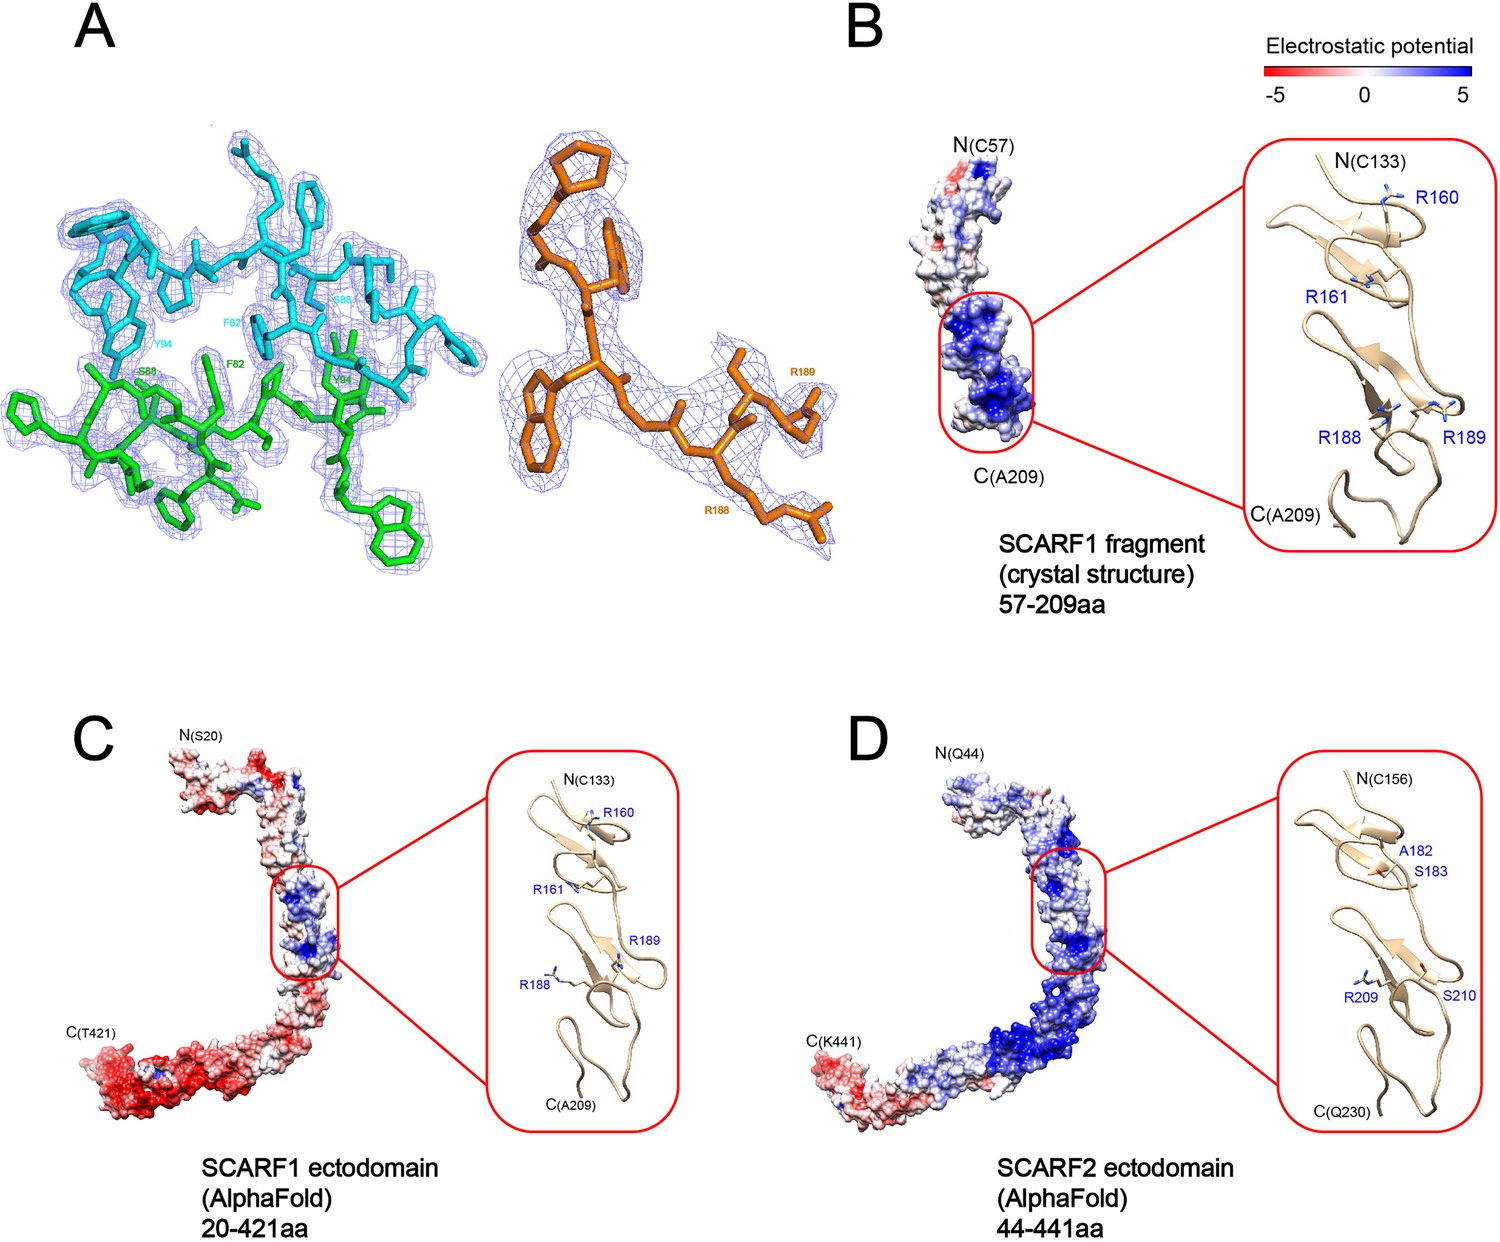
Electron density of the crystals and surface electrostatic potential of SCARF1 and SCARF2.
(A) Electron density (light blue) of f1 around the dimeric interface (left) and electron density of f2 at residues (183–189aa) (right). (B) Surface electrostatic potential of the crystal structure of a SCARF1 fragment (57–209aa). A ribbon diagram of the region around the lipoprotein binding site (red rectangle) is shown on the right. The side chains of the arginines are also shown. (C) Surface electrostatic potential of the ectodomain of SCARF1 from AlphaFold. A ribbon diagram of the region around the lipoprotein binding site (red rectangle) is shown on the right. The side chains of the arginines are also shown. (D) Surface electrostatic potential of the ectodomain of SCARF2 from AlphaFold. A ribbon diagram of the corresponding region of SCARF1 lipoprotein binding site (red rectangle) is shown on the right. The side chains of the corresponding residues are also shown. (Note: panels B–D are also associated with Figure 6.)
Figure 2—figure supplement 2
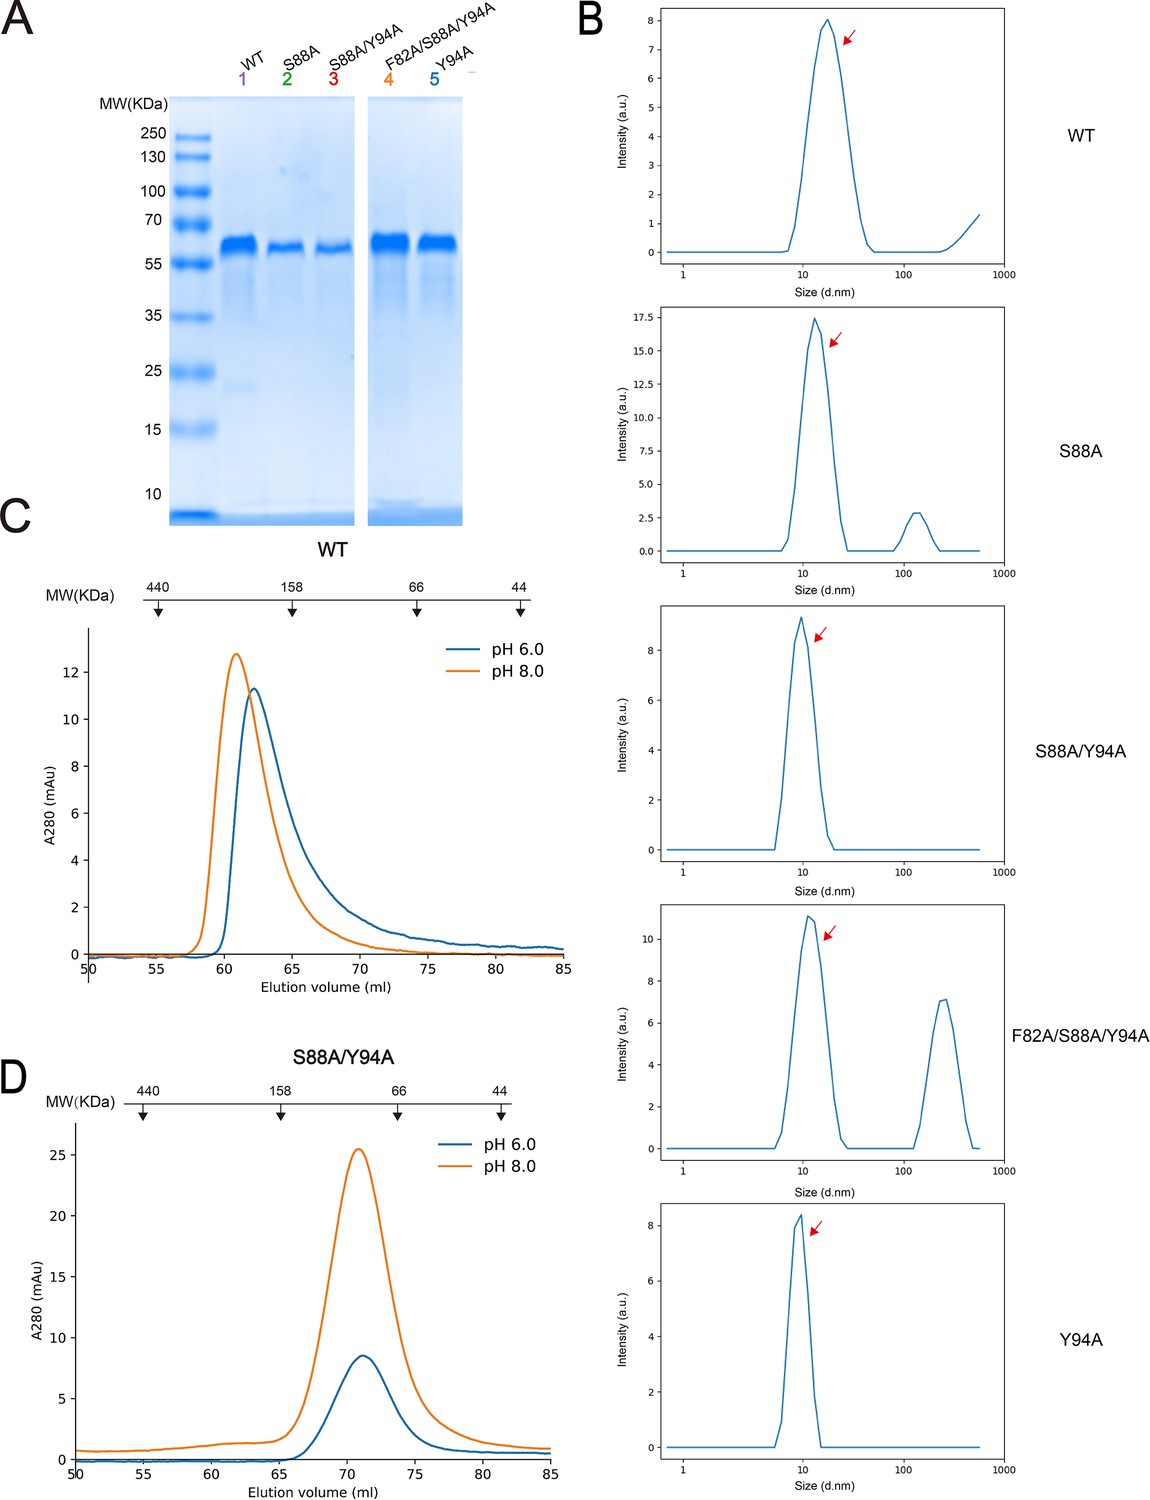
Dimerization of SCARF1.
(A) The SDS-PAGE of the peak fractions of size exclusion chromatography (SEC) profiles of the SCARF1 ectodomain and mutants. (B) The dynamic light scattering (DLS) measurements of the wild type and the mutants of SCARF1 ectodomain (red arrows). (C) The SEC profiles of the wild type ectodomain of SCARF1 at pH 6.0 or pH 8.0. (D) The SEC profiles of a monomeric mutant of the ectodomain of SCARF1 at pH 6.0 or pH 8.0. The molecular weight marker of SEC is shown on the top (C–D). (Note: both monomeric and dimeric forms of SCARF1 ectodomain elute earlier than the standard molecular weight marker, probably due to the long conformation of the molecule.)
-
Figure 2—figure supplement 2—source data 1
The original gel displayed in Figure 2—figure supplement 2A.
- https://cdn.elifesciences.org/articles/93428/elife-93428-fig2-figsupp2-data1-v1.zip
-
Figure 2—figure supplement 2—source data 2
PDF file containing the original gel for Figure 2—figure supplement 2A with labeled bands.
- https://cdn.elifesciences.org/articles/93428/elife-93428-fig2-figsupp2-data2-v1.zip
Figure 3 with 3 supplements
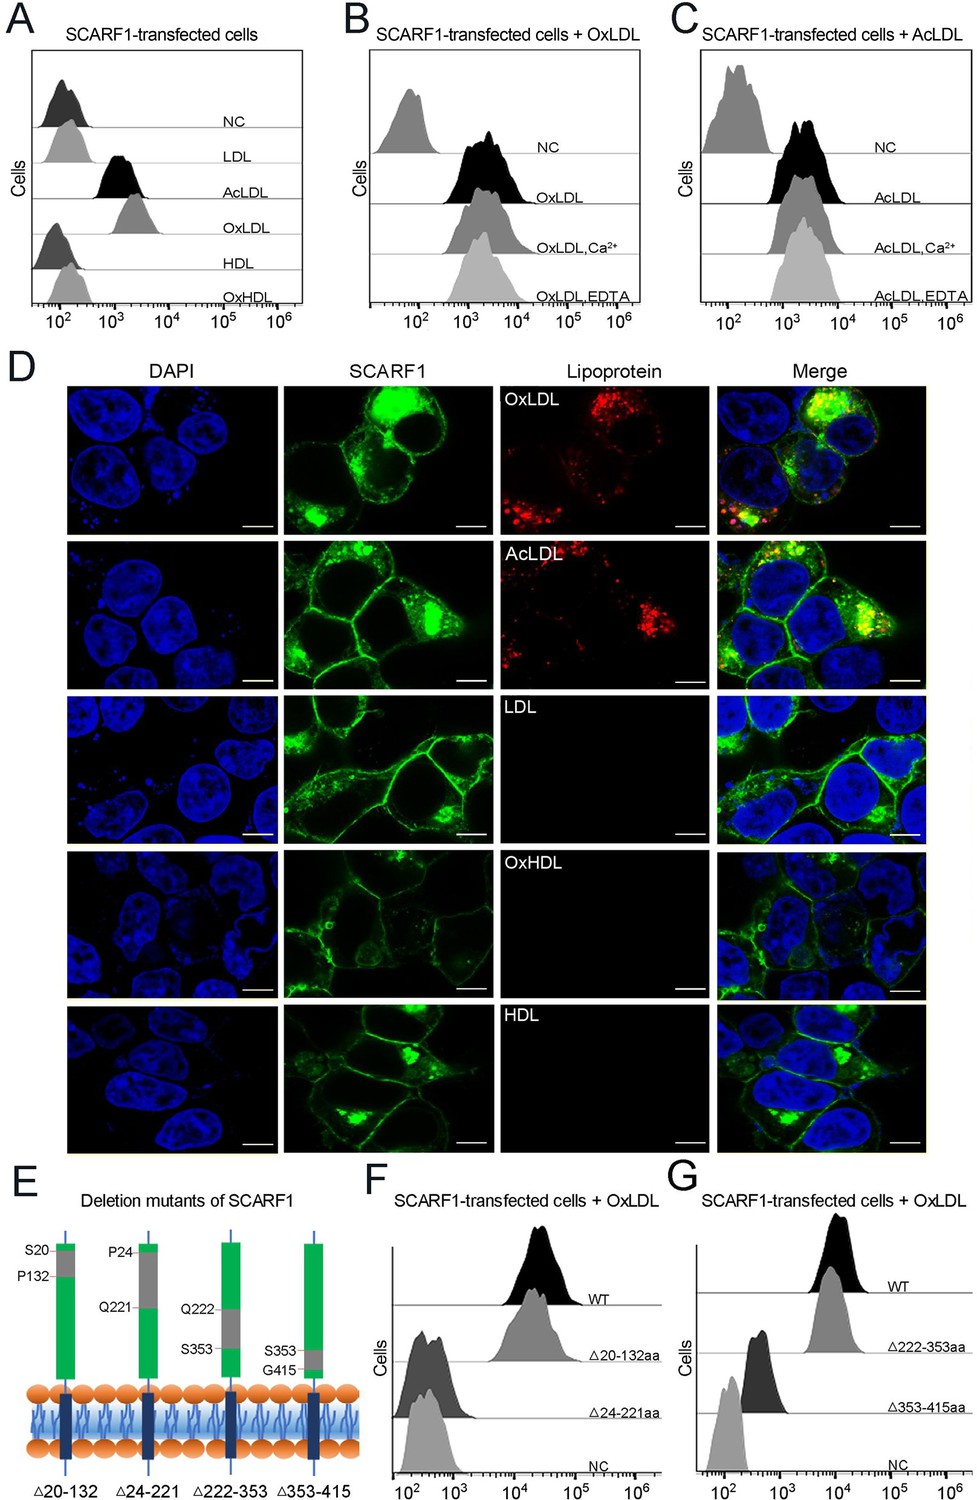
SCARF1 recognizes the modified low-density lipoproteins (LDLs).
(A) Interactions of LDL,acetylated LDL (AcLDL), oxidized LDL (OxLDL), high-density lipoprotein (HDL), and oxidized HDL (OxHDL) with the SCARF1-transfected cells by flow cytometry (NC represents the non-transfected cells and no lipoprotein was added here). (B) Interactions of OxLDL with the SCARF1-transfected cells in the presence of Ca2+ or EDTA by flow cytometry (OxLDL was added for NC). (C) Interactions of AcLDL with the SCARF1-transfected cells in the presence of Ca2+ or EDTA by flow cytometry (AcLDL was added for NC). (D) Confocal fluorescent images of the SCARF1-transfected cells incubated with OxLDL, AcLDL, LDL, OxHDL, or HDL (scale bar, 7.5 µm). (E) Schematic diagrams of the deletion mutants of SCARF1. The deleted regions are labeled and shown in gray. (F) Interactions of OxLDL with the deletion mutants SCARF1Δ20-132aa and SCARF1Δ24-221aa by flow cytometry. (G) Interactions of OxLDL with the deletion mutants SCARF1Δ222-353aa and SCARF1Δ353-415aa by flow cytometry.
Figure 3—figure supplement 1
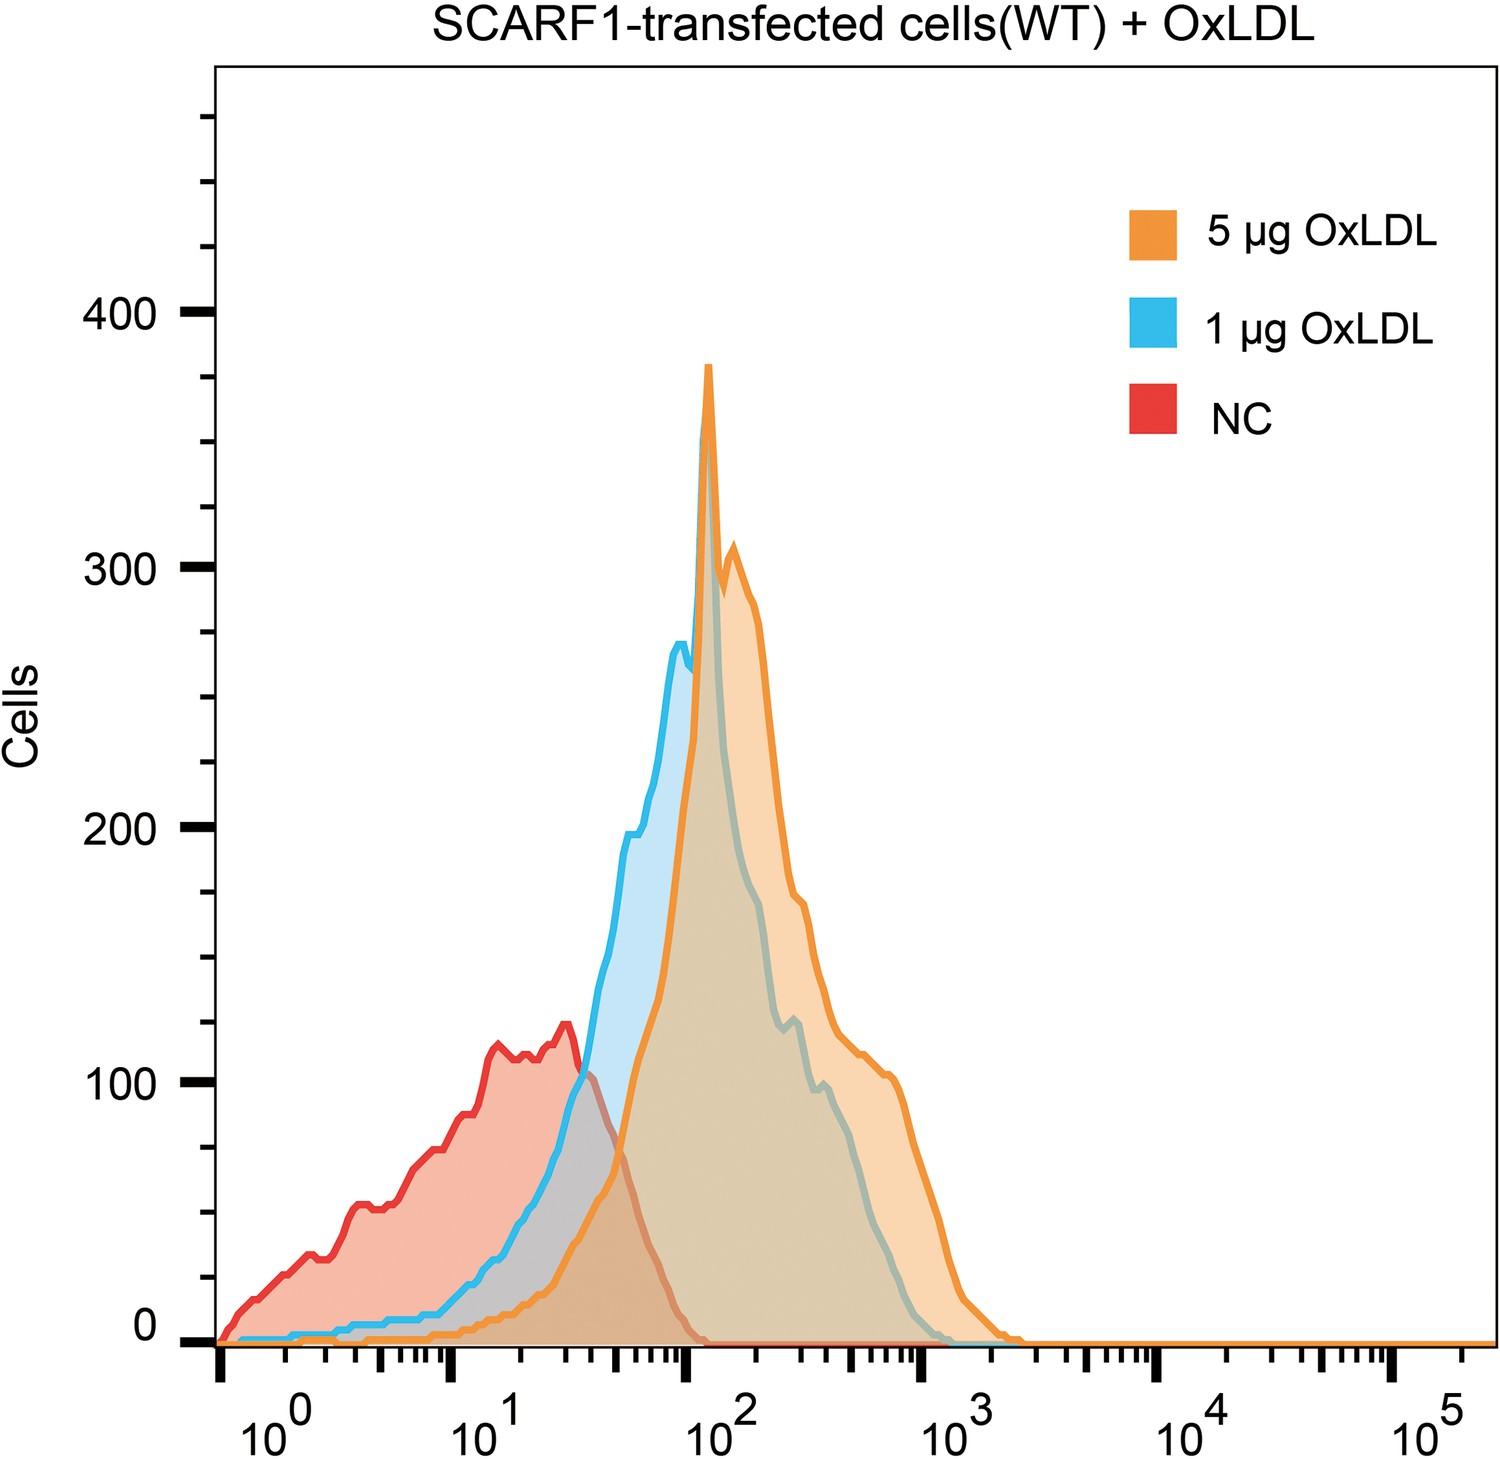
Interaction of oxidized LDL (OxLDL) with the SCARF1-transfected cells by flow cytometry.
Figure 3—figure supplement 2
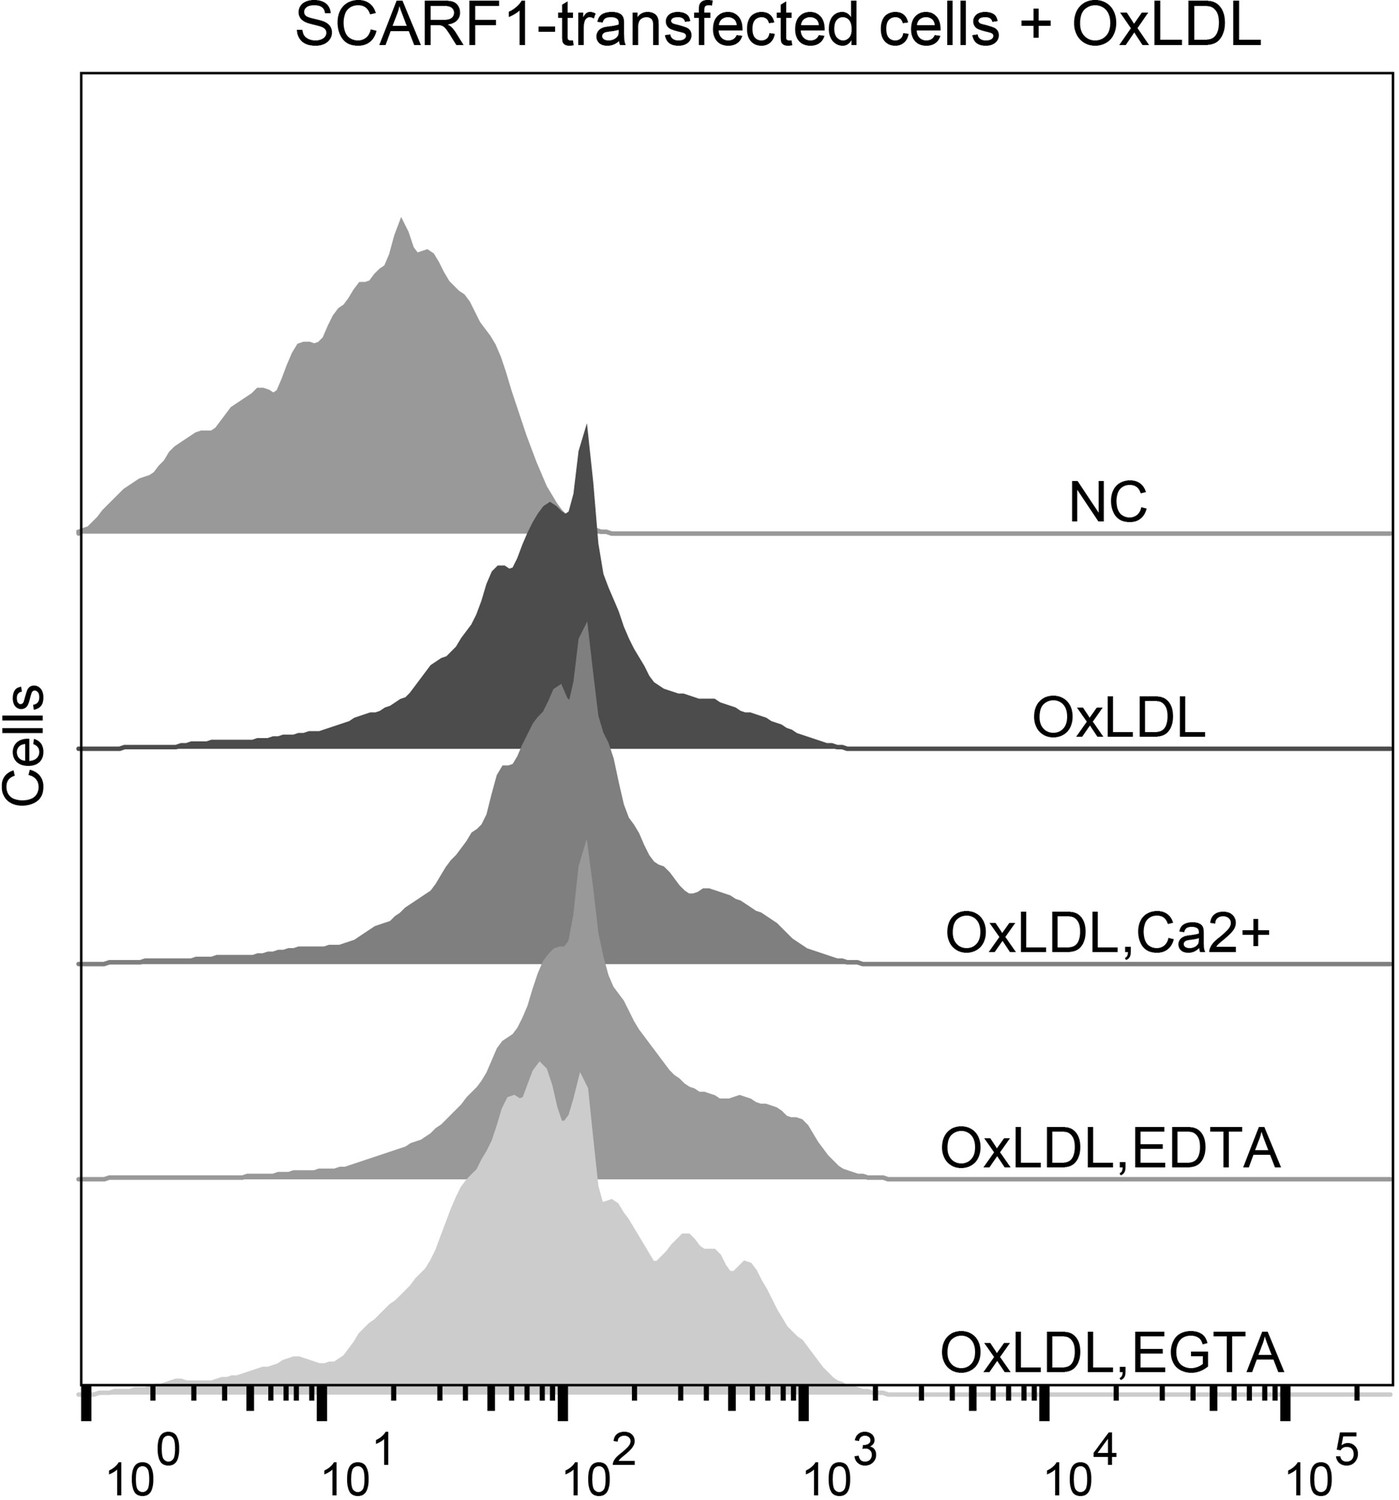
Interactions of oxidized LDL (OxLDL) with the SCARF1-transfected cells in the presence of Ca2+, EDTA, or EGTA by flow cytometry.
Figure 3—figure supplement 3
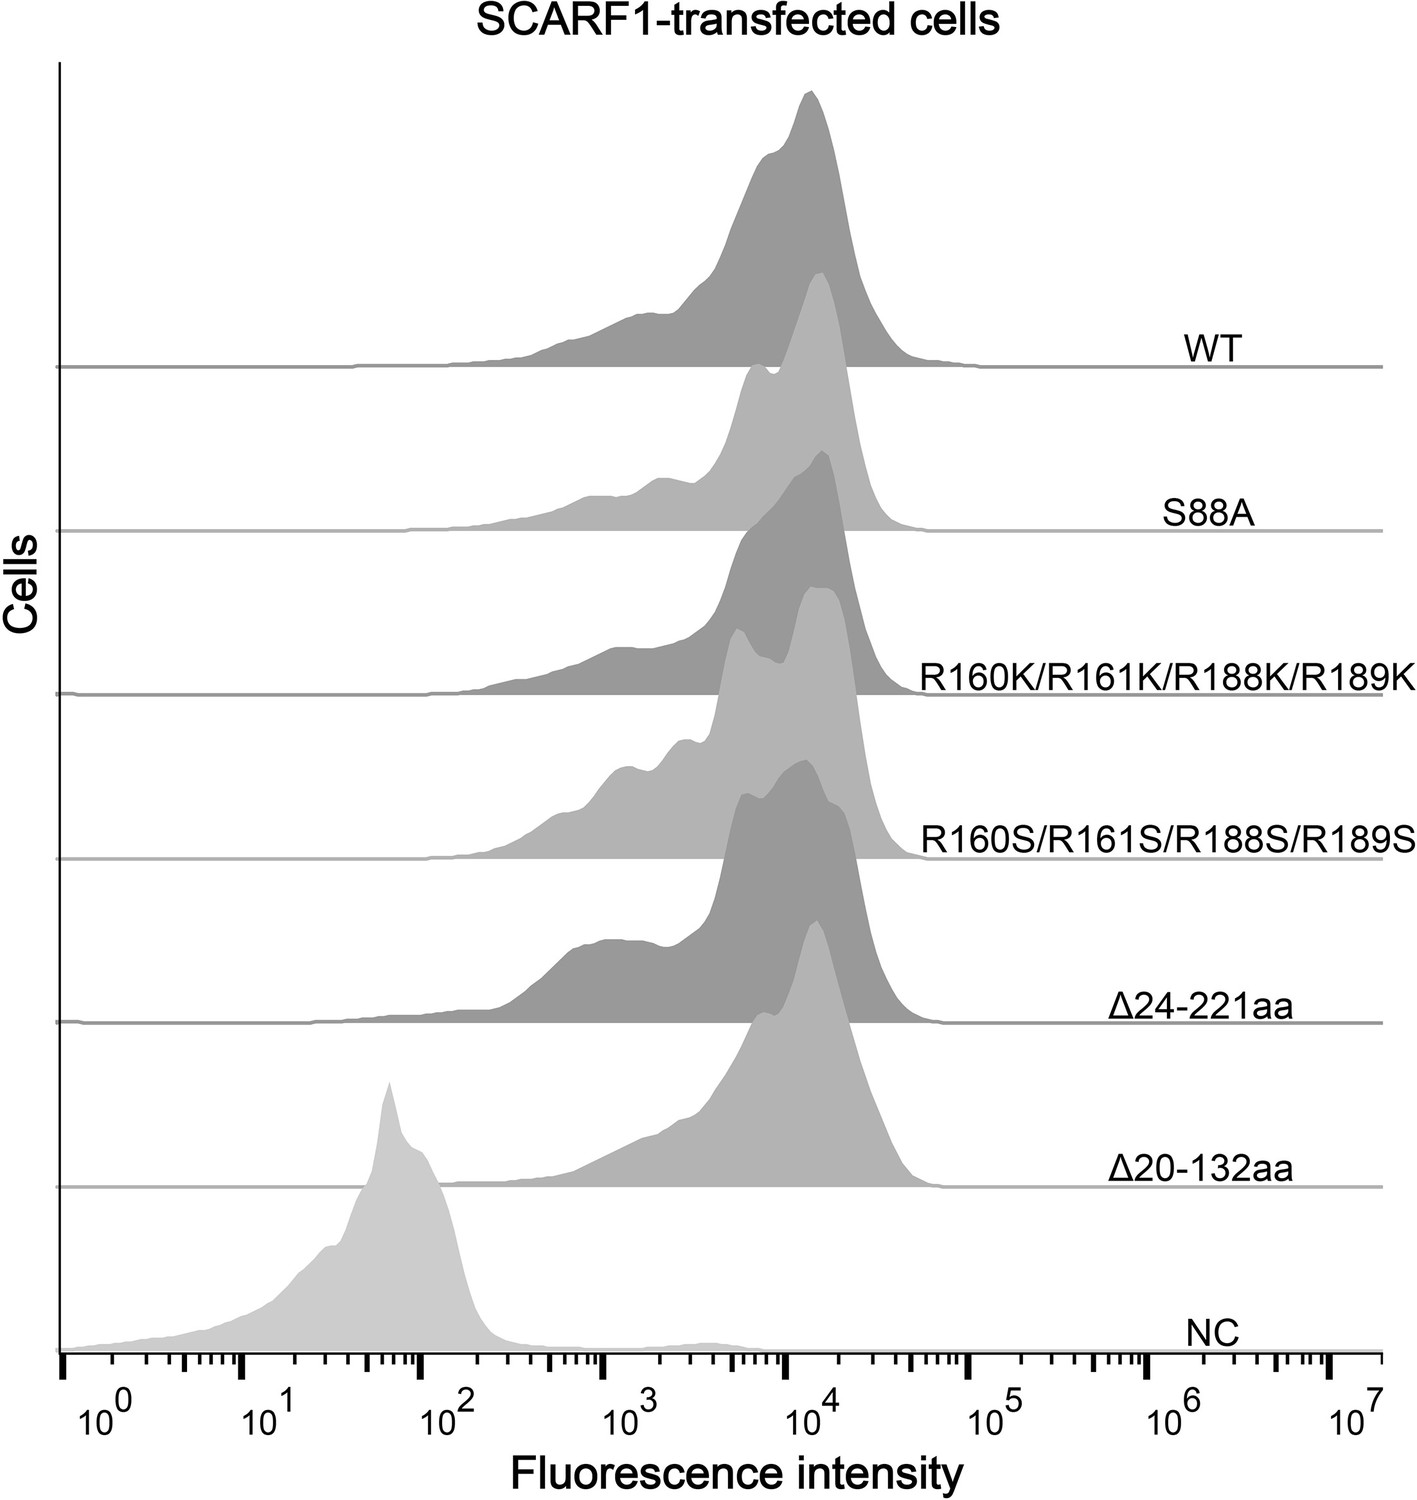
The expressions of SCARF1 and mutants on the cell surface.
Figure 4
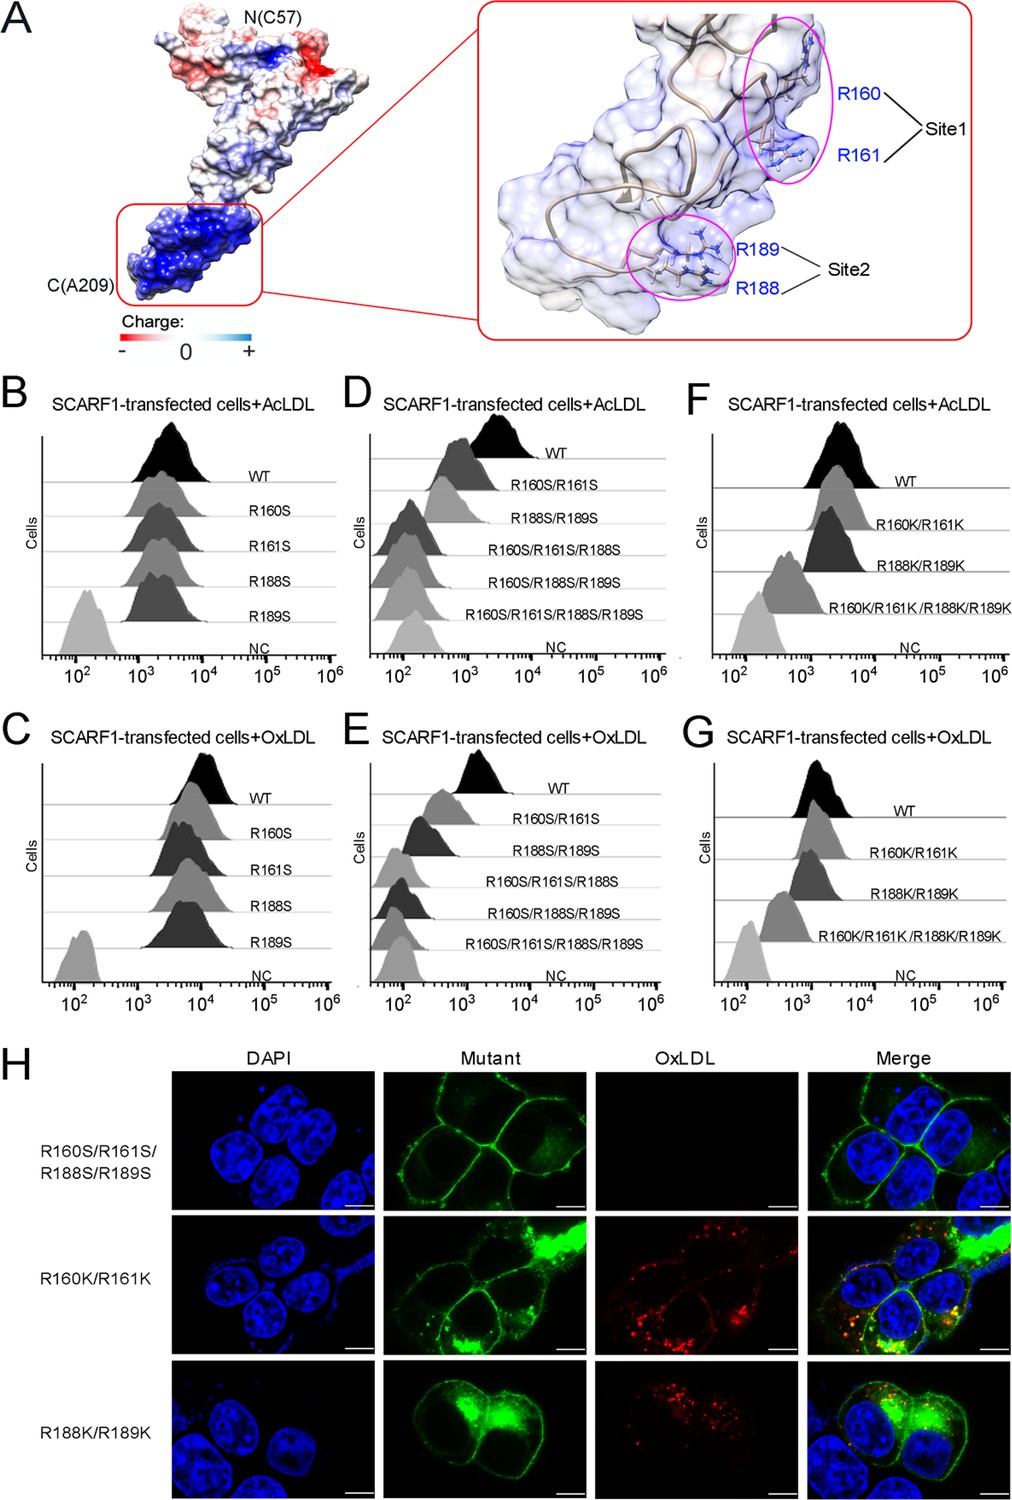
The binding sites of modified low-density lipoproteins (LDLs) on SCARF1.
(A) Surface electrostatic potential of f2 fragment shows a positively charged region on SCARF1 (left, red rectangle), which contains four arginines at Site 1 and Site 2 (right, magenta ovals). (B) Interactions of acetylated LDL (AcLDL) with the cells transfected with the single mutants (R to S) of the binding sites by flow cytometry. (C) Interactions of oxidized LDL (OxLDL) with the cells transfected with the single mutants (R to S) of the binding sites by flow cytometry. (D) Interactions of AcLDL with the cells transfected with the double, triple, or quadruple mutants (R to S) of the binding sites by flow cytometry. (E) Interactions of OxLDL with the cells transfected with the double, triple, or quadruple mutants (R to S) of the binding sites by flow cytometry. (F) Interactions of AcLDL with the cells transfected with the double or quadruple mutants (R to K) of the binding sites by flow cytometry. (G) Interactions of OxLDL with the cells transfected with the double or quadruple mutants (R to K) of the binding sites by flow cytometry. (H) Confocal fluorescent images of the SCARF1 mutant-transfected cells incubated with OxLDL (scale bar, 7.5 µm).
Figure 5
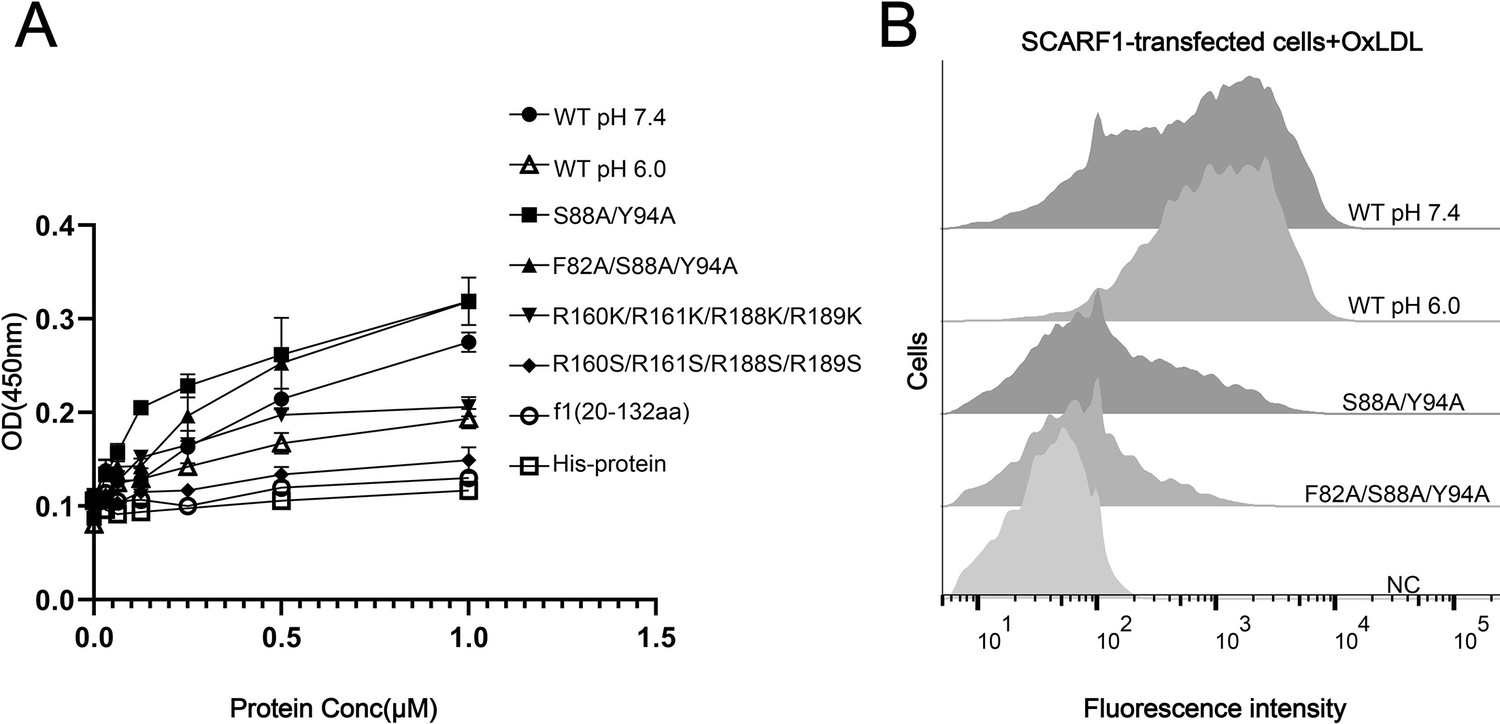
The binding of SCARF1 with oxidized LDL (OxLDL).
(A) ELISA of the interactions of OxLDL with the wild type and the mutants of the ectodomain of SCARF1(f1 fragment is also applied). The assays are performed at pH 7.4 if not labeled. The ectodomain of human HER3 (His-protein) is applied as a control. (B) Interactions of OxLDL with the cells transfected with the wild type and the mutants of SCARF1 by flow cytometry. The assays are performed at pH 7.4 if not labeled.
Figure 6
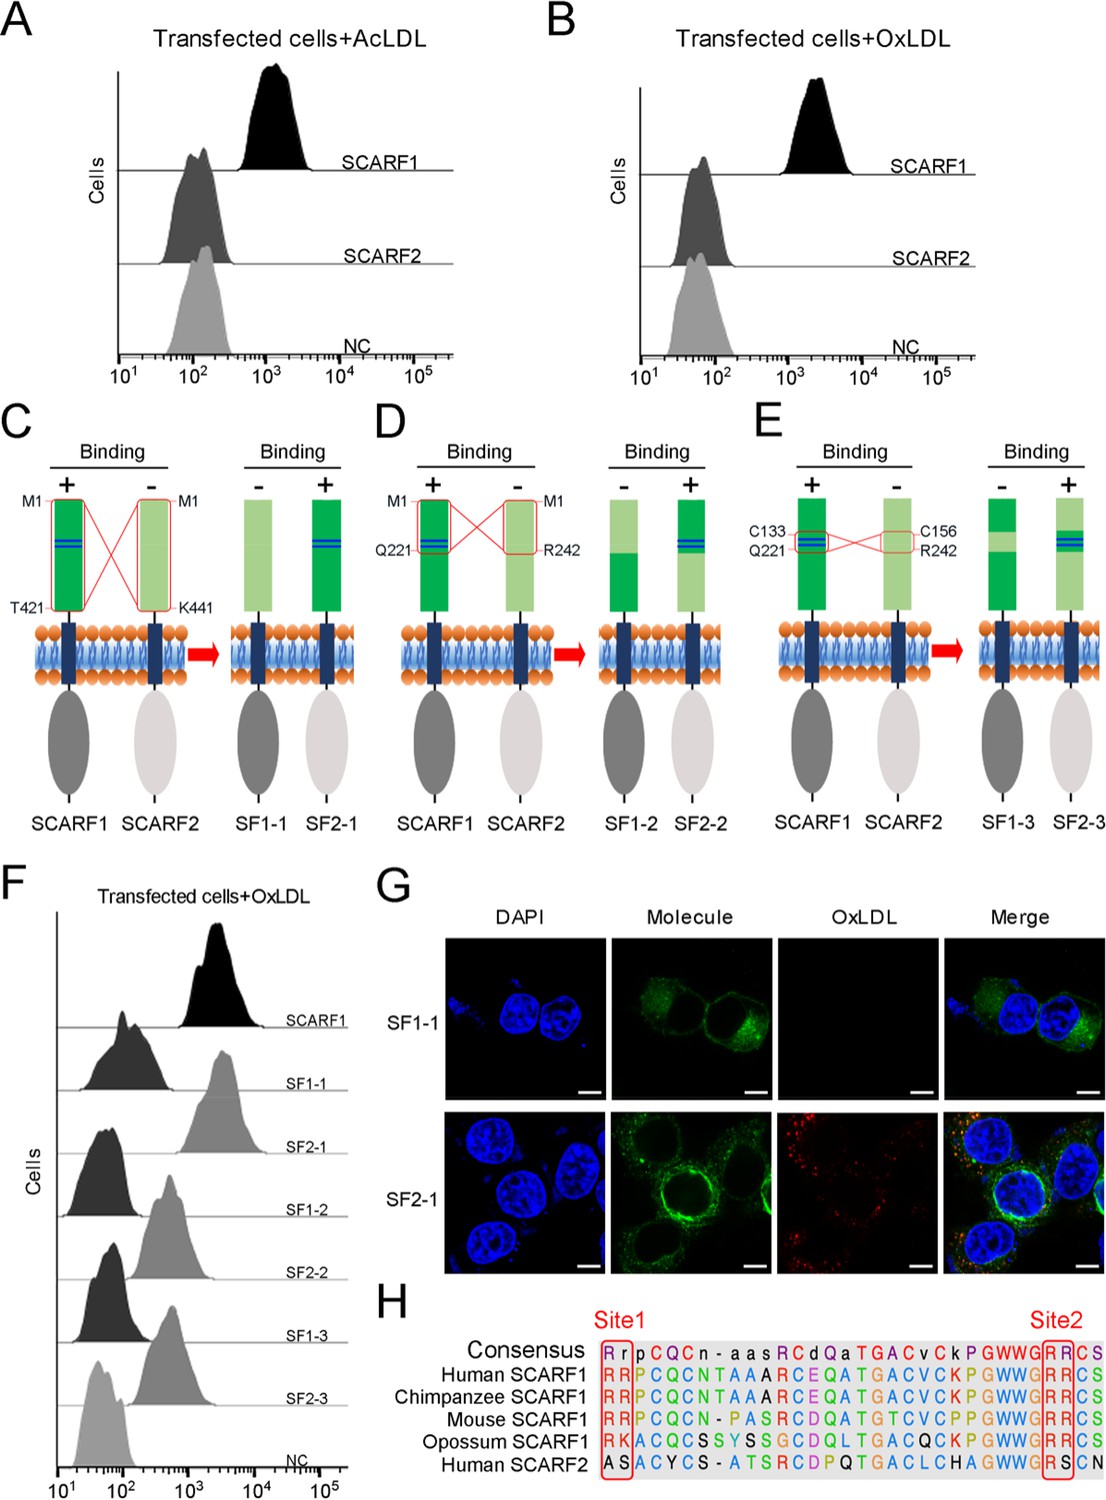
The interactions of modified low-density lipoproteins (LDLs) with SCARF1-SCARF2 chimeric molecules.
(A) Interaction of acetylated LDL (AcLDL) with the SCARF1- or SCARF2-transfected cells by flow cytometry. (B) Interaction of oxidized LDL (OxLDL) with the SCARF1- or SCARF2-transfected cells by flow cytometry. (C), (D), and (E) Schematic diagrams of the SCARF1-SCARF2 chimeric molecules generated for binding assays. The switched regions are indicated by red rectangles. The positively charged Site 1 and Site 2 of SCARF1 are shown as blue lines. The binding of molecules with OxLDL is indicated as + (positive) or – (negative). (F) Interactions of OxLDL with the chimeric molecule-transfected cells by flow cytometry. (G) Confocal fluorescent images of the chimera molecule SF1-1- or SF2-1-transfected cells incubated with OxLDL (scale bar, 7.5 µm). (H) Sequence alignment of the binding sites of SCARF1 from different species and human SCARF2.
Figure 7
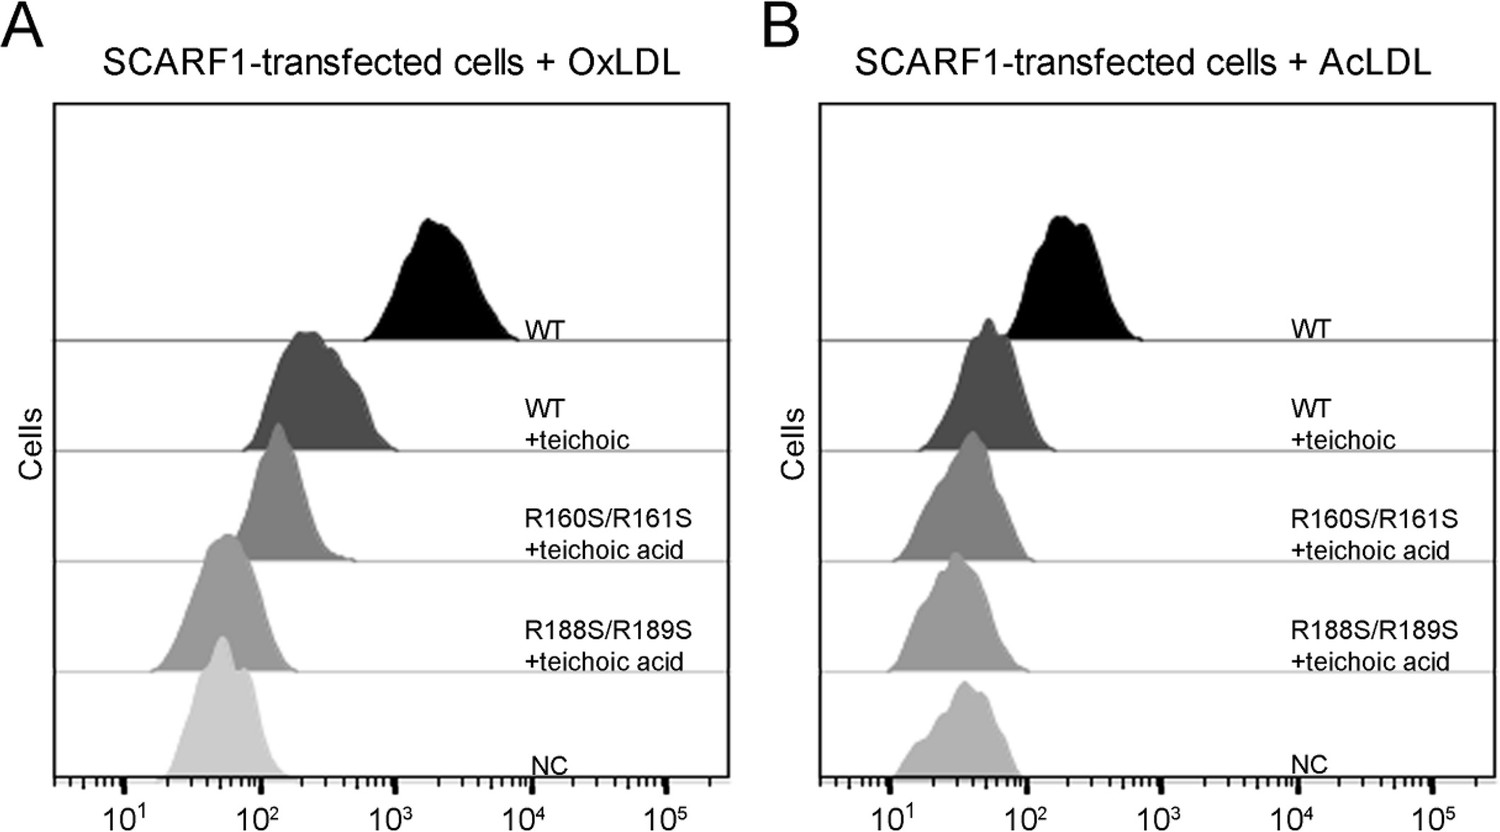
Inhibition of the interactions of SCARF1 with modified low-density lipoproteins (LDLs) by teichoic acids.
(A) Interaction of oxidized LDL (OxLDL) with the cells transfected with the wild type or mutants of SCARF1 in the presence of teichoic acids by flow cytometry. (B) Interaction of acetylated LDL (AcLDL) with the cells transfected with the wild type or mutants of SCARF1 in the presence of teichoic acids by flow cytometry.
Figure 8
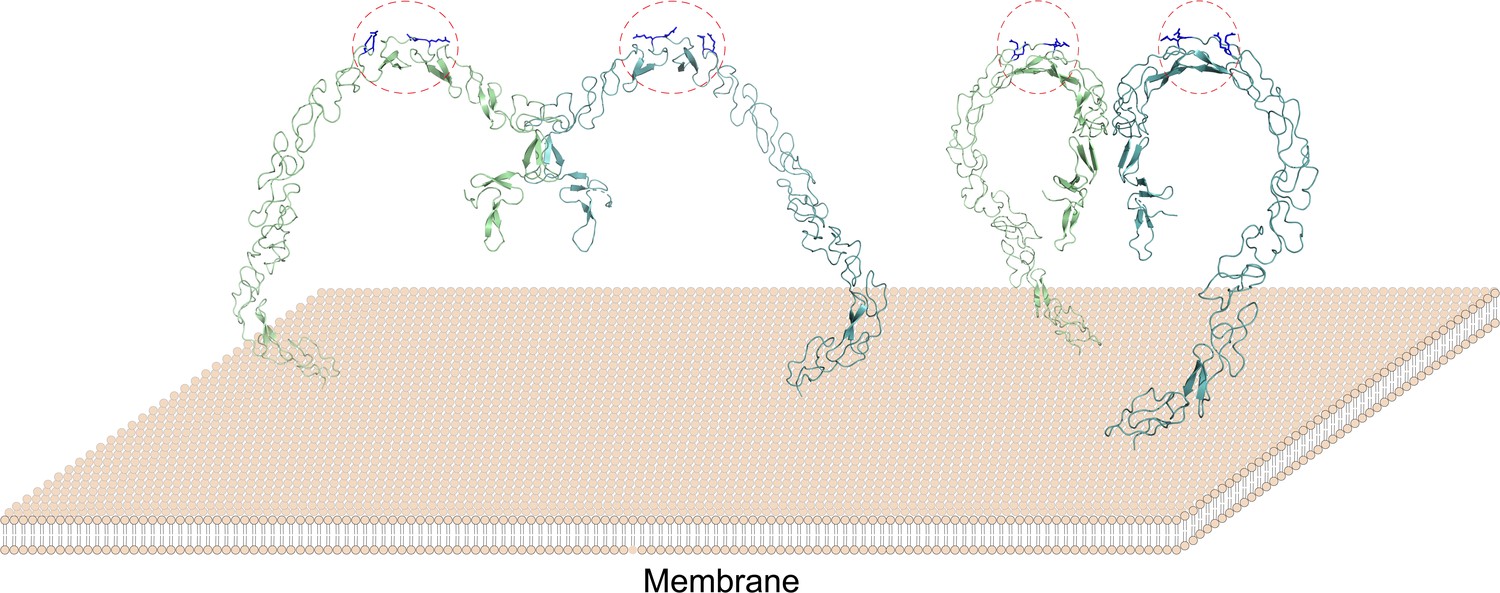
A model of the SCARF1 homodimers on the membrane surface.
The structure of the SCARF1 homodimer is generated by combining the crystal structures of f1 and f2, and rest of the ectodomain is from AlphaFold prediction. Two dimers are shown with different viewing angles. The monomers are colored in green or cyan. The lipoprotein binding sites are labeled by red dashed ovals and the arginines at the binding sites are colored in blue.
Additional files
-
Supplementary file 1
X-ray data collection and processing.
- https://cdn.elifesciences.org/articles/93428/elife-93428-supp1-v1.docx
-
Supplementary file 2
Crystallographic statistics of the structures.
- https://cdn.elifesciences.org/articles/93428/elife-93428-supp2-v1.docx
-
MDAR checklist
- https://cdn.elifesciences.org/articles/93428/elife-93428-mdarchecklist1-v1.docx
Download links
A two-part list of links to download the article, or parts of the article, in various formats.
Downloads (link to download the article as PDF)
Open citations (links to open the citations from this article in various online reference manager services)
Cite this article (links to download the citations from this article in formats compatible with various reference manager tools)
Structure of scavenger receptor SCARF1 and its interaction with lipoproteins
eLife 13:RP93428.
https://doi.org/10.7554/eLife.93428.3


