Meta-Research: Understudied genes are lost in a leaky pipeline between genome-wide assays and reporting of results
- Interdisciplinary Biological Sciences, Northwestern University, United States
- Department of Chemical and Biological Engineering, Northwestern University, United States
- Northwestern Institute on Complex Systems, Northwestern University, United States
- Department of Molecular Biosciences, Northwestern University, United States
- Department of Physics and Astronomy, Northwestern University, United States
- The Potocsnak Longevity Institute, Northwestern University, United States
- Simpson Querrey Lung Institute for Translational Science, Northwestern University, United States
Figures
Figure 1 with 7 supplements
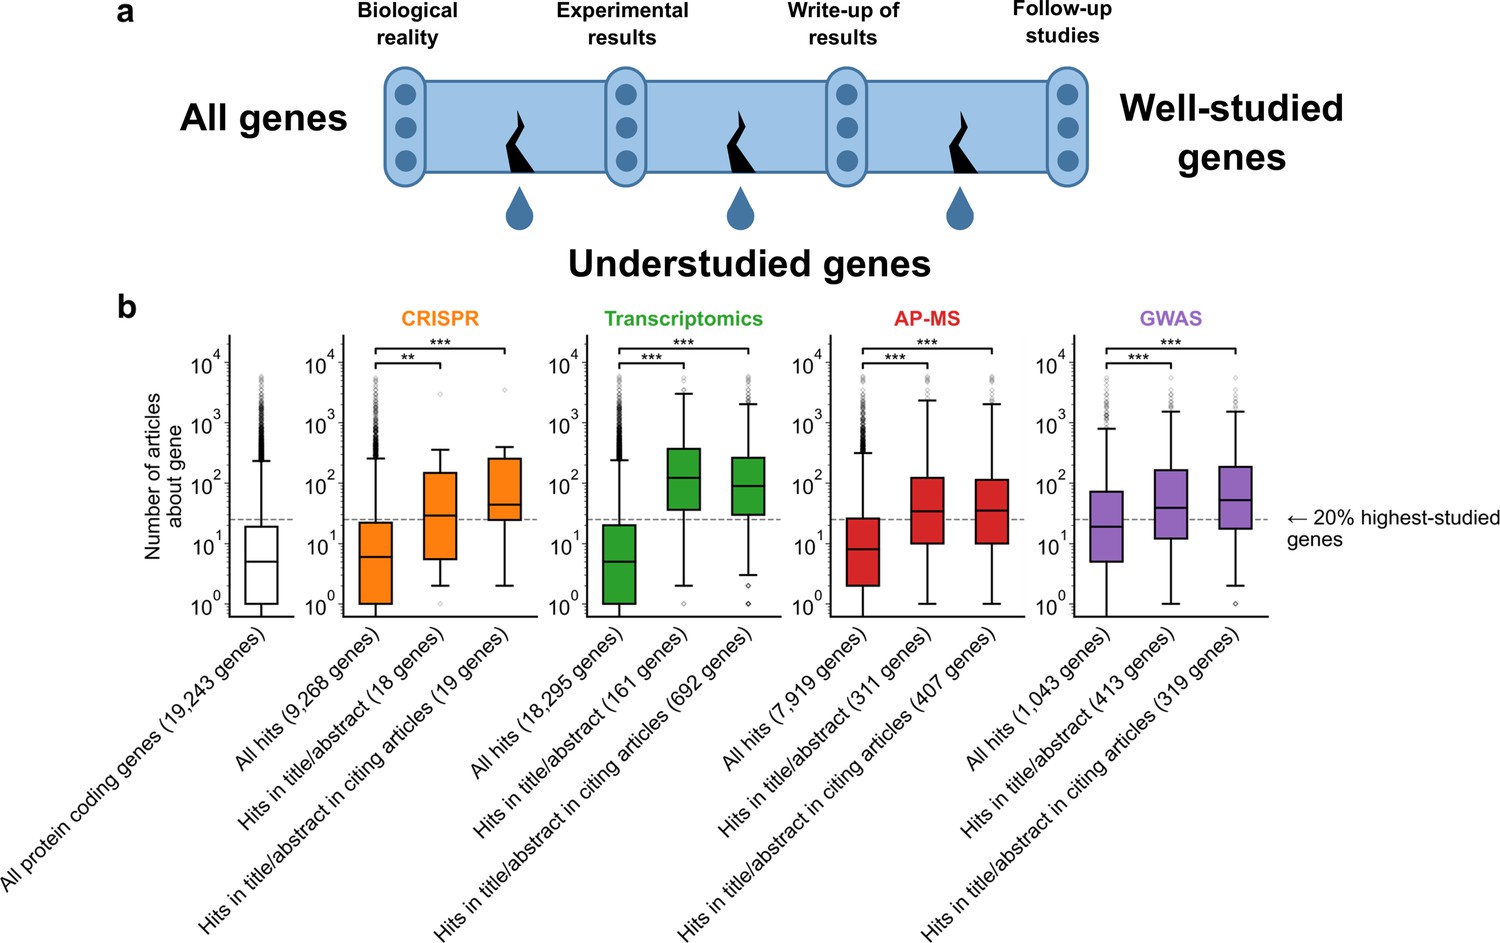
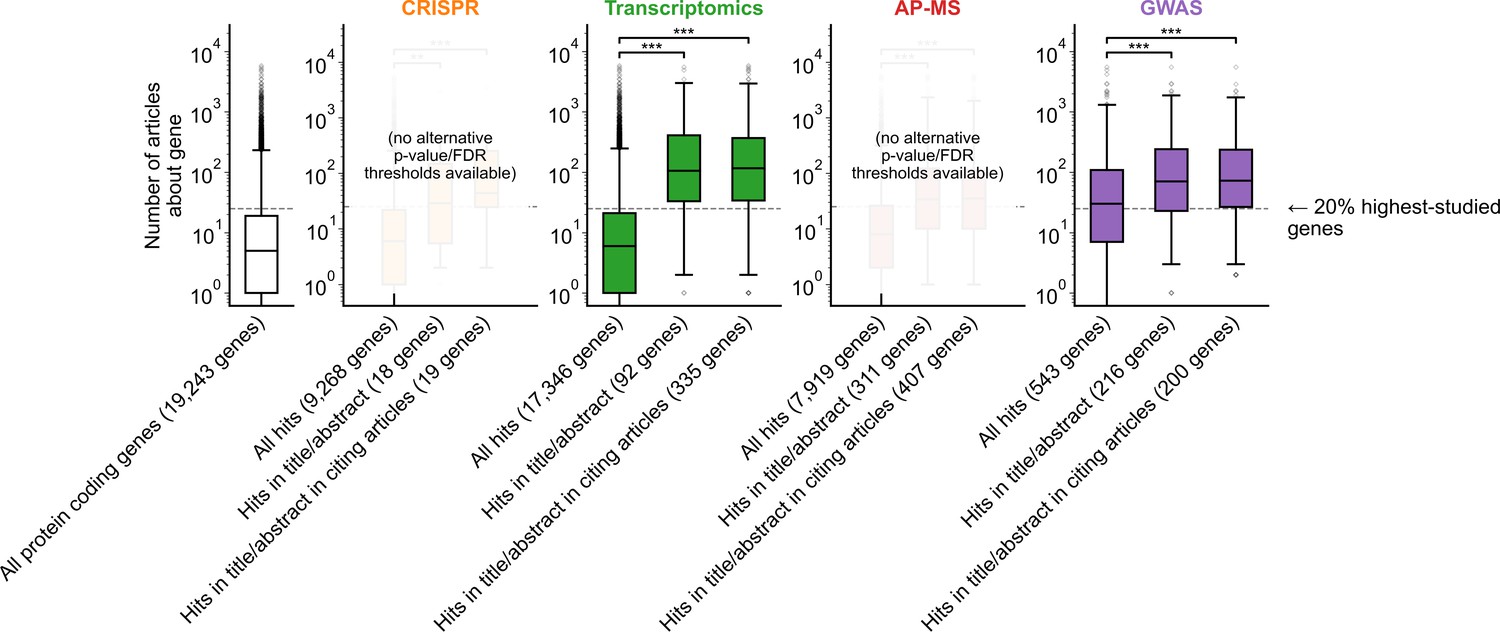
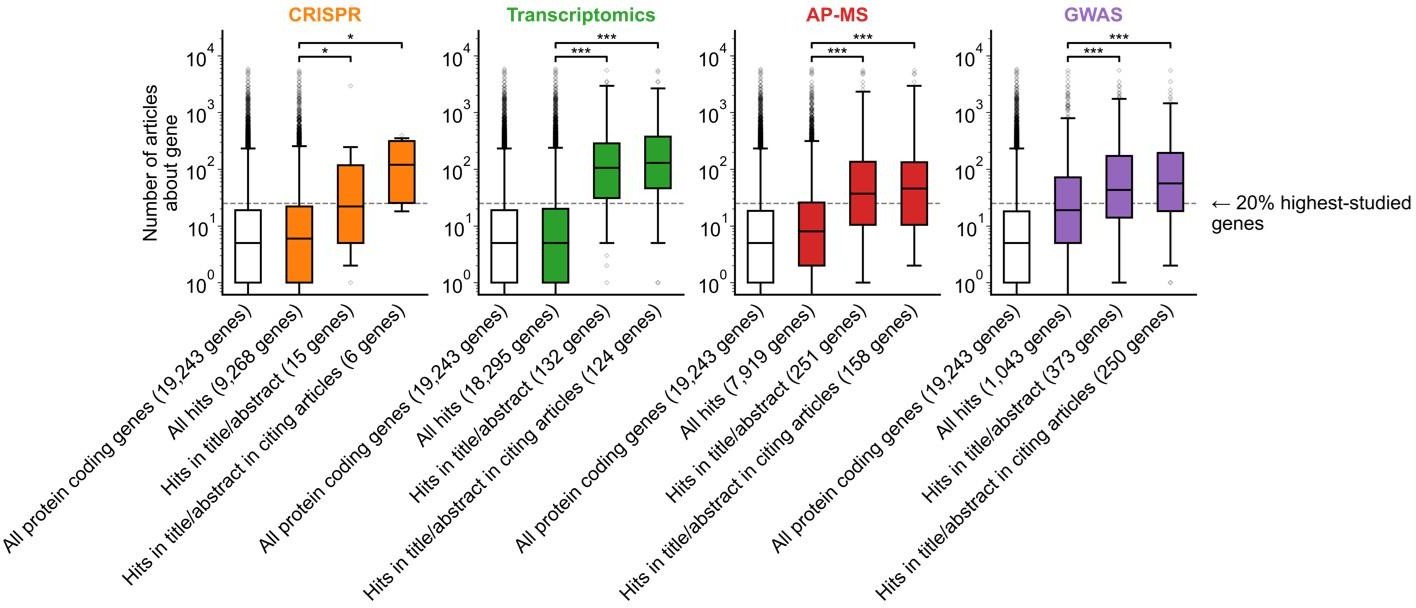
A shift in focus toward well-studied genes occurs during the summarization and write-up of results and remains in subsequent studies.
(a) Conceptual diagram depicting possible points of abandonment for understudied genes in studies using high-throughput -omics experiments. (b) We identified articles reporting on genome-wide CRISPR screens (CRISPR, 15 focus articles and 18 citing articles), transcriptomics (T-omics, 148 focus articles and 1,678 citing articles), affinity purification–mass spectrometry (AP-MS, 296 focus articles and 1,320 citing articles), and GWAS (450 focus articles and 3,524 citing articles). Focusing only on protein-coding genes, we retrieved data uploaded to repositories describing which genes came up as ‘hits’ in each experiment. We then retrieved the hits mentioned in the titles and abstracts of those articles and hits mentioned in the titles and abstracts of articles citing those articles. Unique hit genes are only counted once. Bibliometric data reveals that understudied genes are frequently hits in -omics experiments but are not typically highlighted in the title/abstract of reporting articles, nor in the title/abstract or articles citing reporting articles. For example, the results for CRISPR were obtained from 15 focus studies (original research) and 18 subsequent studies (papers citing focus articles). Those 15 studies identified 9268 genes where loss-of-function changed phenotypes but, in their titles and abstracts, mentioned only 18 of those 9268 genes. While the 9268 hit genes have received similar research attention to the entirety of protein-coding genes, the 18 hit genes mentioned in the title or abstract are significantly better studied (p=0.0033 by two-side Mann-Whitney U test). The articles citing the focus articles also only mentioned in their titles and abstracts 19 highly-studied hit genes. ** denotes p<0.01 and *** denotes p<0.001 by two-sided Mann-Whitney U test, comparing genes highlighted in title/abstract to genes present in hit lists.
Figure 1—figure supplement 1
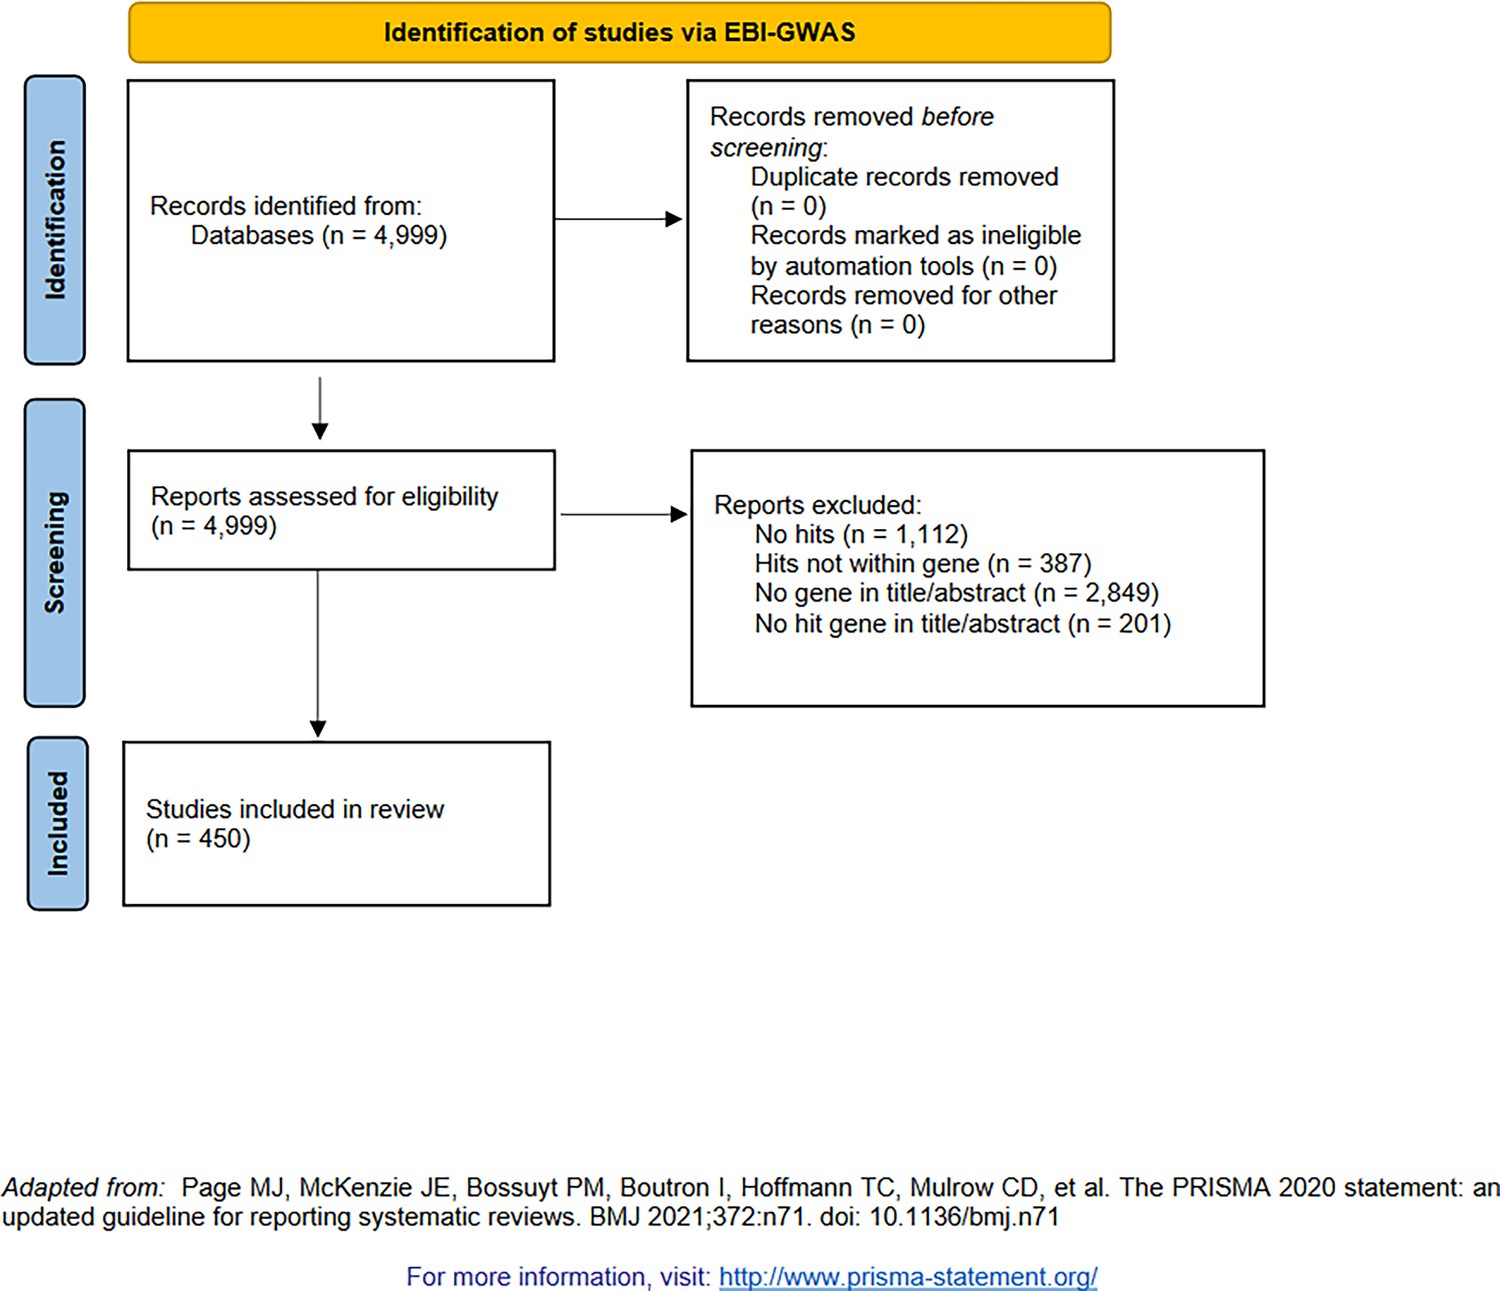
PRISMA diagram for the selection of genome-wide association studies (GWAS, from studies indexed by the NHGRI-EBI GWAS catalog [Buniello et al., 2019]).
Figure 1—figure supplement 2
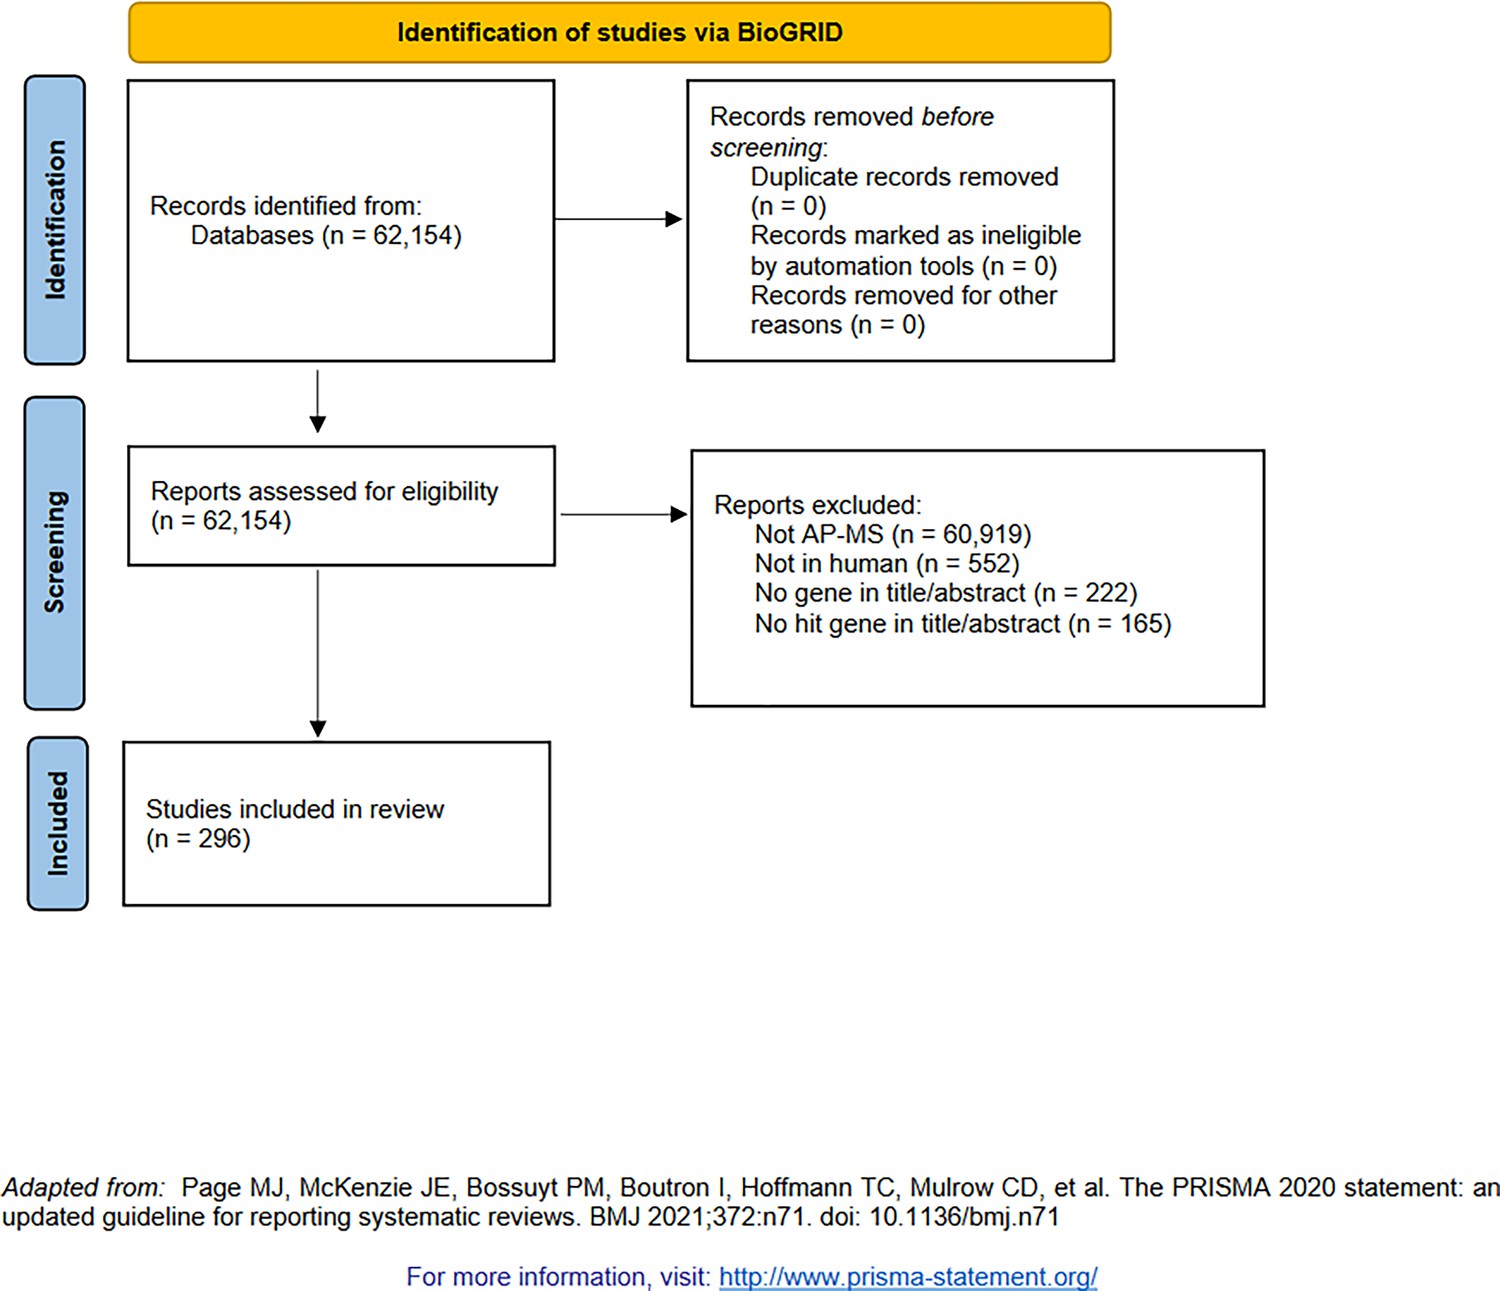
PRISMA diagram for the selection of affinity purification–mass spectrometry (AP-MS, indexed by BioGRID [Oughtred et al., 2021]).
Figure 1—figure supplement 3
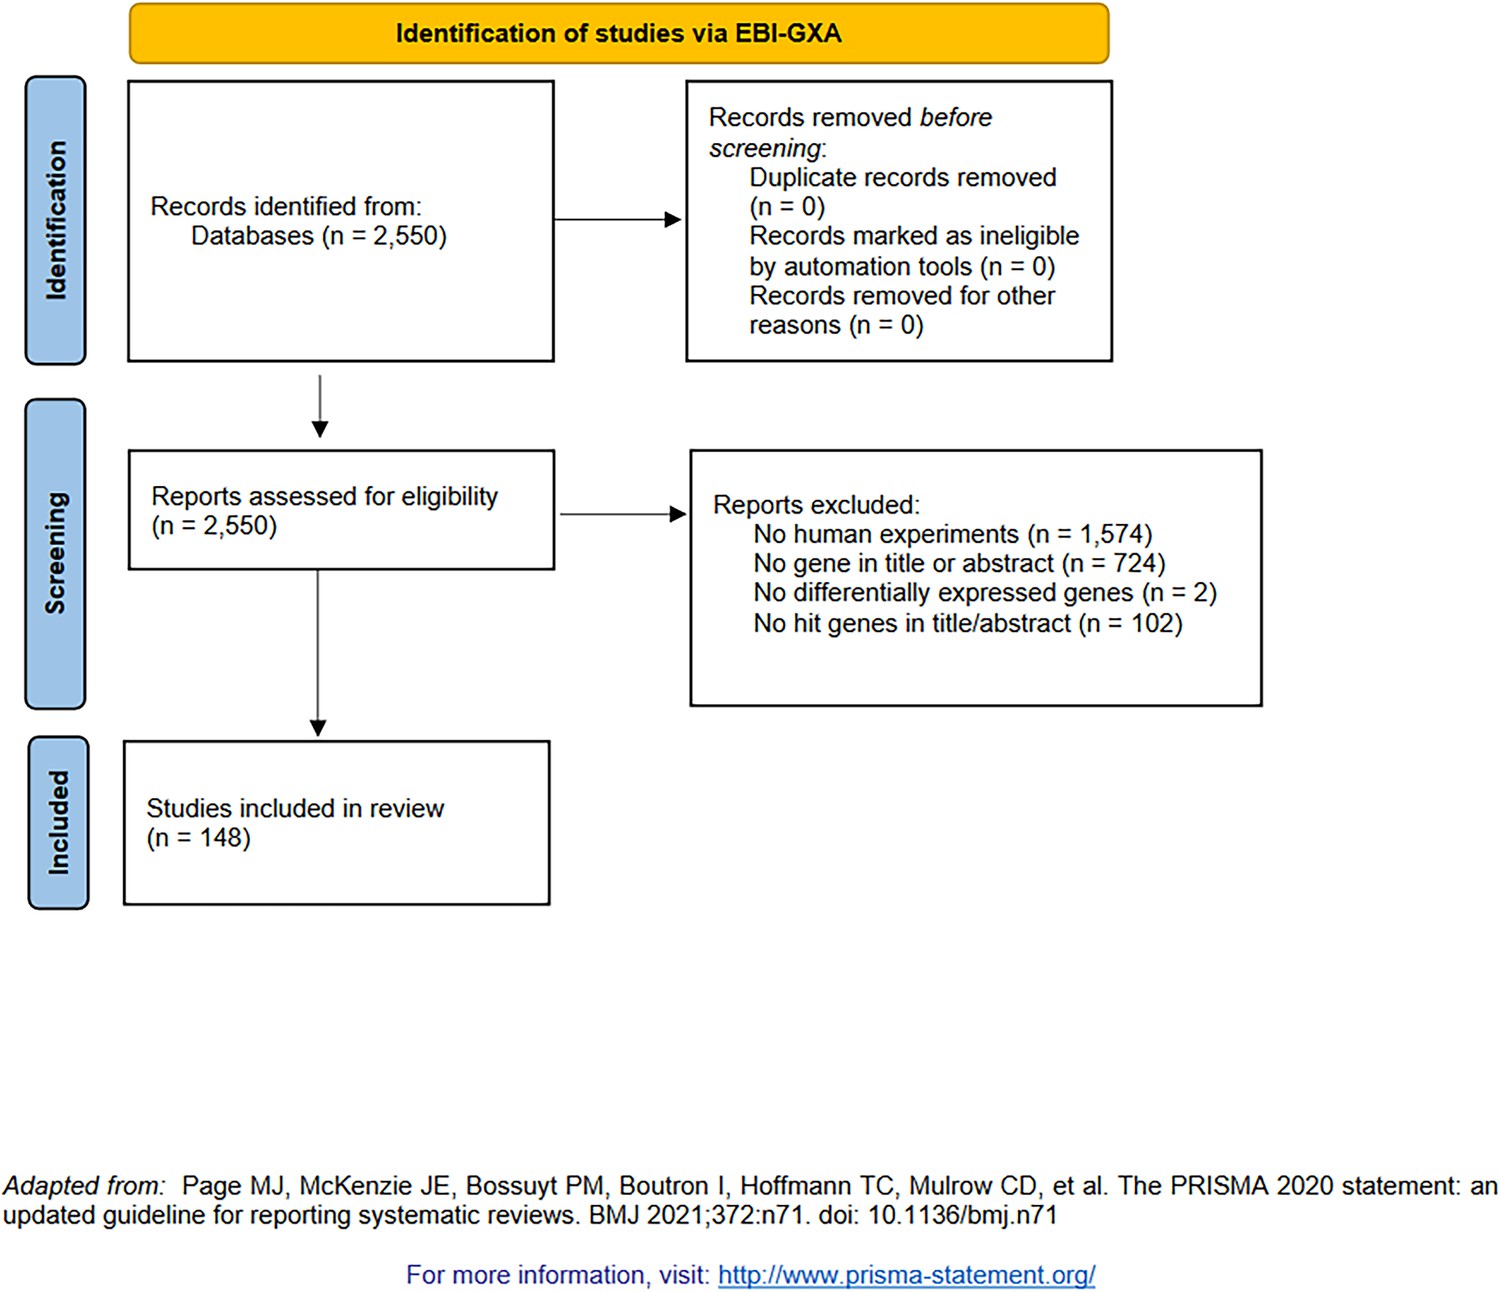
PRISMA diagram for the selection of transcriptomic studies (indexed by the EBI Gene Expression Atlas [Papatheodorou et al., 2018]).
Figure 1—figure supplement 4

PRISMA diagram for the selection of genome-wide screens using CRISPR (indexed by BioGRID Open Repository of CRISPR Screens [Oughtred et al., 2021]).
Figure 1—figure supplement 5
Variant of Figure 1B with alternate p-value/FDR thresholds for significance where applicable.
GWAS p-value threshold for significance was set to 1e-10 and transcriptomics FDR threshold for significance was set to 0.0001. Alternative thresholding was not available for AP-MS or CRISPR because significance calling was complex and varied across experiments in both categories. *** denotes p<0.001 by two-sided Mann-Whitney U test.
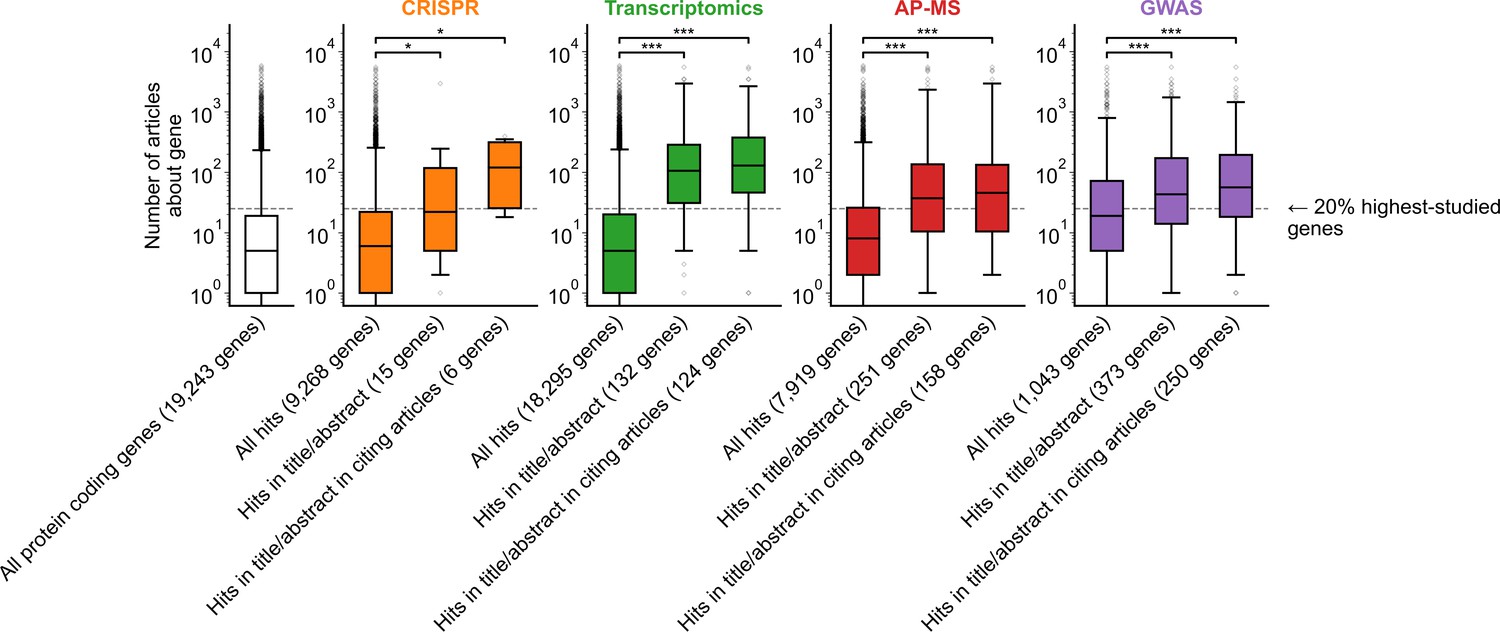
Figure 1—figure supplement 6
Variant of Figure 1B only considering articles published in 2002 or before, prior to the publication of any of the articles featuring -omics experiments which we considered for this analysis.
*** denotes p<0.001 by two-sided Mann-Whitney U test.
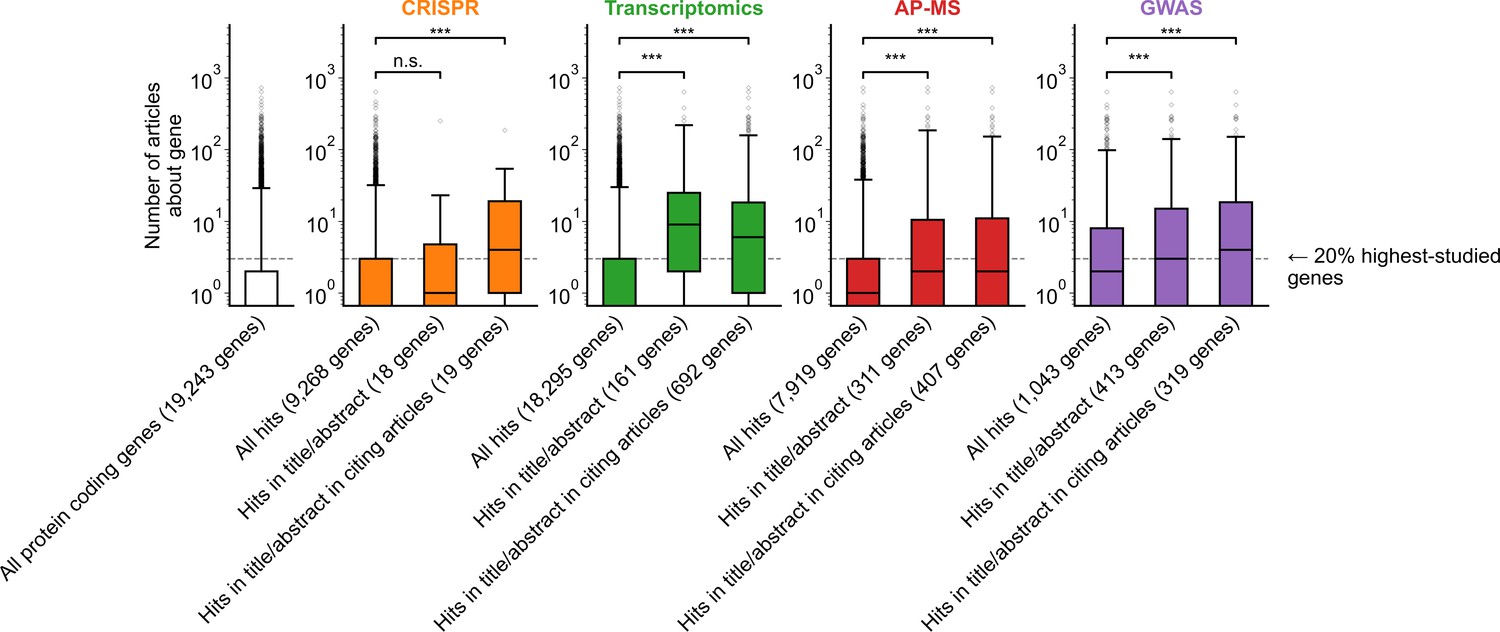
Figure 1—figure supplement 7
Variant of Figure 1B only considering one randomly chosen gene per article title/abstract.
* denotes p<0.05 and *** denotes p<0.001 by two-sided Mann-Whitney U test.
Figure 2 with 3 supplements
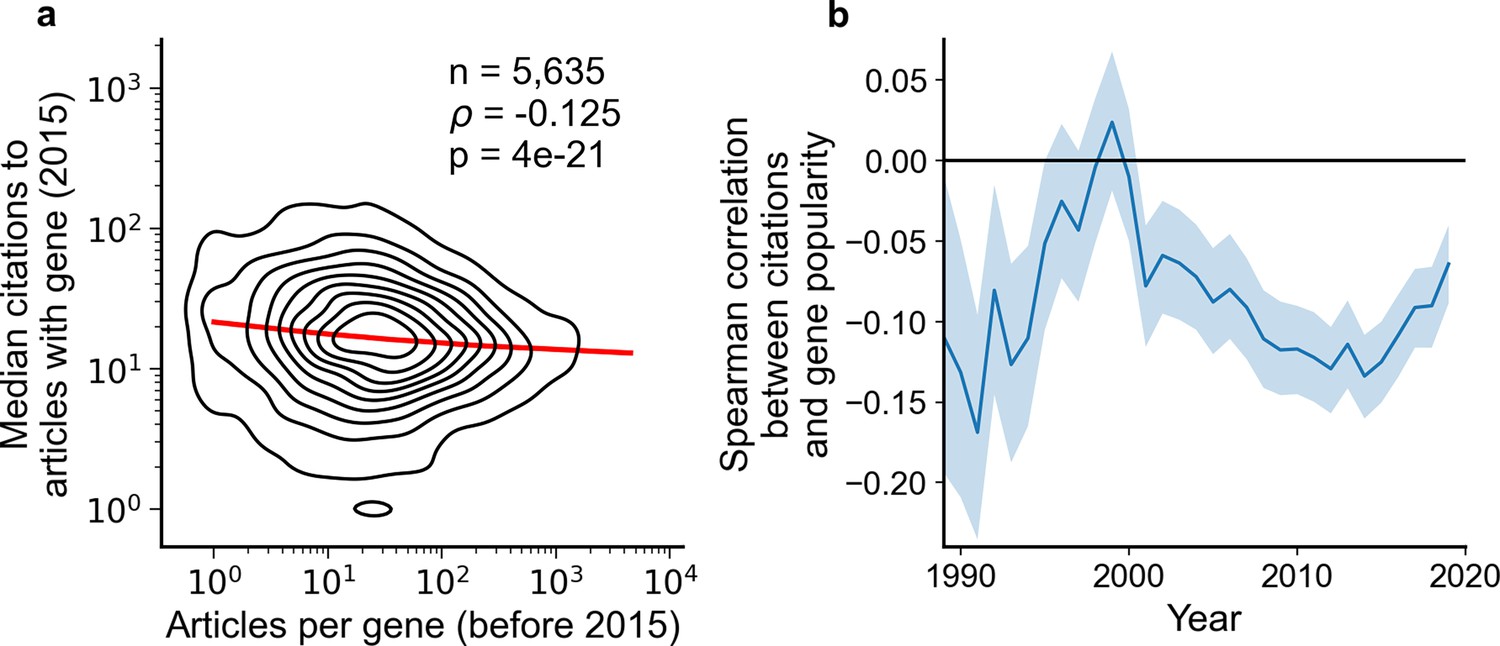
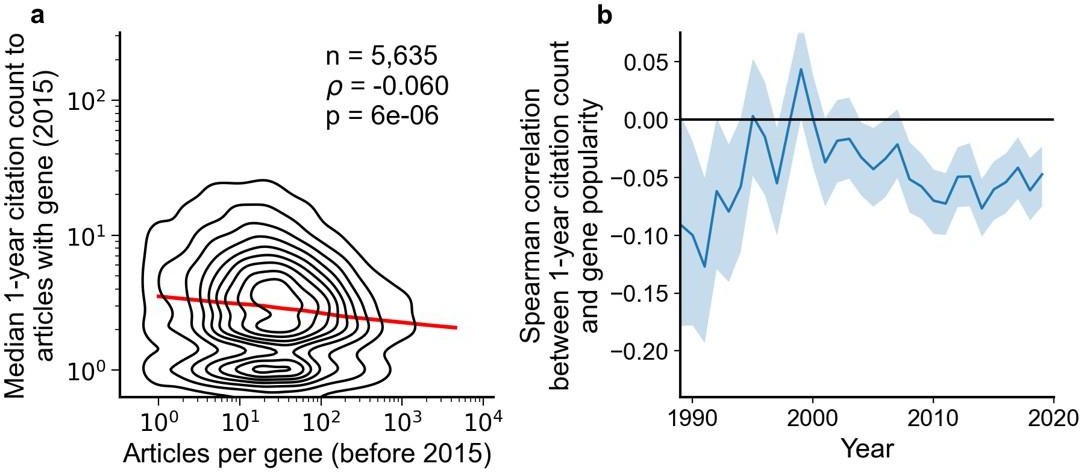
Articles focusing on less popular genes tend to accrue more citations.
(a) Density plot shows correlation between articles per gene before 2015 and median citations to articles published in 2015. Contours correspond to deciles in density. Solid red line shows locally weighted scatterplot smoothing (LOWESS) regression. ρ is Spearman rank correlation and p the significance values of the Spearman rank correlation as described by Kendall and Stuart, 1973. We forgo depicting more recent years than 2015 to allow for citations to accumulate over multiple years, providing a more sensitive and robust readout of long-term impact. (b) Spearman correlation of previous gene popularity (i.e. number of articles) to median citations per year since 1990. Solid blue line indicates nominal Spearman correlation, shaded region indicates bootstrapped 95% confidence interval (n=1000). Only articles with a single gene in the title/abstract are considered, excluding the 30.4% of gene-focused studies which feature more than one gene in the title/abstract. For more recent years, where articles have had less time to accumulate citations, insufficient signal may cause correlation to converge toward zero.
Figure 2—figure supplement 1
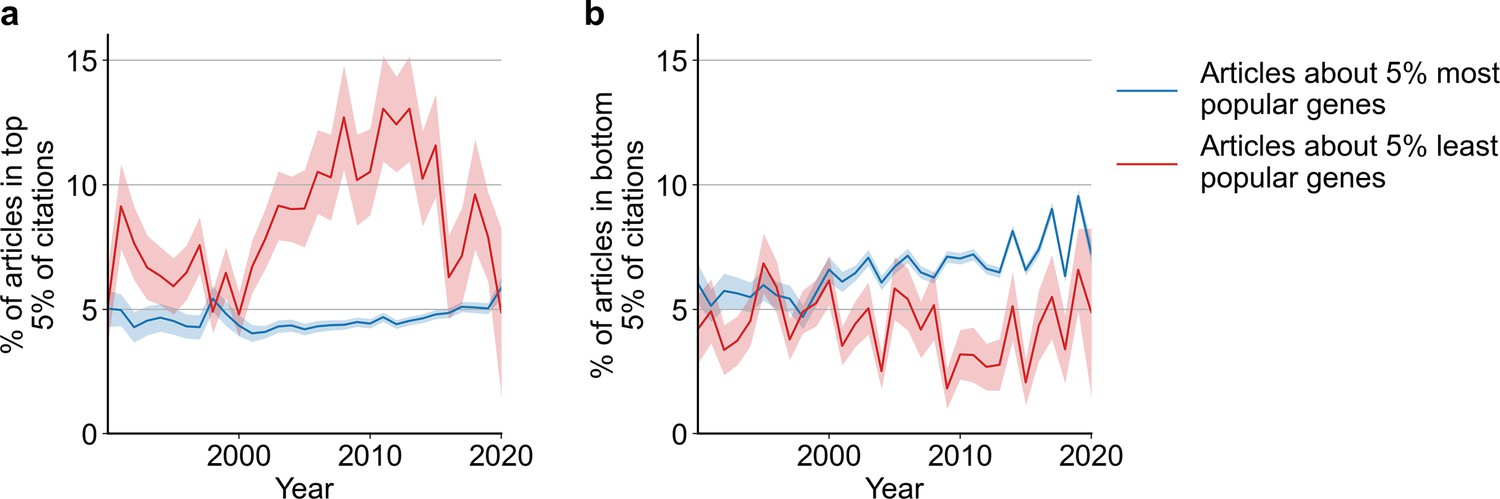
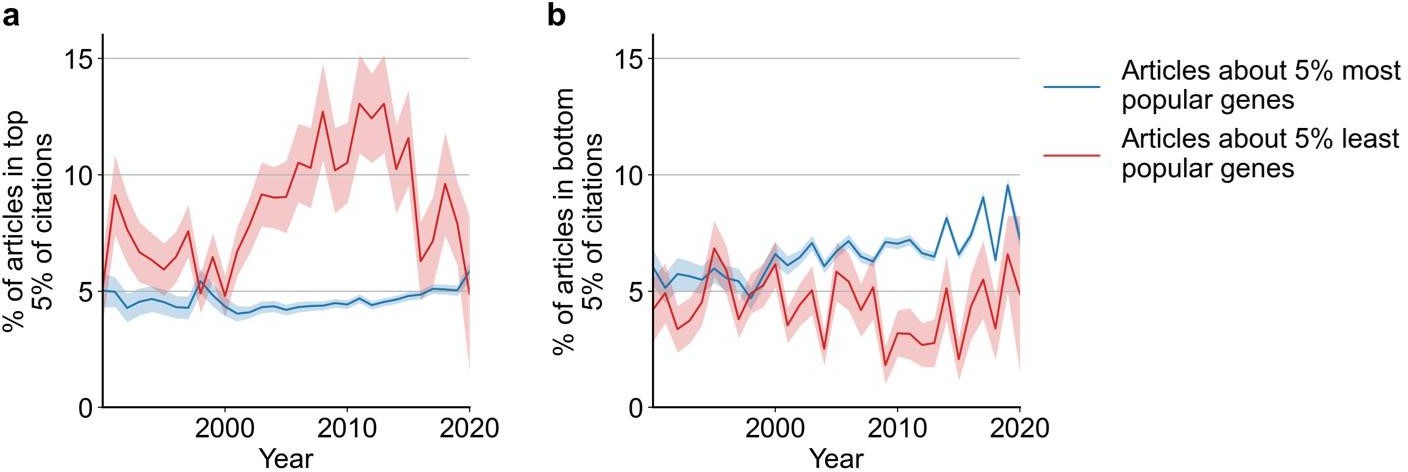
Likelihoods of being highly cited (top 5% of citations among all articles about genes), panel (a) or lowly cited (bottom 5% of citations among all articles about genes), panel (b) for articles about the most popular genes (top 5% accumulated articles) versus articles about the least popular genes (bottom 5% accumulated articles) by year of publication.
Only articles with a single gene in the title/abstract are considered. Shaded regions show ±1 standard error of the proportion.
Figure 2—figure supplement 2
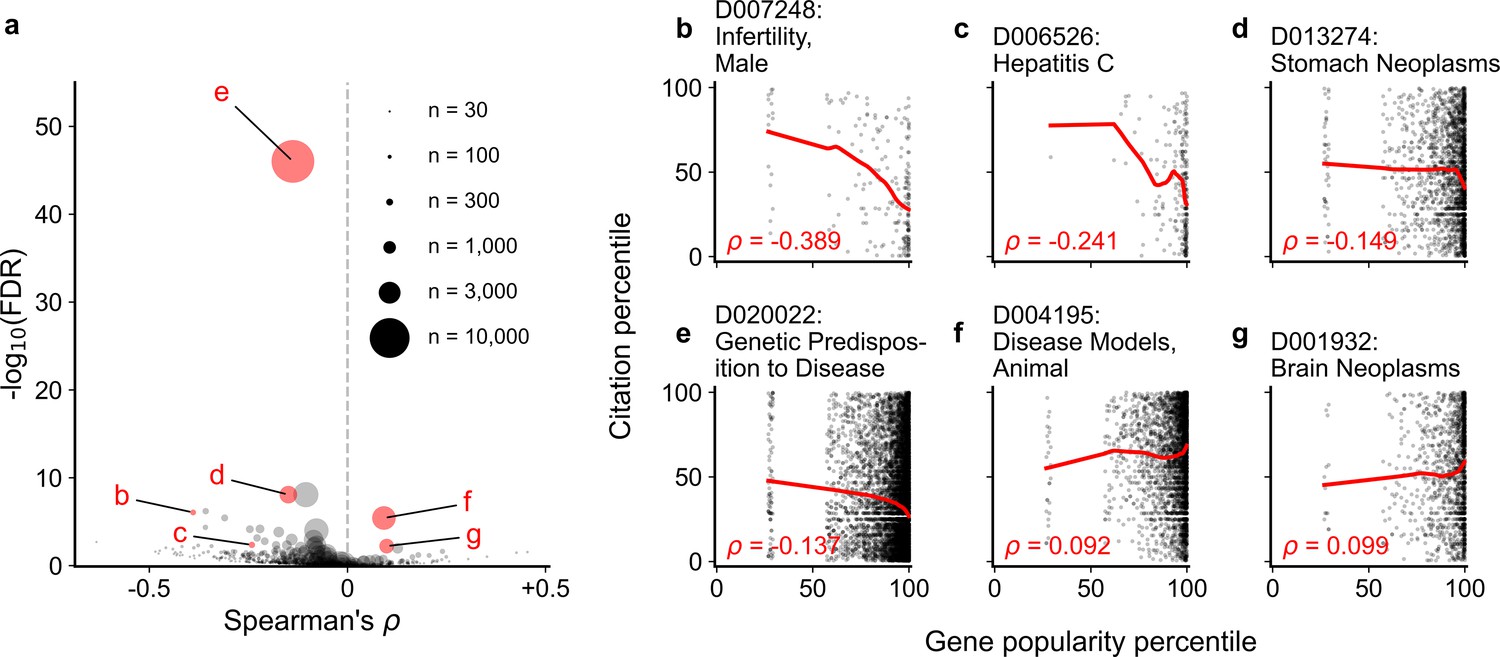
Spearman correlation and significance (Kendall and Stuart, 1973; Kendall and Stuart, 1961) of normalized gene popularity vs normalized article citation rank for articles within disease MeSH terms from 2014 to 2018.
Only articles with a single gene in the title/abstract are included. (a) volcano plot of Spearman correlations, where size of dot corresponds to number of articles meeting criteria for each MeSH term. (b–g) Plots for several MeSH terms, corresponding to letters highlighted in (a). Solid red lines show LOWESS regression. Only MeSH terms under the ‘Diseases’ heading (tree number starting with ‘C’) with 30 articles or more were considered (602 MeSH terms).
Figure 2—figure supplement 3
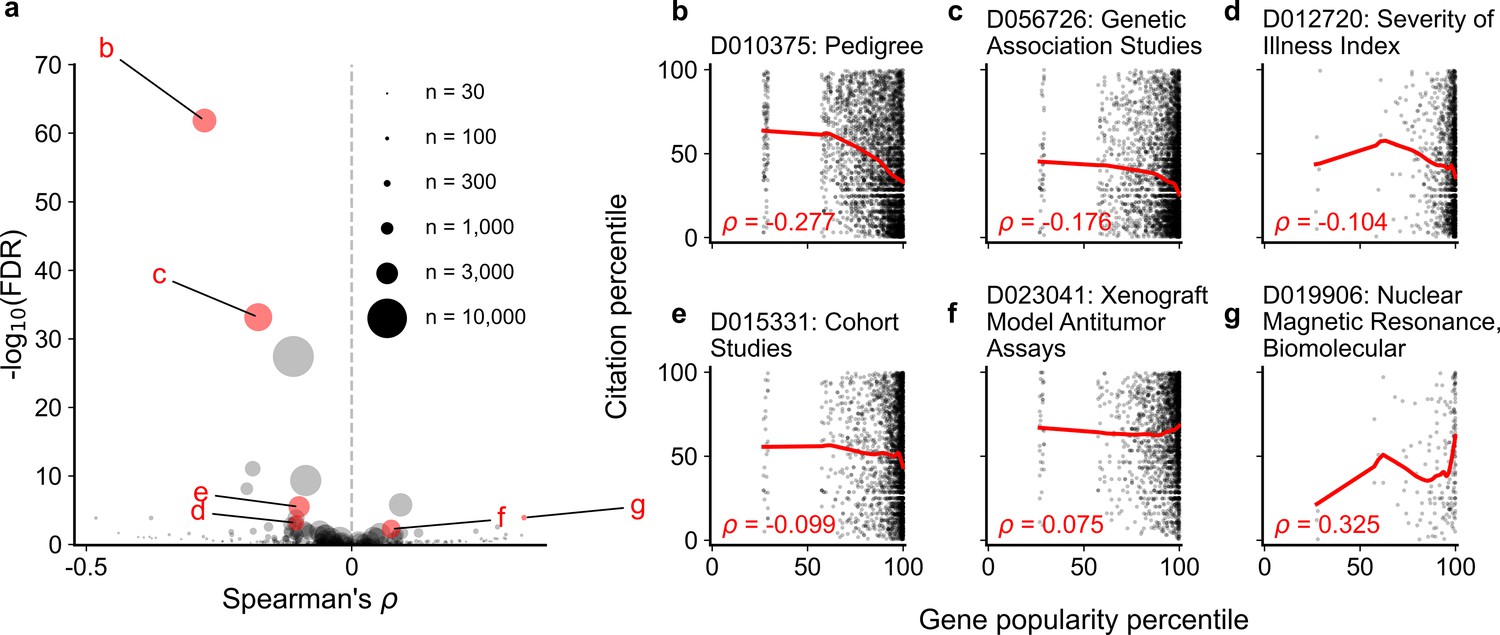
Spearman correlation and significance (Kendall and Stuart, 1973; Kendall and Stuart, 1961) of normalized gene popularity vs normalized article citation rank for articles within technique-related MeSH terms from 2014 to 2018.
Only articles with a single gene in the title/abstract are included. (a) volcano plot of Spearman correlations, where size of dot corresponds to number of articles meeting criteria for each MeSH term. (b–g) Plots for several MeSH terms, corresponding to letters highlighted in (a). Solid red lines show LOWESS regression. Only MeSH terms under the ‘Investigative Techniques’ heading (tree number starting with ‘E05’) with 30 articles or more were considered (264 MeSH terms).
Figure 3 with 2 supplements
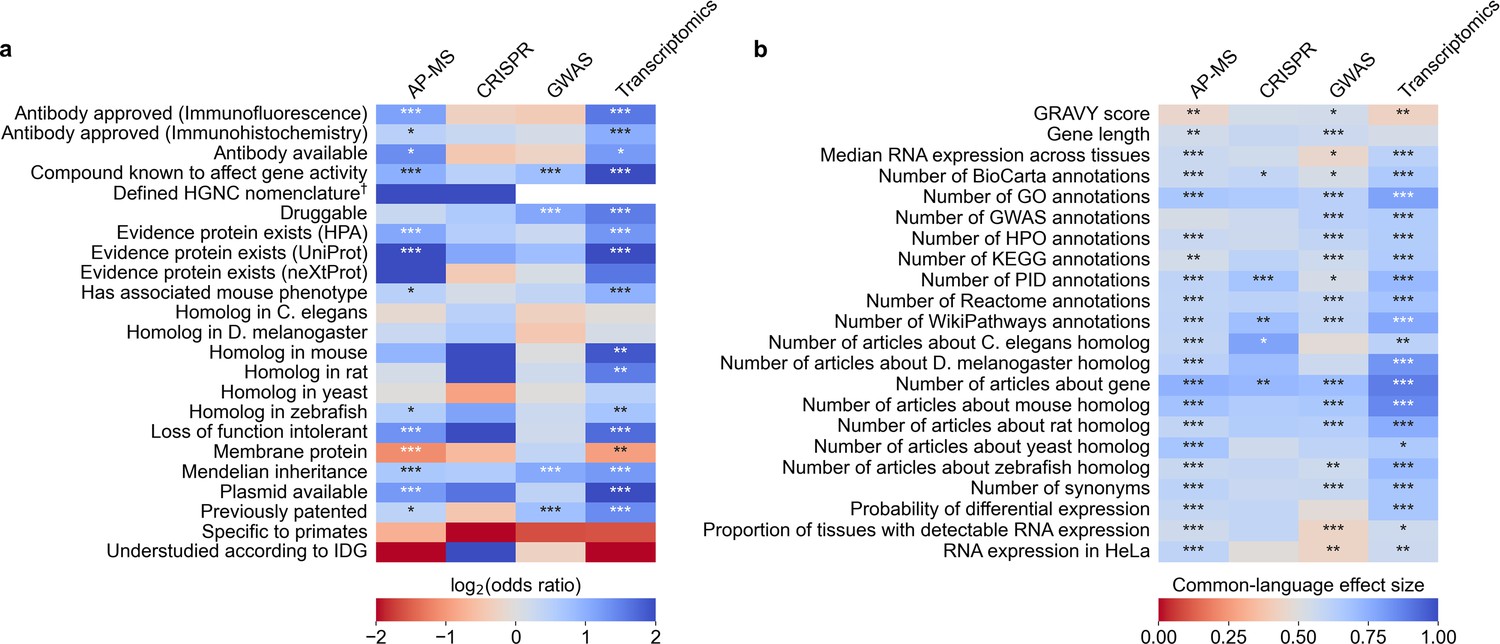
We evaluated which gene-related factors are associated with elevation to the title/abstract of an article featuring a high-throughput experiment.
(a) Association between factors with binary (True/False) identities and highlighting hits in title/abstract of reporting articles. Values represent the odds ratio between hits in the collected articles and hits mentioned in the title or abstract of collected articles (e.g. hits with a compound known to affect gene activity are 4.262 times as likely to be mentioned in the title/abstract in an article using transcriptomics, corresponding to an odds ratio of 4.331). Collected articles are described in Figure 1B and Figure 1—figure supplement 5, Figure 1—figure supplement 6 and Figure 1—figure supplement 7. 95% confidence interval of odds ratio is shown in parentheses. *=Benjamini-Hochberg FDR <0.05, **=FDR < 0.01, and ***=FDR < 0.001 by two-sided Fisher exact test. Results are shown numerically in Supplementary file 4. For consistency between studies, hits were restricted to protein-coding genes. Thus, status as a protein-coding gene could not be tested. †No genes without a defined HUGO symbol were found as hits in GWAS or transcriptomics studies. (b) Association with factors with continuous identities and highlighting hits in title/abstract of reporting articles. Values represent F, the common-language effect size (equivalent to AUROC, where ~0.5 indicates little effect,>0.5 indicates positive effect and <0.5 indicates negative effect) of being mentioned in the titles/abstracts of the collected articles described in Figure 1B and Figure 1—figure supplement 5, Figure 1—figure supplement 6 and Figure 1—figure supplement 7. *=Benjamini-Hochberg FDR <0.05, **=FDR < 0.01, and ***=FDR < 0.001 by two-sided Mann-Whitney U test. Results are shown numerically in Supplementary file 5.
Figure 3—figure supplement 1

Identification of default factors in FMUG, manually chosen to represent different clusters of factors.
Factors are shown along the x axis, with genes along the y axis. Binary factors are coded to 0 (white) and 1 (purple), while continuous factors are ranked from 0 to 1 with ties resolved to minimum rank. Clustering was performed with Ward’s method for hierarchical clustering (Ward, 1963). Bold indicates FMUG ‘s default factors, which we selected based on this clustering and based on their strength of association with gene selection (Figure 3, Supplementary file 4, and Supplementary file 5).
Figure 3—figure supplement 2
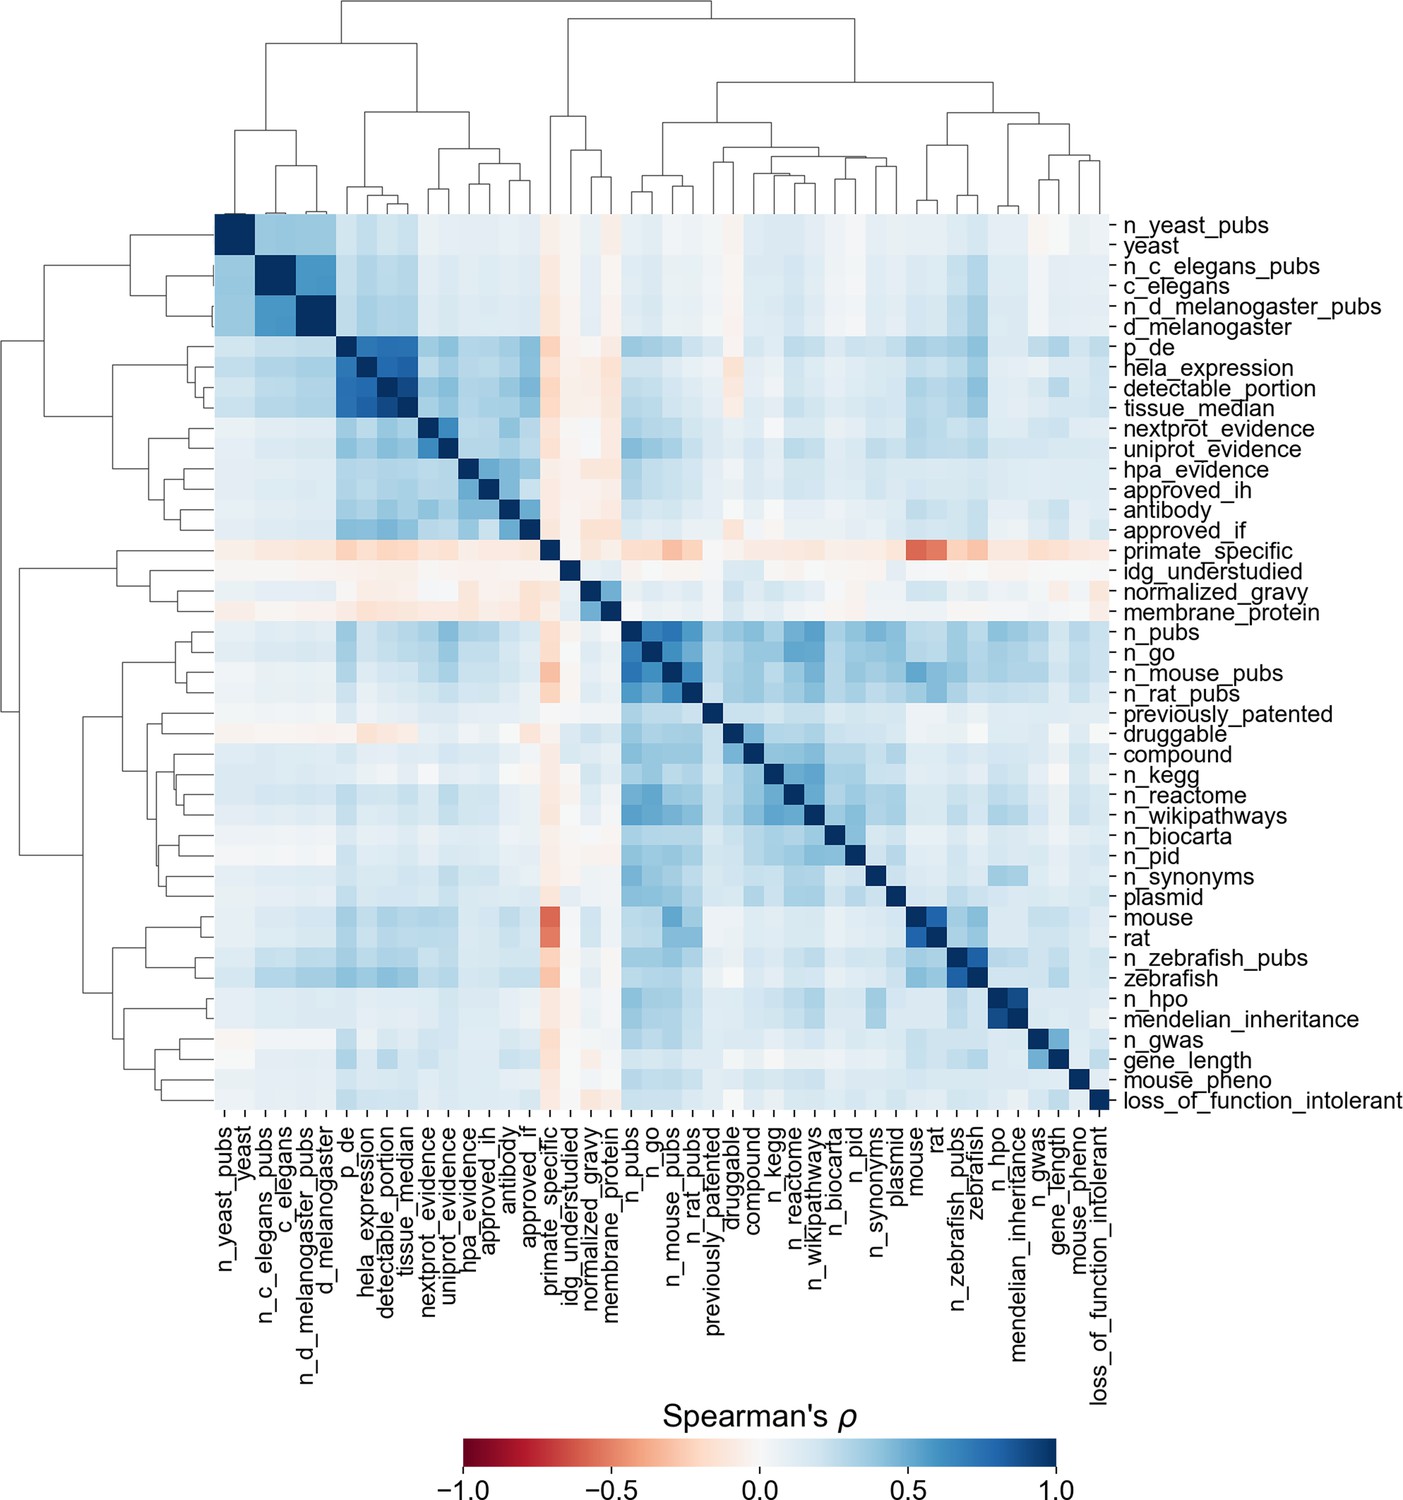
Similarity matrix and clustermap showing Spearman correlation between factors across all human protein-coding genes.
Correlations involving binary factors should not be interpreted as statistical fact, as Spearman’s ρ does not account for non-ordinal data. Clustering was performed with Ward’s method for hierarchical clustering (Ward, 1963).
Figure 4
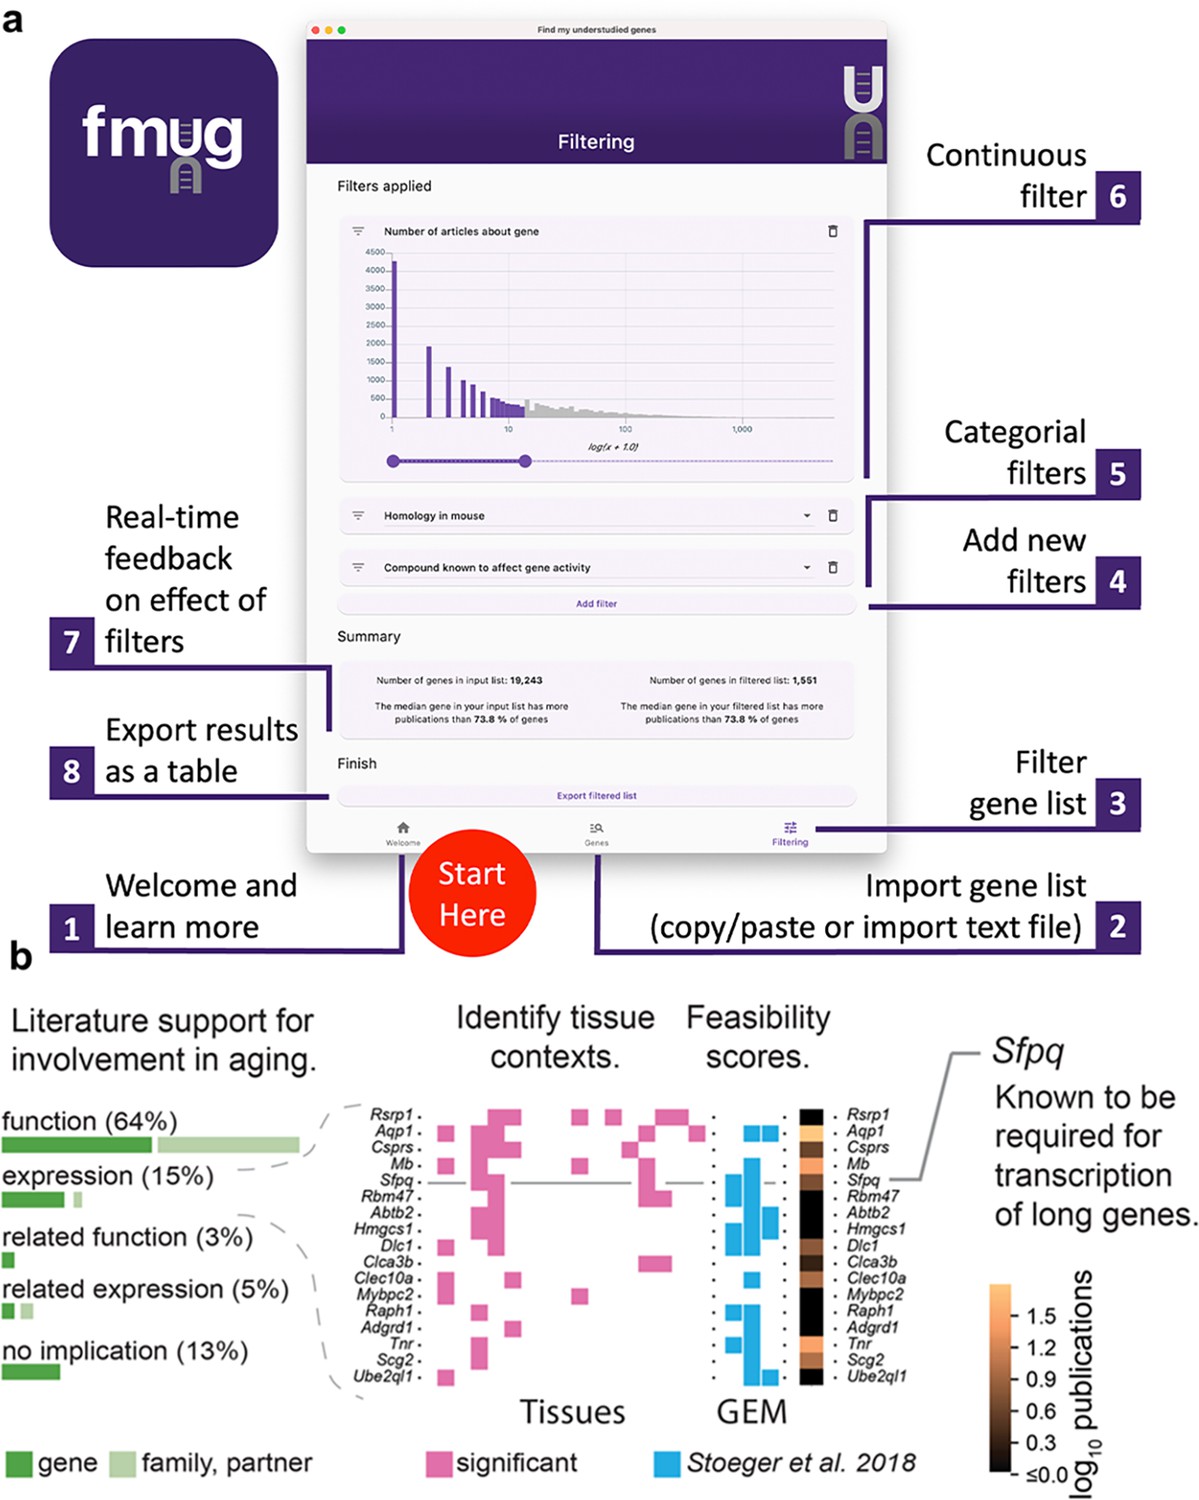
We created FMUG to help researchers identify understudied genes among their genes of interest and characterize their tractability for future research.
(a) Diagram describing use of FMUG. (b) An early prototype of FMUG led us to the hypothesis that transcript length negatively correlates with up-regulation during aging. First, we identified genes that strongly associate with age-dependent transcriptional change across multiple cohorts. We then performed a literature review for each of these genes to identify the most direct way the genes (or evolutionally closely related genes or functionally closely related partner proteins) had been studied in aging. Sixty-four percent had been functionally investigated in aging, 15% shown to change a measure of gene expression, 3% functionally investigated in a biological domain close to aging (such as senescence), and 5% shown to change a measure of gene expression in a biological domain close to aging. For genes reported by others to change expression with age, we identified tissues in which transcripts of the genes change during aging. We computed ‘feasibility scores’ scientific strategies (GEM: G: strong genetic support, E: and experimental potential, M: homolog in invertebrate model organism) as described by Stoeger et al., 2018 and total number of publications in MEDLINE. Splicing factor, proline- and glutamine-rich (Sfpq) had previously been demonstrated by Takeuchi et al. to be required for the transcriptional elongation of long genes (Takeuchi et al., 2018). When performing a data-driven analysis of factors that could possibly explain age-dependent changes of the entire transcriptome, we thus included gene and transcript lengths, and subsequently found them to be more informative than transcription factors or microRNAs (Stoeger et al., 2022).
Author response image 1
Author response image 2
Author response image 3

Author response image 4
Author response image 5
Videos
Video 1
FMUG tutorial video.
Tables
Key resources table
| Reagent type (species) or resource | Designation | Source or reference | Identifiers | Additional information |
|---|---|---|---|---|
| Software, algorithm | Python programming language | Python Software Foundation | RRID:SCR_008394 | |
| Software, algorithm | Find My Understudied Genes | This paper | RRID:SCR_025047 | Available at fmug.amaral.northwestern.edu |
Additional files
-
Supplementary file 1
Disease-related MeSH terms with a significant association between gene popularity and citations.
- https://cdn.elifesciences.org/articles/93429/elife-93429-supp1-v1.xlsx
-
Supplementary file 2
Technique-related MeSH terms with a significant association between gene popularity and citations.
- https://cdn.elifesciences.org/articles/93429/elife-93429-supp2-v1.xlsx
-
Supplementary file 3
Collected factors from literature search.
- https://cdn.elifesciences.org/articles/93429/elife-93429-supp3-v1.xlsx
-
Supplementary file 4
Association between factors with binary (True/False) identities and highlighting hits in title/abstract of reporting articles.
- https://cdn.elifesciences.org/articles/93429/elife-93429-supp4-v1.xlsx
-
Supplementary file 5
Association with factors with continuous identities and highlighting hits in title/abstract of reporting articles.
- https://cdn.elifesciences.org/articles/93429/elife-93429-supp5-v1.xlsx
-
Supplementary file 6
PubMed ID’s and mentioned genes for collected GWAS, CRISPR, transcriptomics and AP-MS articles.
- https://cdn.elifesciences.org/articles/93429/elife-93429-supp6-v1.csv
-
MDAR checklist
- https://cdn.elifesciences.org/articles/93429/elife-93429-mdarchecklist1-v1.pdf
Download links
A two-part list of links to download the article, or parts of the article, in various formats.
Downloads (link to download the article as PDF)
Open citations (links to open the citations from this article in various online reference manager services)
Cite this article (links to download the citations from this article in formats compatible with various reference manager tools)
Meta-Research: Understudied genes are lost in a leaky pipeline between genome-wide assays and reporting of results
eLife 12:RP93429.
https://doi.org/10.7554/eLife.93429.3


