Specific and comprehensive genetic targeting reveals brain-wide distribution and synaptic input patterns of GABAergic axo-axonic interneurons
- Cold Spring Harbor Laboratory, United States
- Program in Neurobiology, Stony Brook University, United States
- Department of Neurobiology, Duke University, United States
- Department of Neural and Behavioral Sciences, Penn State College of Medicine, United States
- Department of Biomedical Engineering, Duke University, United States
Figures
Figure 1 with 3 supplements
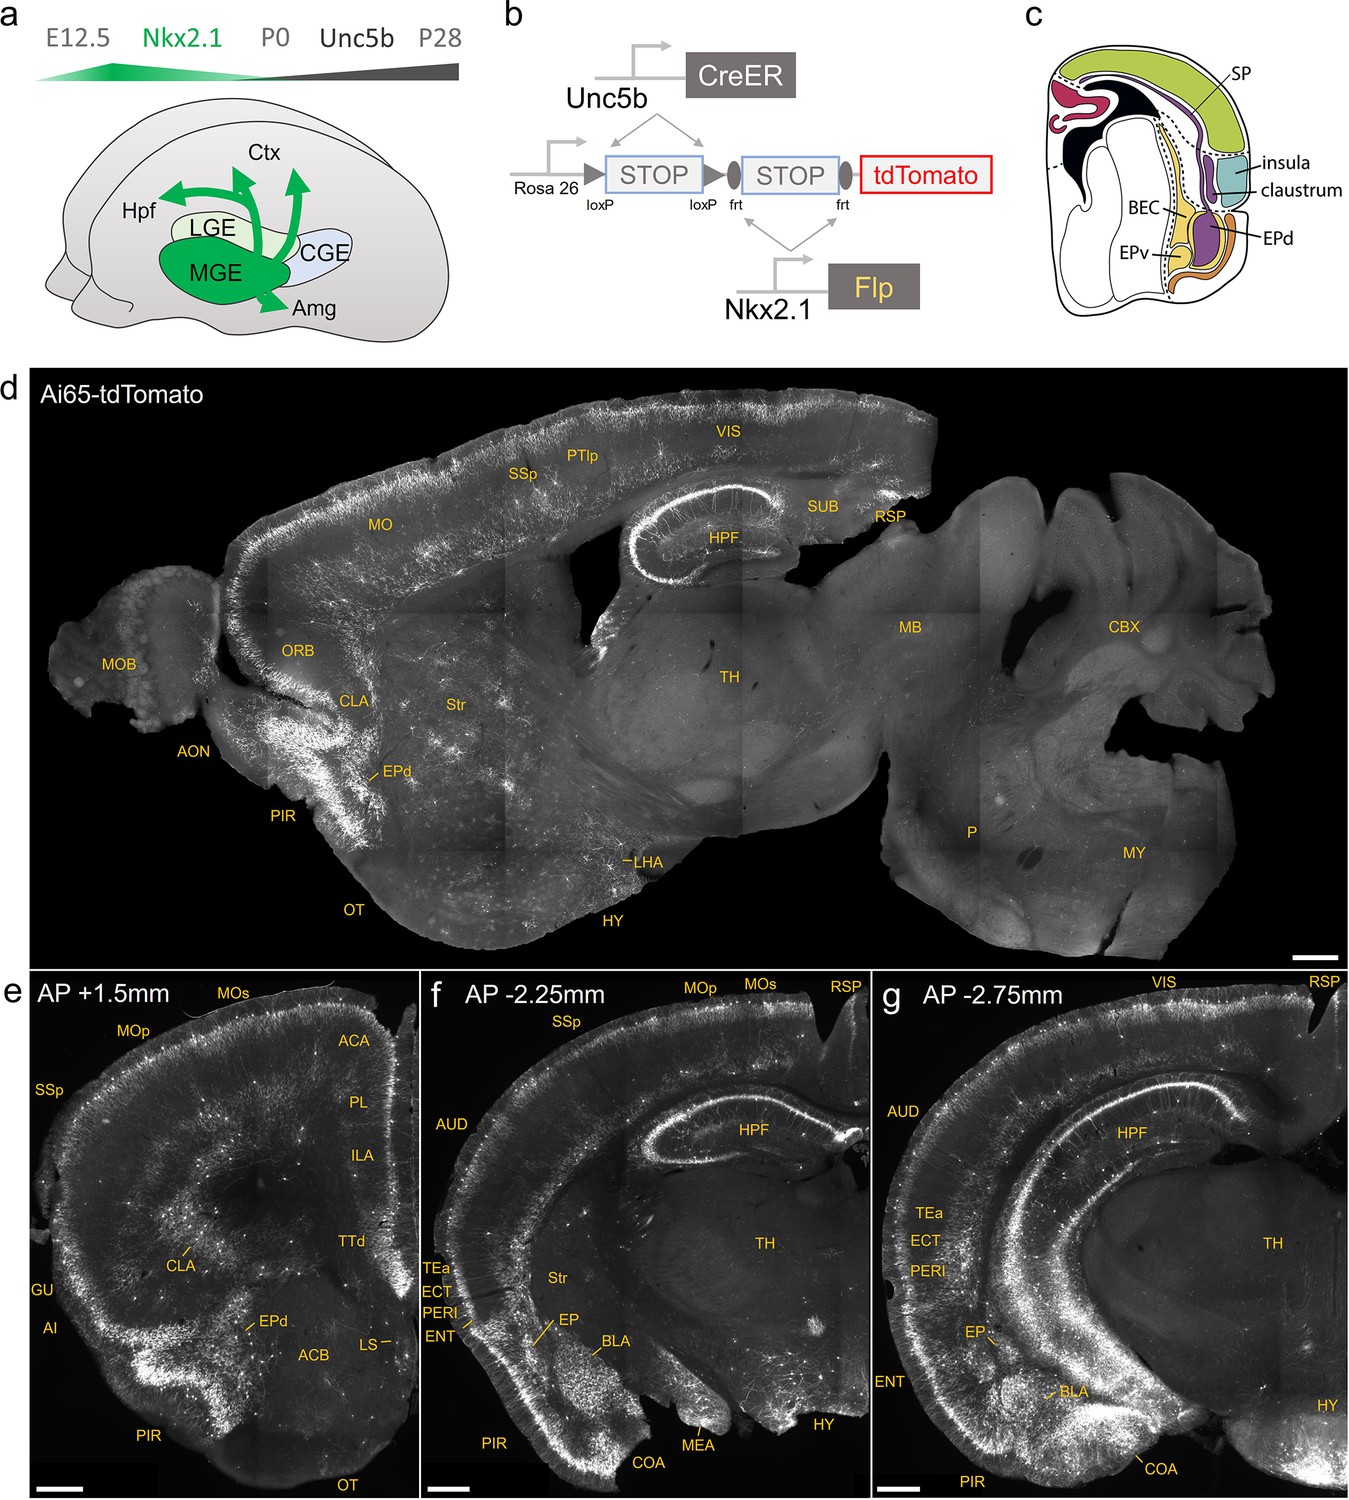
Developmental genetic intersectional targeting reveals brain-wide axo-axonic cell (AAC) distribution patterns.
Schematic of lineage (Nkx2.1) and marker (Unc5b) intersection for pan-AAC labeling. (a) Embryonic Nkx2.1 expression defines medial ganglionic eminence (MGE) interneuron identity while subsequent postnatal Unc5b expression restricts interneurons to AACs. Height of green or gray shade represents relative expression levels. (b) Configuration of triple allele intersectional labeling, combining Unc5bCreER and Nkx2.1Flp drivers and the Cre-AND-Flp Ai65 reporter. Embryonic Flp expression removes the frt-flanked STOP cassette and postnatal CreER induction removes the loxp-flanked STOP, thereby activating constitutive tdTomato expression. (c) Schematic showing that MGE-derived AACs migrate and populate all four pallial-derived brain structures depicted in color: medial pallium (red), dorsal pallium (green), lateral pallium (violet and blue), and ventral pallium (yellow and orange). (d) Representative midsagittal section showing AAC labeling in cerebral cortex, hippocampal formation (HPF), and olfactory centers such as piriform cortex (PIR) and anterior olfactory nucleus (AON). Note sparse labeling in lateral hypothalamus (LH) and striatum (str). (e-g) Representative coronal sections at specified anterior–posterior coordinates (from Bregma) showing dense AAC labeling in cerebral cortex (e–g), HPF (f, g), claustrum (CLA, e), endopiriform (EP, f, g), taenia tecta (TTd, e), lateral septum (LS, e), basolateral amygdala (BLA, f, g), cortical amygdala (COA, f, g), medial amygdala (MeA, f), and hypothalamus (HYP, g). Scale bars, 500 µm. Abbreviations for anatomical structures are listed in Supplementary file 1. All images showing Ai65-tdTomato were immunostained for signal amplification.
© 2017, Karger Publishers. Figure 1c is reproduced from Figure 5 (top-right panel) from Puelles, 2017, with permission from Karger Publishers. It is not covered by the CC-BY 4.0 license and further reproduction of this panel would need permission from the copyright holder.
Figure 1—figure supplement 1
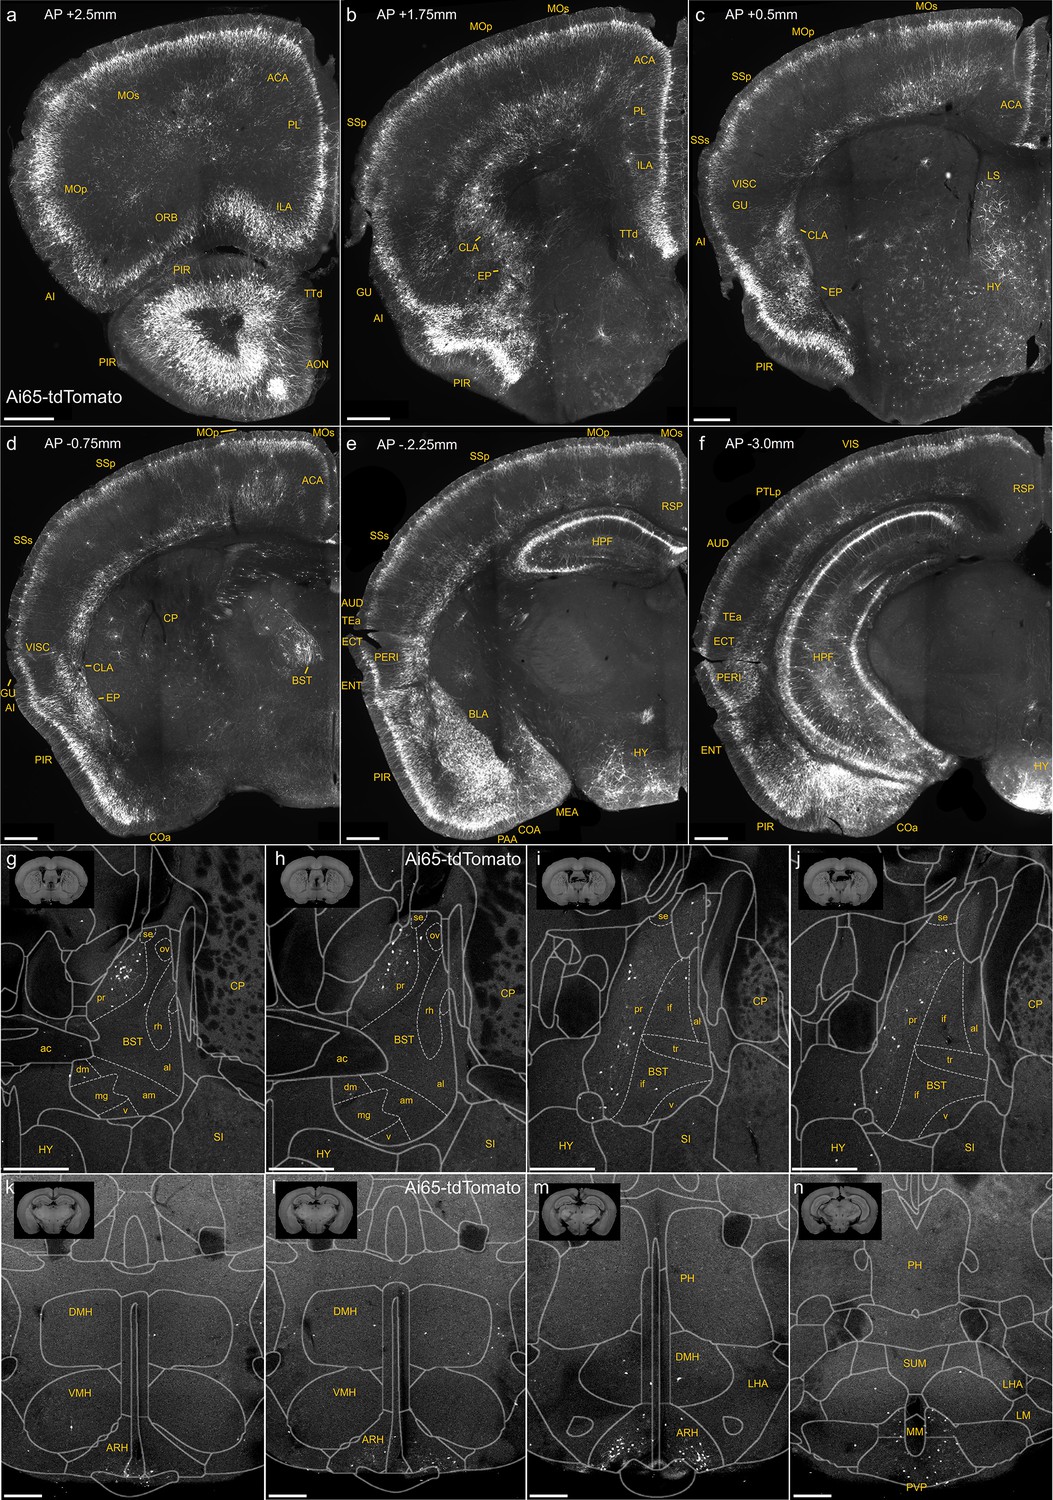
Dense labeling of axo-axonic cells (AACs) across brain regions in a Unc5bCreER; Nkx2.1Flp; Ai65 mouse.
(a–f) Additional representative coronal sections showing dense Ai65 expression patterns at specified anterior–posterior coordinates (from Bregma). Note labeling in cerebral cortex (a–f); hippocampus (e, f); olfactory centers, including piriform, anterior olfactory nucleus, and tenia tecta dorsal (PIR, AON, TTd) (a, b); agranular insula, claustrum, and endopiriform nucleus (AI, CLA, EP) (b, c); amygdaloid complex and extended amygdala (COA, basolateral amygdala [BLA], MeA) (d–f); Bed nuclei of the stria terminalis (BST) (d); and hypothalamus (HYP) (e, f). Ai65-labeled putative AACs (pAACs) in the bed nuclei of the stria terminalis (BST) are largely confined to the principal nucleus (BSTpr), with pAACs clustering more densely in anterior BSTpr (g, h) compared to more posterior segments (i, j). (k–n) Ai65-labeled pAACs in the hypothalamus are densest in the ventral-medially area of the arcuate nucleus (ARH), with highest density in caudal portions (k–m) and more posteriorly in the paraventricular hypothalamic nuclei (PVP) (n). pAACs are also present sparsely in the dorsal-medial nucleus of the hypothalamus (DMH) (k–m). Scale bars, 500 µm.
Figure 1—figure supplement 2
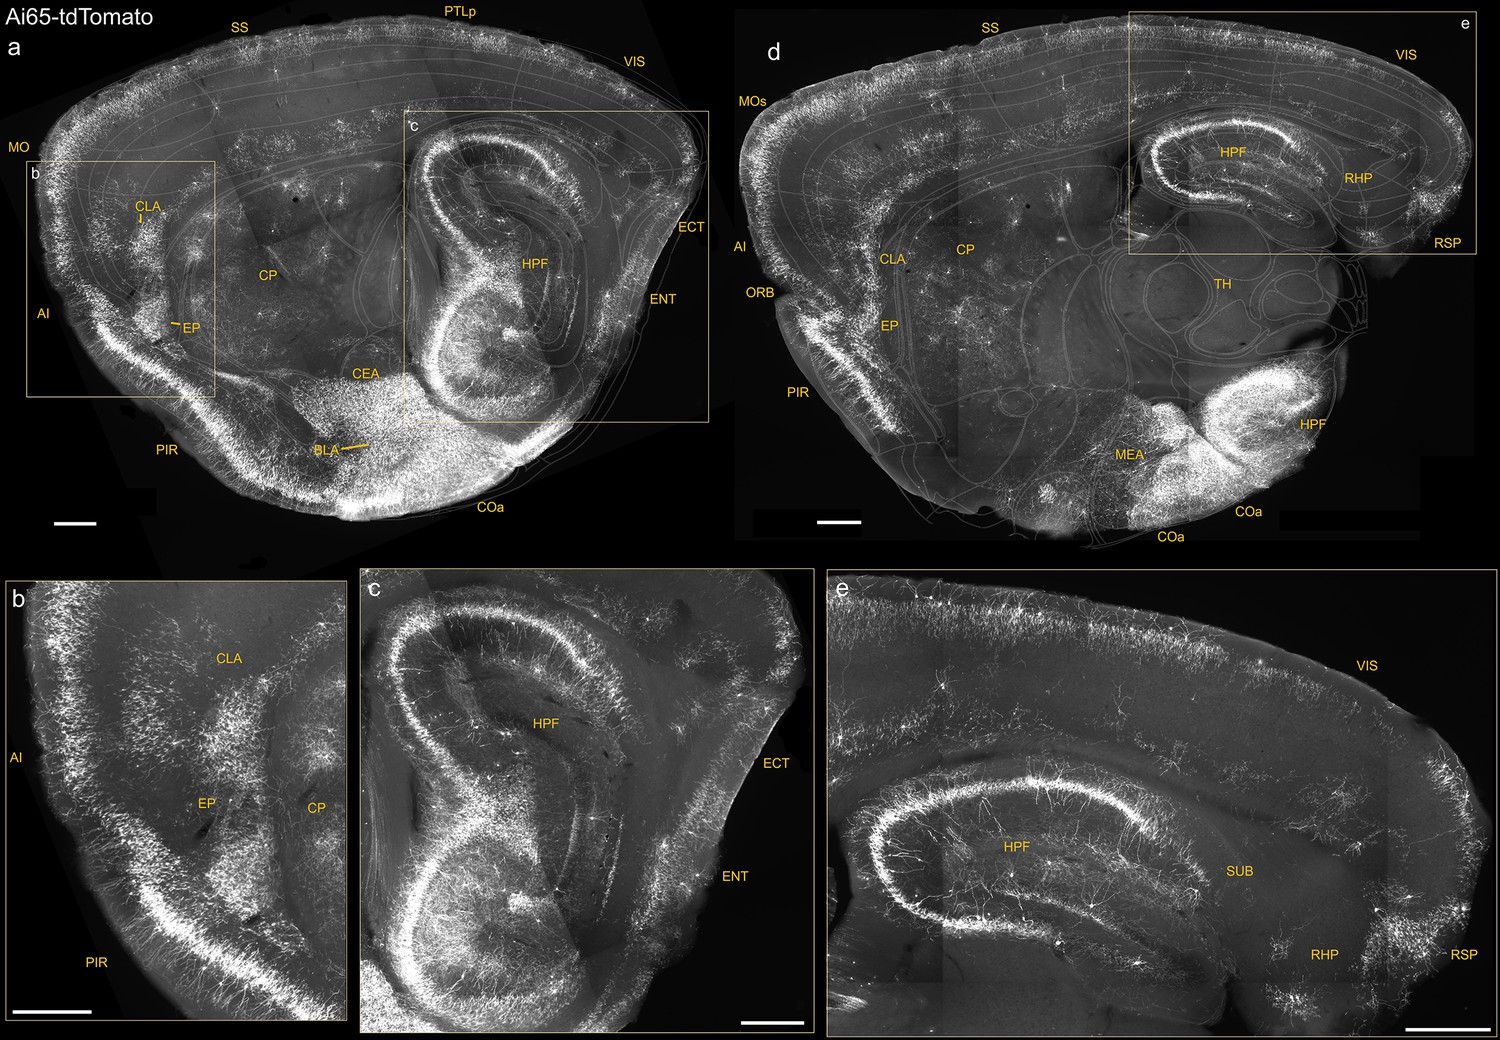
Additional sagittal sections of Unc5bCreER; Nkx2.1Flp; Ai65 mice highlighting dense putative AACs (pAACs) in medial, lateral, and ventral pallium-derived structures.
(a–c) A lateral sagittal section showing the lateral pallium (lPAL)-derived anterior insular (AI), claustrum (CLA), endopiriform (EP) (magnified in b), and medial pallium (mPAL)-derived hippocampal formation (magnified in c). Note the single-banded orientation of hippocampal (c) and insular (b) axo-axonic cells (AACs) that is absent in more inferior lPAL structures (b). A more medial sagittal section showing dorsal and ventral hippocampus and retrohippocampal region (RHP) (d), retrohippocampus, and visual and retrosplenial cortex (e). Compare the dual-banded AAC distribution in upper and deeper cortical layers to the single-banded pattern in hippocampus. Also note dense labeling in amygdaloid complex and extended amygdala (basolateral amygdala [BLA], cortical amygdala [COA], and MeA) (a, d). Scale bars, 500 µm.
Figure 1—figure supplement 3
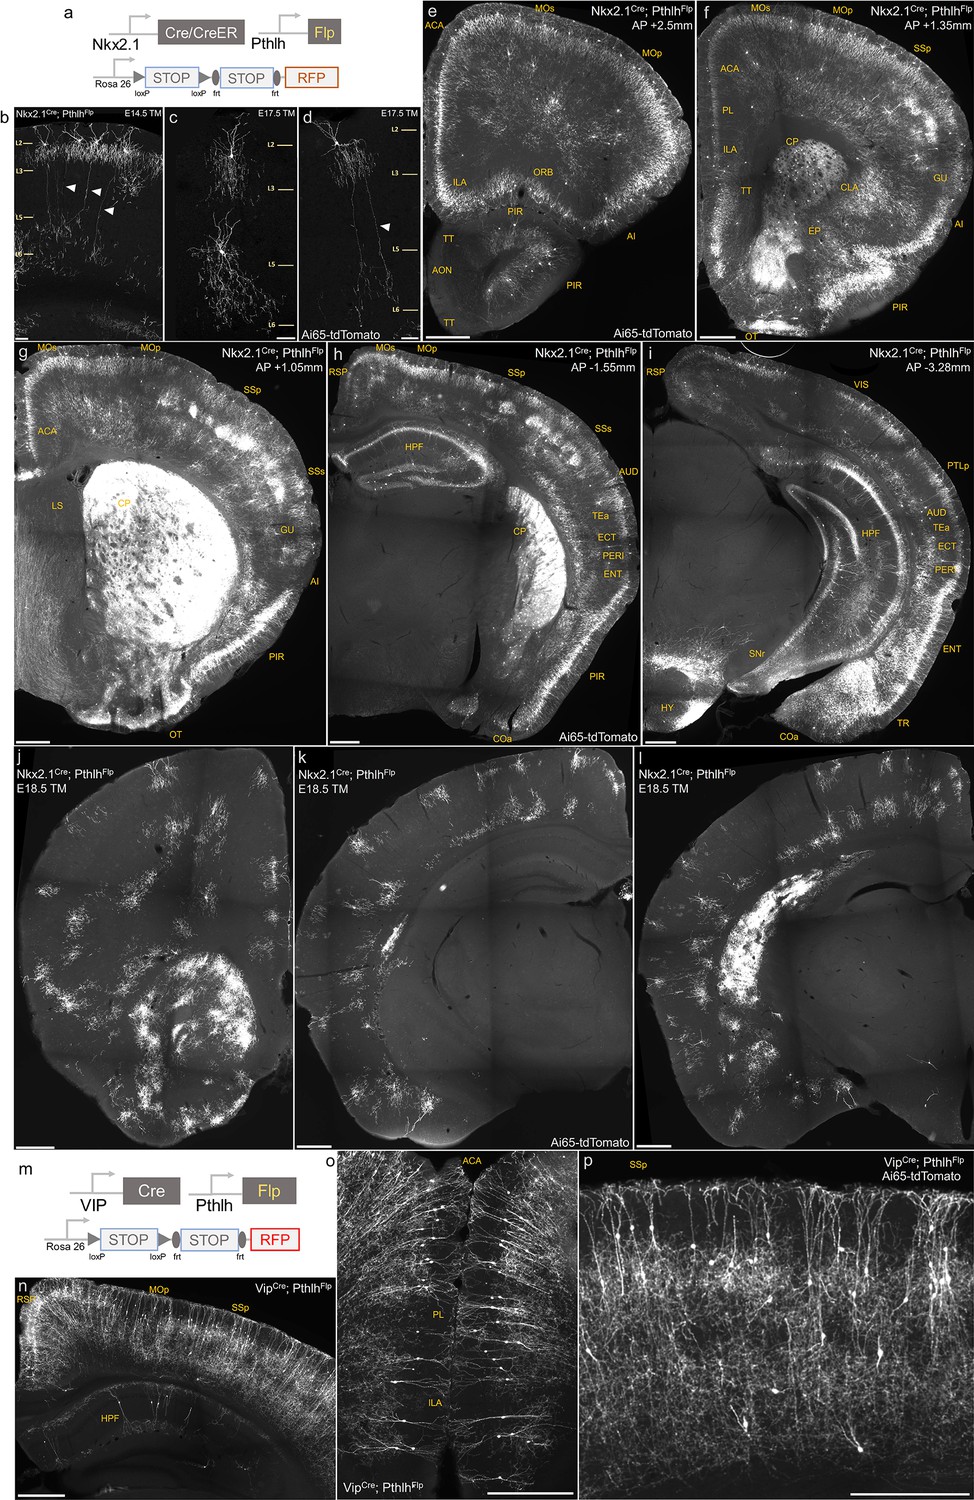
Intersectional targeting with PthlhFlp and Nkx2.1Cre, Nkx2.1CreER or VipCre to label specific subsets of axo-axonic cells (AACs).
(a) Schematic of intersectional strategy. (b–d) Tamoxifen induction of Nkx2.1CreER; PthlhFlp; Ai65 at E14.5 or E17.5 sparsely labels chandelier cells (ChCs) with diverse morphology in sensorimotor cortices. Arrowheads highlight a translaminar AAC type in layer 2, which extends axon arbors into deep layers. Scale bars, 65 µm. (e–i) Coronal hemisections from Nkx2.1Cre; PthlhFlp; Ai65 at specified anterior–posterior coordinates (mm from Bregma) showing pattern of dense labeling. Note labeling in cerebral cortex (e–i); hippocampus (h, i); olfactory centers, including piriform, anterior olfactory nucleus (AON), and tenia tecta dorsal (e–h); agranular insula, claustrum, and endopiriform nucleus (AI, CLA, EP) (f); amygdaloid complex and extended amygdala (COA, basolateral amygdala [BLA], MeA) (h, i); and hypothalamus (HYP) (i). Labeling by Nkx2.1Cre; PthlhFlp is sparser in AON and anterior TTd and absent in BST compared to Unc5bCreER; Nkx2.1Flp (Figure 1). Note non-AAC labeling of layer 4 interneurons in somatosensory cortex (g, h) and striatum CP (f–h). The absence of projection fibers in SNr (i) suggests these striatal cells are not medium spiny neurons and likely striatal interneurons. Scale bars, 500 µm. (j–l) Coronal hemisections from Nkx2.1CreER; PthlhFlp; Ai65 following a single tamoxifen dose at embryonic day 18.5 (E18.5) shows exclusive specificity for individual ChCs across neocortex. Scale bars, 500 µm. (m) Intersectional strategy of Pthlh and Vip using VipCre; PthlhFlp; Ai65 mice. (n–p) Dense labeling of cortical and hippocampal interneurons with predominantly bipolar morphology (putative interneuron-selective cells) in cortical layers II/III and deep layers. Scale bars, 500 µm.
Figure 2 with 1 supplement
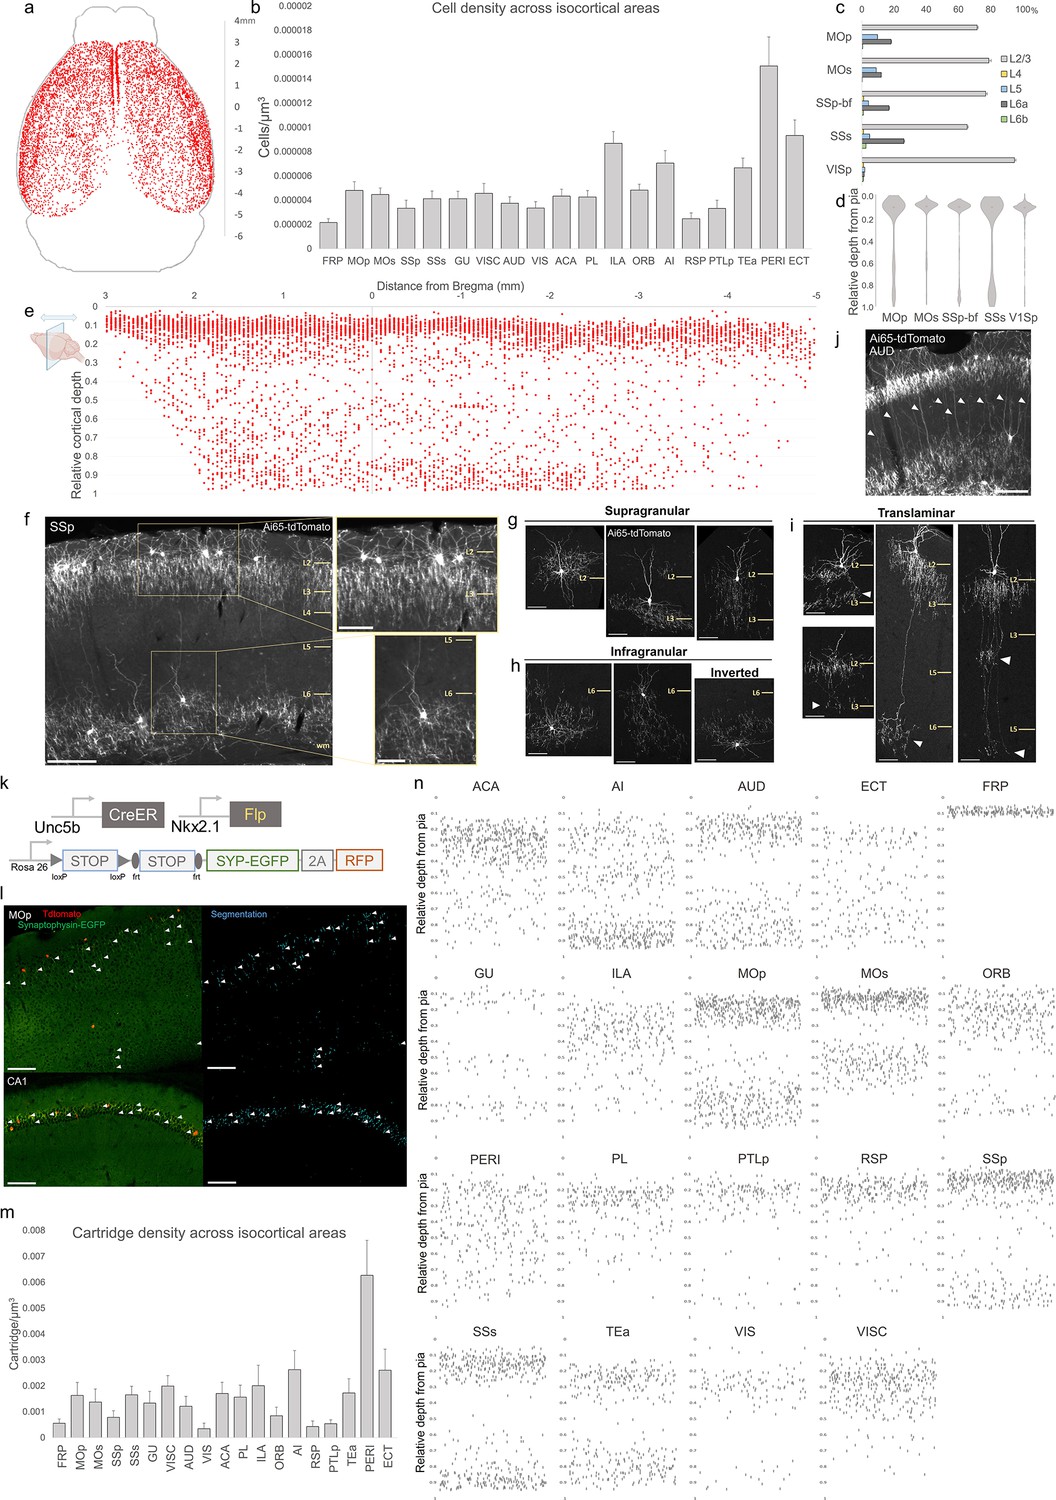
Characterization of chandelier cells (ChCs, i.e. cortical axo-axonic cells [AACs]) in cerebral cortex.
(a) Representative two-dimensional (2D) stereotactic plot of cortical ChC distribution in Unc5b; Nkx2.1. Dots represent individual red fluorescent (RFP) labeled cells. Anterior–posterior distance from Bregma (vertical scale on right). (b) Normalized ChC cell density (cells/um3) following registration to ARAv3 isocortical areas. For b and c, data are mean ± standard error of the mean (SEM). (c) Comparative bar plot showing relative proportion in each cortical layer in sensorimotor cortices. (d) Violin plots of ChC cell density proportion along pia-to-white matter cortical depth in each sensorimotor cortical area. Median is used for each violin plot. (e) Scatterplot of ChC distribution along pia-to-white matter depth (vertical axis) and anterior–posterior distance from Bregma (horizontal axis, in mm); red dots represent individual cells. While a vast majority (~80%) of ChCs occupy a band near the layer I/II border, ChCs in other layers account for ~20% of the total cortical population and vary in depth distribution by anterior–posterior cortical location. (f) Representative ChC laminar distribution pattern, showing largely separated supragranular (top inset) and infragranular (bottom inset) laminar subtypes. Scale bars, 200 µm and insets, 100 µm. (g–i) Multiple ChC laminar subtypes revealed by single-cell labeling using low-dose tamoxifen induction. These include supragranular subtypes (g), infragranular and inverted subtypes (h), and translaminar L2/3 subtypes that extend long vertical axons (white arrowheads) to deep layers (i). White arrowheads highlight axonal plexi distant from soma in translaminar types. Scale bars, 65 µm. (j) Example of regional ChC morphological diversity in auditory cortex, with relatively high proportion of translaminar subtypes. Scale bar, 200 µm. (k–n) ChC axon terminal (i.e. ‘cartridge’) labeling and mapping using intersectional synaptophysin-EGFP/cytoplasmic-tdtomato reporter mouse line. Diagram of intersectional genetic labeling of ChC cartridges (EGFP) and soma (tdTomato). Pixel classifier trained to segment EGFP-expressing ChC cartridges in cortex and CA1 hippocampus. Native EGFP fluorescence was imaged using serial two-photon (STP) microscopy. White arrowheads indicate detected EGFP-labeled cartridges. Scale bars, 100 µm. Density of ChC cartridges (cartridges/µm3) registered to ARAv3. Representative relative depth plots (from pia) of individual detected cartridges at a single AP coordinate for each cortical area. Refer to for ARAv3 area label abbreviations. Note reduced deep layer cartridges in FRP, RSP, and V1.
-
Figure 2—source data 1
Mean, SEM and raw depths for data points in Figure 2b-e, m.
- https://cdn.elifesciences.org/articles/93481/elife-93481-fig2-data1-v1.xlsx
Figure 2—figure supplement 1
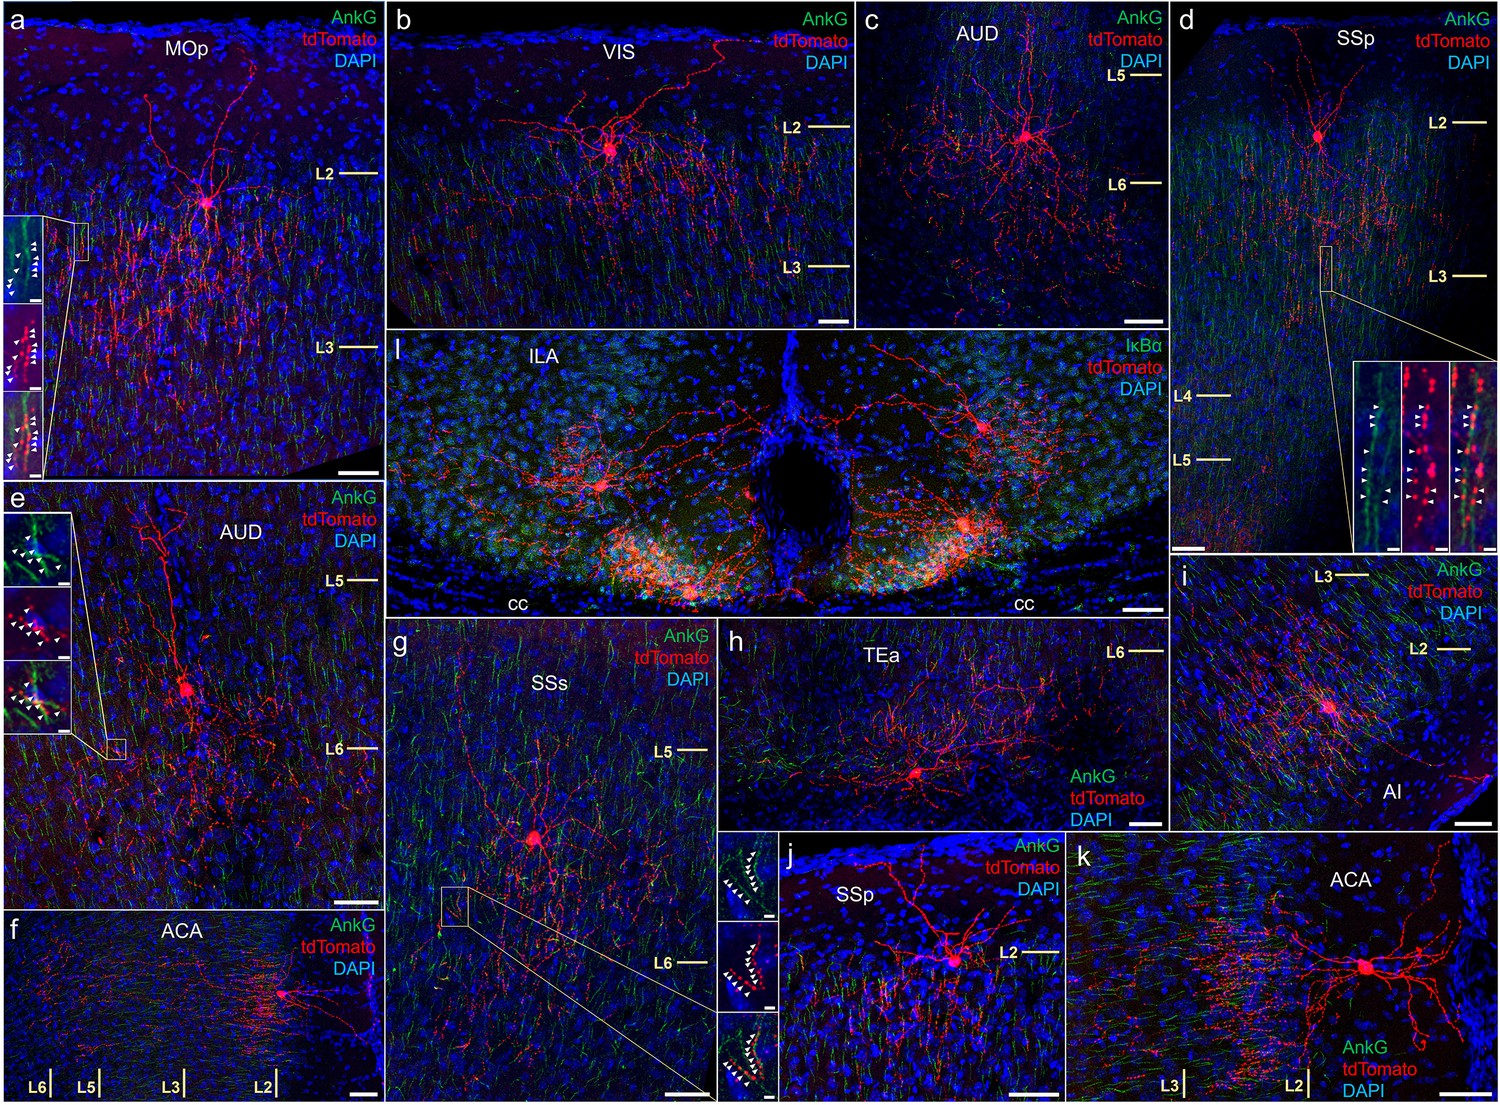
Anatomical diversity of chandelier cells (ChCs) across neocortical areas.
AnkyrinG or IκBα immunohistochemical labeling (green) of PyN axon initial segment (AIS) was used for validation of axo-axonic targeting. Examples are shown of characteristic upper L2 ChCs in motor (a), sensory (b, d, j), cingulate (f, k), and insular cortex (i). Examples of deeper L5 or L6 ChCs in somatosensory (c, e, g) and temporal association area (TEA) (h). Note the clustering of a distinct morphological subtypes in ventromedial infralimbic cortex (l). High-magnification inset (g): white arrowheads indicate segments of overlap between AnkG and RFP. Scale bars, 50 and 5 µm for high-magnification insets.
Figure 3
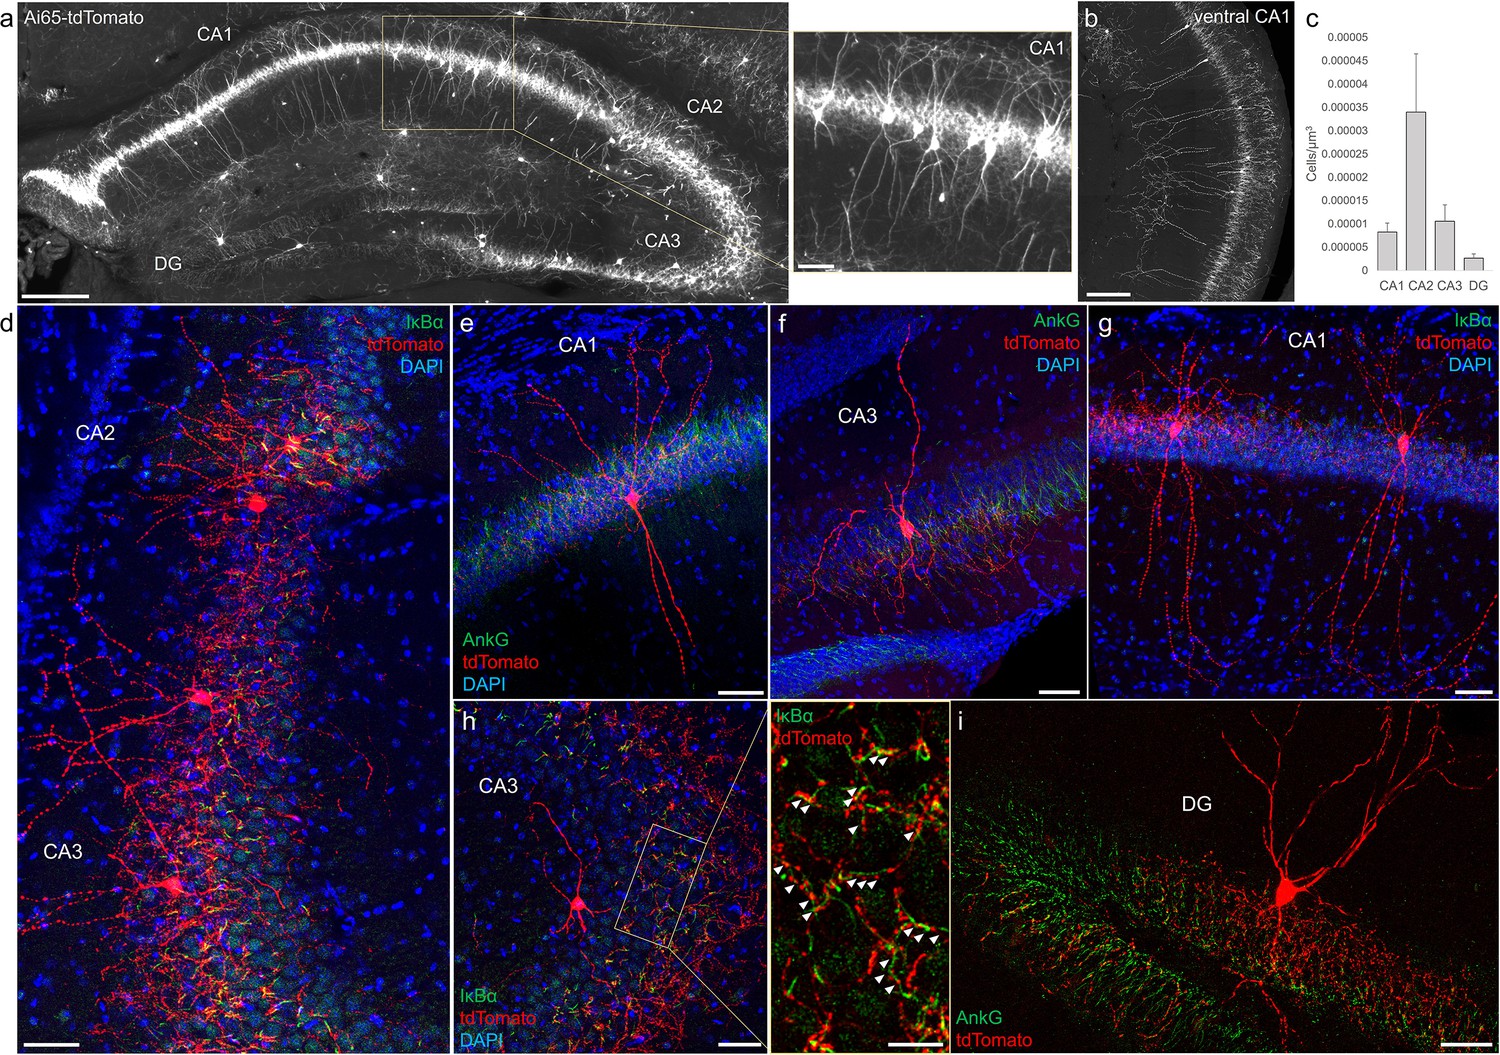
Distribution and validation of axo-axonic cells (AACs) in hippocampus.
(a) Population labeling of AACs throughout hippocampal compartments by Unc5b; Nkx2.1 intersection. Note the highly stereotyped banded distribution of AACs in CA1–CA3, with somata in the stratum pyramidale and vertically oriented dendrites extending basally to the stratum oriens and apically to the striatum lacunosum-moleculare. AACs are much sparser in dentate gyrus, with individual cells having elaborate and extended horizontal axon arbor. Scale bars, 200 and 50 µm for high-magnification inset. (b) AACs in ventral CA1 have overall similar morphology as in dorsal CA1, though with longer basal–apical dendrites matching the ventral CA1 anatomy. (c) Normalized AAC cell density (cells/µm3) across hippocampal compartments. CA2 has 3- to 4-fold higher AAC cell density compared to CA1 and CA3 and 12-fold higher compared to DG. (d–i) Immunohistochemistry validation with the axon initial segment (AIS) markers AnkG or IκBα (green) and sparse-labeled RFP cells confirm axo-axonic targeting by the intersectional strategy. Examples of hippocampal AACs in CA1 (e, g), CA2 (d) and CA3 (d, f, h). In contrast, AACs in DG have much wider axon arbor in the stratum granulosum, potentially innervating many more granule cell AIS compared to in other hippocampal compartments (i). High-magnification inset: white arrowheads indicate segments of IκBα and RFP apposition. Scale bars, 50 and 20 µm for high-magnification inset. For b, data are mean ± standard error of the mean (SEM).
-
Figure 3—source data 1
Mean and SEM for data points in Figure 3c.
- https://cdn.elifesciences.org/articles/93481/elife-93481-fig3-data1-v1.xlsx
Figure 4
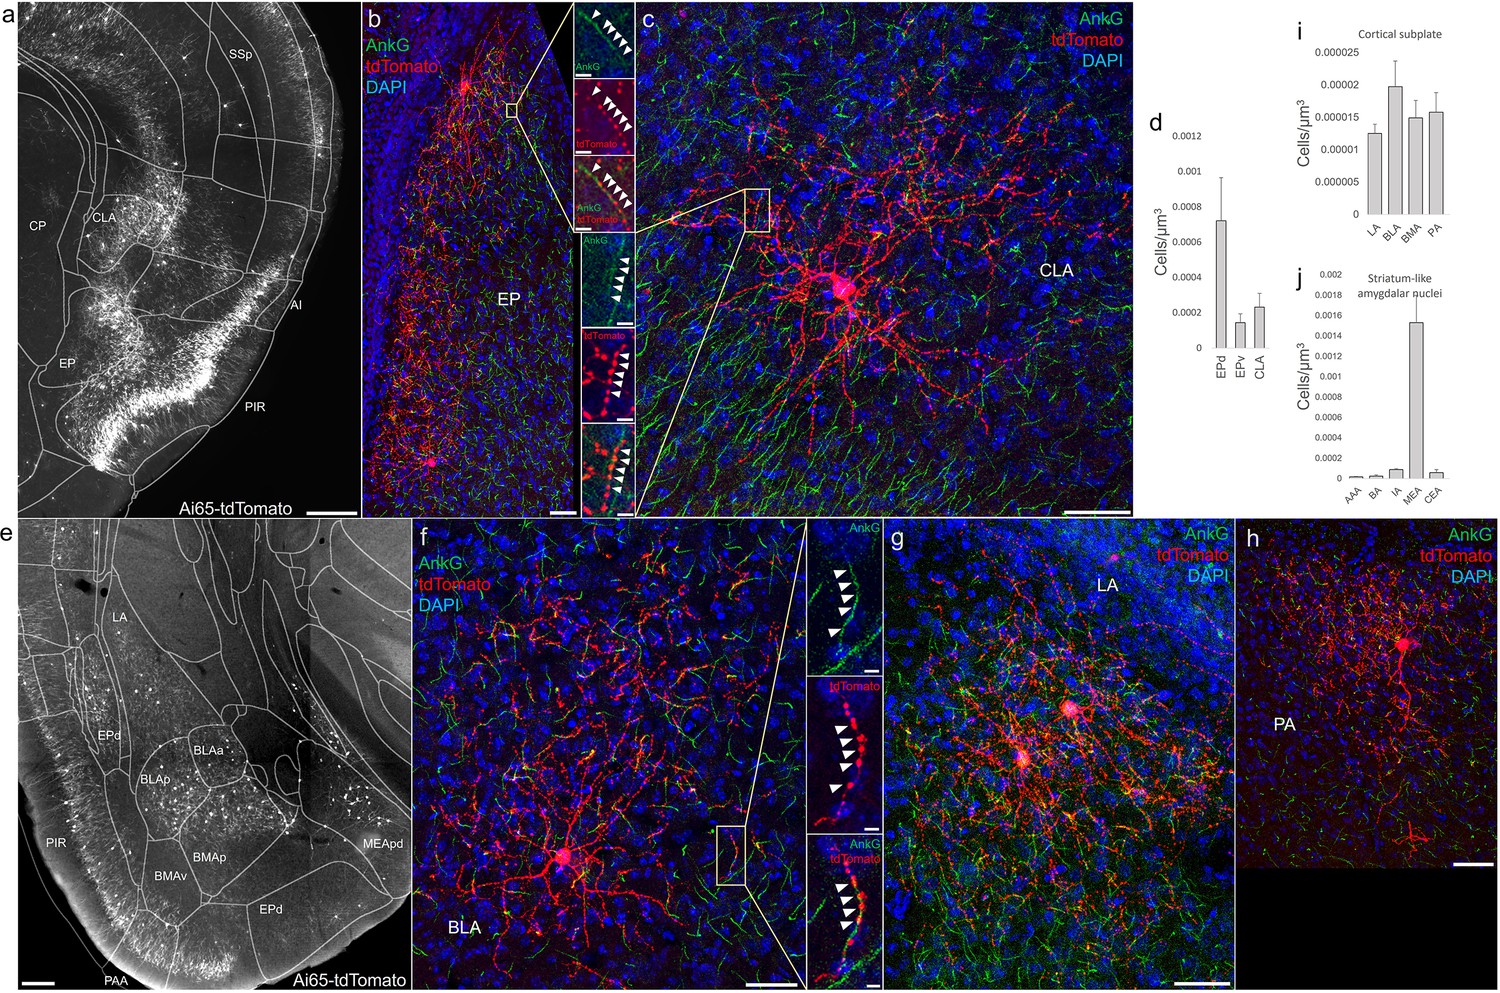
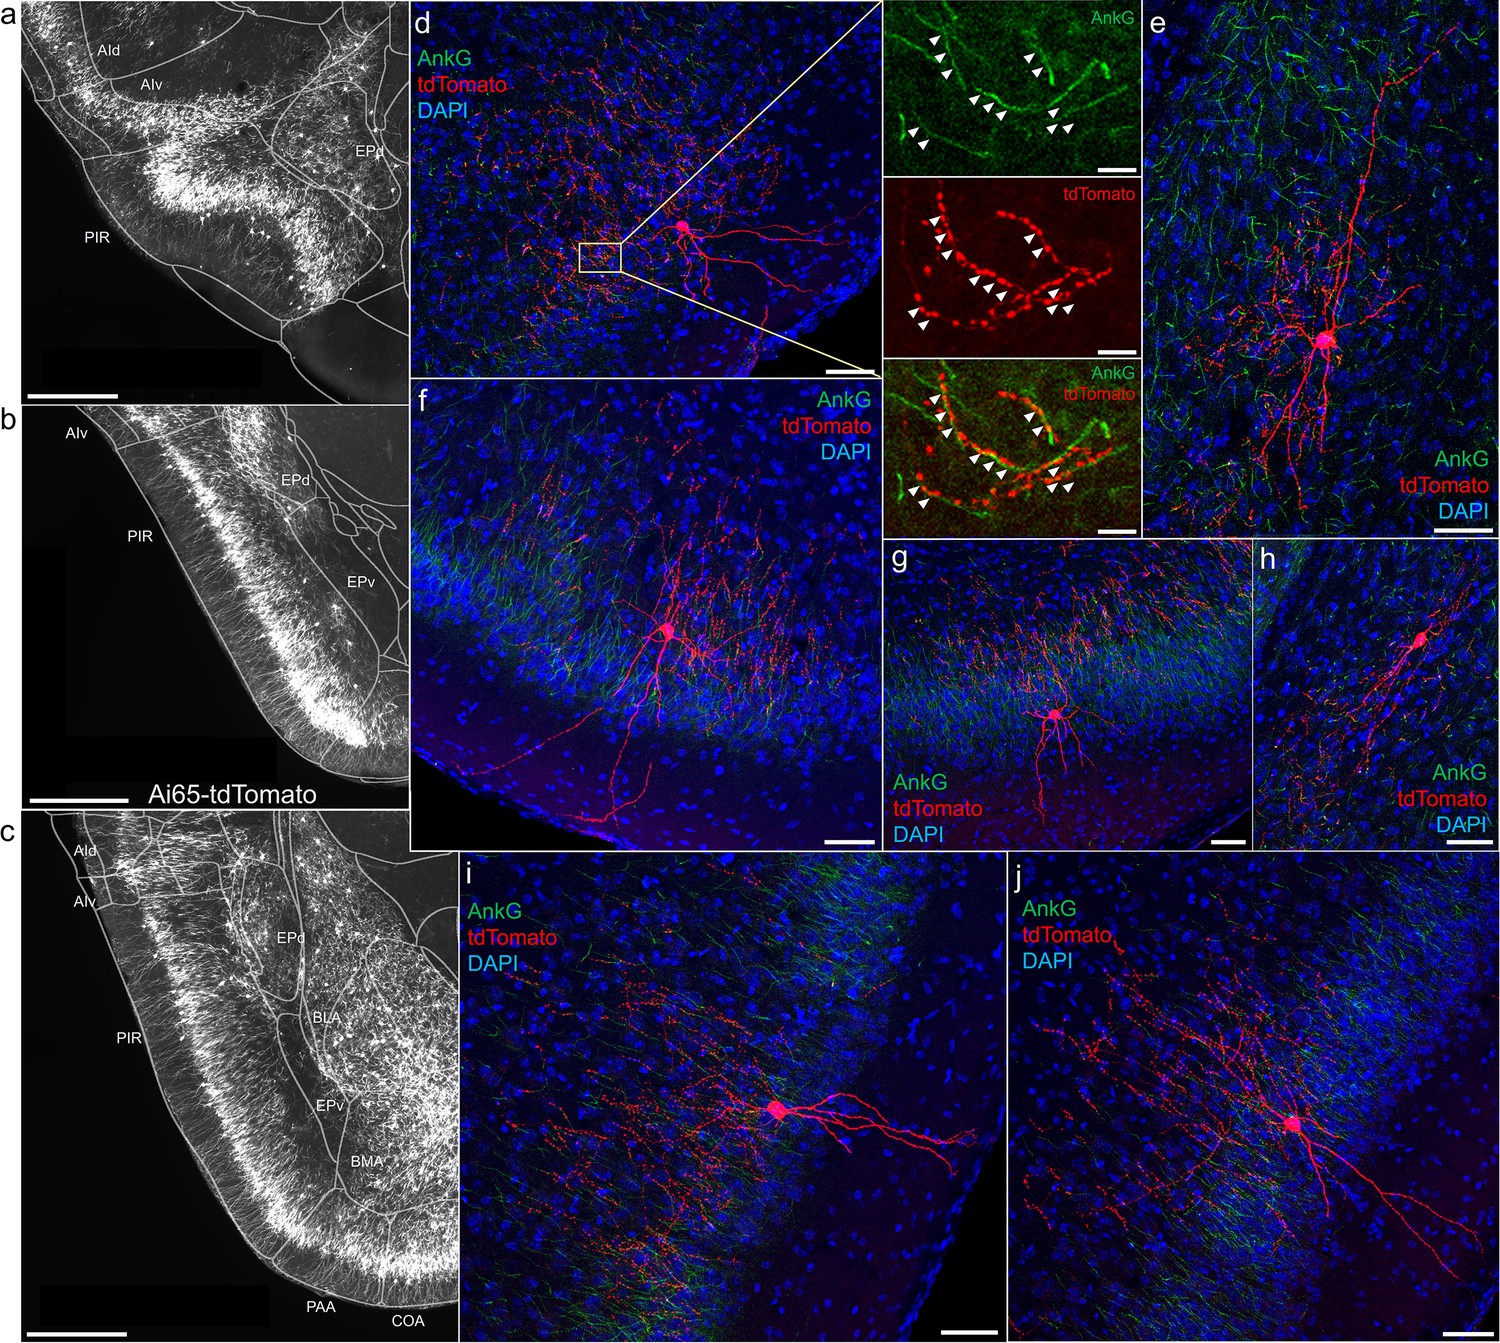
Distribution of axo-axonic cells (AACs) across lateral pallium (lPAL)- and ventral pallium (vPAL)-derived structures.
(a) Dense-labeled RFP cells in claustrum, endopiriform nucleus, and insula. Note AACs in insula follow the banded laminar pattern of AACs similar to cortical upper layers and piriform, while those in claustrum and endopiriform are more dispersed in distribution. Sparse labeling of single-cell morphologies in endopiriform nucleus (b) and claustrum (c) showing elaborate dendritic and axonal branching structure. High-magnification insets: white arrowheads indicate segments of AnkG and RFP apposition. Scale bars, 50 and 5 µm for single-cell examples and insets, respectively. (d) Normalized AAC cell density (cells/µm3) across lateral pallial structures. pAACs are approximately fivefold more prevalent in dorsal EP compared to ventral EP. Data are mean ± standard error of the mean (SEM). (e) Dense labeling throughout vPall-derived amygdalar nuclei and piriform cortex. Note there is a degree of compartmentalization, with fewer cells in the ventral-most portions of EPd and the ventral basomedial amygdala (BMA). The laminar pattern of AAC distribution in piriform and Piriform-amygdalar area (PAA) is similar to other three-layered allocortices. (f–h) Immunohistochemistry of single-cell labeling shows the multipolar morphologies characteristic of amygdalar AACs. High-magnification inset: white arrowheads indicate segments of AnkG and RFP apposition. Scale bars, 500 µm for grayscale panels, 50 and 5 µm for single-cell examples and insets. Normalized AAC cell density (cells/µm3) across cortical subplate (i) and striatum-like (j) amygdala. Data are mean ± standard error of the mean (SEM). All images showing Ai65-tdTomato were immunostained for signal amplification, except for a and e which were native fluorescence.
-
Figure 4—source data 1
Mean and SEM for data points in Figure 4d, i, j.
- https://cdn.elifesciences.org/articles/93481/elife-93481-fig4-data1-v1.xlsx
Figure 5
Axo-axonic cells (AACs) in piriform cortex.
(a–c) Dense AAC labeling in piriform cortex, organized from anterior (a) to posterior (c) and overlaid with ARAv3 area outlines. Note the highly laminar distribution patterns. (d-j). Examples of single piriform AACs co-stained with AnkG (green). Note the relatively similar morphologies with only a few apical dendrites extending to the pial surface (d-g, i-j). An example of a deeper layer AAC at the border of piriform and EPv (h). White arrowheads in high-magnification insets indicate segments of overlap for RFP-labeled AAC and AnkG-labeled axon initial segment (AIS). Scale bars, 500 µm for grayscale images, 50 µm for confocal, 10 µm for high-magnification insets.
Figure 6
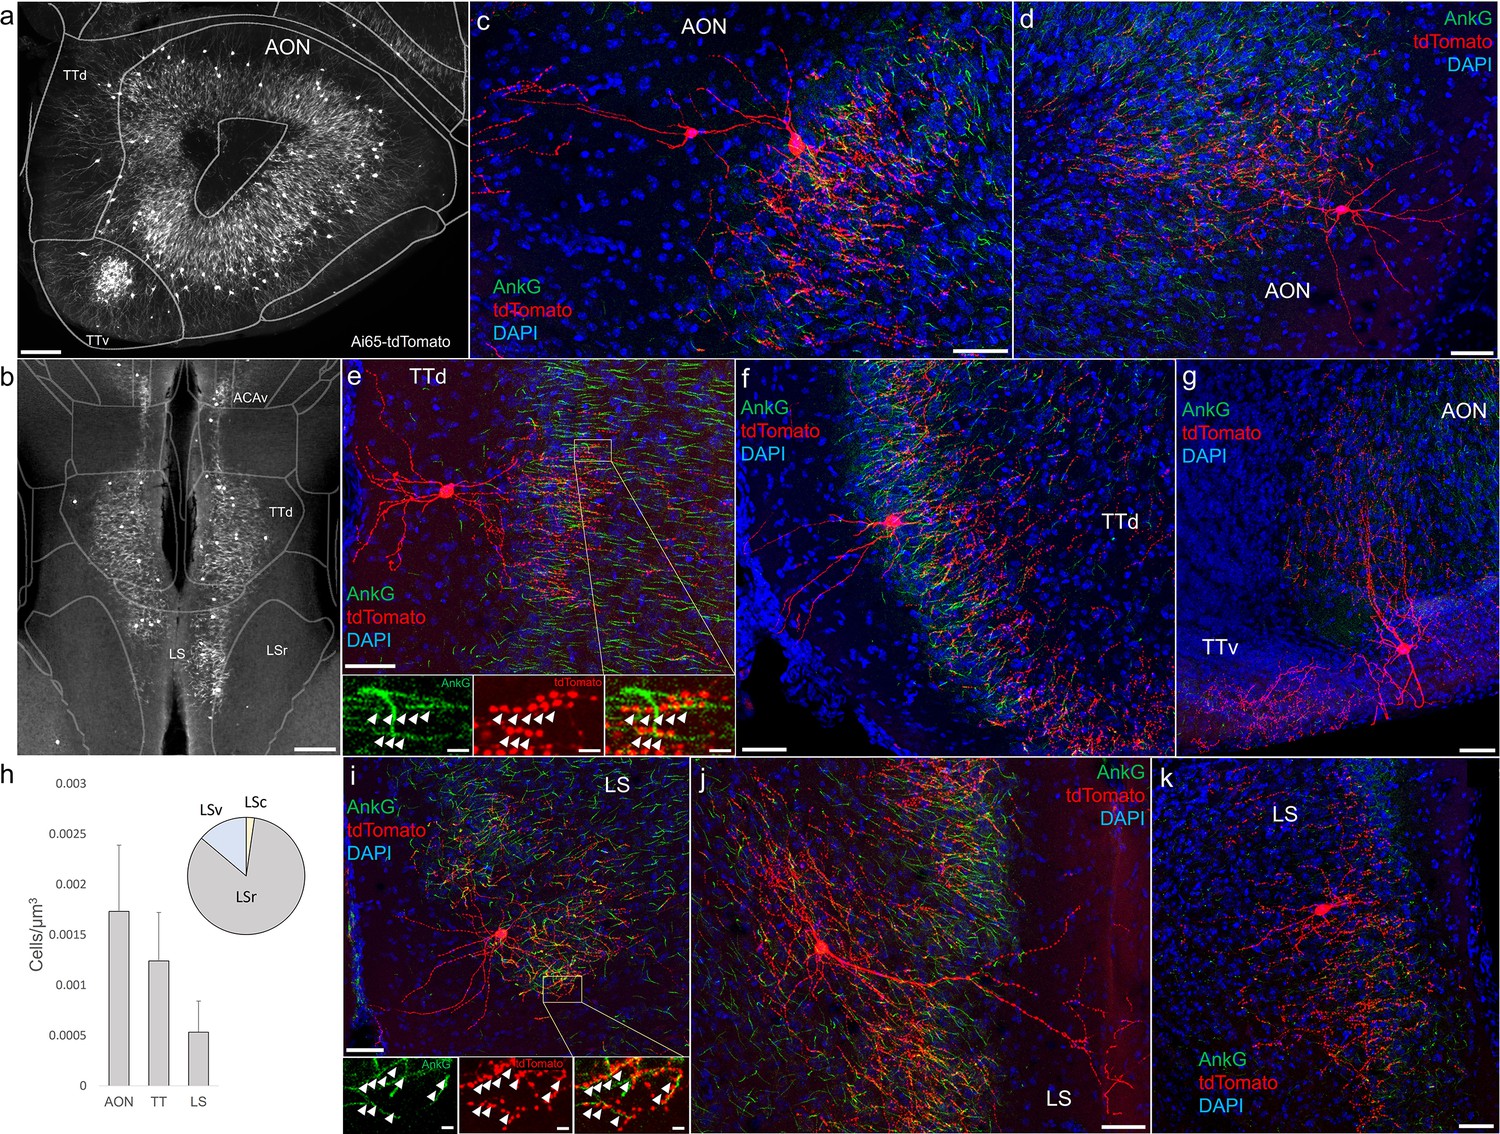
Identification and distribution of novel axo-axonic cell (AAC) subpopulations in anterior olfactory nucleus (AON), taenia tecta (TT), and septum.
Dense population labeling in anterior AON and TT (a) and more posterior sections containing the TT and LS (b). Anteriorly, AACs are more concentrated in ventral TT while posteriorly in dorsal TT. Within LS, AACs tend to occupy the medial most portions along the midline. (c–g, i–k) Single-cell (confocal) labeling of AACs in AON (c, d), TT (e–g), and lateral septum (i–k). Note that despite areal variations, individual AACs preserve their stereotyped morphological characteristics (apical-oriented dendrite and basal-oriented axon arbor) that conform to laminar patterns of targets in each anatomical area. High-magnification insets: white arrowheads indicate segments of AnkG and RFP apposition. Scale bars, 200 µm for grayscale panels, 50 and 5 µm for single-cell examples and insets. (h) Normalized cell density (cells/µm3) for AACs in AON, TT, and lateral septum. Within lateral septum, the majority of AACs are located in rostral compartments (LSr). Data are mean ± standard error of the mean (SEM).
-
Figure 6—source data 1
Mean, SEM and percentages for data points in Figure 6h.
- https://cdn.elifesciences.org/articles/93481/elife-93481-fig6-data1-v1.xlsx
Figure 7 with 1 supplement
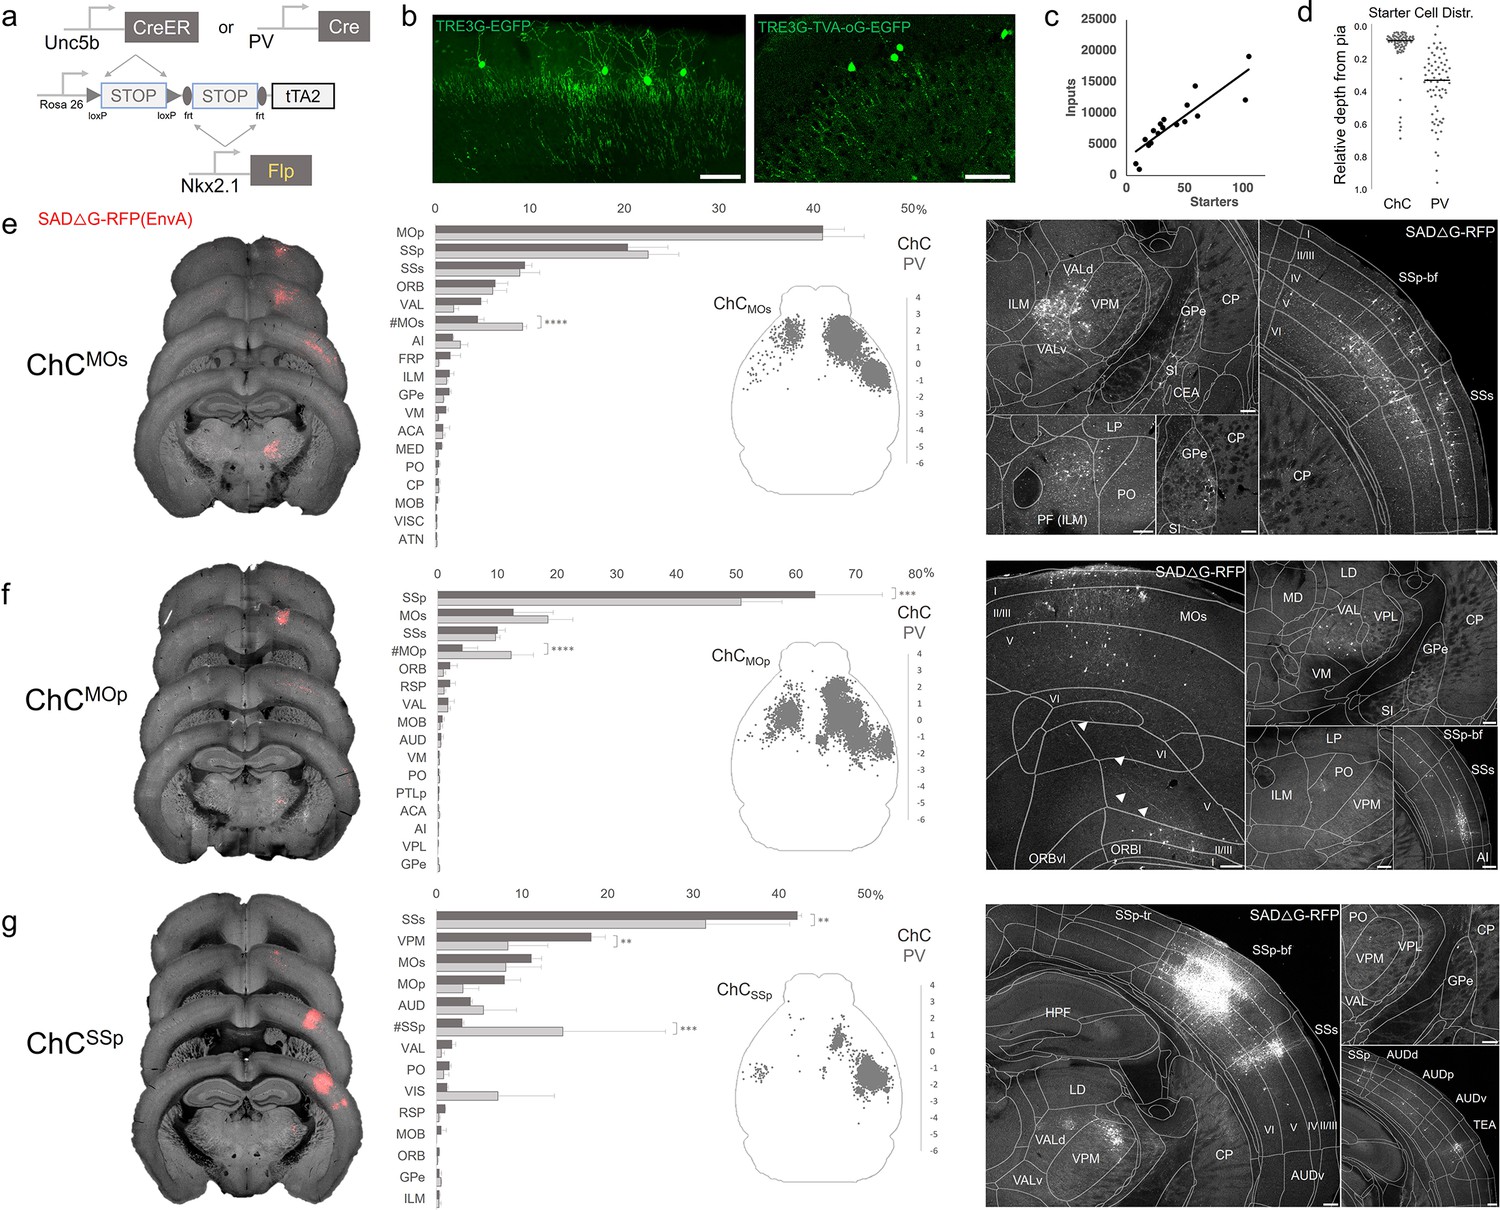
Intersectional tTA2 conversion enables viral access and input tracing to chandelier cells (ChCs) in sensorimotor cortices.
(a) Schematic of intersectional tTA2-conversion strategy. Expression of Nkx2.1Flp and subsequent Unc5bCreER or PvalbCre results in activation of tTA2 expression in axo-axonic cells (AACs). This provides a genetic handle for versatile viral targeting and manipulation. (b) Cortical injection of TRE3G-promoter AAV vectors enables specific targeting of ChCs (green, left). A similar backbone was used to construct a TRE3G rabies starter AAV for monosynaptic input tracing, which contains both TVA and optimized rabies glycoprotein (right). Compared to TRE3G-EGFP, the TRE3G starter AAV has weaker EGFP labeling of neurites. Scale bar, 200 µm. (c) Linear regression fit of inputs cells/starter cells. Each point represents one animal, n = 18, r = 0.8874, slope = 135.51. (d) Relative pia-to-white matter depth distribution of starter cells (expressing both AAV starter and rabies). ChC starter cell tended to cluster closer to the pia while Pvalb cells were more broadly distributed throughout the cortical upper layers, reflecting the differences in the distribution of the two subtypes. (e–g) Synaptic input source to ChCs in primary motor area (MOp), secondary motor area (MOs) and primary somatosensory area (SSp), with Pvalb cells as comparison. Only long-range inputs (i.e. outside the ARAv3 area injected) are plotted. Left: Representative coronal sections from three indicated cortical areas overlaid with macroscale view of rabies tract labeling (in red, gray is autofluorescence) to each subpopulation of ChC. Middle: Histogram comparing percentage of inputs from each structure innervating the indicated cortical subpopulation of ChCs (dark gray) and Pvalb (light gray), sorted from largest input source to smallest. Inset: Representative top–down map of all inputs to AACs from a single animal. Right: Representative sections highlighting select sources of rabies-labeled inputs to each ChC population, overlaid with ARAv3 boundaries. Scale bars, 200 µm. For e–g, data are mean ± standard error of the mean (SEM), **p < 0.01, ***p < 0.001, ****p < 0.0001 indicates p ≥ 0.05 (two-way analysis of variance [ANOVA] with post hoc Bonferroni correction); for scatterplot in d, median is plotted. Homotypic projections to injection site from contralateral hemisphere are denoted by (#). All images showing EGFP were immunostained for signal amplification, while rabies-RFP shown in e–g were native fluorescence. For each MOs, MOp, and SSp, N = 6 mice for (3 Unc5b; Nkx2.1, 3 Pvalb; Nkx2.1; total N = 18 mice).
-
Figure 7—source data 1
Number of input cells, depth, mean, SEM and associated statistics for data points in Figure 7c-g.
- https://cdn.elifesciences.org/articles/93481/elife-93481-fig7-data1-v1.xlsx
Figure 7—figure supplement 1
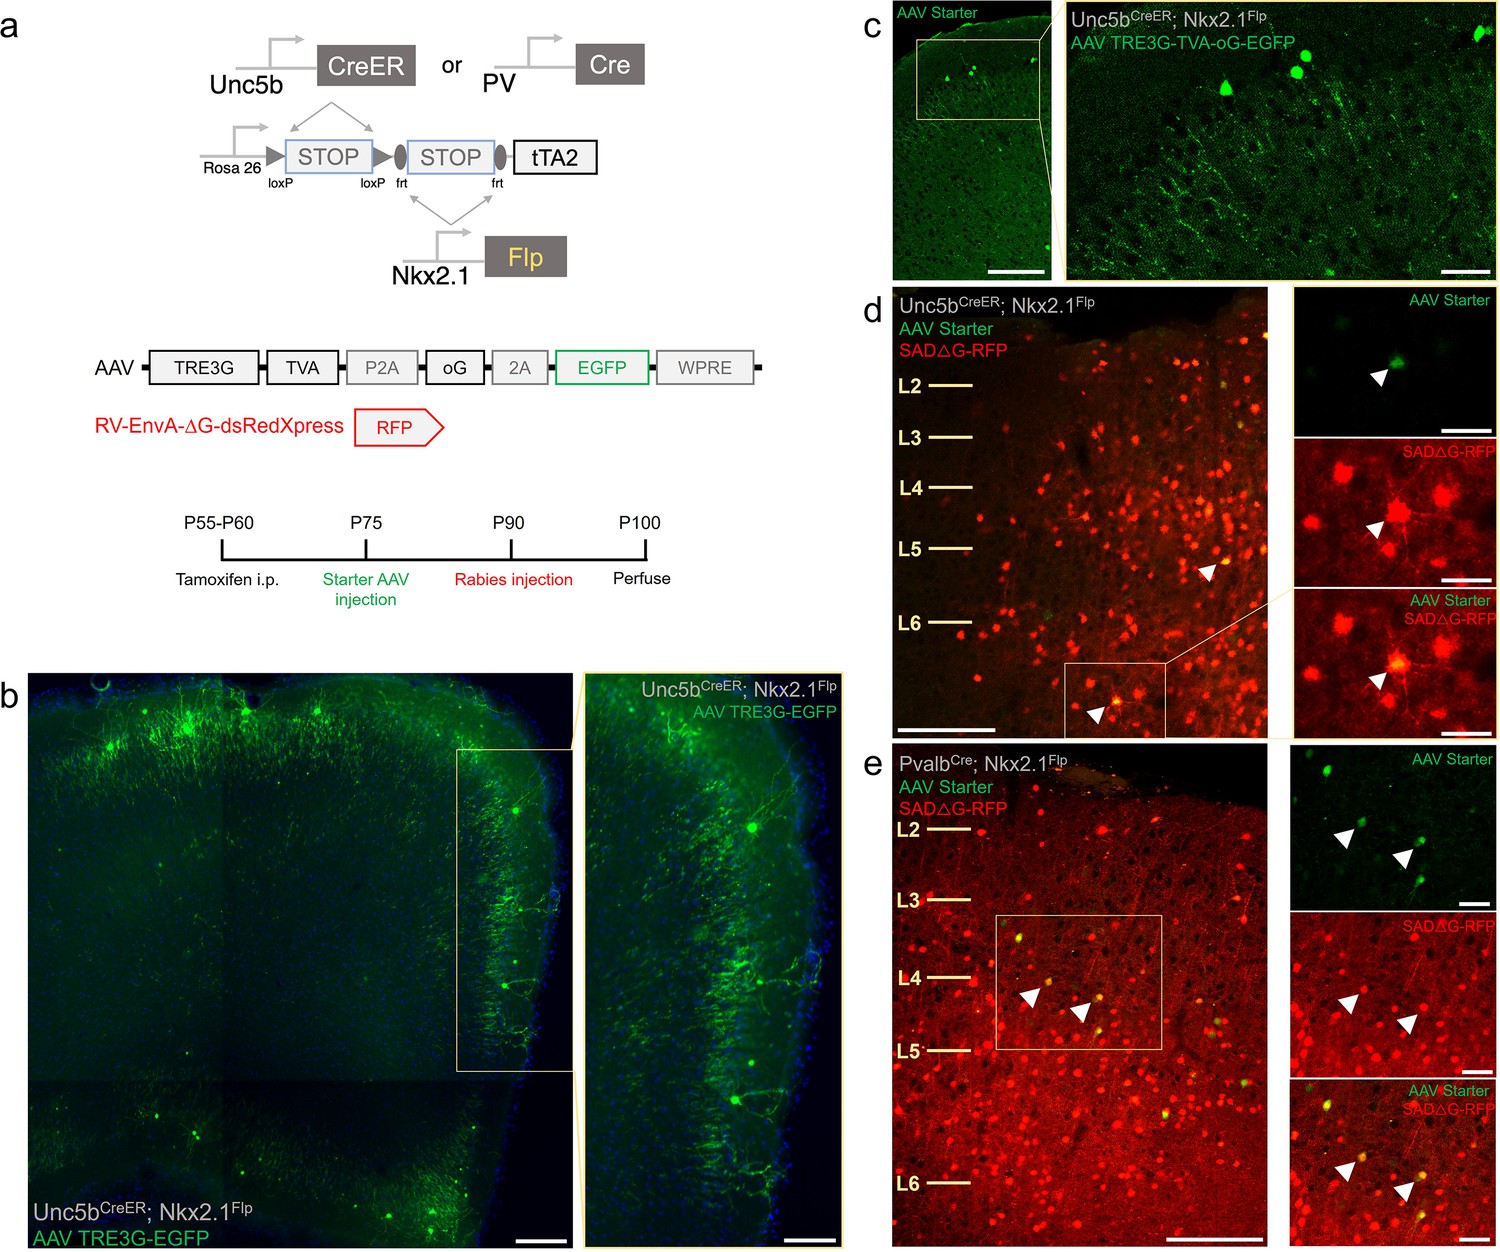
Intersectional tTA2 conversion enables viral access and input tracing to chandelier cells (ChCs) and Pvalb cells.
(a) Schematic and procedure for synaptic input tracing from ChC and Pvalb interneurons. Top, driver and reporter lines to achieve tTA expression in ChC or Pvalb cells. Middle, schematic of AAV and EnvA pseudo-typed rabies viral vectors. Bottom, timeline of tamoxifen and viral vector for retrograde synaptic tracing. (b) Bulk injection of TRE3G-EGFP in Unc5bCreER; Nkx2.1Flp; LSL-FSF-tTA2 results in efficient and specific labeling of ChCs, identifiable by laminar position and morphological features (inset). Scale bars, 200 and 100 µm for high-magnification inset. (c) Starter AAV expression is comparable to TRE3G-EGFP with high specificity for ChCs in Unc5b; Nkx2.1, albeit with weaker EGFP neurite expression. Scale bars, 100 and 20 µm for high-magnification insets. Example of starter cells (arrowheads) co-expressing EGFP (AAV vector) and RFP (rabies vector) in Unc5b/Nkx2.1 (d) and Pvalb/Nkx2.1 (e) intersections. Scale bars, 100 and 20 µm for high-magnification insets. All images showing EGFP were immunostained for signal amplification, while rabies-RFP shown in d and e were native fluorescence.
Figure 8
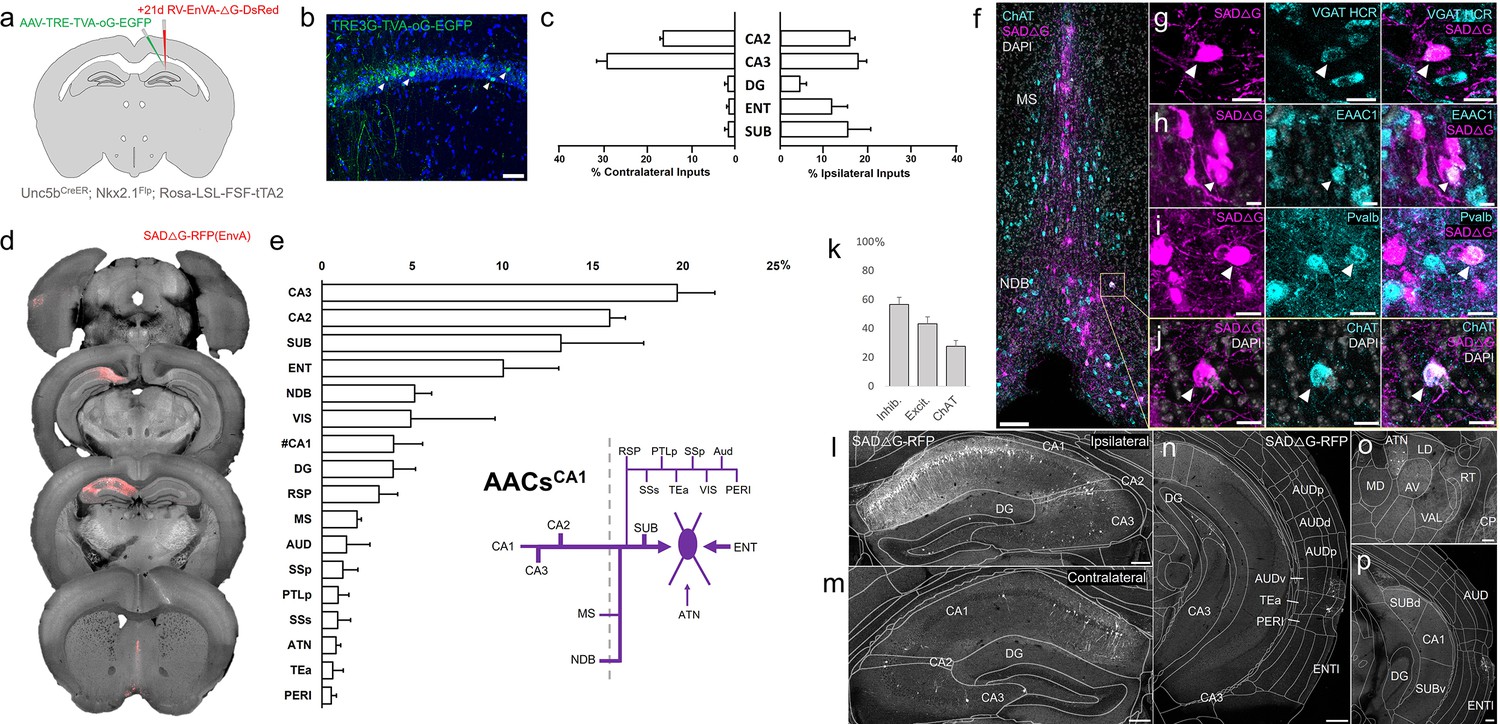
Monosynaptic input tracing to AACsCA1 of hippocampus.
(a) Schematic of retrograde synaptic tracing from CA1 axo-axonic cells (AACs) with site of viral injection. (b) Starter AAV expression in CA1 (green). White arrowheads show soma position is largely confined to the pyramidal cell layer. Scale bar, 50 µm. (c) Comparative input distribution from ipsilateral (right) and contralateral (left) hippocampal compartments. (d) Mesoscale rabies labeling of presynaptic input cells (red) to AACsCA1 (e) Histogram of percentage of total inputs from each structure, sorted from largest to smallest. Inset: Summary schematic of input sources to AACsCA1. AACsCA1 receive strong innervation from entorhinal, subiculum, and contralateral hippocampus, with more minor innervation from thalamus, medial septum (MS), diagonal band nucleus, and various cortical areas. (f–j) Immunohistochemistry and hybridization chain reaction-fluorescence in situ hybridization (HCR RNA-FISH) marker analysis of input cells in MS and nucleus of the diagonal band (NDB), indicated by color-coded labels. Examples of co-labeled cells are shown following HCR RNA-FISH for the inhibitory marker vGAT (g) and immunohistochemistry for the excitatory marker EAAC1 (h), Pvalb (i) and ChAT (j). White arrowheads indicate co-labeled cells for each marker. Scale bars, 50 and 20 µm for high-magnification insets. (k) Quantification of marker colocalization with rabies labeling in MS and NDB. (l–p) Representative coronal sections highlighting select sources of rabies-labeled inputs to AACsCA1, overlaid with ARAv3 atlas boundaries. Inputs within hippocampus were mostly from within CA1 both ipsilateral (l) and contralateral (m) to the injection site. Input cells were also found in adjacent cortical areas more posterior such as entorhinal cortex (ENT), auditory cortex (AUD), and temporal association area (TEa) (n–p). Thalamic inputs were largely confined to the anterior group of the dorsal thalamus (ATN) (o). Scale bars, 200 µm. For c, e, and k, data are mean ± standard error of the mean (SEM) from N = 4 mice. Homotypic projections to injection site from contralateral hemisphere are denoted by (#CA1) in e. EGFP in b and rabies-RFP in f–j were immunostained for signal amplification, while rabies-RFP shown in l–p were native fluorescence.
-
Figure 8—source data 1
Mean and SEM for data points in (Figure 8c, e, k).
- https://cdn.elifesciences.org/articles/93481/elife-93481-fig8-data1-v1.xlsx
Figure 9
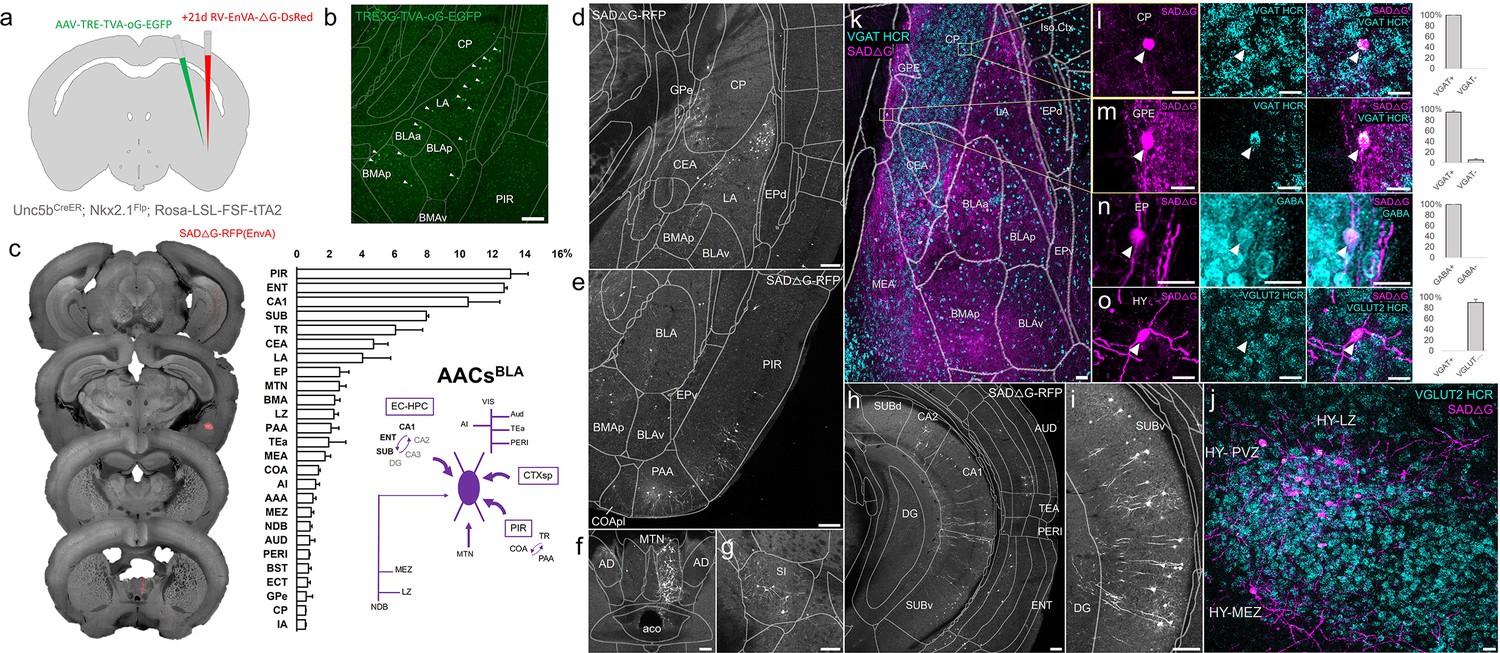
Monosynaptic input tracing to AACsBLA.
(a) Schematic of retrograde synaptic tracing from basolateral amygdala (BLA) axo-axonic cells (AACs) with site of viral injection. (b) Starter AAV distribution as indicated by white arrowheads, overlaid with ARAv3 atlas. Scale bar, 200 µm. (c) Left: Mesoscale rabies labeling of presynaptic input cells (red) to AACsBLA. Right: Histogram of percentage of total inputs from each structure, sorted form largest to smallest. Inset: Summary schematic synaptic input source to AACsBLA. AACsBLA are innervated by diverse sets of inputs, with strongest innervation from entorhinal cortical–hippocampal network (EC-HPC), piriform areas (PIR), cortical subplate (CTXsp), and minor subcortical and cortical inputs. (d–j) Representative coronal sections of rabies-labeled inputs (gray) across input structures, overlaid with ARAv3 boundaries. Scale bars, 200 µm. Inputs to AACsBLA were found in amygdalar and cortical-amygdalar areas (d, e), piriform (e), midline group of the dorsal thalamus (f), substantia innominata (g), posterior hippocampus and cortex (h), and the ventral subiculum (i). Examples of dense input cells in medial (MEZ) and lateral (LZ) hypothalamus overlaid with excitatory vGLUT2 HCR RNA-FISH (j). (k–o) Immunohistochemistry and RNA-FISH marker analysis of input cells in striatum/CP, GPe, EP, and hypothalamus. VGAT FISH or GABA IHC were used for identifying GABAergic input cells (l–n) while VGLUT2 FISH was used an excitatory marker (o) as indicated. White arrowheads indicate co-labeled cells. Scale bars, 50 and 20 µm for high-magnification insets. Right: Quantification of marker colocalization with rabies labeling for each corresponding area. Inputs to AACsBLA from CP, GPe, and EP were inhibitory, while inputs from hypothalamus were excitatory. Data are mean ± standard error of the mean (SEM) from N = 3 mice. Rabies-RFP in j–o were immunostained for signal amplification, while EGFP in b and rabies-RFP shown in d–i were native fluorescence.
-
Figure 9—source data 1
Mean and SEM for data points in Figure 9c, l-o.
- https://cdn.elifesciences.org/articles/93481/elife-93481-fig9-data1-v1.xlsx
Videos
Video 1
Whole-brain serial two-photon (STP) imaging and reconstruction of Unc5bCreER; Nkx2.1Flp; Ai65.
Serially reconstructed coronal images of representative dense-labeled Unc5bCreER; Nkx2.1Flp; Ai65 brain imaged by STP microscopy at 50 µm intervals. Scale bar, 500 µm.
Tables
Table 1
Brain-wide distribution pattern of putative axo-axonic cells (AACs).
| Developmental origin | Brain structure | Evolutionary term | Validation |
|---|---|---|---|
| Dorsal pallium | Neocortex all cortical areas entorhinal, perirhinal | Isocortex | Yes |
| Medial pallium | Hippocampal formation dentate, CA1, CA2, CA3 subiculum | Archicortex | Yes |
| Lateral pallium | Claustrum insular endopirifom dorsal | Not yet | |
| Ventral pallium | Amygdaloid complex
| Paleocortex | Yes |
| Septal neuroepithelium |
| Yes | |
| Hypothalamo-telencephalic prosomere h1/h2 | Hypothalamus
| Not yet |
Key resources table
| Reagent type (species) or resource | Designation | Source or reference | Identifiers | Additional information |
|---|---|---|---|---|
| Antibody | Anti-AnkryinG (mouse monoclonal) | Neuromab | Cat#: 75-146 | 1:500 |
| Antibody | Anti-ChAT (goat polyclonal) | Millipore | Cat#: AB144P | 1:300 |
| Antibody | Anti-EAAC1 (goat polyclonal) | Millipore | Cat#: AB1520 | 1:500 |
| Antibody | Anti-GABA (rabbit polyclonal) | Sigma | Cat#: A2052 | 1:500 |
| Antibody | Anti-GFP (chicken polyclonal) | Aves Labs | Cat#: 1020 | 1:1000 |
| Antibody | Anti-parvalbumin (mouse monoclonal) | Sigma | Cat#: P3088 | 1:1000 |
| Antibody | Anti-Phospho-IκBα (rabbit polyclonal) | Cell Signaling Technology | Cat#: 2859 | 1:500 |
| Antibody | Anti-RFP (rabbit polyclonal) | Rockland | Cat#: 600-401-379 | 1:1000 |
| Commercial assay or kit | HCR v3.0 | Molecular Instruments | ||
| Other | AAVDJ-TRE3g-EGFP | Vigene | Adeno-associated virus, titer: 5 × 10¹² genome copies (gc)/ml | |
| Other | AAVDJ-TRE3g-TVA-oG-EGFP | Vigene | Adeno-associated virus, titer: 9.24 × 10¹² genome copies (gc)/ml | |
| Other | G-Deleted Rabies dsRedXpress | Salk Institute | Rabies virus, titer: 5.0 × 10⁷ colony-forming units (cfu)/ml | |
| Software, algorithm | ImageJ | NIH | RRID:SCR_003070 | |
| Software, algorithm | MATLAB | Mathworks | RRID:SCR_001622 | R2017b |
| Software, algorithm | Elastix | Image Sciences Institute | RRID:SCR_009619 | |
| Strain (Mus musculus) | Ai65 | The Jackson Laboratory | RRID:IMSR_JAX:021875 | |
| Strain (M. musculus) | C57BL/6J | The Jackson Laboratory | RRID:IMSR_JAX:000664 | |
| Strain (M. musculus) | dual-SynaptotagminEGFP-2A-tdTomato | The Jackson Laboratory | RRID:IMSR_JAX:030206 | |
| Strain (M. musculus) | dual-tTA2 | The Jackson Laboratory | RRID:IMSR_JAX:036304 | |
| Strain (M. musculus) | Nkx2.1Cre | The Jackson Laboratory | RRID:IMSR_JAX:008661 | |
| Strain (M. musculus) | Nkx2.1FlpO | The Jackson Laboratory | RRID:IMSR_JAX:028577 | |
| Strain (M. musculus) | PthlhFlpO | This paper | ||
| Strain (M. musculus) | PvalbCre | The Jackson Laboratory | RRID:IMSR_JAX:017320 | |
| Strain (M. musculus) | Unc5bCreER | Dudok et al., 2021 |
Additional files
-
MDAR checklist
- https://cdn.elifesciences.org/articles/93481/elife-93481-mdarchecklist1-v1.docx
-
Supplementary file 1
List of Allen Reference Area v3 (ARAv3) brain area labels and abbreviations.
- https://cdn.elifesciences.org/articles/93481/elife-93481-supp1-v1.xlsx
Download links
A two-part list of links to download the article, or parts of the article, in various formats.
Downloads (link to download the article as PDF)
Open citations (links to open the citations from this article in various online reference manager services)
Cite this article (links to download the citations from this article in formats compatible with various reference manager tools)
Specific and comprehensive genetic targeting reveals brain-wide distribution and synaptic input patterns of GABAergic axo-axonic interneurons
eLife 13:RP93481.
https://doi.org/10.7554/eLife.93481.3


