Maturation of cortical input to dorsal raphe nucleus increases behavioral persistence in mice
- Champalimaud Research, Champalimaud Foundation, Portugal
- Nuffield Department of Clinical Neurosciences, University of Oxford, United Kingdom
Figures
Figure 1 with 2 supplements
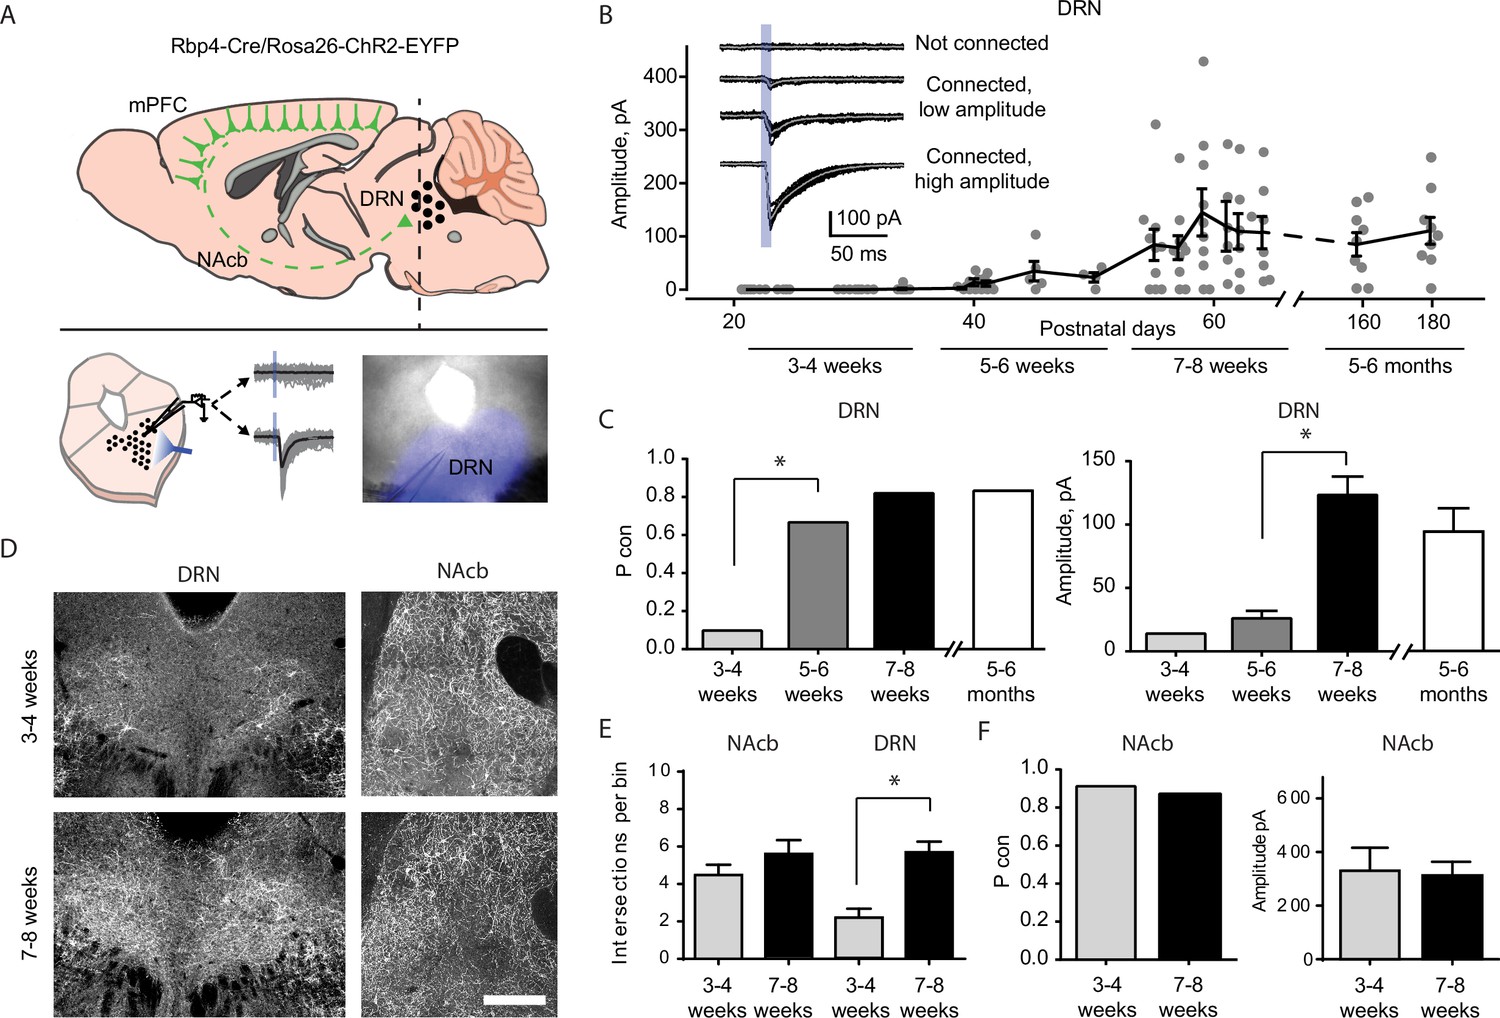
Top–down cortico-raphe connections develop over adolescence in mice.
(A) Schematic representation of a sagittal view of an Rbp4-ChR2 mouse brain illustrating top–down cortico-raphe afferents. Coronal slices containing the dorsal raphe nucleus (DRN) were obtained ex vivo, and whole-cell recordings of DRN neurons were performed to assess cortical connectivity upon light stimulation. (B) Optogenetically-evoked excitatory postsynaptic currents (EPSCs) were recorded in DRN neurons contacted by ChR2-expressing cortical axons (122 neurons, 20 Rbp4-ChR2 mice). The current amplitude of cortico-raphe connections is plotted as a function of postnatal age in mice. (C) Pooled connection probability (connected cells/ total cells) and averaged connection amplitude of cortico-DRN afferents at four different developmental points: early juvenile (3–4 weeks), late juvenile (5–6 weeks), early adult (7–8 weeks), and late adult (5–6 months). (D) Example images illustrate an increased cortico-DRN innervation in adult mice compared to juveniles, while the cortico-accumbens innervation remains constant over the same time period. Scale bar = 400 µm. (E) Number of axonal intersections quantified in the DRN and nucleus accumbens of juvenile and adult mice. (F) Pooled connection probability and averaged connection amplitude of cortico-accumbens afferents in early juvenile and early adult mice. *p < 0.05.
-
Figure 1—source data 1
Electrophygiological recordings and axonal quantification.
- https://cdn.elifesciences.org/articles/93485/elife-93485-fig1-data1-v2.xlsx
Figure 1—figure supplement 1
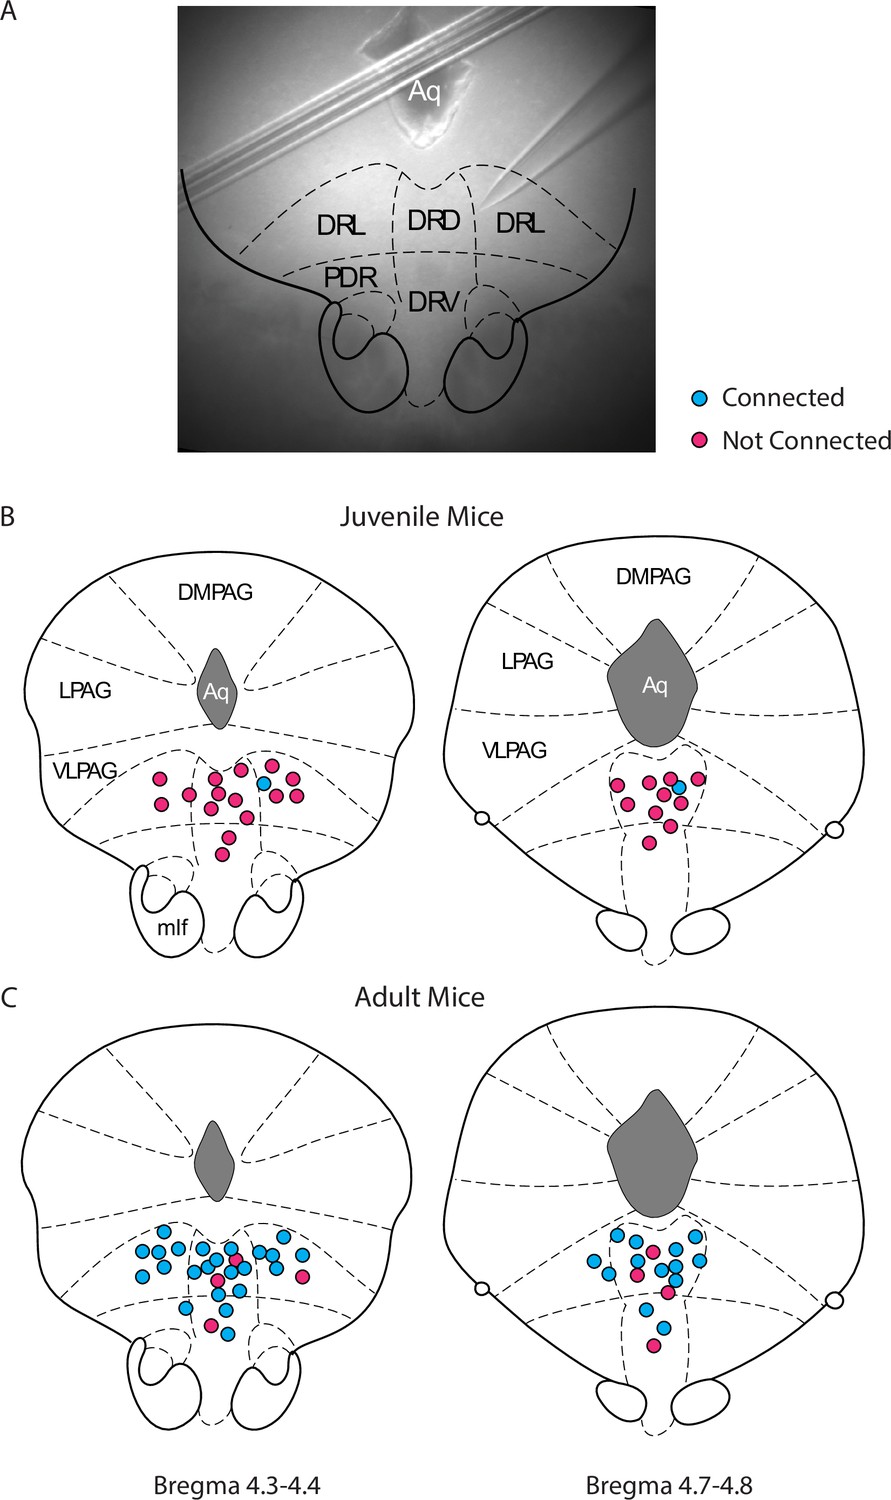
Changes in cortico-raphe connectivity over development are not explained by changes in the location of the recorded dorsal raphe nucleus (DRN) neurons.
(A) Example low magnification picture taken of a recorded DRN neuron and overlaid atlas inset used to determine its location. (B, C) Summary of the spatial location and connectivity of the recorded DRN neurons in juvenile (anterior DRN connected/non-connected = 1/15, posterior DRN connected/non-connected = 1/10) and adult (anterior DRN connected/non-connected = 23/4, posterior DRN connected/non-connected = 13/4) mice.
-
Figure 1—figure supplement 1—source data 1
Electrophysiological properties of DRN neurons and optogenetic controls.
- https://cdn.elifesciences.org/articles/93485/elife-93485-fig1-figsupp1-data1-v2.xlsx
Figure 1—figure supplement 2
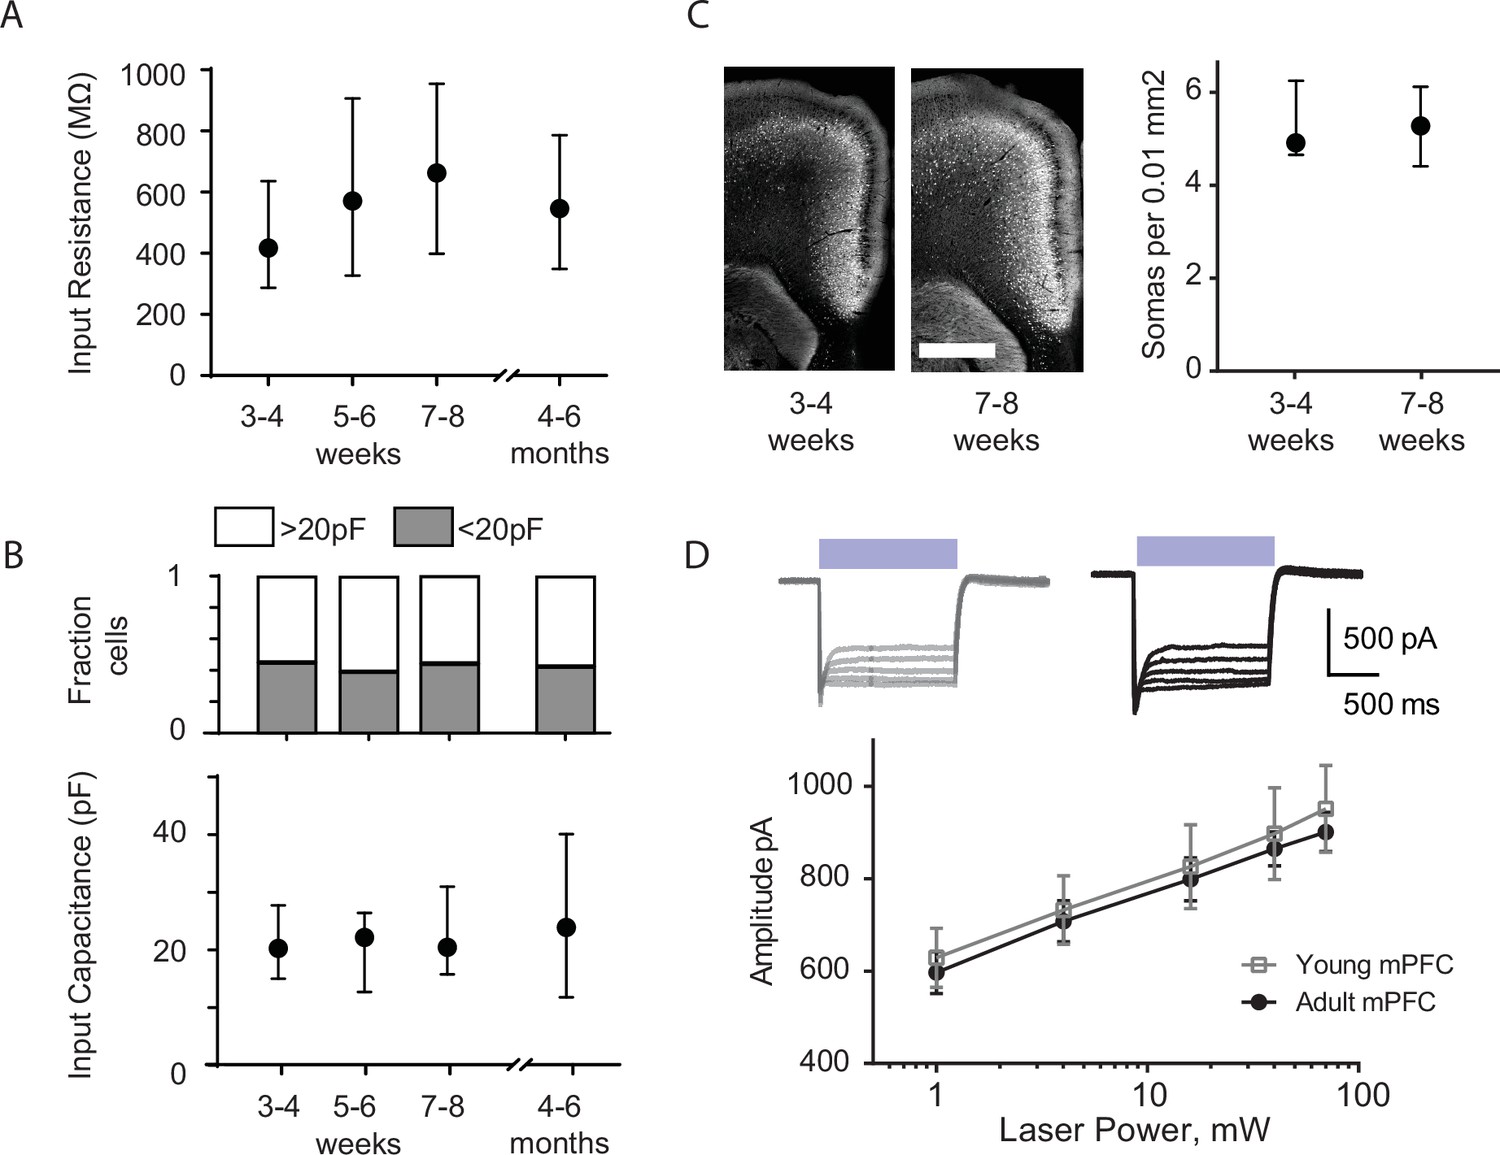
Changes in cortico-raphe connectivity over development are not explained by changes in membrane properties of dorsal raphe nucleus (DRN) neurons or by differential ChR2 expression of ChR2 under the Rbp4 promoter over time.
(A) The input resistance of DRN neurons is comparable over time. (B) The fraction of putative 5-hydroxytryptamine (5-HT) neurons (capacitance >20 pF) and non-5-HT neurons (capacitance <20 pF) (Soiza-Reilly et al., 2019) recorded is comparable across developmental stages fraction of neurons with capacitance >20 pF: 3–4 weeks = 0.53, 5–6 weeks = 0.62, 7–8 weeks = 0.54, 5–6 months = 0.6. Chi-square test χ2 (3, N = 122 neurons) = 0.59, p = 0.89. In addition, no overall changes in input capacitance were observed in DRN neurons across development. (C) The density of fluorescent medial prefrontal cortex (mPFC) layer 5 neurons is comparable in juvenile and adult Rbp4-tdTomato mice. (D) The evoked photocurrent in mPFC layer 5 neurons of juvenile and adult Rbp4-ChR2 mice is virtually identical across a wide range of stimulation intensities. Error bars in (A–C) represent median and 95% CI. Error bars in D represent mean ± standard error of the mean (SEM. Scale bar in C = 800 µm).
Figure 2 with 1 supplement
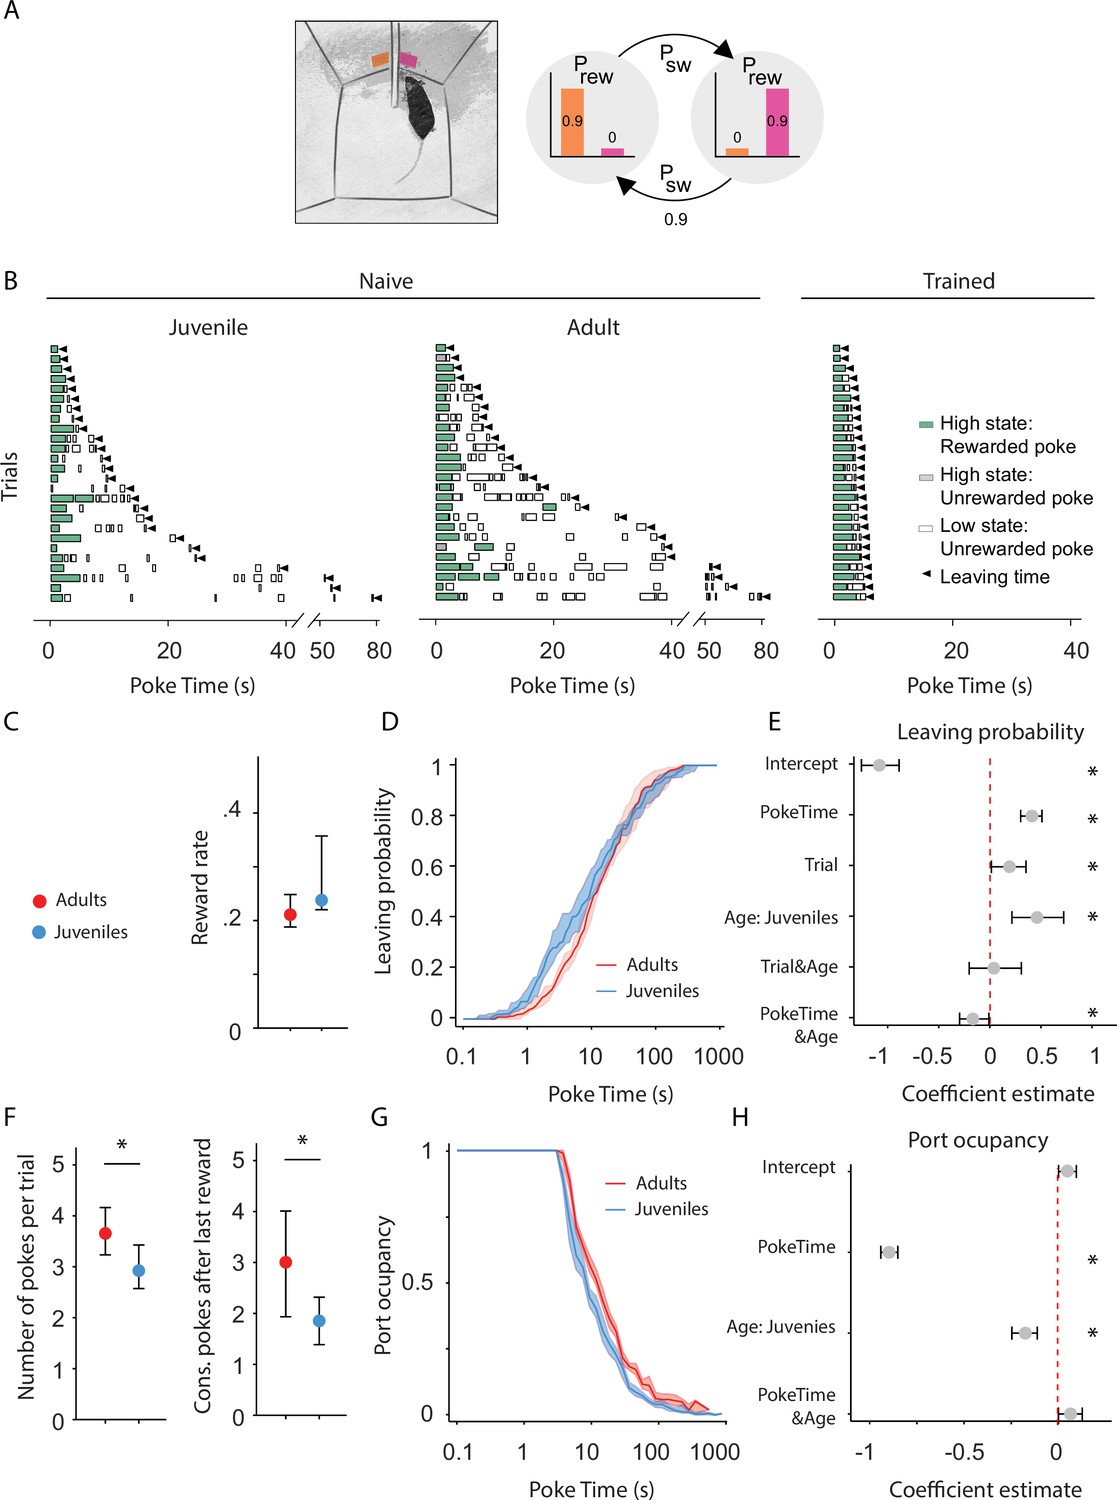
Adult mice persist longer than juveniles in exploiting a foraging patch.
(A) Illustration of the rodent foraging task. Water-deprived mice seek rewards by probing two nose-ports. (B) Randomly selected examples of poking behavior throughout a naive juvenile, naive adult, and trained adult behavioral session sorted by trial length. Pokes in the active state can be rewarded (in green) or not (in gray). Pokes in the inactive state are never rewarded (in white). After the state switches, the mice have to travel to the other side (left or right port, L annd R) to obtain more water. Leaving time is illustrated with black triangles. (C) Median ± 95% confidence interval (CI) of the reward rate per second for juvenile and adult mice. (D) Cumulative distribution of the probability of leaving (median ± 95% CI across mice) as time elapses from the first poke in a trial for adults and juvenile animals. (E) Regression coefficients ± 95% CI resulting from a parametric bootstrap (n = 1000) of a mixed models logistic regression to explain the probability of leaving. * indicates predictors with a significant impact on the probability of leaving. (F) Median ± 95% CI of the number of pokes per trial (left) and the consecutive pokes after the last reward (right). Juvenile mice do a significantly lower amount of pokes per trial and pokes after the last reward compared to adult mice. (G) Port occupancy as a function of trial time elapsed for juveniles and adults. (H) Regression coefficients ± 95% CI resulting from a parametric bootstrap (n = 1000) of a mixed models logistic regression to explain the port occupancy, as in E. All analyses in C–H computed by pooling the data from all sessions of juvenile (N = 21) or adult (N = 23) mice, yielding a total of 2875 trials (juveniles = 1347, adults = 1528) and 9596 pokes (juveniles = 3908, adults = 5688).
-
Figure 2—source data 1
Foraging task behavior over development.
- https://cdn.elifesciences.org/articles/93485/elife-93485-fig2-data1-v2.xlsx
Figure 2—figure supplement 1
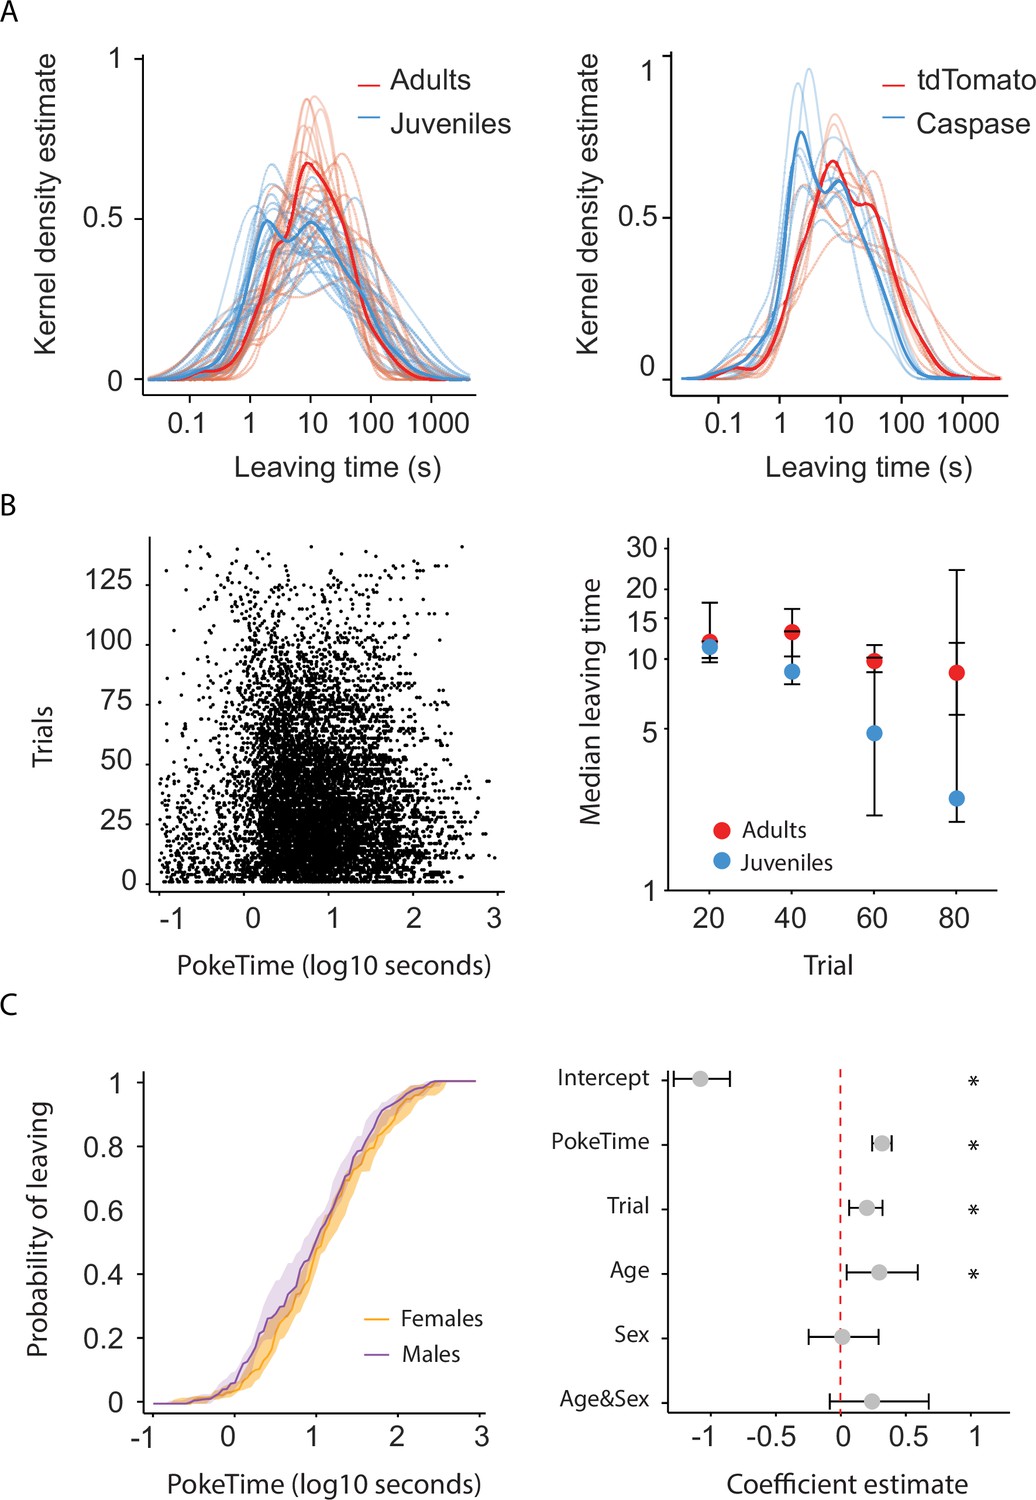
Description of mouse nose foraging behavior over the session progression and according to sex.
(A) Distribution of the trial durations for naive juveniles and naive adults (left) and for Caspase and tdTomato control mice (right). Note that the bimodality of the data visibly arises at the single mouse level, indicating each mouse performs short and long leaving times. Consistently, when using Fisher’s exact test to evaluate the null hypothesis that the likelihood of individual mice displaying long leaving times (obtained using k = 2 K-means based categorization) is equivalent to the remainder of their respective groups, 57/59 mice were unable to reject the null hypothesis (data not shown). (B) Left, Individual poke durations for all juvenile and adult mice. Right, Leaving time (median ± 95% confidence interval [CI] across mice) as a function of elapsed trials in a session. (C) Left, Cumulative distribution of the probability of leaving as a function of trial time elapsed (median ± 95% CI across mice) for female and male mice. Right, Regression coefficients ± 95% CI resulting from a parametric bootstrap (n = 1000) of a mixed models logistic regression to explain the probability of leaving. Note the lack of explanatory power for the group variable sex. * indicates predictors with a significant impact on the probability of leaving.
-
Figure 2—figure supplement 1—source data 1
Behavioral controls across experiments.
- https://cdn.elifesciences.org/articles/93485/elife-93485-fig2-figsupp1-data1-v2.xlsx
Figure 3 with 3 supplements
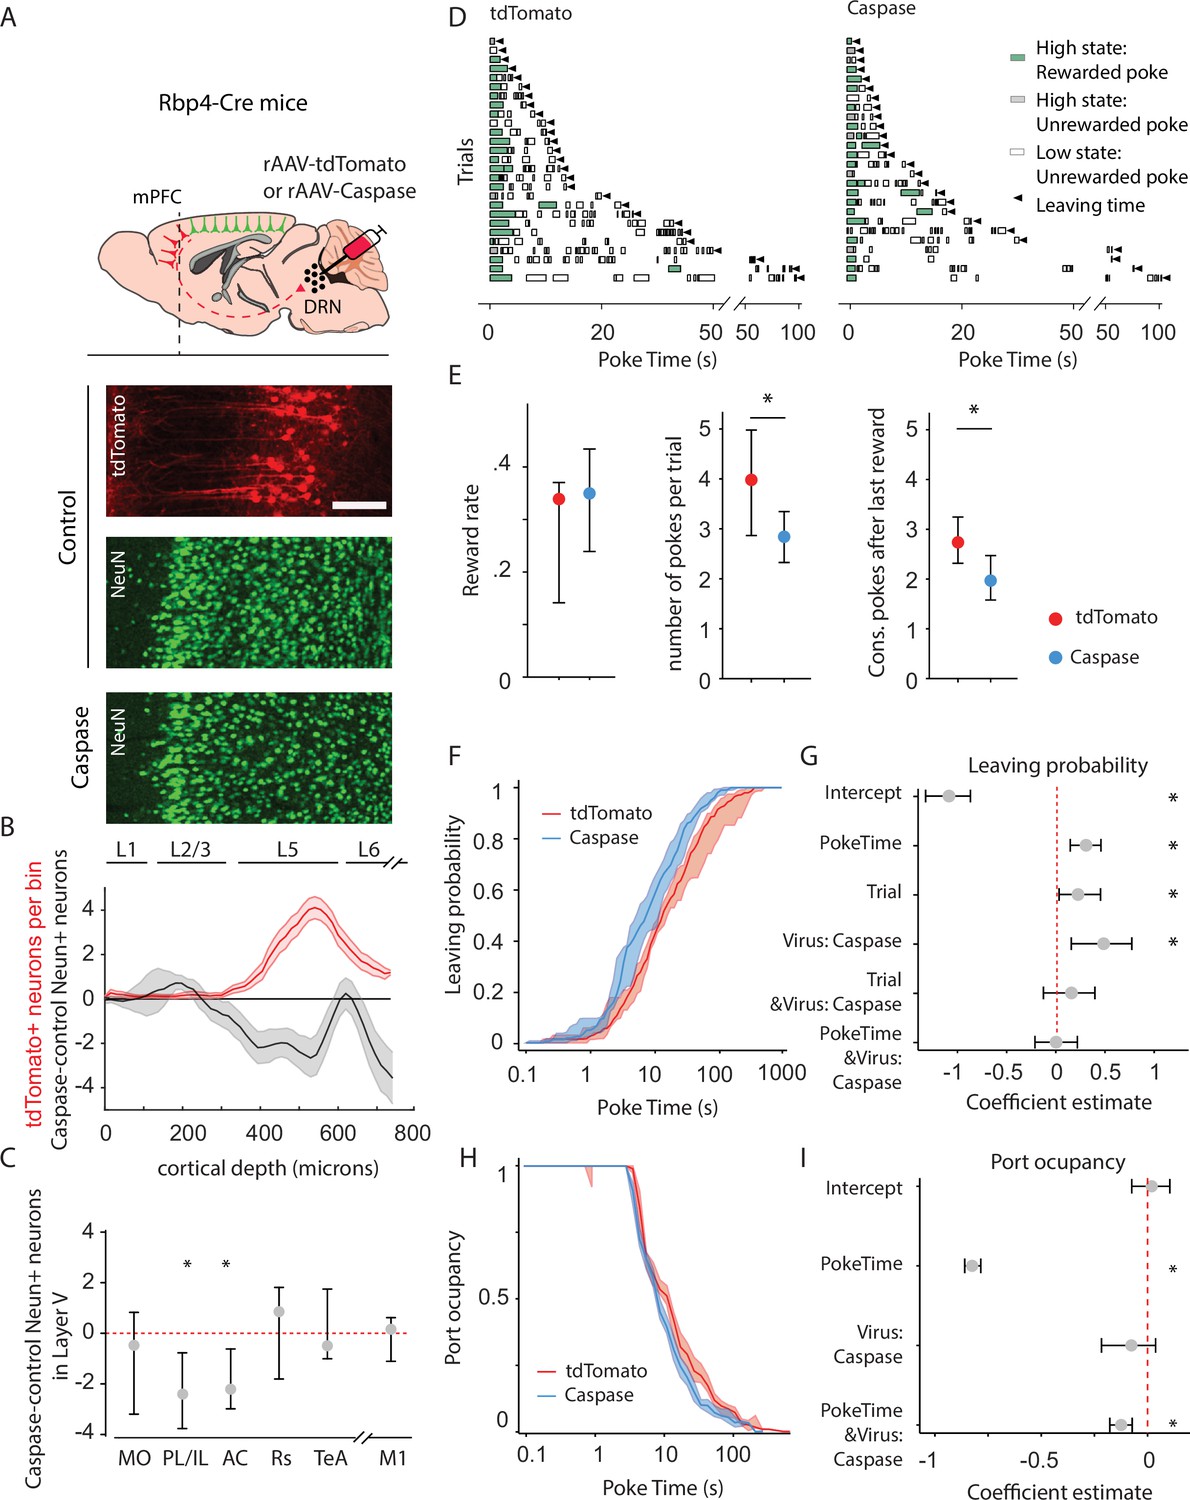
Animals lacking cortico-raphe projections show less behavioral persistence in exploiting a foraging patch.
(A) Schematic representation of the ablation strategy used for behavioral assessment. Retrogradely transporting AAV vectors expressing either the fluorescent reporter tdTomato (rAAV-tdTomato) or the intrinsically active apoptosis triggering Caspase3 (rAAV-Caspase, Caspase group were locally delivered in the dorsal raphe nucleus (DRN) of Rbp4-Cre mice). In the cortical areas containing tdTomato expressing neurons in control animals (in example picture, PL/IL cortex) the density of neurons was quantified with an immunohistochemistry protocol against the pan-neuronal marker NeuN and compared to the neuronal densities obtained in the same cortical areas of ablated mice (scale bar = 200 microns). (B) Distribution of the neuronal density difference between ablated mice and the mean density of control mice per cortical depth bin in the PL/IL cortex (black shaded error plot). The neuronal density loss observed in ablated mice when compared to control NeuN densities matches the cortical depth in which tdTomato neurons are located (red shaded area). Shaded error plots represent mean ± standard error of the mean (SEM). (C) Summary of caspase-control NeuN density per brain area (MO: median = −0.46, 95% confidence interval [CI] = [−2.81, 1.06], PL/IL: median = −2.3, 95% CI = [−4.01, −1.44], AC: median = −2.26, 95% CI = [−3.59, −0.17], Rs: median = 0.75, 95% CI = [−1.80, 1.81], TeA: median = –0.63, 95% CI = [−1.01, 1.76], and M1: median = 0.14, 95% CI = [−1.81, 0.73]). * indicates p<0.05. (D) Randomly selected examples of poking behavior for a tdTomato and caspase behavioral session sorted by trial length. Pokes in the active state can be rewarded (in green) or not (in gray). Pokes in the inactive state are never rewarded (in white). Leaving time is illustrated with black triangles. (E) Median ± 95% CI fraction of the reward rate per second (left), pokes per trial (middle) and the consecutive pokes after the last reward (right). Caspase mice obtain a comparable number of rewards per trial but do a significantly lower amount of pokes per trial and pokes after the last reward compared to control tdTomato mice. * indicates p<0.05. (F) Cumulative distribution of the probability of leaving as a function of trial time elapsed (median ± 95% CI across mice) for tdTomato and Caspase animals. (G) Regression coefficients ± 95% CI resulting from a parametric bootstrap (n = 1000) of a mixed models logistic regression to explain the probability of leaving. * indicates predictors with a significant impact on the probability of leaving. (H) Port occupancy as a function of trial time elapsed for tdTomato and Caspase. (I) Regression coefficients ± 95% CI resulting from a parametric bootstrap (n = 1000) of a mixed models logistic regression to explain the port occupancy. All analyses in B–G computed by pooling the data from the histology and the first session of Caspase (N = 7) or tdTomato (N = 8) mice, yielding a total of 1464 trials (Caspase = 939, tdTomato = 525) and 4742 pokes (Caspase = 2555, tdTomato = 2187).
-
Figure 3—source data 1
Cell loss and behavioral quantification in caspase and control mice.
- https://cdn.elifesciences.org/articles/93485/elife-93485-fig3-data1-v2.xlsx
Figure 3—figure supplement 1
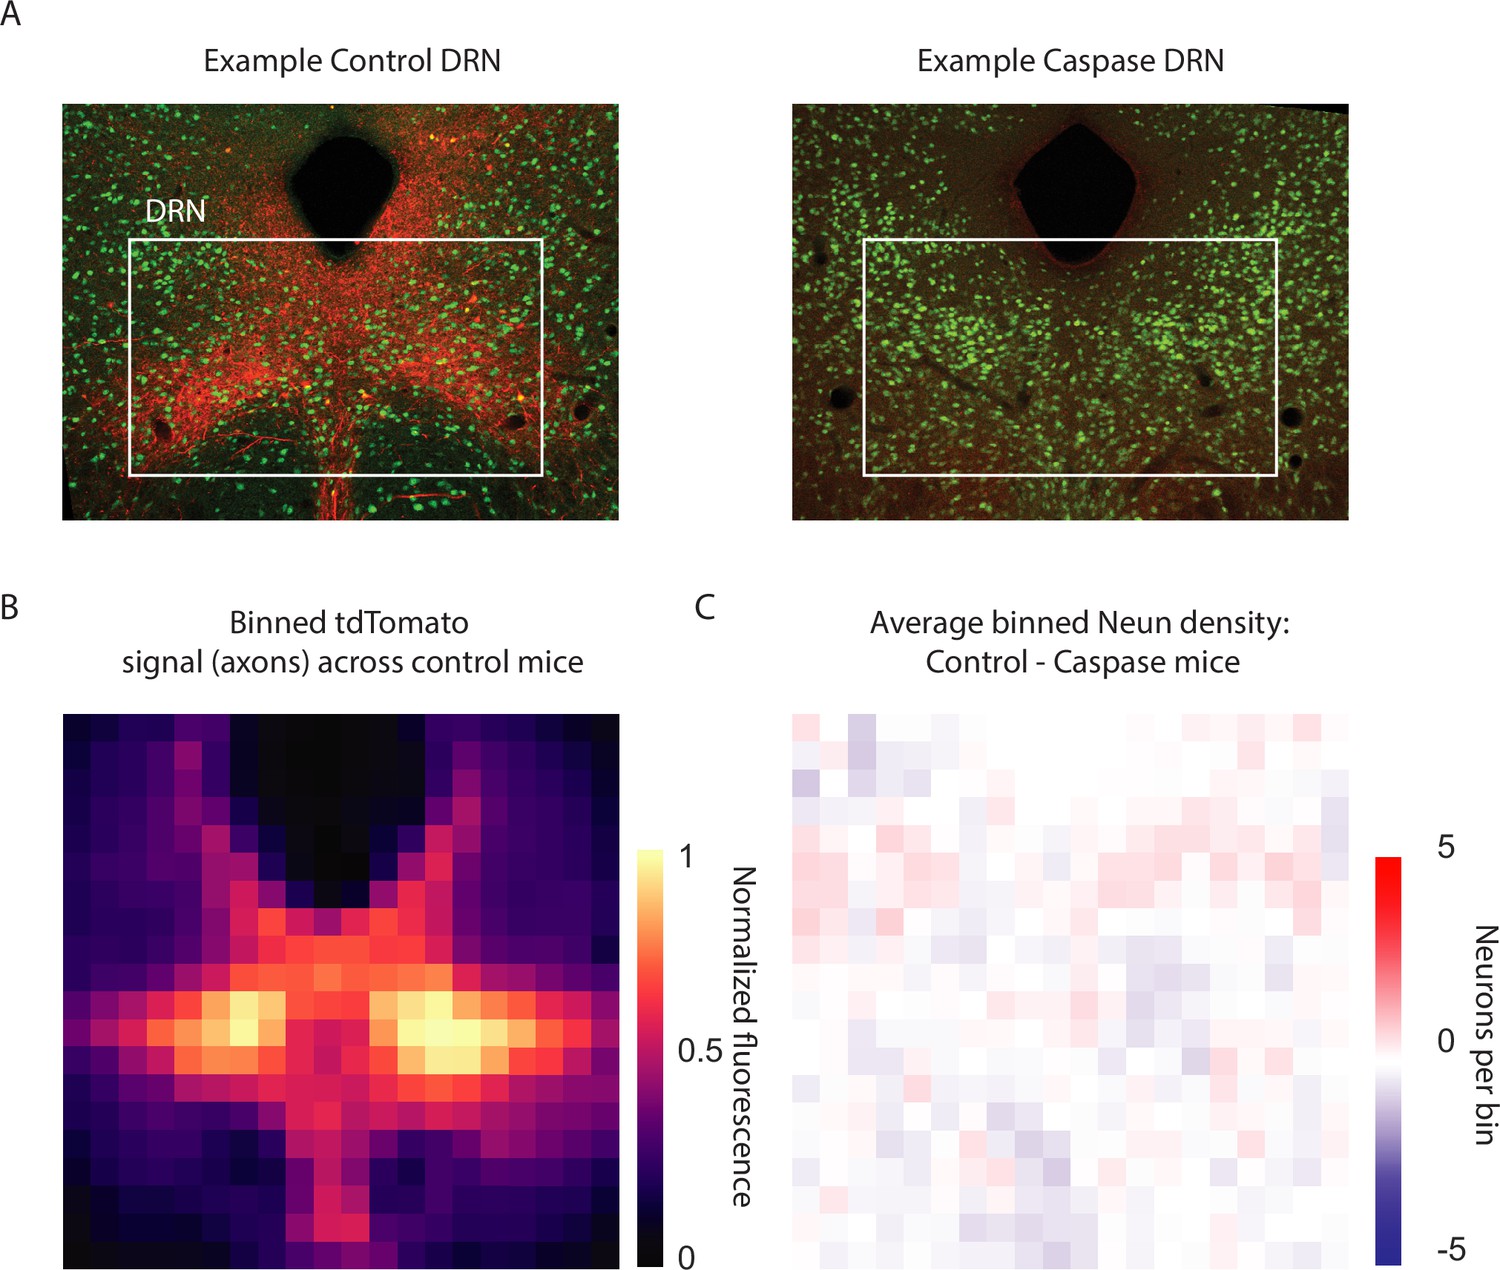
Viral injections in the dorsal raphe nucleus (DRN) provide localized cortico-DRN axonal feedback and do not affect neuronal density.
(A) Example confocal images containing the DRN and adjacent structures for a control tdTomato and a Caspase injection (left and right, respectively) in which the native fluorescence of tdTomato (red) and the immunohistochemical detection of a pan-neuronal marker (NeuN, in green) can be observed. Same magnification as Figure 1 (B) Binned fluorescent tdTomato signal from feedback cortical axons, normalized to peak intensity and averaged across control mice reveal distinctively high intensity levels in the DRN, which is consistent with the viral targeting of cortico-raphe projections and supports the specificity of the injection site. (C) Control tdTomato and Caspase-injected mice present a comparable local density of neurons in the DRN (injection site), as revealed by neuronal density difference between groups close to zero throughout the DRN. This indicates that the injection of a Cre-dependent rAAV Caspase virus did not produce local neuronal loss in the DRN of Rbp4-Cre mice.
-
Figure 3—figure supplement 1—source data 1
NeuN and tdTomato density in the DRN.
- https://cdn.elifesciences.org/articles/93485/elife-93485-fig3-figsupp1-data1-v2.xlsx
Figure 3—figure supplement 2
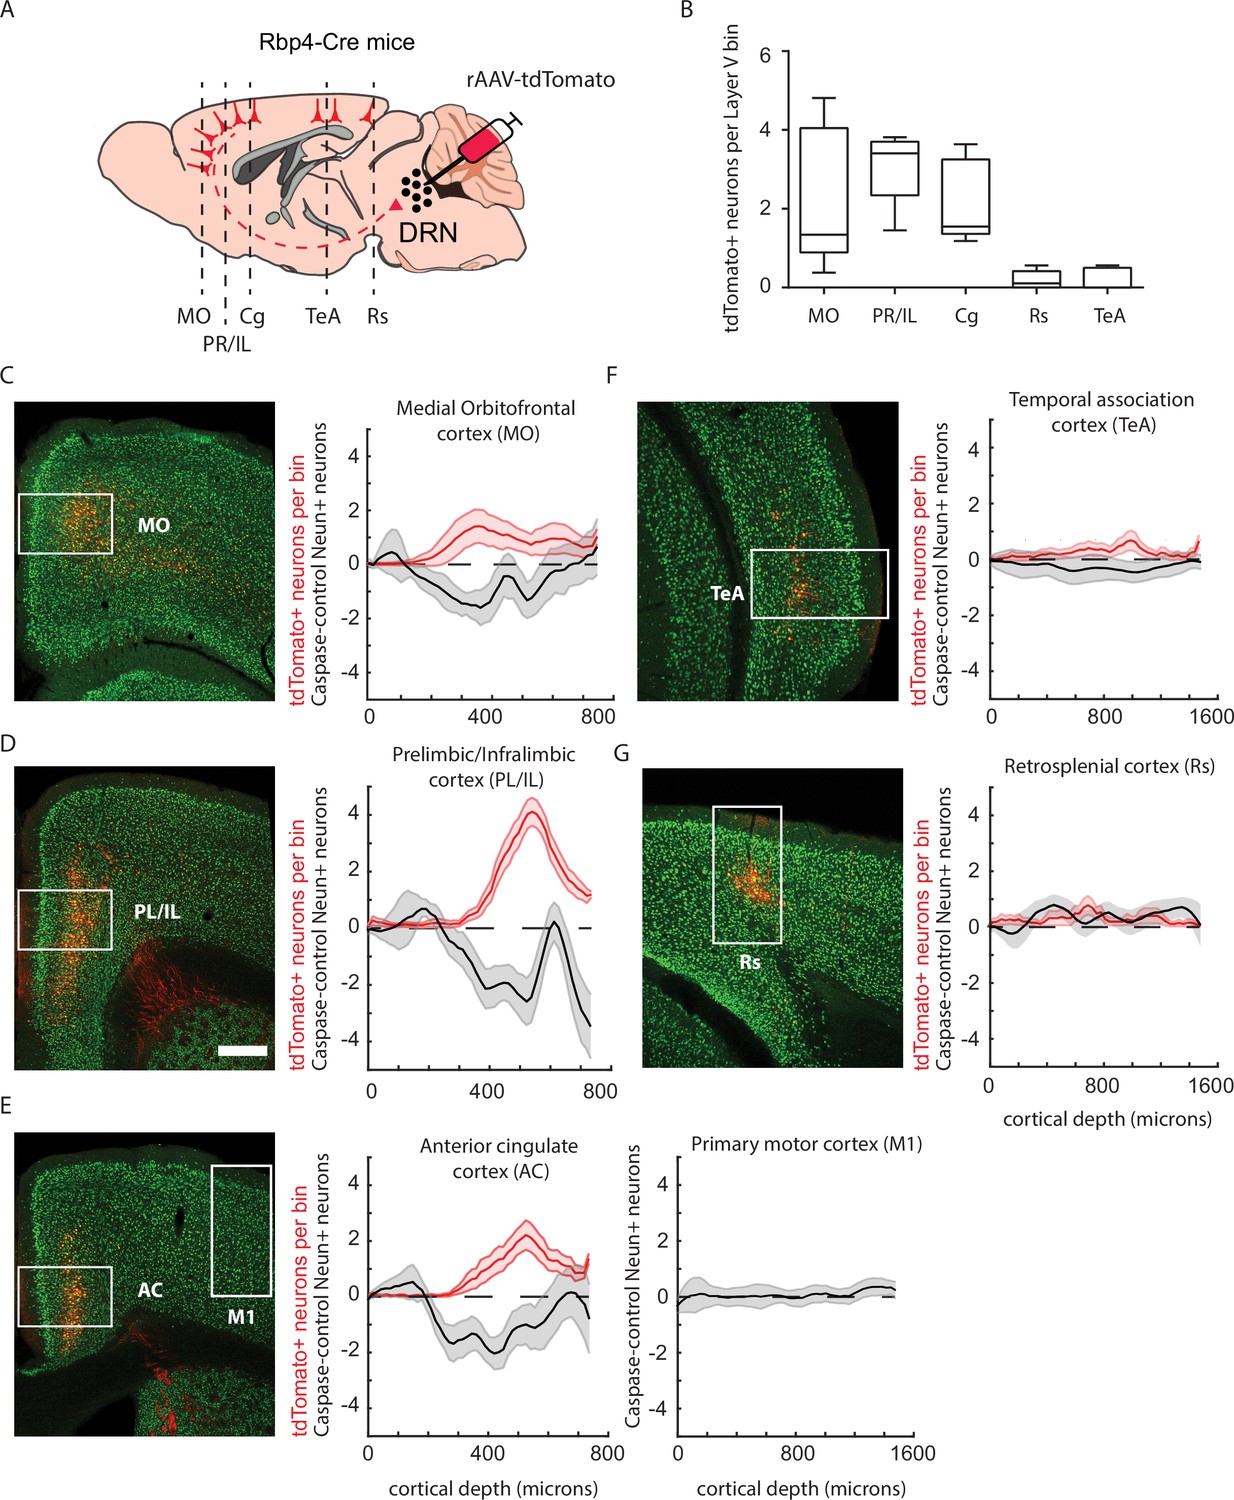
Labeling of Rbp4-expressing dorsal raphe nucleus (DRN)-projecting neurons with rAAV-tdTomato is consistent with cell density loss in mice injected with rAAV-Caspase3.
(A) Schematic representation of rAAV-tdTomato-dependent labeling of cortico-DRN-projecting neurons in Rbp4-Cre mice. (B) Quantification of layer 5 tdTomato labeled somas across the different DRN-projecting cortical areas (n = 8 mice). (C–E) Example picture of the immunolabeling obtained with the pan-neuronal marker NeuN and the virally expressed tdTomato reporter together with the quantification across cortical depth of tdTomato cell density and neuronal loss (NeuN density in rAAV-Caspase3-injected mice − average NeuN density of control mice, n = 7 caspase mice) for the medial orbitofrontal cortex (C, Control vs. Caspase two-sample Kolmogorov–Smirnoff test, D = 0.017, p = 0.08), prelimbic/infralimbic cortex (D, D = 0.028, p = 0.002), cingulate cortex and motor primary cortex (E, D = 0.024, p = 0.01 and D = 0.019, p = 0.15, respectively), temporal association cortex (F, D = 0.025, p = 0.19) and retrosplenial cortex (G, D = 0.034, p = 0.12). Box plots represent median, IQR, and min/max data range. Shaded error plots represent mean ± standard error of the mean (SEM). Scale bar = 400 µm.
-
Figure 3—figure supplement 2—source data 1
NeuN and tdTomato densities across cortical areas.
- https://cdn.elifesciences.org/articles/93485/elife-93485-fig3-figsupp2-data1-v2.xlsx
Figure 3—figure supplement 3
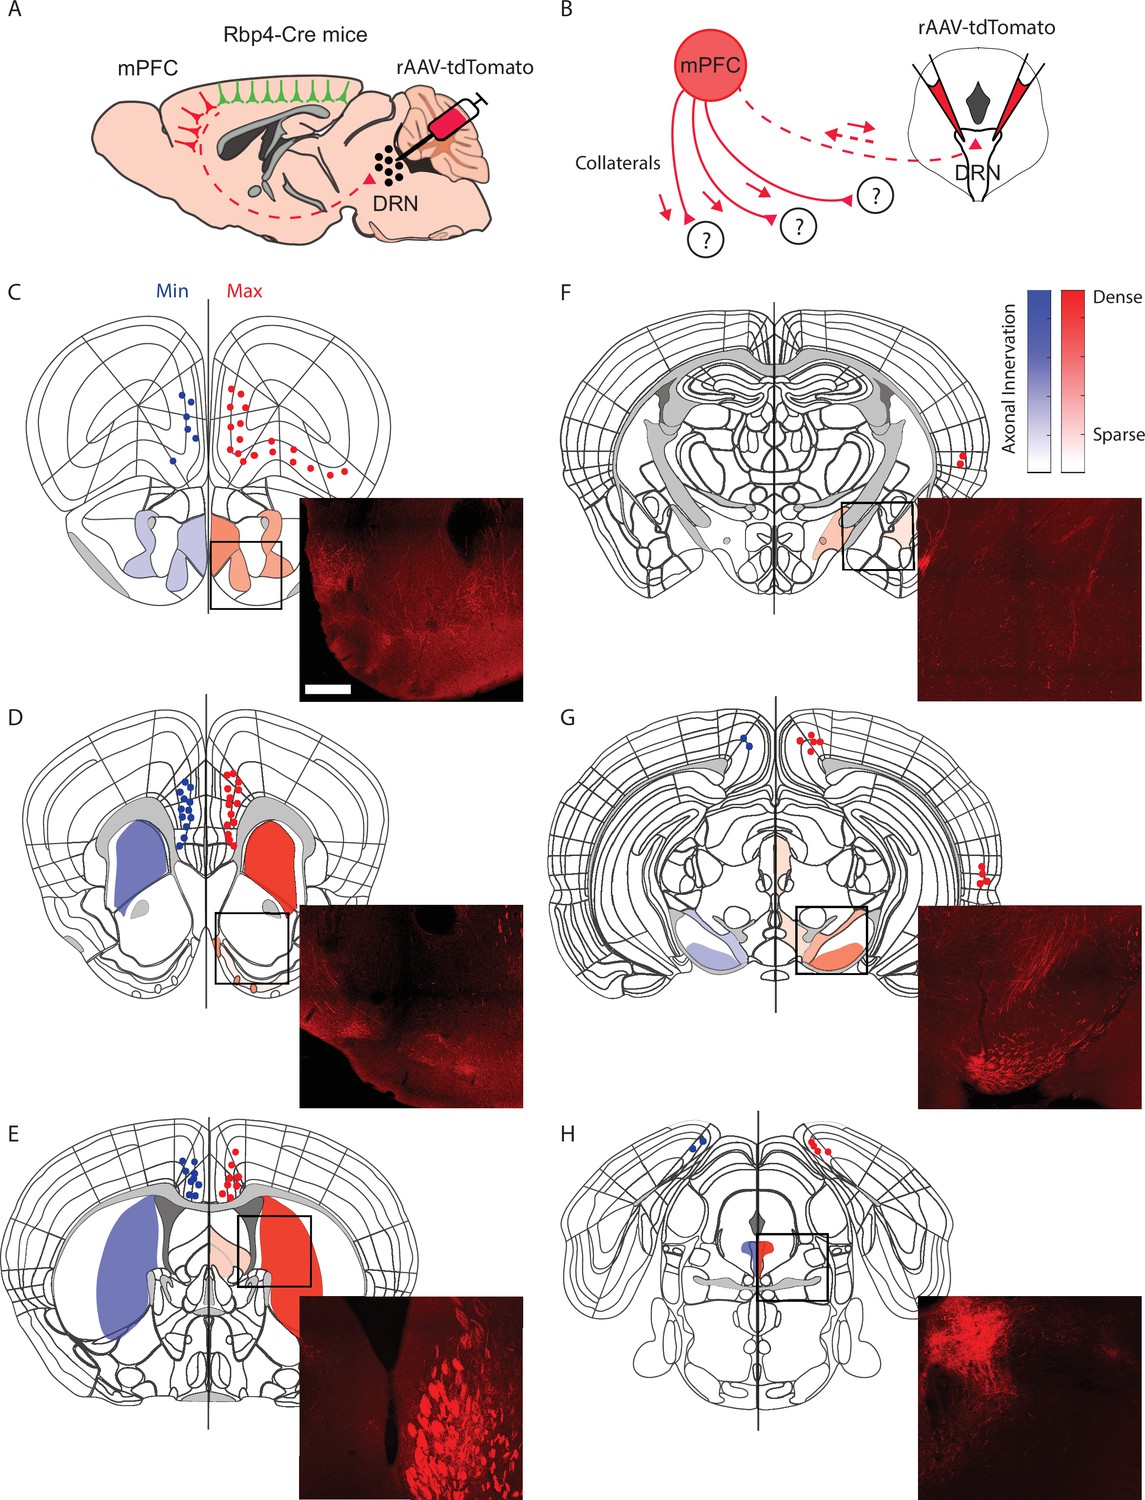
Dorsal raphe projecting cortical neurons have dense collateral projections to the striatum.
(A) Schematic representation of rAAV-tdTomato-dependent labeling of cortico-dorsal raphe nucleus (DRN)-projecting neurons in Rbp4-Cre mice. (B) Schematic representation of axon collaterals from the same cortical subpopulation of neurons retrogradely labeled at the DRN. (C–H) Semiquantitative representation of axon collateral innervation density across the anteroposterior levels of the mouse brain presenting the injections with the highest (red) and lowest (blue) density of retrogradely labeled neurons. Scale bar = 500 µm.
Author response image 1
Author response image 2
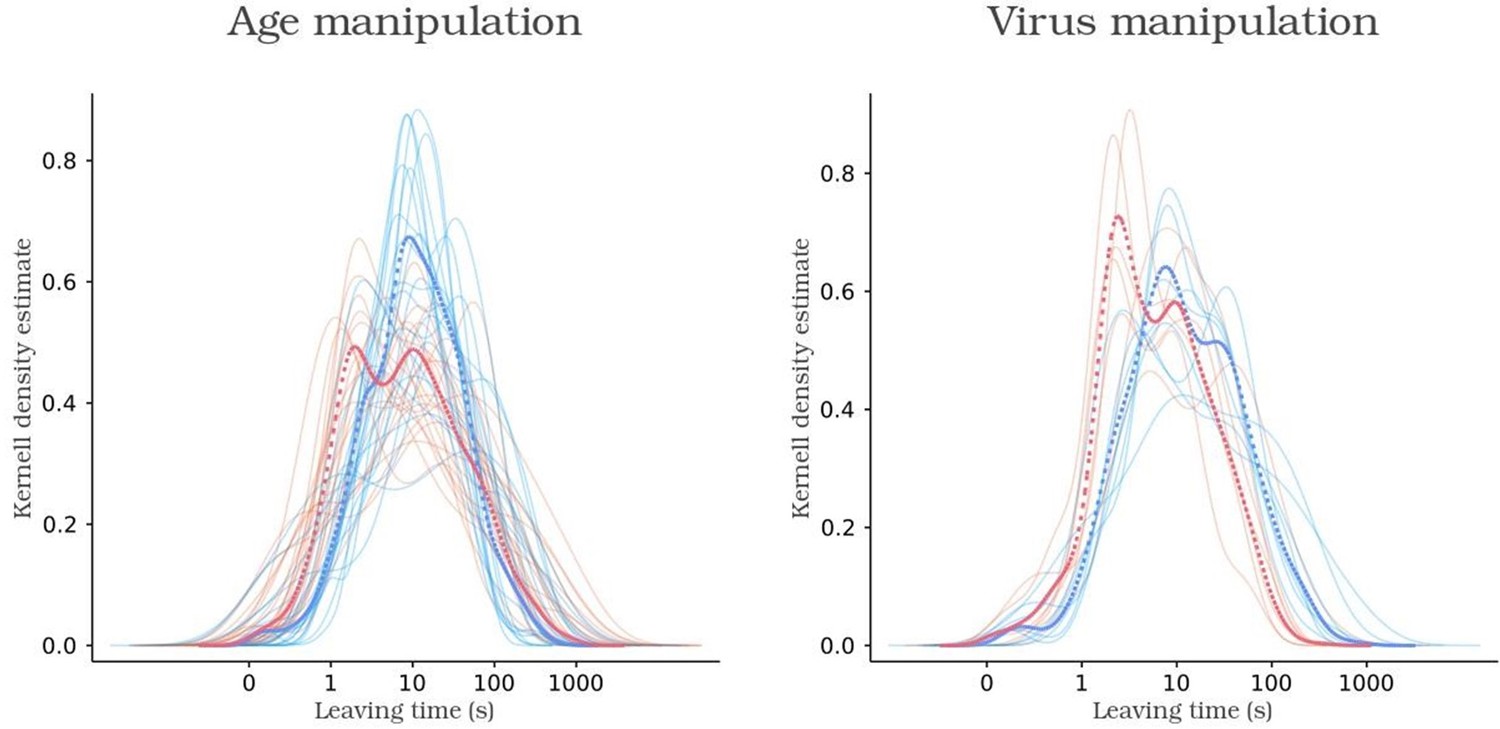
Kernel density function of leaving times of control animals, in blue, and experimental animals, in red.
Solid and dashed lines indicate animal and group functions, respectively.
Author response image 3
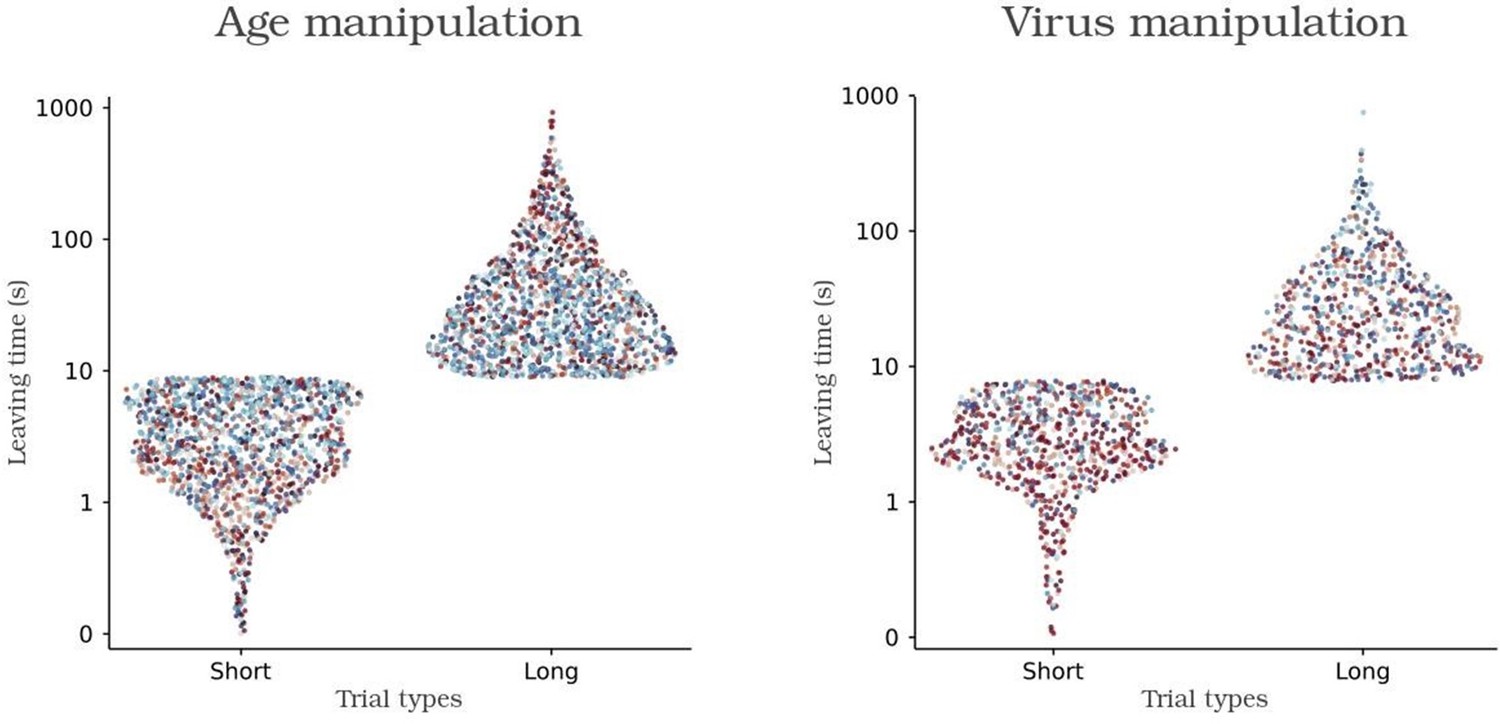
K-means based categorization of each trial in short and long leaving times.
Individual control and experimental animals are colored with shades of blue and red respectively.
Author response image 4
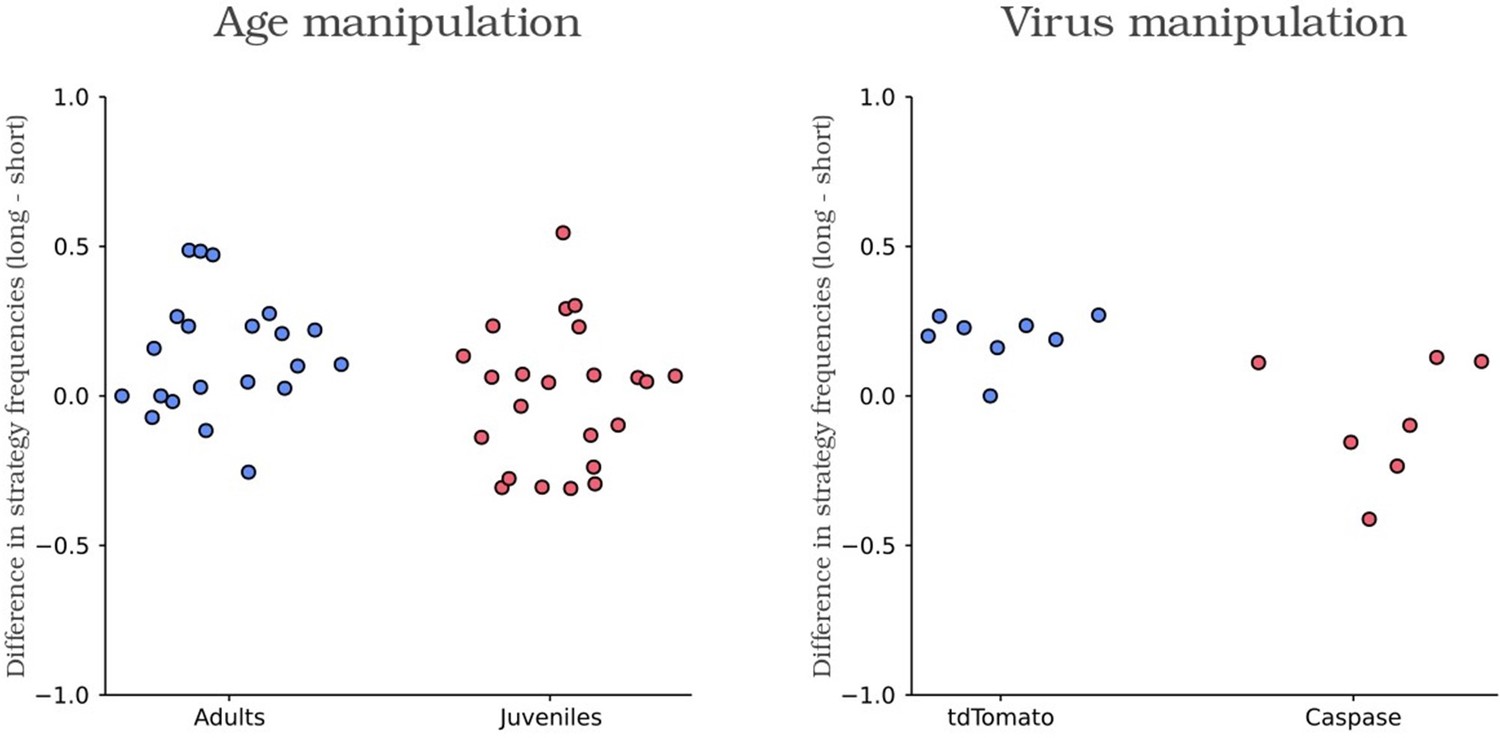
Scatter plot of the difference in the frequency use of short and long leaving time for each animal.
Control and experimental animals are colored in blue and red respectively.
Author response image 5

Additional files
Download links
A two-part list of links to download the article, or parts of the article, in various formats.
Downloads (link to download the article as PDF)
Open citations (links to open the citations from this article in various online reference manager services)
Cite this article (links to download the citations from this article in formats compatible with various reference manager tools)
Maturation of cortical input to dorsal raphe nucleus increases behavioral persistence in mice
eLife 13:e93485.
https://doi.org/10.7554/eLife.93485


